Downloaded 139 times


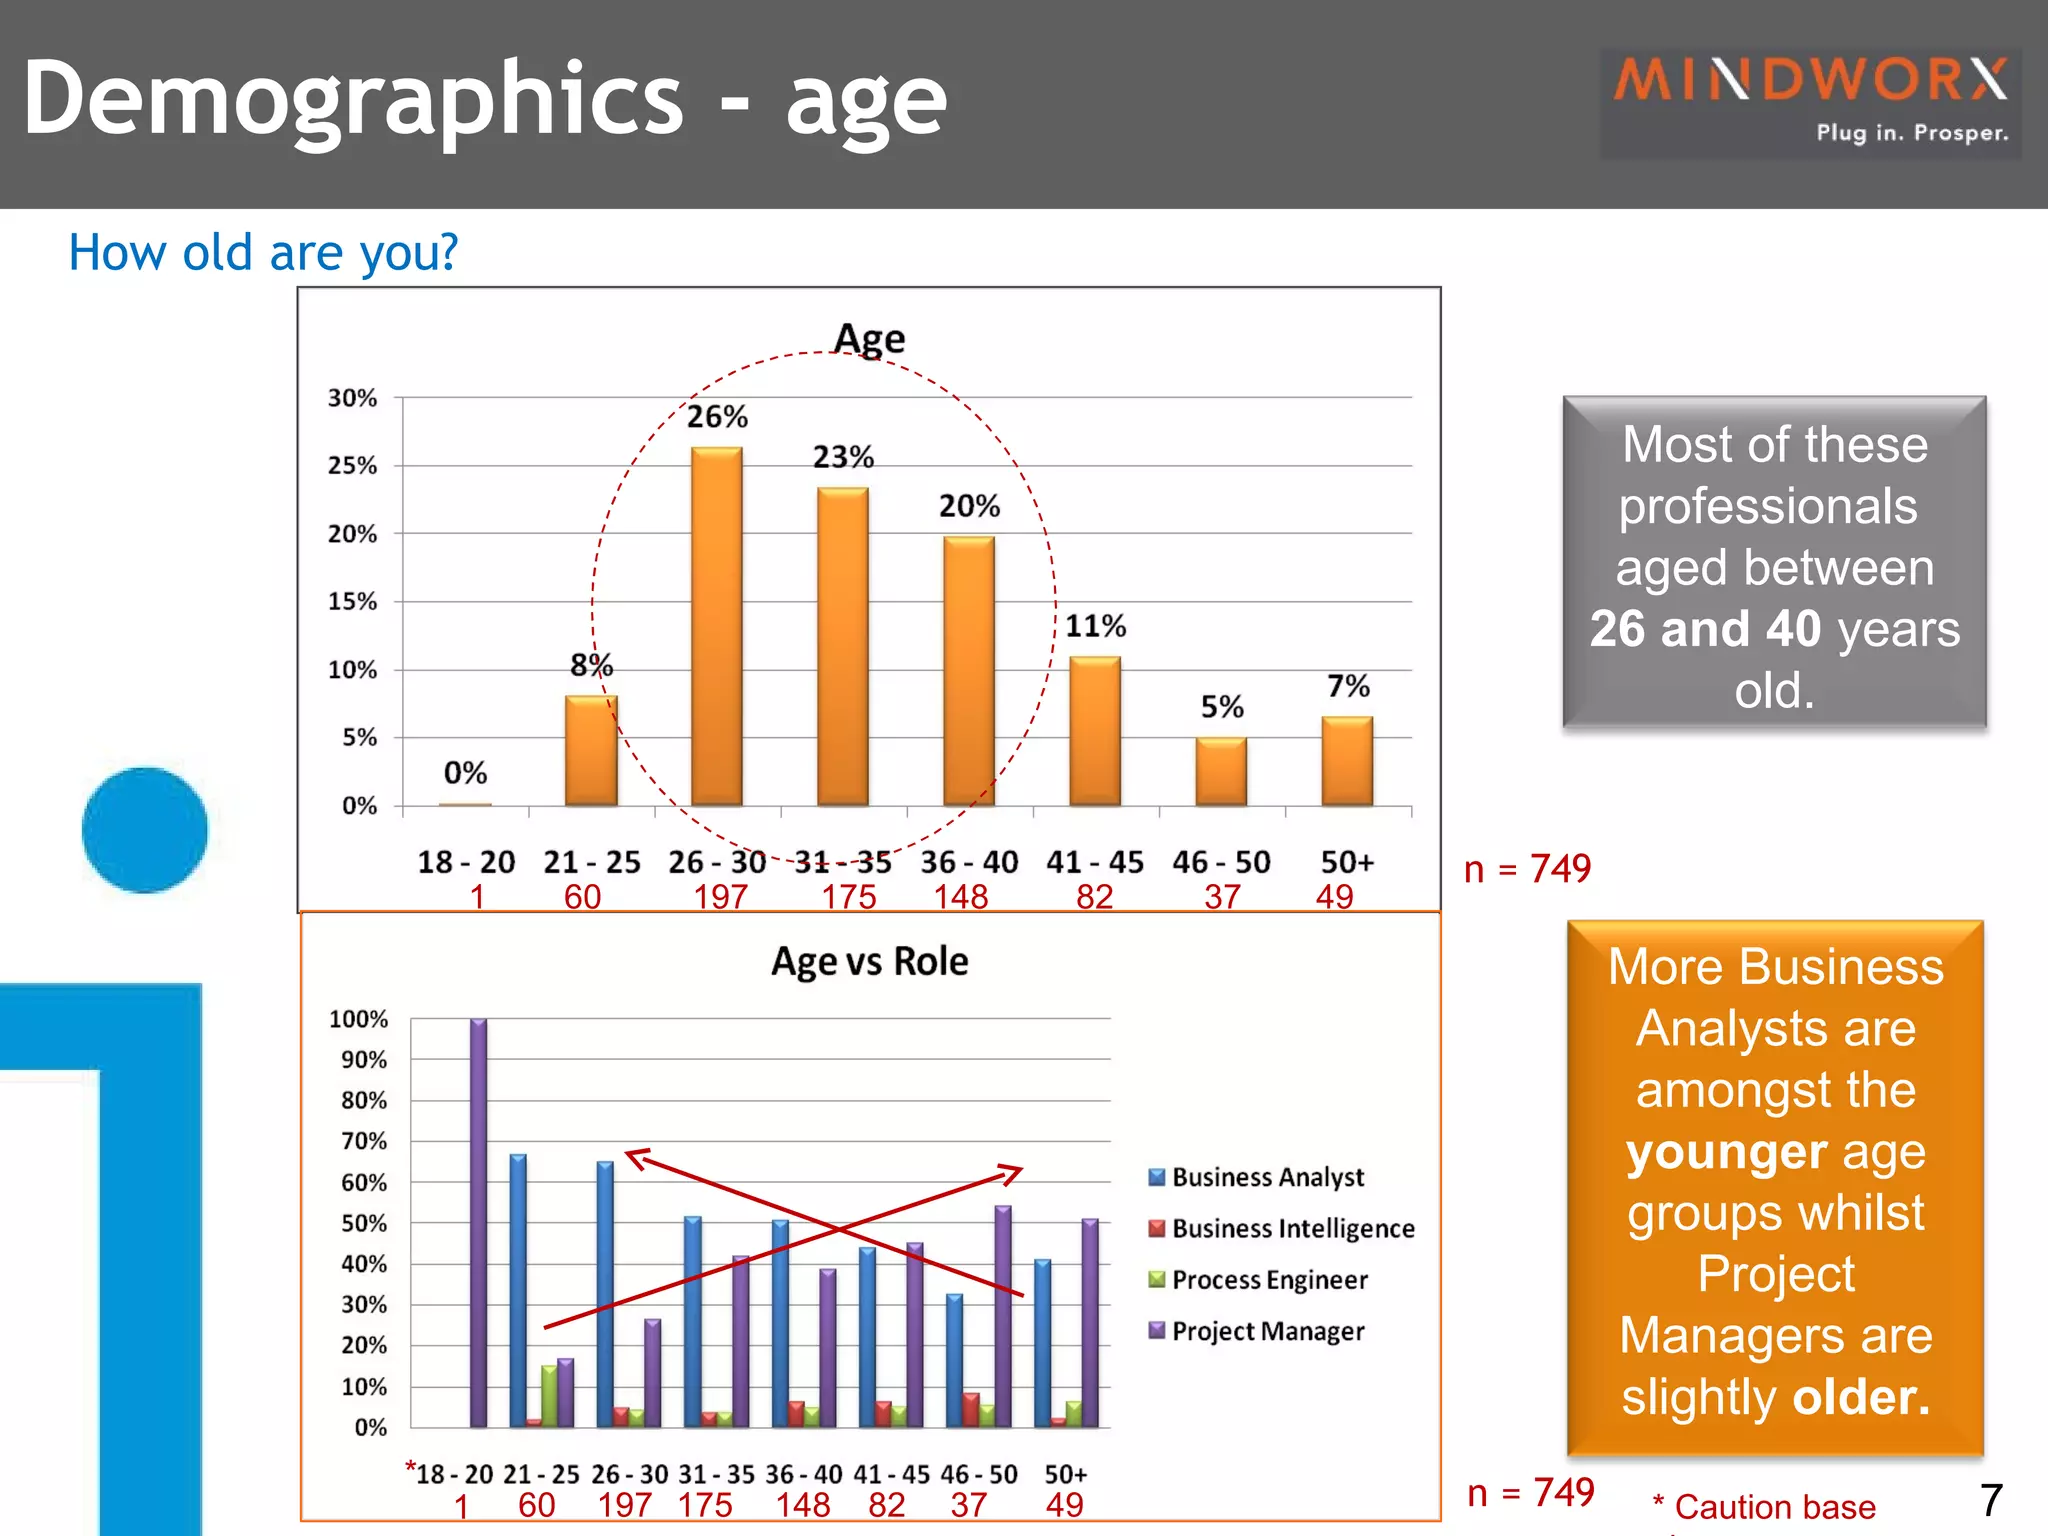

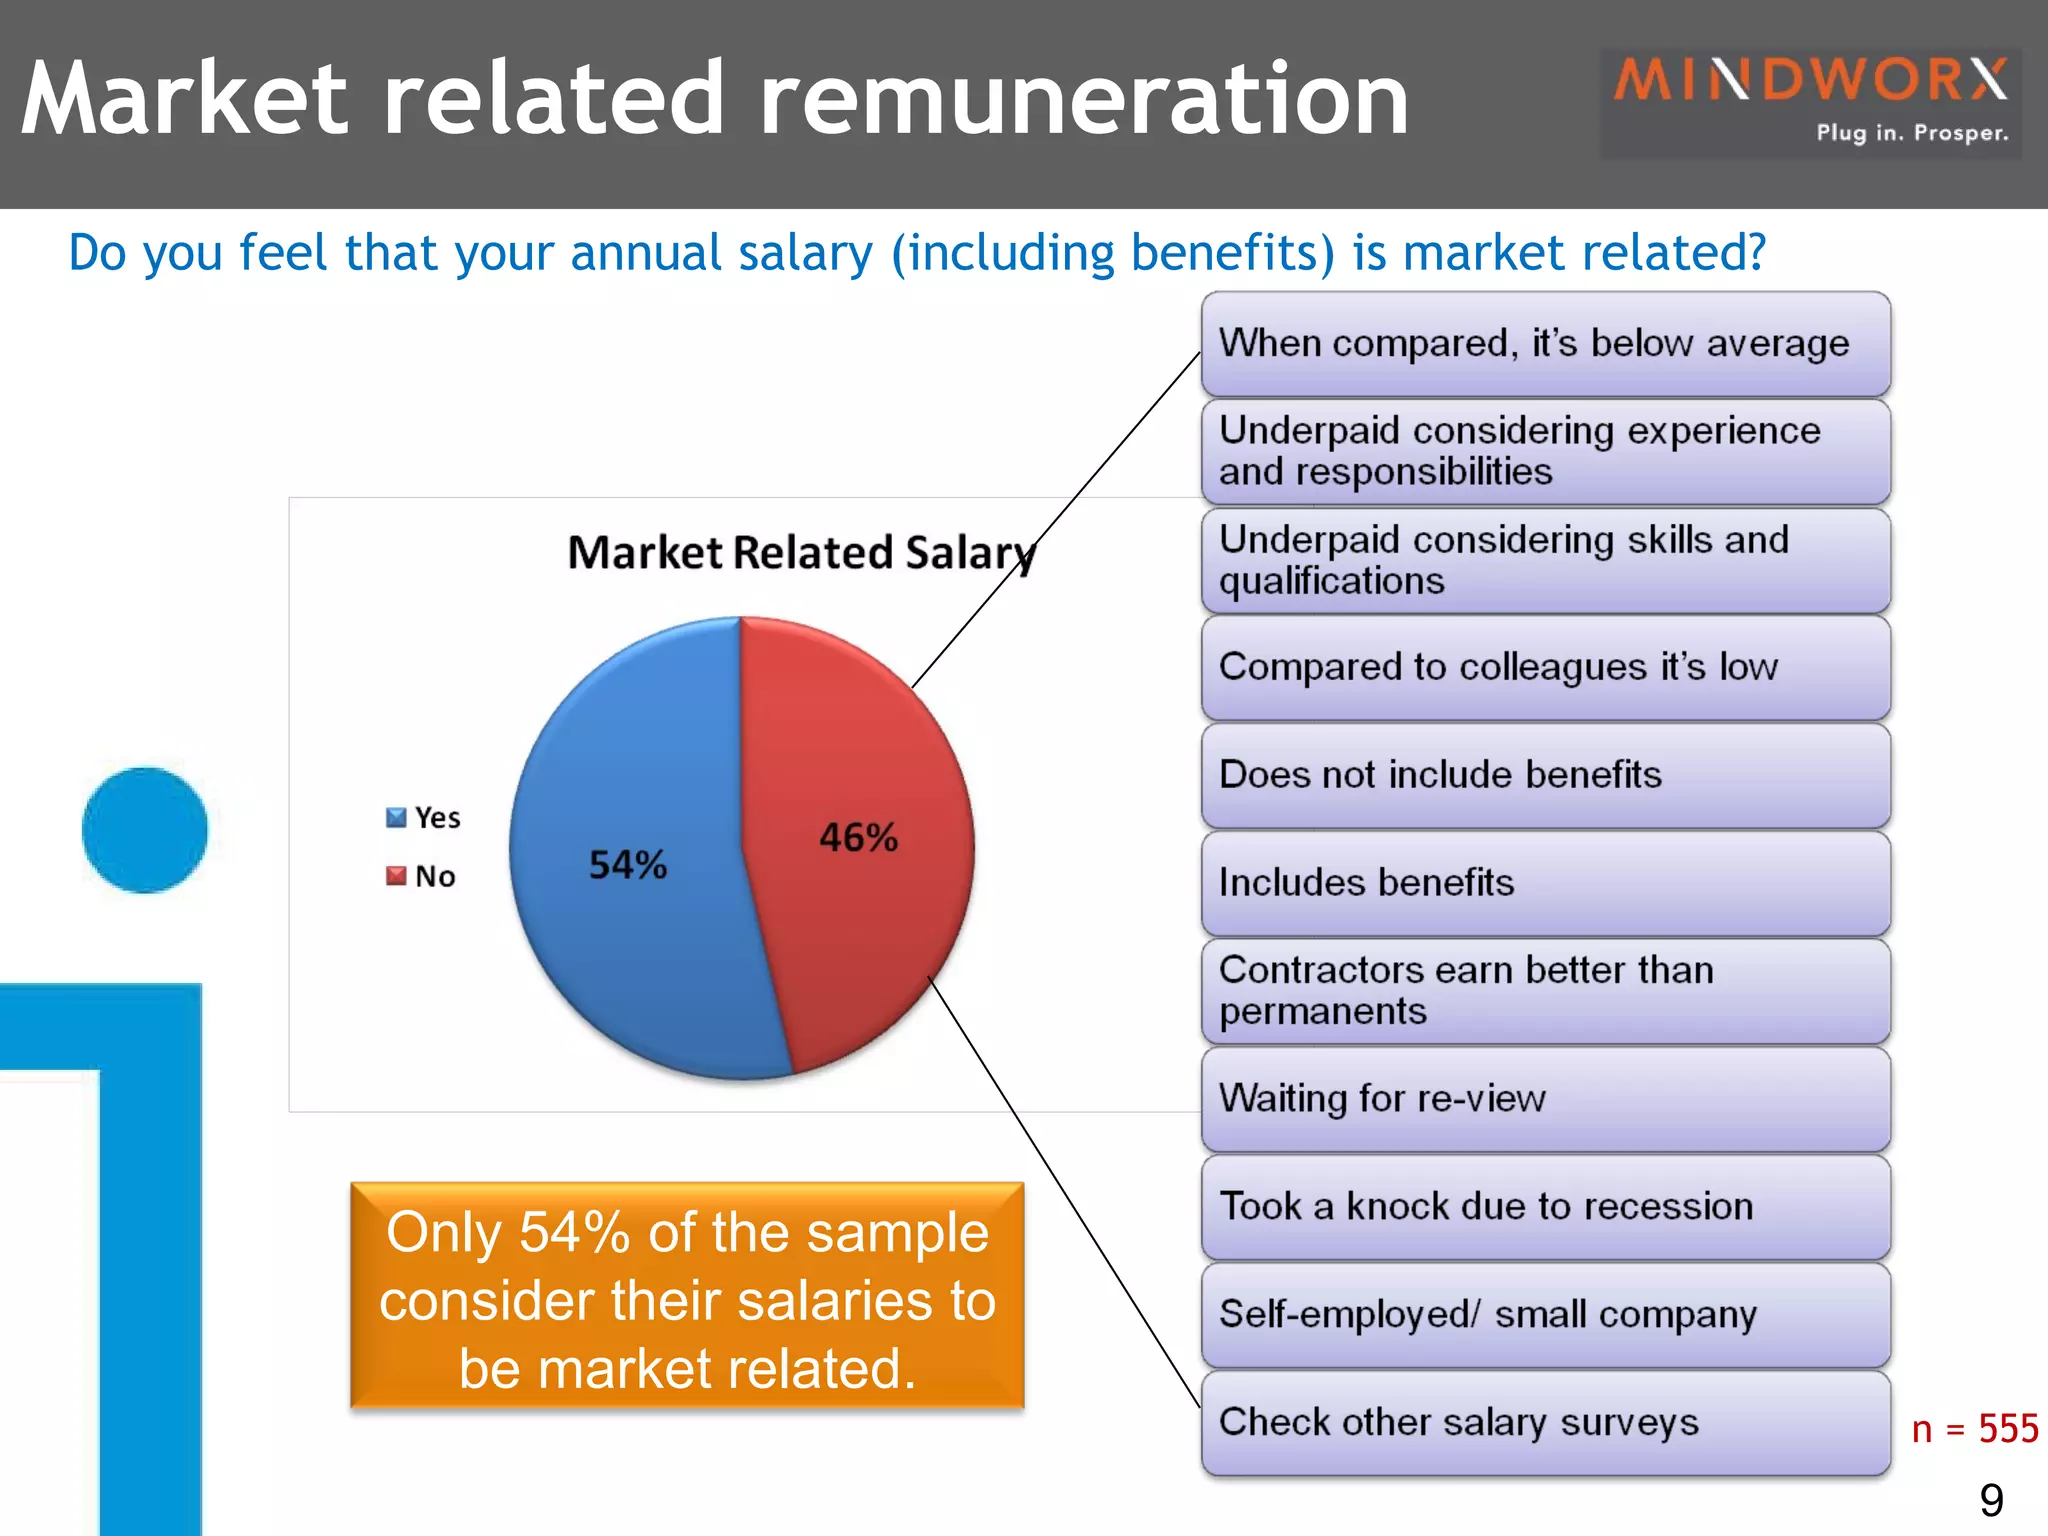
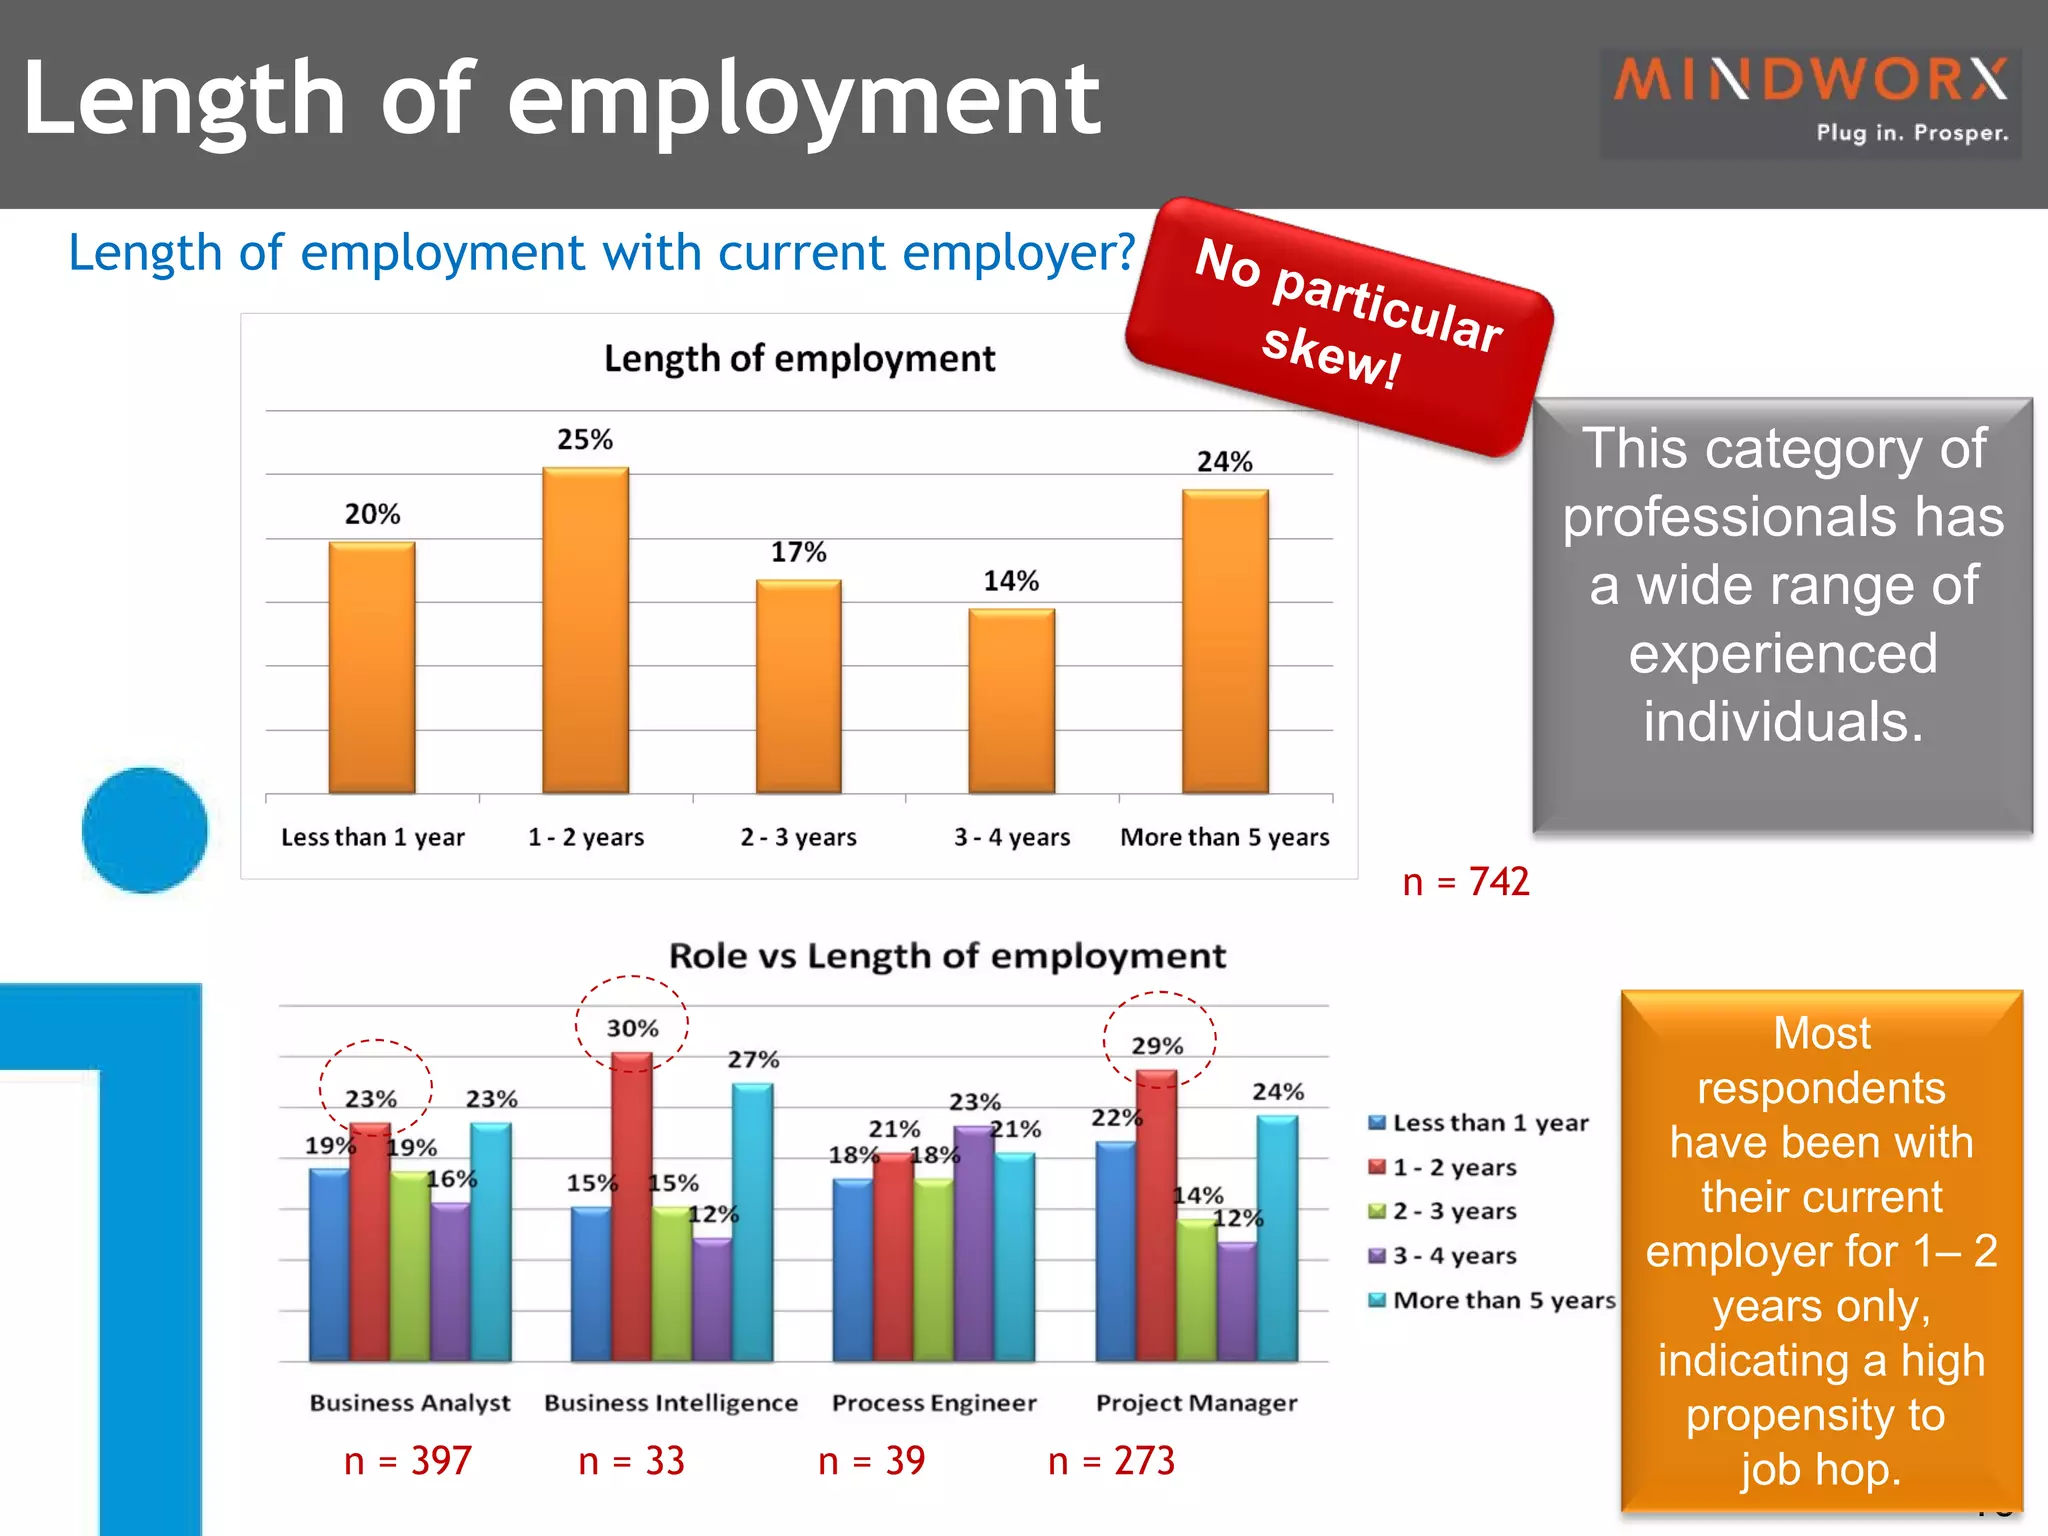


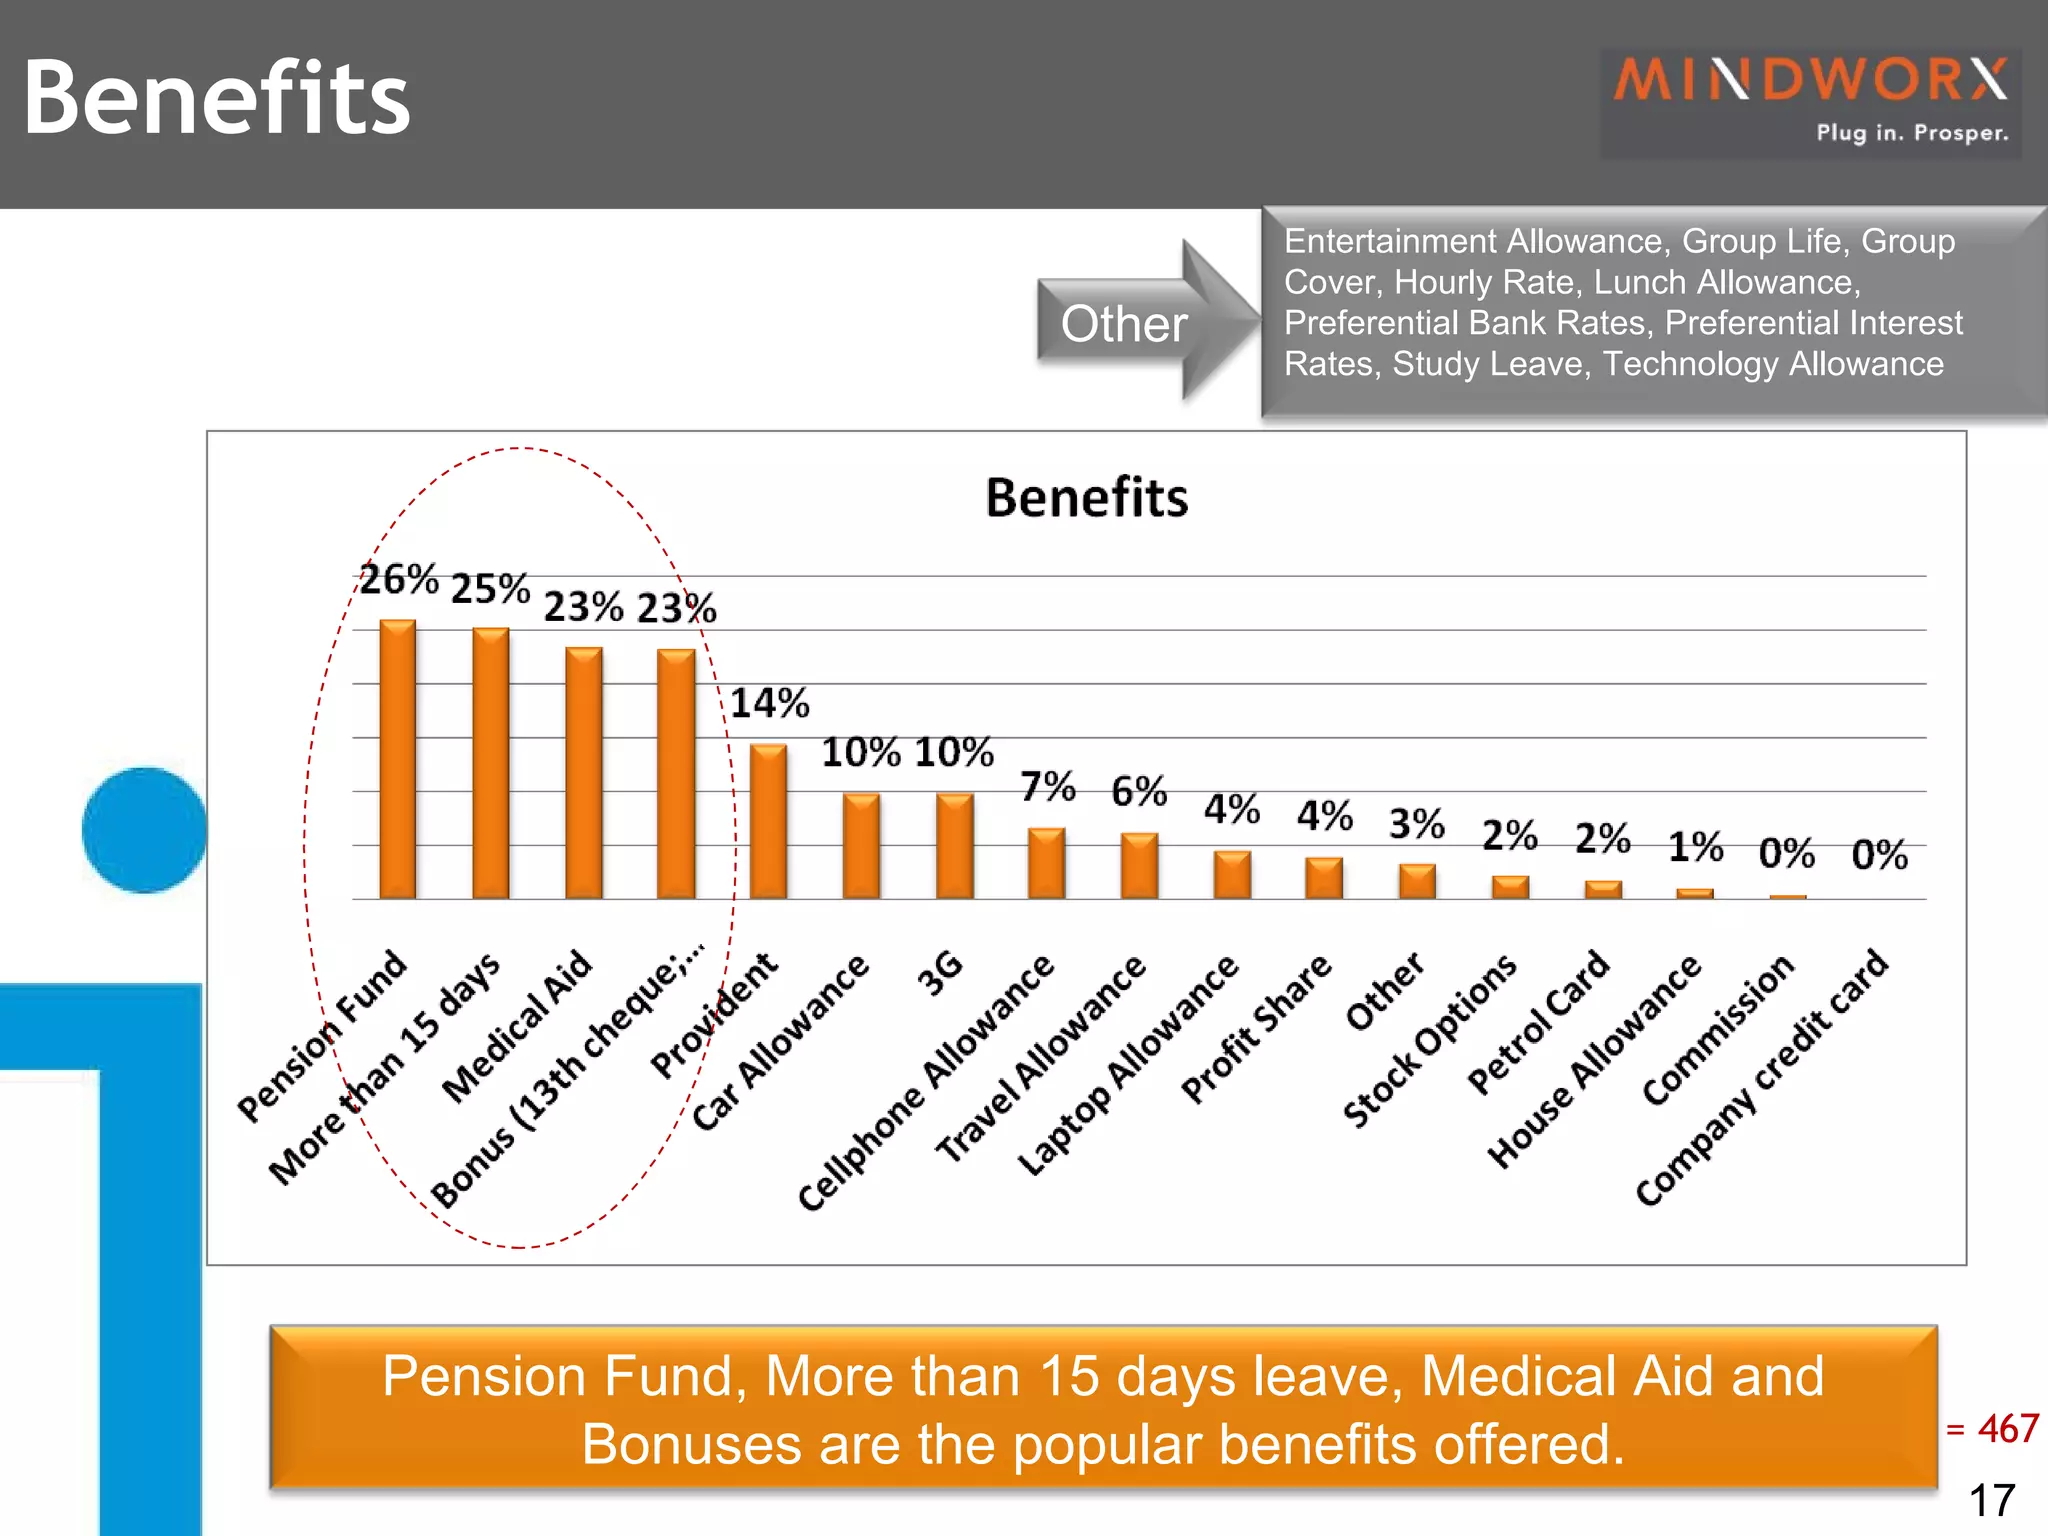


The survey aimed to gather data on compensation trends for business analysts, project managers, process engineers, and business intelligence professionals in South Africa. Over 750 respondents participated in an online survey conducted in July 2009. The results showed that over half of respondents felt their salaries were not market-related. Salaries increased with age and experience, with project managers earning the highest average salaries. Most respondents had degrees and 1-2 years of experience with their current employer. Common benefits included pension funds, medical aid, and bonuses.