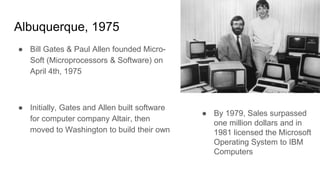
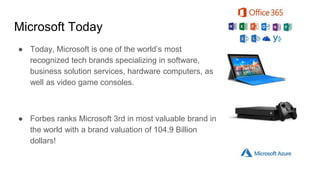
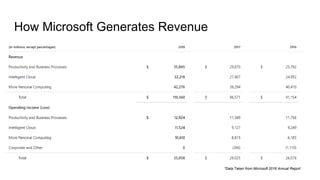
Microsoft Co.
An Analysis By: Andrew Hasson, Ryan Convery,
Jason Man
Albuquerque, 1975
● Bill Gates & Paul Allen founded Micro-
Soft (Microprocessors & Software) on
April 4th, 1975
● Initially, Gates and Allen built software
for computer company Altair, then
moved to Washington to build their own
● By 1979, Sales surpassed
one million dollars and in
1981 licensed the Microsoft
Operating System to IBM
Computers
Microsoft Today
● Today, Microsoft is one of the world’s most
recognized tech brands specializing in software,
business solution services, hardware computers, as
well as video game consoles.
● Forbes ranks Microsoft 3rd in most valuable brand in
the world with a brand valuation of 104.9 Billion
dollars!
Current Board Members
Satya Nadella
● CEO
● 2014-Present
John Thompson
● Chairman
● 2012-Present
How Microsoft Generates Revenue
*Data Taken from Microsoft 2018 Annual Report
Office 365 Subscriptions
● By the end of 2018, Microsoft had
roughly 34.1 Million subscribers for
their Office 365 Consumer services
● If Office 365 were a country, it would
have the same population as
Mozambique
● World Population of: 7.6 billion
population (2018)
● 34.1 million Office subscribers
● 1 in 223 people are subscribed
● Estimated 74.1% of World Population
are ages 15 and up
● 1 in 165 people are subscribed
Office Subscribers vs World Population
Firm Trends - Product Shift
● Based on data from Microsoft’s
recent fiscal years:
○ Microsoft is focusing increasingly on
Office and Cloud Computing
○ Shifting focus away from its other
products (hardware, electronics)
● Software-focused going forward
*Data Taken from Microsoft 2018 Annual Report
Firm Trends - Profit Margin
● Microsoft’s Profit Margin
steadily increasing over recent
years
● Impact from software shift
○ Software has little to no COGS
*Data Taken from Microsoft 2018 Annual Report
Firm Trends - Expenses
● R&D fluctuates
● SG&A going down
● Impact from software shift
○ Less SG&A needed
Financial Overview
● Liquidity ratios show that Microsoft is
capable of paying off its current
liabilities
● The Capital Structure of Microsoft
shows its being finance with more and
more debt than equity
● ROE has decreased because of a
sharp decline in Profit Margin and
Microsoft’s increase in leverage
Year 2016 2017 2018
Liquidity
Current Ratio 2.35 2.92 2.90
Quick Ratio 2.31 2.88 2.86
Cash Ratio 0.11 0.14 0.20
FCF Growth 7.98% 25.60% 2.79%
Capital Structure
D/A 62.79% 64.96% 68.04%
E/A 37.21% 35.04% 31.96%
ROE (DuPont)
Profit Margin 22.53% 26.39% 15.02%
TAT 0.47 0.39 0.43
Equity Multiplier 2.69 2.85 3.13
ROE (DuPont) 28.53% 29.06% 20.03%
Pro Forma - Income Statement
Assumptions: Income Statement Pro Forma
used percentage of sales method; Using a
6.63% Growth rate in revenue based off the
average growth rate in the previous three
years.
Pro Forma - Balance Sheet
Assumptions: Based as a % of Total Assets; Total Assets grew 14%
annually based on the average growth rate of assets in the previous
3 years.
● Current Ratio: 2.86
● Quick Ratio: 2.81
● LTD to Assets: 30%
● Inventory Turnover: 9.69
● Days Inventory: 37.64
● Total Liabilities to Assets: 68%
● Total Equity to Assets: 32%
Pro Forma - Statement of Cash Flows
Positive Total Cash Flows increasing
by about 12% annually.
The continuing decline in CF for
Investment activities indicates that
Microsoft is heavily investing in new
technologies for the future.
We would categorize Microsoft as right
in between the growth and maturity
phase of its life cycle.
Competitors
Microsoft’s main competitors are:
● Apple (AAPL)
○ Revenue 2018: $265 Billion
○ PM 2018: 22.26%
● Google (GOOG)
○ Revenue 2018: $136 Billion
○ PM 2018: 22.79%
● IBM (IBM)
○ Revenue 2018: $79 Billion
○ PM 2018: 7.59%
● Oracle (ORCL)
○ Revenue 2018: $39 Billion
○ PM 2018: 10.26%
Key Ratios
● Great short-term liquidity prospects
● Is not extremely asset heavy for its
sales
● Displays great returns on its assets
and equity
Stock Performance (10 years)
Graph
Ratio Analysis - P/E Ratio
● Microsoft has the second highest P/E
ratio of its chosen competitors
● Has grown from 14.51 to 28.06 in 5
years
● Shows investors optimism for the
company’s growth
● Indicates the company’s growth
prospects looks great compared to
competitors
Should We Invest?
Yes
● Tech Industry continues to grow over time
● Stock performance steadily increasing
● 3rd most valuable brand in the world
● Diverse array of products: Both hardware and software
● 2nd highest P/E ratio compared to competitors
Questions?
Sources
● FactSet
● https://www.forbes.com/powerful-brands/list/
● https://www.microsoft.com/en-us/annualreports/ar2018/annualreport
● https://data.worldbank.org/indicator/sp.pop.0014.to.zs
● https://www.capitaliq.com/CIQDotNet/Financial/Ratios.aspx?CompanyId=21835

Microsoft analysis

  • 1.
    Microsoft Co. An AnalysisBy: Andrew Hasson, Ryan Convery, Jason Man
  • 2.
    Albuquerque, 1975 ● BillGates & Paul Allen founded Micro- Soft (Microprocessors & Software) on April 4th, 1975 ● Initially, Gates and Allen built software for computer company Altair, then moved to Washington to build their own ● By 1979, Sales surpassed one million dollars and in 1981 licensed the Microsoft Operating System to IBM Computers
  • 3.
    Microsoft Today ● Today,Microsoft is one of the world’s most recognized tech brands specializing in software, business solution services, hardware computers, as well as video game consoles. ● Forbes ranks Microsoft 3rd in most valuable brand in the world with a brand valuation of 104.9 Billion dollars!
  • 4.
    Current Board Members SatyaNadella ● CEO ● 2014-Present John Thompson ● Chairman ● 2012-Present
  • 5.
    How Microsoft GeneratesRevenue *Data Taken from Microsoft 2018 Annual Report
  • 6.
    Office 365 Subscriptions ●By the end of 2018, Microsoft had roughly 34.1 Million subscribers for their Office 365 Consumer services ● If Office 365 were a country, it would have the same population as Mozambique
  • 7.
    ● World Populationof: 7.6 billion population (2018) ● 34.1 million Office subscribers ● 1 in 223 people are subscribed ● Estimated 74.1% of World Population are ages 15 and up ● 1 in 165 people are subscribed Office Subscribers vs World Population
  • 8.
    Firm Trends -Product Shift ● Based on data from Microsoft’s recent fiscal years: ○ Microsoft is focusing increasingly on Office and Cloud Computing ○ Shifting focus away from its other products (hardware, electronics) ● Software-focused going forward *Data Taken from Microsoft 2018 Annual Report
  • 9.
    Firm Trends -Profit Margin ● Microsoft’s Profit Margin steadily increasing over recent years ● Impact from software shift ○ Software has little to no COGS *Data Taken from Microsoft 2018 Annual Report
  • 10.
    Firm Trends -Expenses ● R&D fluctuates ● SG&A going down ● Impact from software shift ○ Less SG&A needed
  • 11.
    Financial Overview ● Liquidityratios show that Microsoft is capable of paying off its current liabilities ● The Capital Structure of Microsoft shows its being finance with more and more debt than equity ● ROE has decreased because of a sharp decline in Profit Margin and Microsoft’s increase in leverage Year 2016 2017 2018 Liquidity Current Ratio 2.35 2.92 2.90 Quick Ratio 2.31 2.88 2.86 Cash Ratio 0.11 0.14 0.20 FCF Growth 7.98% 25.60% 2.79% Capital Structure D/A 62.79% 64.96% 68.04% E/A 37.21% 35.04% 31.96% ROE (DuPont) Profit Margin 22.53% 26.39% 15.02% TAT 0.47 0.39 0.43 Equity Multiplier 2.69 2.85 3.13 ROE (DuPont) 28.53% 29.06% 20.03%
  • 12.
    Pro Forma -Income Statement Assumptions: Income Statement Pro Forma used percentage of sales method; Using a 6.63% Growth rate in revenue based off the average growth rate in the previous three years.
  • 13.
    Pro Forma -Balance Sheet Assumptions: Based as a % of Total Assets; Total Assets grew 14% annually based on the average growth rate of assets in the previous 3 years. ● Current Ratio: 2.86 ● Quick Ratio: 2.81 ● LTD to Assets: 30% ● Inventory Turnover: 9.69 ● Days Inventory: 37.64 ● Total Liabilities to Assets: 68% ● Total Equity to Assets: 32%
  • 14.
    Pro Forma -Statement of Cash Flows Positive Total Cash Flows increasing by about 12% annually. The continuing decline in CF for Investment activities indicates that Microsoft is heavily investing in new technologies for the future. We would categorize Microsoft as right in between the growth and maturity phase of its life cycle.
  • 15.
    Competitors Microsoft’s main competitorsare: ● Apple (AAPL) ○ Revenue 2018: $265 Billion ○ PM 2018: 22.26% ● Google (GOOG) ○ Revenue 2018: $136 Billion ○ PM 2018: 22.79% ● IBM (IBM) ○ Revenue 2018: $79 Billion ○ PM 2018: 7.59% ● Oracle (ORCL) ○ Revenue 2018: $39 Billion ○ PM 2018: 10.26%
  • 16.
    Key Ratios ● Greatshort-term liquidity prospects ● Is not extremely asset heavy for its sales ● Displays great returns on its assets and equity
  • 17.
  • 18.
    Ratio Analysis -P/E Ratio ● Microsoft has the second highest P/E ratio of its chosen competitors ● Has grown from 14.51 to 28.06 in 5 years ● Shows investors optimism for the company’s growth ● Indicates the company’s growth prospects looks great compared to competitors
  • 19.
    Should We Invest? Yes ●Tech Industry continues to grow over time ● Stock performance steadily increasing ● 3rd most valuable brand in the world ● Diverse array of products: Both hardware and software ● 2nd highest P/E ratio compared to competitors
  • 20.
  • 21.
    Sources ● FactSet ● https://www.forbes.com/powerful-brands/list/ ●https://www.microsoft.com/en-us/annualreports/ar2018/annualreport ● https://data.worldbank.org/indicator/sp.pop.0014.to.zs ● https://www.capitaliq.com/CIQDotNet/Financial/Ratios.aspx?CompanyId=21835

Editor's Notes

  • #3 *Ryan
  • #4 https://www.forbes.com/powerful-brands/list/ *Ryan
  • #5 *Andrew *Mention here other companies are on board of directors? Pepsi and Bank of America
  • #6 *Jason Focusing more on Productivity & Business Processes (Everything under the “Microsoft Office” Brand Name) and Intelligent Cloud (Microsoft Azure, Windows servers) over Personal Computing (Everything else: Win 10, Xbox, Tablets, Phones)
  • #8 https://data.worldbank.org/indicator/sp.pop.0014.to.zs
  • #9 Focusing more on Productivity & Business Processes (Everything under the “Microsoft Office” Brand Name) and Intelligent Cloud (Microsoft Azure, Windows servers) over Personal Computing (Everything else: Win 10, Xbox, Tablets, Phones)
  • #10 https://www.microsoft.com/en-us/annualreports/ar2018/annualreport Probably went up - Product shift, focusing less on electronics/hardware - more on software (very small COGS since software is a service) *GROSS MARGIN**
  • #12 *Ryan 5x Income Tax for 2018 https://money.cnn.com/2018/01/31/technology/microsoft-tax-charge-earnings/index.html
  • #13 Ryan
  • #14 Ryan
  • #15 Mature Lifecycle Ryan
  • #16 $110 million 15% PM Andrew*
  • #17 TTM
  • #18 120.77 4/16/2019 18.78 4/22/2009 HPR = 543.08% APR = 54.31% S&P = ~240% HPR
  • #20 Shareholder Yield - Buybacks