Download as PDF, PPTX

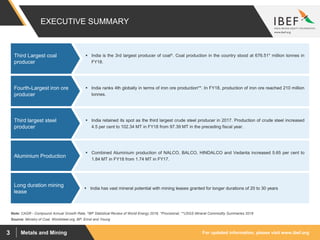


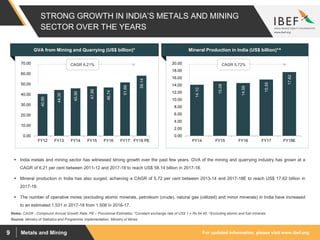
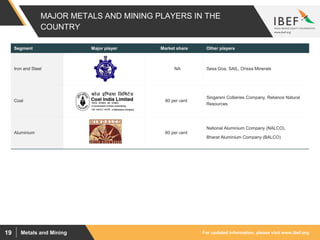


India is a major producer and consumer of metals and minerals globally. Some key points: - India ranks 4th globally in iron ore production and is the 3rd largest producer and consumer of crude steel. - The metals and mining sector has grown at a CAGR of 6.21% between 2011-12 and 2017-18 to reach a GVA of US$58.14 billion. - Key minerals produced in India include coal, iron ore, bauxite, and precious metals and stones. The sector is dominated by states like Rajasthan, Odisha, and Andhra Pradesh. - Rising infrastructure development and growth in sectors like automotive and power are driving demand for metals in India


