Download as PDF, PPTX
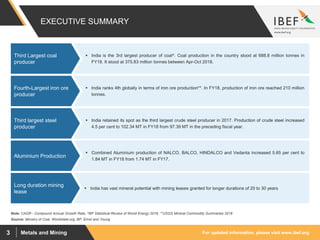
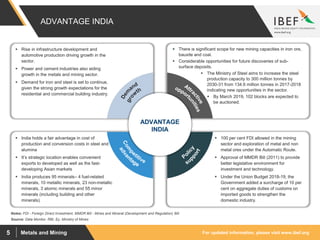
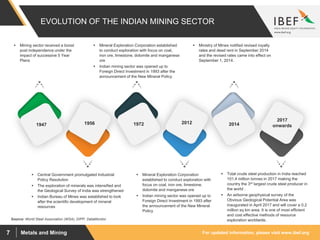
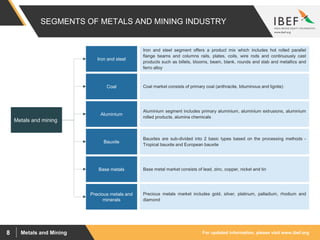
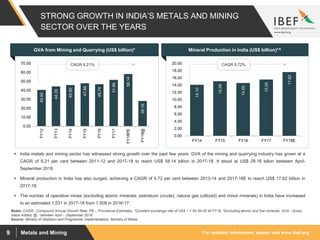
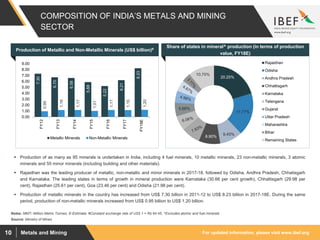
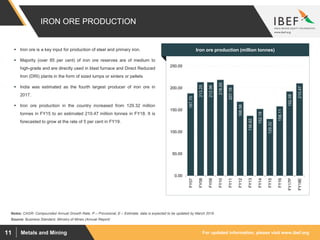


The document provides an overview of the metals and mining industry in India. Some key points: - India ranks 4th globally in iron ore production and is the 3rd largest producer of crude steel and coal. - The metals and mining sector has grown at a CAGR of 6.21% between 2011-12 and 2017-18, reaching a GVA of US$58.14 billion. - India produces 95 minerals including 4 fuel minerals, 10 metallic minerals, and 23 non-metallic minerals. The sector is supported by initiatives like the National Mineral Policy and increasing infrastructure development.


