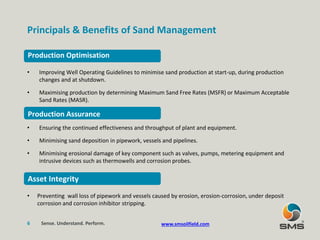
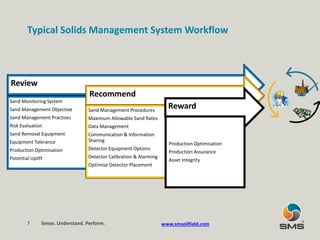
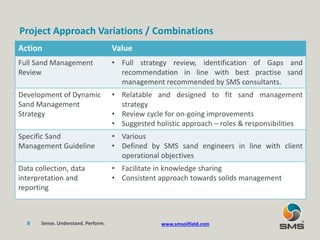
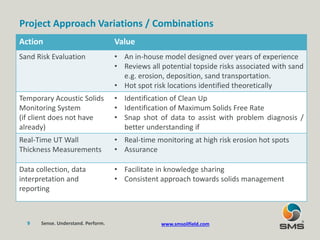
Production Chemistry Networking Event
MER & Sand Management Alignment
Introduction - Key Elements
1. Re-Cap on Industry Context
a) Industry Rationalisation
b) Regulatory Framework
c) Where Do We Go From Here?
2. Sand Management Aligns with MER
1. Principals
2. Application – Project Case Study
3. Development Work
1. Modular Flow Assurance Sensing Technologies
2. Software Hub
3. SMS Visibility
4. Key Messages
Context – OGA UKCS Governance
Sand Management Alignment with MER
Sense. Understand. Perform.
• Principals and Case Study Application of Topside
Sand Management
5
Definition of Sand Management
"The consideration of all subsurface and surface
aspects related to sand (solids) in the production
of oil & gas. [Including but not limited to:
prediction; sand control; flow assurance
(transportation/erosion); monitoring; sand
handling; and disposal.]"
Sand Management Network 2011
Sand Management
Principals & Benefits of Sand Management
Production Optimisation
• Improving Well Operating Guidelines to minimise sand production at start-up, during production
changes and at shutdown.
• Maximising production by determining Maximum Sand Free Rates (MSFR) or Maximum Acceptable
Sand Rates (MASR).
• Ensuring the continued effectiveness and throughput of plant and equipment.
• Minimising sand deposition in pipework, vessels and pipelines.
• Minimising erosional damage of key component such as valves, pumps, metering equipment and
intrusive devices such as thermowells and corrosion probes.
• Preventing wall loss of pipework and vessels caused by erosion, erosion-corrosion, under deposit
corrosion and corrosion inhibitor stripping.
Production Assurance
Asset Integrity
Production Optimisation
6 Sense. Understand. Perform. www.smsoilfield.com
Typical Solids Management System Workflow
Review
Sand Monitoring System
Sand Management Objective
Sand Management Practises
Risk Evaluation
Sand Removal Equipment
Equipment Tolerance
Production Optimisation
Potential Uplift
Recommend
Sand Management Procedures
Maximum Allowable Sand Rates
Data Management
Communication & Information
Sharing
Detector Equipment Options
Detector Calibration & Alarming
Optimise Detector Placement
Reward
Production Optimisation
Production Assurance
Asset Integrity
7 Sense. Understand. Perform. www.smsoilfield.com
Project Approach Variations / Combinations
8 Sense. Understand. Perform.
Action Value
Full Sand Management
Review
• Full strategy review, identification of Gaps and
recommendation in line with best practise sand
management recommended by SMS consultants.
Development of Dynamic
Sand Management
Strategy
• Relatable and designed to fit sand management
strategy
• Review cycle for on-going improvements
• Suggested holistic approach – roles & responsibilities
Specific Sand
Management Guideline
• Various
• Defined by SMS sand engineers in line with client
operational objectives
Data collection, data
interpretation and
reporting
• Facilitate in knowledge sharing
• Consistent approach towards solids management
www.smsoilfield.com
Project Approach Variations / Combinations
9 Sense. Understand. Perform.
Action Value
Sand Risk Evaluation • An in-house model designed over years of experience
• Reviews all potential topside risks associated with sand
e.g. erosion, deposition, sand transportation.
• Hot spot risk locations identified theoretically
Temporary Acoustic Solids
Monitoring System
(if client does not have
already)
• Identification of Clean Up
• Identification of Maximum Solids Free Rate
• Snap shot of data to assist with problem diagnosis /
better understanding if
Real-Time UT Wall
Thickness Measurements
• Real-time monitoring at high risk erosion hot spots
• Assurance
Data collection, data
interpretation and
reporting
• Facilitate in knowledge sharing
• Consistent approach towards solids management
www.smsoilfield.com
Sand Risk Evaluation – Dashboard & Logic Programming
Application Case Example
Sense. Understand. Perform.
• Pushing Production on Ageing Assets
• Topside Sand Management
Application - SNS Gas Assets
Background
• Significant Asset Base of
Production Hubs & NUI’s.
Infrastructure well
established.
• Assets Produce 15% of the
UK’s daily gas demand.
• The group’s strategic focus is
on the exploitation of
marginal fields.
Objectives & Case Study
“Through active Sand &
Corrosion Management, the
adoption of technology and
integrating of workscopes
we will optimise production
& safeguard plant integrity.”
Objectives & Challenge
Workscope Objectives
• Support production uplift
• Reduce costs
• Increase safety
Challenges & Tasks
• Provide assurances against any
erosion associated with ramping
up production.
• Potential velocity or “erosion
hotspots” identified for
additional management. Long
term view taken.
• Need to protect business
capability and people. No LOC’s
with increased production.
Client Value Created
Achievements Enhanced At Risk Sensing
14
• Automated systems,
reducing effort
• Live data streams,
accurate wall thickness
measurements
• Minimised risk to
operators, no need for
manual spot checks
• No LOC’s to plant on
implementation
• Increased uptime and
operational efficiency.
Development Work –Sensing Tech &
Visualisation Platform
Sense. Understand. Perform.
• Where we’re at and work to be done
Customer Value Proposition
Acoustic
Data Cloud Hosted
Sensory
Perception
Products
Wall Thickness
Data
Particle
Analysis Data
Innovative Products, Service, Software & Sensory Perception Knowledge Tools
Integrate into Client DAQ
Sensing Tech - Modular Flow Assurance Packages
Objectives Enhanced “At Risk” Sensing
17
• Reduced costs through
centralised insights and
planned actions
• Increased uptime and
operational efficiency.
• Automated systems,
reducing effort
• Live data streams, real
time measurements
• Enhance service
capability & Minimise
operational risk
SMART Software & Remote Monitoring
SMS software combines data from multiple hardware sources providing a clearer picture of sand
production and its effects on the pipework. Data interpretation from one source which may be ambiguous
can be confirmed.
• Real-time trending and
visualisation of multiple sensors
• Risk evaluation
• Integration into any acquisition
or historian
• Remote operation onshore /
offshore management
Sense. Understand. Perform.18 www.smsoilfield.com
Objectives To Realise Production Insights
19
• Reduced Operational
costs through centralised
insights and planned
actions.
• Increased productivity.
• Automated systems,
instant access reducing
effort
• Real Time results
• Enhance service
capability & Minimise
operational risk
SMS Visibility – Development Workflow 1
Visualisation Tools to Integrate & Realise Insight
20 Sense. Understand. Perform.
Key Messages:
Pushing Production:
Achievable benefits are being realised
Value Creation:
Productivity, Operational benefits with Economic and
Performance gains. Aligned to UK Gov’s MER strategy
What next:
Need for automation, integration & understanding
Live Feeds, Pattern Recognition, Digital Twin for
maintenance planning & well service applications

MER and Sand Management Alignment

  • 1.
    Production Chemistry NetworkingEvent MER & Sand Management Alignment
  • 2.
    Introduction - KeyElements 1. Re-Cap on Industry Context a) Industry Rationalisation b) Regulatory Framework c) Where Do We Go From Here? 2. Sand Management Aligns with MER 1. Principals 2. Application – Project Case Study 3. Development Work 1. Modular Flow Assurance Sensing Technologies 2. Software Hub 3. SMS Visibility 4. Key Messages
  • 3.
    Context – OGAUKCS Governance
  • 4.
    Sand Management Alignmentwith MER Sense. Understand. Perform. • Principals and Case Study Application of Topside Sand Management
  • 5.
    5 Definition of SandManagement "The consideration of all subsurface and surface aspects related to sand (solids) in the production of oil & gas. [Including but not limited to: prediction; sand control; flow assurance (transportation/erosion); monitoring; sand handling; and disposal.]" Sand Management Network 2011 Sand Management
  • 6.
    Principals & Benefitsof Sand Management Production Optimisation • Improving Well Operating Guidelines to minimise sand production at start-up, during production changes and at shutdown. • Maximising production by determining Maximum Sand Free Rates (MSFR) or Maximum Acceptable Sand Rates (MASR). • Ensuring the continued effectiveness and throughput of plant and equipment. • Minimising sand deposition in pipework, vessels and pipelines. • Minimising erosional damage of key component such as valves, pumps, metering equipment and intrusive devices such as thermowells and corrosion probes. • Preventing wall loss of pipework and vessels caused by erosion, erosion-corrosion, under deposit corrosion and corrosion inhibitor stripping. Production Assurance Asset Integrity Production Optimisation 6 Sense. Understand. Perform. www.smsoilfield.com
  • 7.
    Typical Solids ManagementSystem Workflow Review Sand Monitoring System Sand Management Objective Sand Management Practises Risk Evaluation Sand Removal Equipment Equipment Tolerance Production Optimisation Potential Uplift Recommend Sand Management Procedures Maximum Allowable Sand Rates Data Management Communication & Information Sharing Detector Equipment Options Detector Calibration & Alarming Optimise Detector Placement Reward Production Optimisation Production Assurance Asset Integrity 7 Sense. Understand. Perform. www.smsoilfield.com
  • 8.
    Project Approach Variations/ Combinations 8 Sense. Understand. Perform. Action Value Full Sand Management Review • Full strategy review, identification of Gaps and recommendation in line with best practise sand management recommended by SMS consultants. Development of Dynamic Sand Management Strategy • Relatable and designed to fit sand management strategy • Review cycle for on-going improvements • Suggested holistic approach – roles & responsibilities Specific Sand Management Guideline • Various • Defined by SMS sand engineers in line with client operational objectives Data collection, data interpretation and reporting • Facilitate in knowledge sharing • Consistent approach towards solids management www.smsoilfield.com
  • 9.
    Project Approach Variations/ Combinations 9 Sense. Understand. Perform. Action Value Sand Risk Evaluation • An in-house model designed over years of experience • Reviews all potential topside risks associated with sand e.g. erosion, deposition, sand transportation. • Hot spot risk locations identified theoretically Temporary Acoustic Solids Monitoring System (if client does not have already) • Identification of Clean Up • Identification of Maximum Solids Free Rate • Snap shot of data to assist with problem diagnosis / better understanding if Real-Time UT Wall Thickness Measurements • Real-time monitoring at high risk erosion hot spots • Assurance Data collection, data interpretation and reporting • Facilitate in knowledge sharing • Consistent approach towards solids management www.smsoilfield.com
  • 10.
    Sand Risk Evaluation– Dashboard & Logic Programming
  • 11.
    Application Case Example Sense.Understand. Perform. • Pushing Production on Ageing Assets • Topside Sand Management
  • 12.
    Application - SNSGas Assets Background • Significant Asset Base of Production Hubs & NUI’s. Infrastructure well established. • Assets Produce 15% of the UK’s daily gas demand. • The group’s strategic focus is on the exploitation of marginal fields. Objectives & Case Study “Through active Sand & Corrosion Management, the adoption of technology and integrating of workscopes we will optimise production & safeguard plant integrity.”
  • 13.
    Objectives & Challenge WorkscopeObjectives • Support production uplift • Reduce costs • Increase safety Challenges & Tasks • Provide assurances against any erosion associated with ramping up production. • Potential velocity or “erosion hotspots” identified for additional management. Long term view taken. • Need to protect business capability and people. No LOC’s with increased production.
  • 14.
    Client Value Created AchievementsEnhanced At Risk Sensing 14 • Automated systems, reducing effort • Live data streams, accurate wall thickness measurements • Minimised risk to operators, no need for manual spot checks • No LOC’s to plant on implementation • Increased uptime and operational efficiency.
  • 15.
    Development Work –SensingTech & Visualisation Platform Sense. Understand. Perform. • Where we’re at and work to be done
  • 16.
    Customer Value Proposition Acoustic DataCloud Hosted Sensory Perception Products Wall Thickness Data Particle Analysis Data Innovative Products, Service, Software & Sensory Perception Knowledge Tools Integrate into Client DAQ
  • 17.
    Sensing Tech -Modular Flow Assurance Packages Objectives Enhanced “At Risk” Sensing 17 • Reduced costs through centralised insights and planned actions • Increased uptime and operational efficiency. • Automated systems, reducing effort • Live data streams, real time measurements • Enhance service capability & Minimise operational risk
  • 18.
    SMART Software &Remote Monitoring SMS software combines data from multiple hardware sources providing a clearer picture of sand production and its effects on the pipework. Data interpretation from one source which may be ambiguous can be confirmed. • Real-time trending and visualisation of multiple sensors • Risk evaluation • Integration into any acquisition or historian • Remote operation onshore / offshore management Sense. Understand. Perform.18 www.smsoilfield.com
  • 19.
    Objectives To RealiseProduction Insights 19 • Reduced Operational costs through centralised insights and planned actions. • Increased productivity. • Automated systems, instant access reducing effort • Real Time results • Enhance service capability & Minimise operational risk SMS Visibility – Development Workflow 1 Visualisation Tools to Integrate & Realise Insight
  • 20.
    20 Sense. Understand.Perform. Key Messages: Pushing Production: Achievable benefits are being realised Value Creation: Productivity, Operational benefits with Economic and Performance gains. Aligned to UK Gov’s MER strategy What next: Need for automation, integration & understanding Live Feeds, Pattern Recognition, Digital Twin for maintenance planning & well service applications