Download as PDF, PPTX


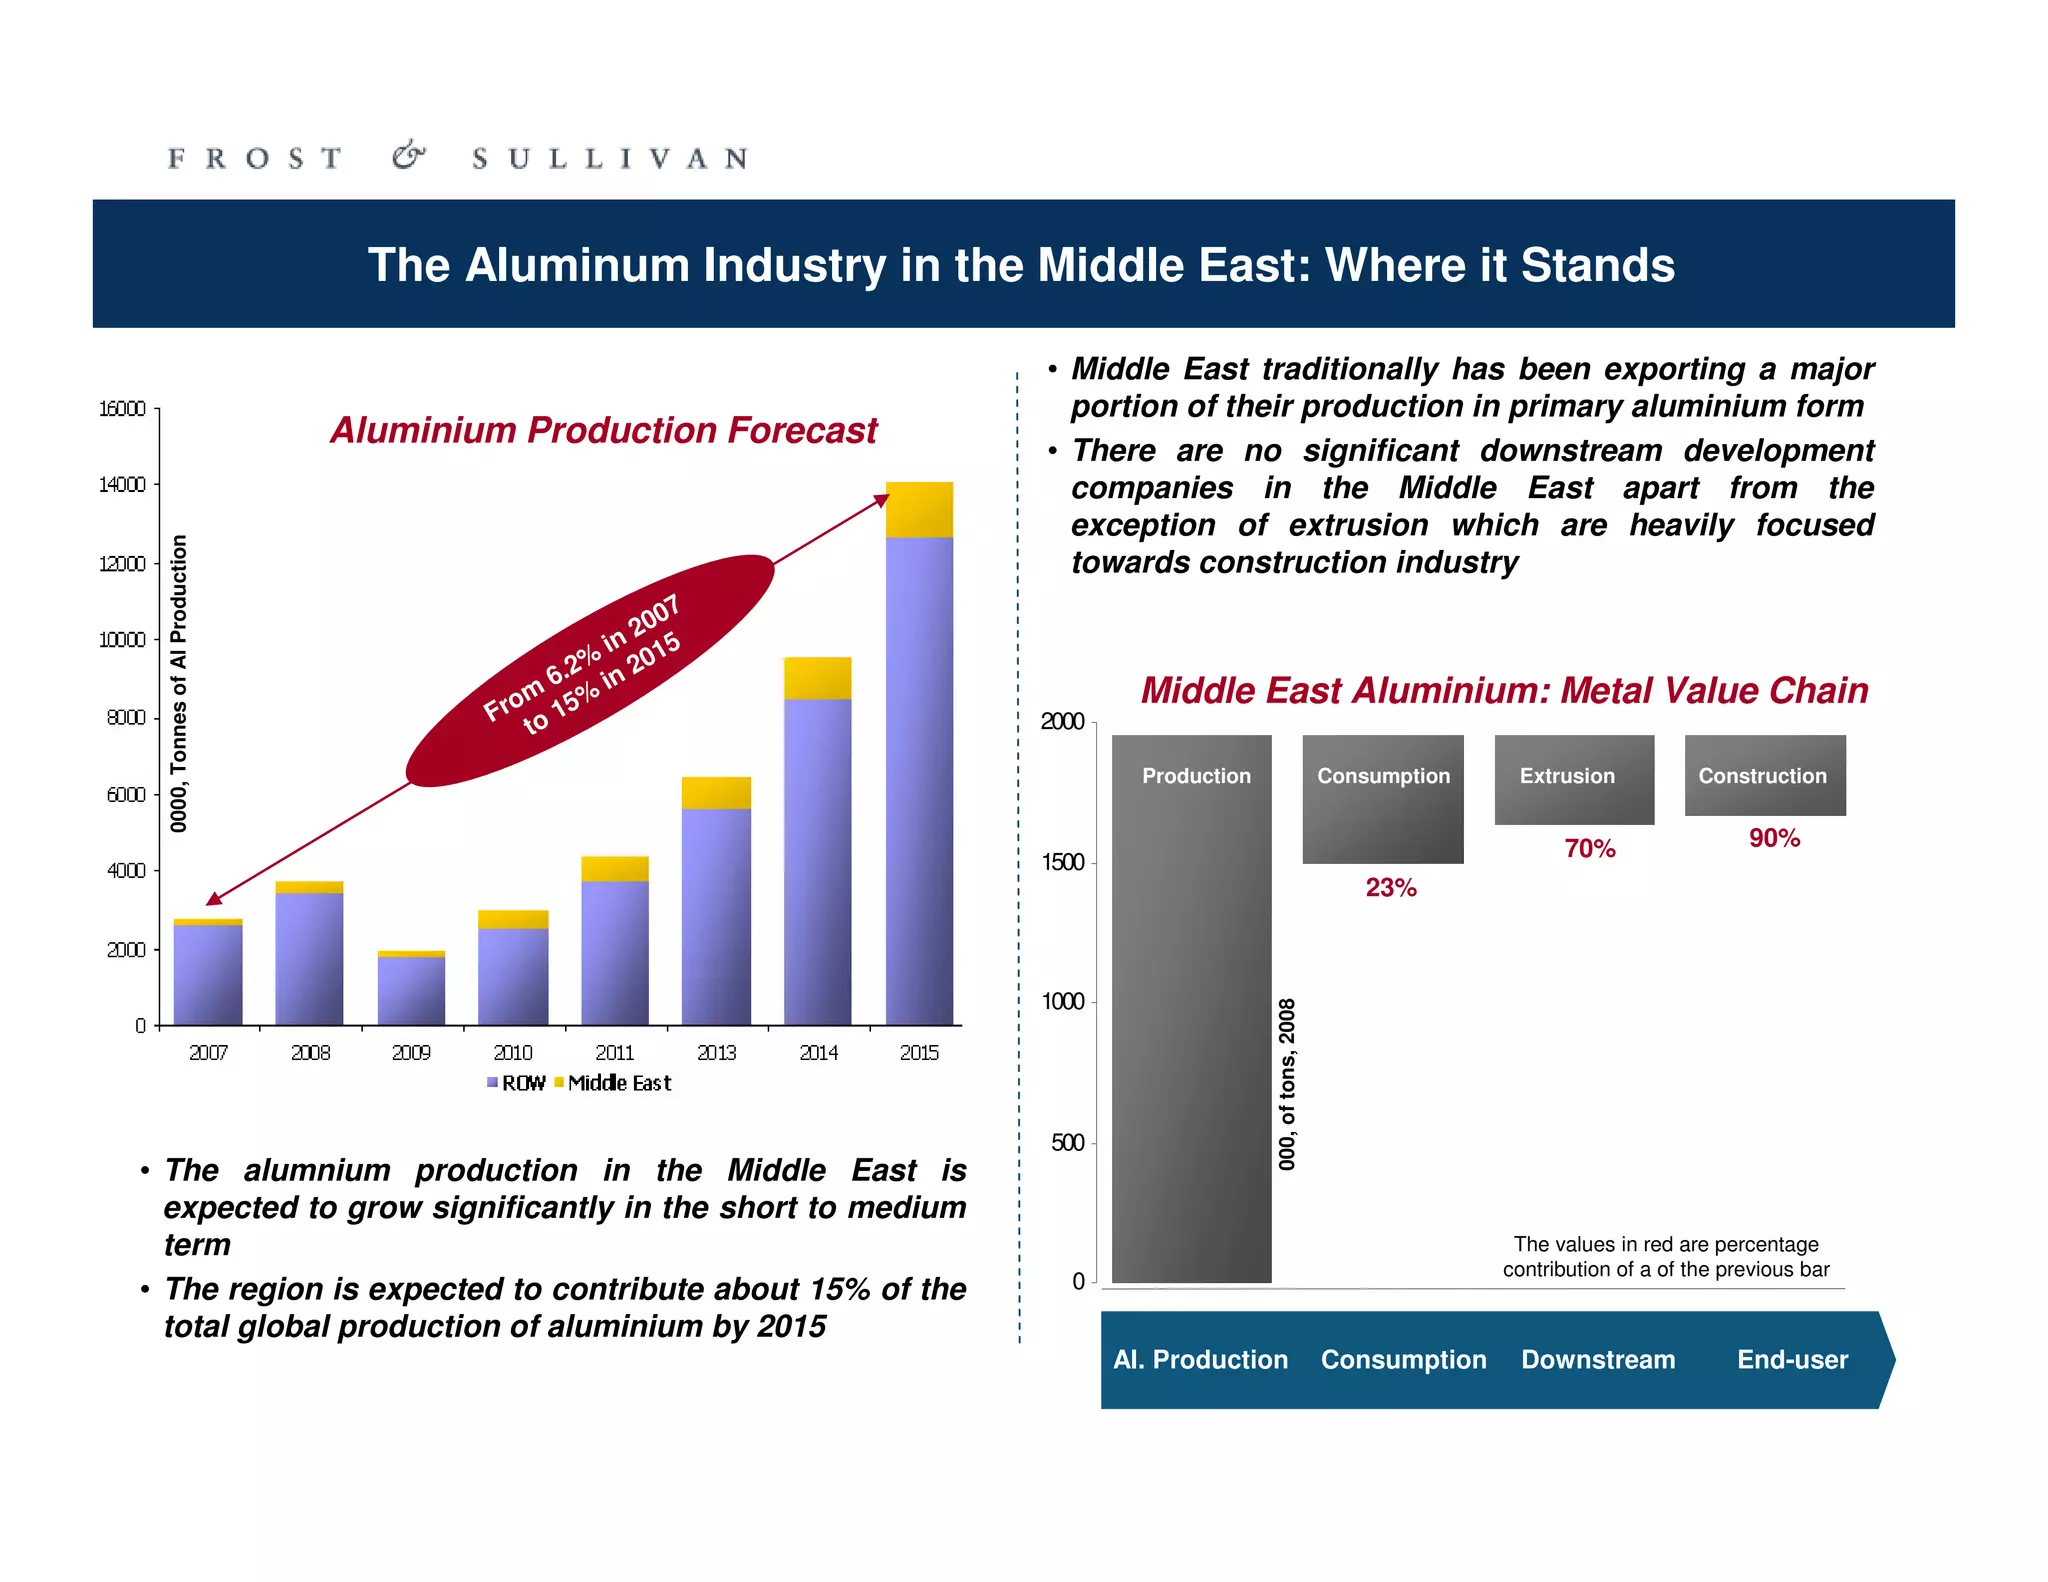


The document outlines the growth outlook and challenges for the aluminium industry in the Middle East, projecting significant production increases by 2030 while highlighting the lack of downstream development and high primary aluminium exports. Key drivers include emerging applications in various sectors such as construction, automotive, and pharmaceuticals, with a forecasted rise in exports and competitive advantages derived from energy resources. It emphasizes the necessity for strategic investment and development of downstream industries to enhance economic value-add in the region.


