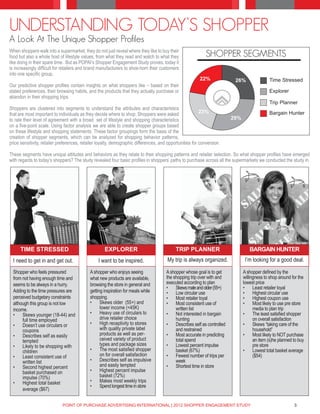
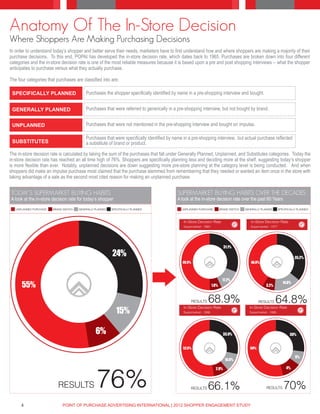
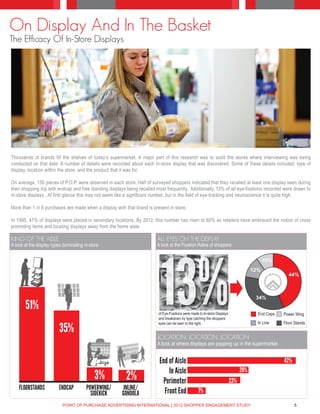
SlideShare a Scribd company logo
1 of 8
Download to read offline
2012 SHOPPER ENGAGEMENT STUDY
MEDIA TOPLINE REPORT
THE NEW SHOPPER JOURNEY
More Decisions Are Being Made In-Store Than Ever Before
                                                          Understanding the needs, purchasing behavior, and changing lifestyles of today’s shopper
                                                          is critical in being able to deliver on their immediate and future needs. While it’s true that a
 As far back as the 1960’s, POPAI’s constituents had      shopper’s decisions are no longer limited to in-store, POPAI’s 2012 Shopper Engagement
 the insight to know that they needed to understand       Study finds that now more than ever shoppers are making an overwhelming number of
 the buying behaviors of shoppers in order to affect      their purchasing decisions in-store. In fact, the in-store decision rate has climbed from
                                                          70% in 1995 to 76% in 2012. With today’s shopper being increasingly mobile, social and
 their purchase decisions through point of purchase       in control what exactly has changed to push the in-store decision rate to an all time high?
 displays. Since then, every decade POPAI has
                                                          There’s no denying that the shoppers’ path to purchase is considerably different today
 conducted a study that tells the story of how shoppers
                                                          than it was for the shopper of yesteryear. With the advent of smartphones, shopping
 shop. This is the story of today’s shopper.              apps, mobile coupons, and myriad other innovations, how can it not be? Yet, when we
                                                          look at the data from POPAI’s series of long running shopper research projects aimed
                                                          at providing new information on how shoppers behave when they are in different types
                                                          of stores deciding which categories and brands to buy we see that it all comes down to
                                                          on thing – in-store marketing.

                                                          POPAI has a long history of fielding research around the effectiveness of displays and
                                                          measuring the in-store decision rate, which creates quite the compelling case for investing
                                                          in the in-store environment. Comprised of three key components, the in-store decision
                                                          rate factors in generally planned purchases, brand substitution, and unplanned purchases
                                                          to determine the true number of decisions being made at the shelf. Moreover, the data
                                                          shows us that an important part of the marketing mix is the use of materials and devices
                                                          that stimulate sales where the action is – the point of purchase. Often the decision-
                                                          making process of shoppers does not occur until they actually see a product in the store.
                                                          Therefore, the way a product is displayed in a store and is supported by in-store marketing
                                                          materials can often be instrumental in leveraging sales.

                                                          In this report you will find a top line summary of how shoppers are interacting with the in-store
                                                          environment and how in-store marketing is playing a crucial role in today’s shopper journey.


                             POPAI’S HIERARCHY OF SHOPPERS’ NEW BEHAVIORS
                                                           >> Like to get exactly what they set out for
                                   Complete the
                                                           >> Aim is to complete shopping trip
                                   task at hand
                                                           >> Nearly half of all shoppers use pre-store media to plan
                                                              their trip.
                                   Research and            >> A large majority create a shopping list whether mental,
                                                              handwritten, or digital.
                                    plan the trip
                                                           >> Enjoys seeing what new products are available while
                                                              shopping the store.
                                 Finding inspiration       >> Enjoys getting meal ideas while grocery shopping.
                                    and solutions
                                                           >> Overall fresh food quality, good service, quick checkout
                                                              and value are the most important considerations for
                                   Product offering           shoppers when choosing a retailer.
                                    and selection
                                                           >> Willing to wait for sales
                                                           >> Will shop multiple retailers for best prices
                                   Seeking better
                                       value


    2                  POINT OF PURCHASE ADVERTISING INTERNATIONAL | 2012 SHOPPER ENGAGEMENT STUDY
UNDERSTANDING TODAY’S SHOPPER
A Look At The Unique Shopper Profiles
When shoppers walk into a supermarket, they do not just reveal where they like to buy their
food but also a whole host of lifestyle values, from what they read and watch to what they                   SHOPPER SEGMENTS
like doing in their spare time. But as POPAI’s Shopper Engagement Study proves, today it
is increasingly difficult for retailers and brand manufacturers to shoe-horn their customers
into one specific group.
                                                                                                         22%              26%                Time Stressed
Our predictive shopper profiles contain insights on what shoppers like – based on their
stated preferences, their browsing habits, and the products that they actually purchase or                                                   Explorer
abandon in their shopping trips.
                                                                                                                                             Trip Planner
Shoppers are clustered into segments to understand the attributes and characteristics
that are most important to individuals as they decide where to shop. Shoppers were asked                  23%                                Bargain Hunter
to rate their level of agreement with a broad set of lifestyle and shopping characteristics                              29%
on a five-point scale. Using factor analysis we are able to create shopper groups based
on these lifestyle and shopping statements. These factor groupings form the basis of the
creation of shopper segments, which can be analyzed for shopping behavior patterns,
price sensitivity, retailer preferences, retailer loyalty, demographic differences, and opportunities for conversion.

These segments have unique attitudes and behaviors as they relate to their shopping patterns and retailer selection. So what shopper profiles have emerged
with regards to today’s shoppers? The study revealed four basic profiles in shoppers’ paths to purchase across all the supermarkets we conducted the study in.


      TIME STRESSED                                 EXPLORER                                TRIP PLANNER                          BARGAIN HUNTER
  I need to get in and get out.                  I want to be inspired.                My trip is always organized.             I’m looking for a good deal.

  Shopper who feels pressured               A shopper who enjoys seeing                A shopper whose goal is to get          A shopper defined by the
  from not having enough time and           what new products are available,           the shopping trip over with and         willingness to shop around for the
  seems to be always in a hurry.            browsing the store in general and          executed according to plan              lowest price
                                                                                       •	 Skews male and older (55+)           •	 Least retailer loyal
  Adding to the time pressures are          getting inspiration for meals while        •	 Low circular use                     •	 Highest circular use
  perceived budgetary constraints           shopping.                                  •	 Most retailer loyal                  •	 Highest coupon use
  although this group is not low            •	 Skews older (55+) and                   •	 Most consistent use of               •	 Most likely to use pre store
  income.                                         lower income (<45K)                       written list                             media to plan trip
  •	 Skews younger (18-44) and              •	 Heavy use of circulars to               •	 Not interested in bargain            •	 The least satisfied shopper
       full time employed                         drive retailer choice                     hunting                                  on overall satisfaction
  •	 Doesn’t use circulars or               •	 High receptivity to stores              •	 Describes self as controlled         •	 Skews “taking care of the
       coupons                                    with quality private label                and restrained                           household”
  •	 Describes self as easily                     products as well as per-             •	 Most accurate in predicting          •	 Most likely to NOT purchase
       tempted                                    ceived variety of product                 total spend                              an item (s)he planned to buy
  •	 Likely to be shopping with                   types and package sizes              •	 Lowest percent impulse                     pre store
       children                             •	 The most satisfied shopper                   basket (67%)                       •	 Lowest total basket average
  •	 Least consistent use of                      on for overall satisfaction          •	 Fewest number of trips per                 ($54)
       written list                         •	 Describes self as impulsive                  week
  •	 Second highest percent                       and easily tempted                   •	 Shortest time in store
       basket purchased on                  •	 Highest percent impulse
       impulse (70%)                              basket (72%)
  •	 Highest total basket                   •	 Makes most weekly trips
                                            •	 Spend longest time in store
       average ($67)


                             POINT OF PURCHASE ADVERTISING INTERNATIONAL | 2012 SHOPPER ENGAGEMENT STUDY                                                   3
Anatomy Of The In-Store Decision
Where Shoppers Are Making Purchasing Decisions
In order to understand today’s shopper and better serve their needs, marketers have to first understand how and where shoppers are making a majority of their
purchase decisions. To this end, POPAI has developed the in-store decision rate, which dates back to 1965. Purchases are broken down into four different
categories and the in-store decision rate is one of the most reliable measures because it is based upon a pre and post shopping interviews -- what the shopper
anticipates to purchase versus what they actually purchase.

The four categories that purchases are classified into are:

 SPECIFICALLY PLANNED                      Purchases the shopper specifically identified by name in a pre-shopping interview and bought.


 GENERALLY PLANNED                         Purchases that were referred to generically in a pre-shopping interview, but not bought by brand.


 UNPLANNED                                 Purchases that were not mentioned in the pre-shopping interview and bought on impulse.

                                           Purchases that were specifically identified by name in a pre-shopping interview, but actual purchase reflected
 SUBSTITUTES                               a substitute of brand or product.

The in-store decision rate is calculated by taking the sum of the purchases that fall under Generally Planned, Unplanned, and Substitutes categories. Today the
in-store decision rate has reached an all time high of 76%. Shoppers are specifically planning less and deciding more at the shelf, suggesting today’s shopper
is more flexible than ever. Notably, unplanned decisions are down suggesting more pre-store planning at the category level is being conducted. And when
shoppers did make an impulse purchase most claimed that the purchase stemmed from remembering that they needed or wanted an item once in the store with
taking advantage of a sale as the second most cited reason for making an unplanned purchase.


TODAY’S SUPERMARKET BUYING HABITS                                                          SUPERMARKET BUYING HABITS OVER THE DECADES
A look at the in-store decision rate for today‘s shopper                                   A look at the in-store decision rate over the past 60 Years
   UNPLANNED PURCHASE   BRAND SWITCH   GENERALLY PLANNED   SPECIFICALLY PLANNED               UNPLANNED PURCHASE           BRAND SWITCH   GENERALLY PLANNED       SPECIFICALLY PLANNED


                                                                                               In-Store Decision Rate                        In-Store Decision Rate
                                                                                               Supermarket - 1965                            Supermarket - 1977


                                                                                                                             31.1%

                                                           24%                                                                                                               35.2%
                                                                                              49.9%                                          46.8%


                                                                                                                            17.2%
      55%                                                                                                           1.8%                               3.2%
                                                                                                                                                                     14.8%


                                                                                                      RESULTS   68.9%                            RESULTS      64.8%
                                                              15%
                                                                                               In-Store Decision Rate                       In-Store Decision Rate
                                                                                               Supermarket - 1986                           Supermarket - 1995


                                                 6%                                                                          33.9%                                       30%


                                                                                              52.6%                                          60%

                                                                                                                                                                             6%
                                                                                                                              10.6%


                                                 76%
                                                                                                                      2.9%                                             4%


                           RESULTS                                                                  RESULTS     66.1%                                  RESULTS       70%
      4                      POINT OF PURCHASE ADVERTISING INTERNATIONAL | 2012 SHOPPER ENGAGEMENT STUDY
On Display And In The Basket
The Efficacy Of In-Store Displays


Thousands of brands fill the shelves of today’s supermarket. A major part of this research was to audit the stores where interviewing was being
conducted on that date. A number of details were recorded about each in-store display that was discovered. Some of these details included: type of
display, location within the store, and the product that it was for.

On average, 150 pieces of P.O.P. were observed in each store. Half of surveyed shoppers indicated that they recalled at least one display seen during
their shopping trip with endcap and free standing displays being recalled most frequently. Additionally, 13% of all eye-fixations recorded were drawn to
in-store displays. At first glance this may not seem like a significant number, but in the field of eye-tracking and neuroscience it is quite high.

More than 1 in 6 purchases are made when a display with that brand is present in store.

In 1995, 47% of displays were placed in secondary locations. By 2012, this number has risen to 60% as retailers have embraced the notion of cross
promoting items and locating displays away from the home aisle.

KING OF THE AISLE                                                         ALL EYES ON THE DISPLAY
A look at the display types dominating in-store                           A look at the Fixation Rates of shoppers


                                                                            13%
                                                                                                                                              10%
                                                                                                                                        12%
                                                                                                                                                       44%


                                                                                                                                         34%
       51%                                                                of Eye-Fixations were made to In-store Displays                 End Caps   Power Wing
                                                                          and breakdown by type catching the shoppers
                                                                          eyes can be seen to the right.                                  In Line    Floor Stands
                         35%
                                                                          LOCATION, LOCATION, LOCATION
                                                                          A look at where displays are popping up in the supermarket


                                                                           End of Aisle                                                              42%
                                                                               In Aisle                                           28%
                                            3%            2%                 Perimeter                                      23%
    FLOORSTANDS          ENDCAP         POWERWING/       INLINE/
                                          SIDEKICK      GONDOLA              Front End              7%

                           POINT OF PURCHASE ADVERTISING INTERNATIONAL | 2012 SHOPPER ENGAGEMENT STUDY                                                     5
THE METHODOLOGY
A New And Innovative Approach
                                                                      POPAI fielded its most recent study beginning in the fall of 2011 and concluding in March
  POPAI’s Shopper Engagement Study is an update to the 1995           2012, which was fully funded by the association. In-store intercept interviews were
  Consumer Buying Habits Study. The Shopper Engagement                conducted with 2400 shoppers across the four broad U.S. census regions. In addition, a
  Study is comprised of two concurrently executed research            subset of 210 shoppers were recruited to participate in the EEG/Eye-tracking portion of the
  modules. The Core Methodology included pre and post                 study.
  shopping interview formats with 2400 shoppers. The Secondary
  Module incorporates portable electroencephalography (EEG)           CORE METHODOLOGY
  equipment, worn by respondents while they shop. This is             SAMPLE
                                                                      A total sample of 2400 supermarket shoppers was interviewed for the core methodology.
  combined with eye tracking to tie shoppers’ physiological
                                                                      The study was executed across the four (4) broad US geographic census regions. The
  responses to exactly what they are looking at, eliminating such     number of interviews conducted per region closely reflected a census balanced sample.
  issues as recall and denial.
                                                                      The study was conducted across twelve major supermarket banners. These outlets were
                                                                      large, high-volume stores selected from leading chains and were evenly divided among the
                                                                      four (4) geographic census regions.

                                                                      SHOPPER INTERCEPT INTERVIEWS
                                                                      Supermarket shoppers were randomly intercepted and screened at the entrance of each
                                                                      store location for being at least 18 years of age and on a routine stock up or fill in trip. These
                                                                      interviews were conducted across all day parts and all days of the week.

                                                                      The 10-minute entry interview gathered information on:
                                                                      •	        Planned purchases (unaided category and brand planning)
                                                                      •	        Any pre-store path-to-purchase activities shopper engaged in for planned
                                                                                purchases and in general
                                                                      •	        Amount budgeted/expect to spend for planned items and total basket
                                                                      •	        General shopping behaviors in channel
                                                                      •	        Demographics and profiling information

                                                                      Upon completion of the entry interview, shoppers were asked to return to the researchers
after they completed their shopping trip for a 15-20 minute post-shopping interview. A $25 store gift card incentive was provided to each shopper who returned and
completed the post-shop interview. Shoppers also agreed to have information on all of their purchased products recorded. The record of all purchases for each
shopper was obtained through electronic capture of register receipts.

After completing their shopping trip and checking out the ethnographer then conducted the exit interview and recorded products and brands purchased from
shopper’s entire basket.

The exit interview gathered information on:
•	 Products purchased (category and brand level information)
•	 Coupon, circular, mobile phone use, etc. used in purchase decisions
•	 Recall/awareness of displays for product purchases
•	 Attitudes and perceptions towards retail environment and specific categories. Each shopper was probed on at least three high volume categories - e.g. salty
    snacks, CSD, etc – so that expanded category specific insights could be provided.
•	 Total amount spent and by category.
•	 Method of payment
STORE AUDIT
Each day an audit of specific display types throughout the store was conducted prior to the start of interviewing. The purpose of the store audit was to record and
identify the display materials for which to measure impact on decision-making and emotional response. The audit included photos of each display logged as well
as coding of the following information:
Display Type:                                          Location of each display:                                Other variables:
•	 Floorstands                                         •	 End of aisle (front or back)                          •	 Category and brand the display is advertising
•	 Endcaps                                             •	 Perimeter/racetrack                                   •	 Static vs. motion
•	 Powerwings/sidekicks                                •	 In-aisle                                              •	 Product on it vs. no product
•	 In-line/gondola/full-line merchandisers             •	 Front end                                             •	 Whether it is interactive
    (specialty)                                        Placement of display:                                    •	 Whether it has video or audio
•	 In-store media                                      •	 Primary
•	 Digital signage                                     •	 Secondary

      6                     POINT OF PURCHASE ADVERTISING INTERNATIONAL | 2012 SHOPPER ENGAGEMENT STUDY
THE METHODOLOGY
A New And Innovative Approach
SECONDARY METHODOLOGY                                                                   individual to interpret what he/she sees. With Sands Research proprietary brain
As an overlay to the core methodology, POPAI utilized mobile eye-tracking and           imaging software, we measured activity in the orbital frontal lobe and displayed
EEG on a sub-set of shoppers to understand the following:                               those results second by second in real time. Additionally, results of what
•	 Degree to which displays (as defined earlier) make it into shoppers’ line            percentage of the total study population viewed and which part of the design
    of sight.                                                                           presentation achieved the largest response. This was achieved by marking
•	 Identify the display types and locations that generate the most impressions          when the participant fixates on a specific product or component with a unique
    and greatest activation.                                                            event code. This allows for analysis to sort and group responses based on that
•	 Amount/percentage of time spent engaging with these displays (by audit               unique event code.
    variables such as display type, location, and placement).
•	 Degree to which these displays are noticed, stopped at, interacted with              PARAMETERS AND PROCEDURES
    and drive purchases.                                                                Utilizing a neuromarketing analysis framework the responses of all 210
•	 What is the emotional response (valence) to these displays?                          participants was directly recorded combining EEG and eye-tracking in a real
•	 What is the shopper’s track or path throughout the store?                            world environment and in real-time. The in-depth study included 64 channels
•	 What are the search patterns and navigational strategies shoppers use                of EEG data along with eye-tracking. While the eye-tracking data can provide
    to find and select products? How much time is spent considering these               interesting insights, its inclusion with EEG data allows the brain activity to be
    categories?                                                                         synchronized with specific objects of interest that the participant is fixating on.

SAMPLE                                                                                  The testing parameters and procedures for the retail EEG/Eye- tracking were
Traditional primary research methods measure introspective opinions. They rely          as follows:
on techniques such as surveys or facilitated focus groups. These measures               •	 The sample consisted of 210 participants within the market segments of
require a large sample size in order to ensure valid results.                                interest.
                                                                                        •	 Individuals were recruited to participate in the study. Participants were
The individual responses analyzed with the secondary methodology exhibit low                 staggered at 45 or 60-minute intervals to reduce flow congestion.
variability within a specified demographic. In order for us to achieve the linkage      •	 Two acquisition teams were deployed into the field into separate markets
between the core methodology and secondary methodology the sub-set of eye-                   simultaneously.
tracked shoppers came from the pool of in-store interviews conducted in the
core methodology. Shoppers were not forced to view any specific displays so             Participants were prepped using the following planned sequence:
as to not create bias.                                                                  1.	 Pre-testing
                                                                                        2.	 EEG and Eye-tracking prep
A sample of 210 study participants evenly spread across the four (4) census             3.	 Recording EEG & Eye-tracking data across 20+ categories
regions yielded stable and valid results.                                               4.	 Removal of equipment
                                                                                        5.	 Post questioning sequence
ELECTROENCEPHALOGRAM DATA                                                               6.	 Issued incentive
The primary research tool utilized in the secondary methodology of the study
was high-density Electroencephalogram (EEG) data. When groups of neurons                SIGNIFICANCE OF METHODOLOGY
are activated in the brain, a small electrical charge is generated, resulting in an     This research project is the first of it’s kind in both size and breadth to be
electrical field. EEG is a method that is used to measure these fields by placing       conducted utilizing such a wide range of data gathering techniques. The
electrodes on a person’s scalp. The measured signals are then amplified for             triangulation of data and insights sourced from one sample of shoppers in a live
analysis.                                                                               retail environment has never been achieved before to this degree, which will
                                                                                        be especially relevant in a sea of emerging shopper insights research from a
These electrical fields were interpreted and projected onto a high-resolution,          myriad of sources. There is little doubt that the results from the study will prove
three-dimensional representation of a brain. The result is the ability to determine     to be a solid framework through which future shopper market research should
what areas of the brain are activated at specific moments.                              be conducted to get a more accurate and complete picture of shopping patterns
                                                                                        and behaviors.
Utilizing a standard mobile EEG framework, the testing procedures followed
advanced neuroscience-based acquisition and analysis protocol. By running
one participant at a time the study was able to maintain absolute quality of EEG
data to ensure effective and valid results with statistical confidence.

SYNCHRONIZED EYE-TRACKING
The use of eye-tracking data is common in market research studies. However,
adding a real-time interpretation of the brains response to a specific instant in a
recording, to interpret why a subject is looking at a target, is not. Correlating EEG
and eye-tracking data allows for a time-locked analysis of how shopper interaction
plays into the perception of the presented material. By utilizing traditional methods
of market research as well as brain response tied to eye-tracking we were able to
relate unparalleled accuracy in actual shopper experience.

With eye-tracking and statistical analysis combined with the EEG recording,
we were able to evaluate how much effortful processing is necessary for an

                              POINT OF PURCHASE ADVERTISING INTERNATIONAL | 2012 SHOPPER ENGAGEMENT STUDY                                                        7
Media topline-final

More Related Content

What's hot

Getting shopper attention
Getting shopper attentionGetting shopper attention
Getting shopper attentionBasem Said
 
Intro to shelf savvy marketing shelf savvy tool books
Intro to shelf savvy marketing   shelf savvy tool booksIntro to shelf savvy marketing   shelf savvy tool books
Intro to shelf savvy marketing shelf savvy tool booksNormaAlcazar
 
Shopper missions: The heart of any successful shopper strategy
Shopper missions: The heart of any successful shopper strategyShopper missions: The heart of any successful shopper strategy
Shopper missions: The heart of any successful shopper strategyEvolution Insights
 
Conquering The Omnichannel Arena
Conquering The Omnichannel ArenaConquering The Omnichannel Arena
Conquering The Omnichannel ArenaG3 Communications
 
Creating a truly personalized Omni-channel customer experience
Creating a truly personalized Omni-channel customer experienceCreating a truly personalized Omni-channel customer experience
Creating a truly personalized Omni-channel customer experienceVincent Teo
 
The mars agency shopper trends 2015
The mars agency shopper trends 2015The mars agency shopper trends 2015
The mars agency shopper trends 2015darrenmars
 
IQ Shopper Marketing
IQ Shopper MarketingIQ Shopper Marketing
IQ Shopper MarketingSoDA Speaks
 
Directions for the Future
Directions for the FutureDirections for the Future
Directions for the FutureOgilvyAction
 
Omni- / Multi-Channel Retail - A.T. Kearney - Report - On Solid Ground
Omni- / Multi-Channel Retail - A.T. Kearney - Report - On Solid GroundOmni- / Multi-Channel Retail - A.T. Kearney - Report - On Solid Ground
Omni- / Multi-Channel Retail - A.T. Kearney - Report - On Solid GroundOliver Grave
 
Shopper marketing for retail net group feb 17, 2011
Shopper marketing for retail net group feb 17, 2011Shopper marketing for retail net group feb 17, 2011
Shopper marketing for retail net group feb 17, 2011Jim Holbrook
 
SJC 2013 Omni-channel insight report
SJC 2013 Omni-channel insight reportSJC 2013 Omni-channel insight report
SJC 2013 Omni-channel insight reportMarcos Terenzio
 
A Consumer's Path To Savings: The Role Of Flyers In Today's Digital World
A Consumer's Path To Savings: The Role Of Flyers In Today's Digital WorldA Consumer's Path To Savings: The Role Of Flyers In Today's Digital World
A Consumer's Path To Savings: The Role Of Flyers In Today's Digital WorldAdam Bellisario
 
How to use Point of Purchase (POP) Marketing to Influence your Customers
How to use Point of Purchase (POP) Marketing to Influence your CustomersHow to use Point of Purchase (POP) Marketing to Influence your Customers
How to use Point of Purchase (POP) Marketing to Influence your CustomersCeleste Martínez
 
Booz GMA Shopper Marketing Overview
Booz GMA Shopper Marketing OverviewBooz GMA Shopper Marketing Overview
Booz GMA Shopper Marketing OverviewNeil Kimberley
 
2016 Shopper Marketing Trends from The MARS Agency
2016 Shopper Marketing Trends from The MARS Agency2016 Shopper Marketing Trends from The MARS Agency
2016 Shopper Marketing Trends from The MARS AgencyDarren Keen
 
Why a mobile retail strategy.pptx
Why a mobile retail strategy.pptxWhy a mobile retail strategy.pptx
Why a mobile retail strategy.pptxAndrea Puerari
 

What's hot (20)

Getting shopper attention
Getting shopper attentionGetting shopper attention
Getting shopper attention
 
Intro to shelf savvy marketing shelf savvy tool books
Intro to shelf savvy marketing   shelf savvy tool booksIntro to shelf savvy marketing   shelf savvy tool books
Intro to shelf savvy marketing shelf savvy tool books
 
Shopper missions: The heart of any successful shopper strategy
Shopper missions: The heart of any successful shopper strategyShopper missions: The heart of any successful shopper strategy
Shopper missions: The heart of any successful shopper strategy
 
Conquering The Omnichannel Arena
Conquering The Omnichannel ArenaConquering The Omnichannel Arena
Conquering The Omnichannel Arena
 
Creating a truly personalized Omni-channel customer experience
Creating a truly personalized Omni-channel customer experienceCreating a truly personalized Omni-channel customer experience
Creating a truly personalized Omni-channel customer experience
 
The mars agency shopper trends 2015
The mars agency shopper trends 2015The mars agency shopper trends 2015
The mars agency shopper trends 2015
 
IQ Shopper Marketing
IQ Shopper MarketingIQ Shopper Marketing
IQ Shopper Marketing
 
Shopper Marketing
Shopper MarketingShopper Marketing
Shopper Marketing
 
Directions for the Future
Directions for the FutureDirections for the Future
Directions for the Future
 
新一代的电商模式
新一代的电商模式新一代的电商模式
新一代的电商模式
 
Omni- / Multi-Channel Retail - A.T. Kearney - Report - On Solid Ground
Omni- / Multi-Channel Retail - A.T. Kearney - Report - On Solid GroundOmni- / Multi-Channel Retail - A.T. Kearney - Report - On Solid Ground
Omni- / Multi-Channel Retail - A.T. Kearney - Report - On Solid Ground
 
Shopper marketing for retail net group feb 17, 2011
Shopper marketing for retail net group feb 17, 2011Shopper marketing for retail net group feb 17, 2011
Shopper marketing for retail net group feb 17, 2011
 
SJC 2013 Omni-channel insight report
SJC 2013 Omni-channel insight reportSJC 2013 Omni-channel insight report
SJC 2013 Omni-channel insight report
 
A Consumer's Path To Savings: The Role Of Flyers In Today's Digital World
A Consumer's Path To Savings: The Role Of Flyers In Today's Digital WorldA Consumer's Path To Savings: The Role Of Flyers In Today's Digital World
A Consumer's Path To Savings: The Role Of Flyers In Today's Digital World
 
How to use Point of Purchase (POP) Marketing to Influence your Customers
How to use Point of Purchase (POP) Marketing to Influence your CustomersHow to use Point of Purchase (POP) Marketing to Influence your Customers
How to use Point of Purchase (POP) Marketing to Influence your Customers
 
Booz GMA Shopper Marketing Overview
Booz GMA Shopper Marketing OverviewBooz GMA Shopper Marketing Overview
Booz GMA Shopper Marketing Overview
 
2016 Shopper Marketing Trends from The MARS Agency
2016 Shopper Marketing Trends from The MARS Agency2016 Shopper Marketing Trends from The MARS Agency
2016 Shopper Marketing Trends from The MARS Agency
 
Eommerce shopper-typologies-online
Eommerce shopper-typologies-onlineEommerce shopper-typologies-online
Eommerce shopper-typologies-online
 
Why a mobile retail strategy.pptx
Why a mobile retail strategy.pptxWhy a mobile retail strategy.pptx
Why a mobile retail strategy.pptx
 
569-870-1-PB
569-870-1-PB569-870-1-PB
569-870-1-PB
 

Similar to Media topline-final

"Shopper Marketing - Consumer Packaged Goods" Presentation 041912
"Shopper Marketing - Consumer Packaged Goods" Presentation 041912"Shopper Marketing - Consumer Packaged Goods" Presentation 041912
"Shopper Marketing - Consumer Packaged Goods" Presentation 041912Chicago AMA
 
brand managent-creating in store value
brand managent-creating in store valuebrand managent-creating in store value
brand managent-creating in store valuejustontime
 
Creating in-storevalue - Why& how
Creating in-storevalue - Why& howCreating in-storevalue - Why& how
Creating in-storevalue - Why& howjustontime
 
Yellowwood Engager 2012
Yellowwood Engager 2012Yellowwood Engager 2012
Yellowwood Engager 2012Yellowwood
 
INTERSHIP PPT.ppt
INTERSHIP PPT.pptINTERSHIP PPT.ppt
INTERSHIP PPT.pptDeep345747
 
INTERSHIP PPT.ppt
INTERSHIP PPT.pptINTERSHIP PPT.ppt
INTERSHIP PPT.pptDeep345747
 
business 123456.ppt
business 123456.pptbusiness 123456.ppt
business 123456.pptDeep345747
 
The Social Shopper: A Lens into the future of Retail Experiences
The Social Shopper: A Lens into the future of Retail ExperiencesThe Social Shopper: A Lens into the future of Retail Experiences
The Social Shopper: A Lens into the future of Retail ExperiencesDelvinia
 
REimagining the Retail Store: A White Paper on the Retail Industry
REimagining the Retail Store: A White Paper on the Retail IndustryREimagining the Retail Store: A White Paper on the Retail Industry
REimagining the Retail Store: A White Paper on the Retail IndustryLeo Burnett
 
Leo burnett the changing face of retail
Leo burnett   the changing face of retail Leo burnett   the changing face of retail
Leo burnett the changing face of retail Leo Burnett
 
CONSUMER MOTIVATION RESEARCH
CONSUMER MOTIVATION RESEARCH CONSUMER MOTIVATION RESEARCH
CONSUMER MOTIVATION RESEARCH T HARI KUMAR
 
Shopper Insights
Shopper InsightsShopper Insights
Shopper InsightsAnish Shah
 
Marketing to the Mobile Shopper
Marketing to the Mobile ShopperMarketing to the Mobile Shopper
Marketing to the Mobile ShopperLeo Burnett
 
5 things you need to know about selling to local consumers
5 things you need to know about selling to local consumers5 things you need to know about selling to local consumers
5 things you need to know about selling to local consumersStreet Fight
 
Mobile in retail and multi channel strategy - Lenati
Mobile in retail and multi channel strategy - LenatiMobile in retail and multi channel strategy - Lenati
Mobile in retail and multi channel strategy - LenatiArthur Megnin
 
Consumerbuyingbehaviorofmobilehandsets 101031011306-phpapp02
Consumerbuyingbehaviorofmobilehandsets 101031011306-phpapp02Consumerbuyingbehaviorofmobilehandsets 101031011306-phpapp02
Consumerbuyingbehaviorofmobilehandsets 101031011306-phpapp02faizsay
 
C Store Shopper Close Up-2012 Brochure
C Store Shopper Close Up-2012 BrochureC Store Shopper Close Up-2012 Brochure
C Store Shopper Close Up-2012 Brochurefglick
 
Dollar Store Shopper Close Up 2011 Prospectus
Dollar Store Shopper Close Up 2011 ProspectusDollar Store Shopper Close Up 2011 Prospectus
Dollar Store Shopper Close Up 2011 Prospectusfglick
 

Similar to Media topline-final (20)

"Shopper Marketing - Consumer Packaged Goods" Presentation 041912
"Shopper Marketing - Consumer Packaged Goods" Presentation 041912"Shopper Marketing - Consumer Packaged Goods" Presentation 041912
"Shopper Marketing - Consumer Packaged Goods" Presentation 041912
 
brand managent-creating in store value
brand managent-creating in store valuebrand managent-creating in store value
brand managent-creating in store value
 
Creating in-storevalue - Why& how
Creating in-storevalue - Why& howCreating in-storevalue - Why& how
Creating in-storevalue - Why& how
 
Yellowwood Engager 2012
Yellowwood Engager 2012Yellowwood Engager 2012
Yellowwood Engager 2012
 
INTERSHIP PPT.ppt
INTERSHIP PPT.pptINTERSHIP PPT.ppt
INTERSHIP PPT.ppt
 
INTERSHIP PPT.ppt
INTERSHIP PPT.pptINTERSHIP PPT.ppt
INTERSHIP PPT.ppt
 
business 123456.ppt
business 123456.pptbusiness 123456.ppt
business 123456.ppt
 
The Social Shopper: A Lens into the future of Retail Experiences
The Social Shopper: A Lens into the future of Retail ExperiencesThe Social Shopper: A Lens into the future of Retail Experiences
The Social Shopper: A Lens into the future of Retail Experiences
 
REimagining the Retail Store: A White Paper on the Retail Industry
REimagining the Retail Store: A White Paper on the Retail IndustryREimagining the Retail Store: A White Paper on the Retail Industry
REimagining the Retail Store: A White Paper on the Retail Industry
 
Leo burnett the changing face of retail
Leo burnett   the changing face of retail Leo burnett   the changing face of retail
Leo burnett the changing face of retail
 
The Engaged Buyer
The Engaged BuyerThe Engaged Buyer
The Engaged Buyer
 
CONSUMER MOTIVATION RESEARCH
CONSUMER MOTIVATION RESEARCH CONSUMER MOTIVATION RESEARCH
CONSUMER MOTIVATION RESEARCH
 
Shopper Insights
Shopper InsightsShopper Insights
Shopper Insights
 
Marketing to the Mobile Shopper
Marketing to the Mobile ShopperMarketing to the Mobile Shopper
Marketing to the Mobile Shopper
 
Omnichannel commerce
Omnichannel commerceOmnichannel commerce
Omnichannel commerce
 
5 things you need to know about selling to local consumers
5 things you need to know about selling to local consumers5 things you need to know about selling to local consumers
5 things you need to know about selling to local consumers
 
Mobile in retail and multi channel strategy - Lenati
Mobile in retail and multi channel strategy - LenatiMobile in retail and multi channel strategy - Lenati
Mobile in retail and multi channel strategy - Lenati
 
Consumerbuyingbehaviorofmobilehandsets 101031011306-phpapp02
Consumerbuyingbehaviorofmobilehandsets 101031011306-phpapp02Consumerbuyingbehaviorofmobilehandsets 101031011306-phpapp02
Consumerbuyingbehaviorofmobilehandsets 101031011306-phpapp02
 
C Store Shopper Close Up-2012 Brochure
C Store Shopper Close Up-2012 BrochureC Store Shopper Close Up-2012 Brochure
C Store Shopper Close Up-2012 Brochure
 
Dollar Store Shopper Close Up 2011 Prospectus
Dollar Store Shopper Close Up 2011 ProspectusDollar Store Shopper Close Up 2011 Prospectus
Dollar Store Shopper Close Up 2011 Prospectus
 

Recently uploaded

8447779800, Low rate Call girls in New Ashok Nagar Delhi NCR
8447779800, Low rate Call girls in New Ashok Nagar Delhi NCR8447779800, Low rate Call girls in New Ashok Nagar Delhi NCR
8447779800, Low rate Call girls in New Ashok Nagar Delhi NCRashishs7044
 
Kenya’s Coconut Value Chain by Gatsby Africa
Kenya’s Coconut Value Chain by Gatsby AfricaKenya’s Coconut Value Chain by Gatsby Africa
Kenya’s Coconut Value Chain by Gatsby Africaictsugar
 
Intro to BCG's Carbon Emissions Benchmark_vF.pdf
Intro to BCG's Carbon Emissions Benchmark_vF.pdfIntro to BCG's Carbon Emissions Benchmark_vF.pdf
Intro to BCG's Carbon Emissions Benchmark_vF.pdfpollardmorgan
 
NewBase 19 April 2024 Energy News issue - 1717 by Khaled Al Awadi.pdf
NewBase  19 April  2024  Energy News issue - 1717 by Khaled Al Awadi.pdfNewBase  19 April  2024  Energy News issue - 1717 by Khaled Al Awadi.pdf
NewBase 19 April 2024 Energy News issue - 1717 by Khaled Al Awadi.pdfKhaled Al Awadi
 
Digital Transformation in the PLM domain - distrib.pdf
Digital Transformation in the PLM domain - distrib.pdfDigital Transformation in the PLM domain - distrib.pdf
Digital Transformation in the PLM domain - distrib.pdfJos Voskuil
 
Buy gmail accounts.pdf Buy Old Gmail Accounts
Buy gmail accounts.pdf Buy Old Gmail AccountsBuy gmail accounts.pdf Buy Old Gmail Accounts
Buy gmail accounts.pdf Buy Old Gmail AccountsBuy Verified Accounts
 
8447779800, Low rate Call girls in Shivaji Enclave Delhi NCR
8447779800, Low rate Call girls in Shivaji Enclave Delhi NCR8447779800, Low rate Call girls in Shivaji Enclave Delhi NCR
8447779800, Low rate Call girls in Shivaji Enclave Delhi NCRashishs7044
 
Call Girls Miyapur 7001305949 all area service COD available Any Time
Call Girls Miyapur 7001305949 all area service COD available Any TimeCall Girls Miyapur 7001305949 all area service COD available Any Time
Call Girls Miyapur 7001305949 all area service COD available Any Timedelhimodelshub1
 
Call US-88OO1O2216 Call Girls In Mahipalpur Female Escort Service
Call US-88OO1O2216 Call Girls In Mahipalpur Female Escort ServiceCall US-88OO1O2216 Call Girls In Mahipalpur Female Escort Service
Call US-88OO1O2216 Call Girls In Mahipalpur Female Escort Servicecallgirls2057
 
Marketplace and Quality Assurance Presentation - Vincent Chirchir
Marketplace and Quality Assurance Presentation - Vincent ChirchirMarketplace and Quality Assurance Presentation - Vincent Chirchir
Marketplace and Quality Assurance Presentation - Vincent Chirchirictsugar
 
Organizational Structure Running A Successful Business
Organizational Structure Running A Successful BusinessOrganizational Structure Running A Successful Business
Organizational Structure Running A Successful BusinessSeta Wicaksana
 
Investment in The Coconut Industry by Nancy Cheruiyot
Investment in The Coconut Industry by Nancy CheruiyotInvestment in The Coconut Industry by Nancy Cheruiyot
Investment in The Coconut Industry by Nancy Cheruiyotictsugar
 
Call Us 📲8800102216📞 Call Girls In DLF City Gurgaon
Call Us 📲8800102216📞 Call Girls In DLF City GurgaonCall Us 📲8800102216📞 Call Girls In DLF City Gurgaon
Call Us 📲8800102216📞 Call Girls In DLF City Gurgaoncallgirls2057
 
Flow Your Strategy at Flight Levels Day 2024
Flow Your Strategy at Flight Levels Day 2024Flow Your Strategy at Flight Levels Day 2024
Flow Your Strategy at Flight Levels Day 2024Kirill Klimov
 
(Best) ENJOY Call Girls in Faridabad Ex | 8377087607
(Best) ENJOY Call Girls in Faridabad Ex | 8377087607(Best) ENJOY Call Girls in Faridabad Ex | 8377087607
(Best) ENJOY Call Girls in Faridabad Ex | 8377087607dollysharma2066
 
The CMO Survey - Highlights and Insights Report - Spring 2024
The CMO Survey - Highlights and Insights Report - Spring 2024The CMO Survey - Highlights and Insights Report - Spring 2024
The CMO Survey - Highlights and Insights Report - Spring 2024christinemoorman
 
Islamabad Escorts | Call 03274100048 | Escort Service in Islamabad
Islamabad Escorts | Call 03274100048 | Escort Service in IslamabadIslamabad Escorts | Call 03274100048 | Escort Service in Islamabad
Islamabad Escorts | Call 03274100048 | Escort Service in IslamabadAyesha Khan
 
Kenya Coconut Production Presentation by Dr. Lalith Perera
Kenya Coconut Production Presentation by Dr. Lalith PereraKenya Coconut Production Presentation by Dr. Lalith Perera
Kenya Coconut Production Presentation by Dr. Lalith Pereraictsugar
 
Lowrate Call Girls In Sector 18 Noida ❤️8860477959 Escorts 100% Genuine Servi...
Lowrate Call Girls In Sector 18 Noida ❤️8860477959 Escorts 100% Genuine Servi...Lowrate Call Girls In Sector 18 Noida ❤️8860477959 Escorts 100% Genuine Servi...
Lowrate Call Girls In Sector 18 Noida ❤️8860477959 Escorts 100% Genuine Servi...lizamodels9
 
8447779800, Low rate Call girls in Saket Delhi NCR
8447779800, Low rate Call girls in Saket Delhi NCR8447779800, Low rate Call girls in Saket Delhi NCR
8447779800, Low rate Call girls in Saket Delhi NCRashishs7044
 

Recently uploaded (20)

8447779800, Low rate Call girls in New Ashok Nagar Delhi NCR
8447779800, Low rate Call girls in New Ashok Nagar Delhi NCR8447779800, Low rate Call girls in New Ashok Nagar Delhi NCR
8447779800, Low rate Call girls in New Ashok Nagar Delhi NCR
 
Kenya’s Coconut Value Chain by Gatsby Africa
Kenya’s Coconut Value Chain by Gatsby AfricaKenya’s Coconut Value Chain by Gatsby Africa
Kenya’s Coconut Value Chain by Gatsby Africa
 
Intro to BCG's Carbon Emissions Benchmark_vF.pdf
Intro to BCG's Carbon Emissions Benchmark_vF.pdfIntro to BCG's Carbon Emissions Benchmark_vF.pdf
Intro to BCG's Carbon Emissions Benchmark_vF.pdf
 
NewBase 19 April 2024 Energy News issue - 1717 by Khaled Al Awadi.pdf
NewBase  19 April  2024  Energy News issue - 1717 by Khaled Al Awadi.pdfNewBase  19 April  2024  Energy News issue - 1717 by Khaled Al Awadi.pdf
NewBase 19 April 2024 Energy News issue - 1717 by Khaled Al Awadi.pdf
 
Digital Transformation in the PLM domain - distrib.pdf
Digital Transformation in the PLM domain - distrib.pdfDigital Transformation in the PLM domain - distrib.pdf
Digital Transformation in the PLM domain - distrib.pdf
 
Buy gmail accounts.pdf Buy Old Gmail Accounts
Buy gmail accounts.pdf Buy Old Gmail AccountsBuy gmail accounts.pdf Buy Old Gmail Accounts
Buy gmail accounts.pdf Buy Old Gmail Accounts
 
8447779800, Low rate Call girls in Shivaji Enclave Delhi NCR
8447779800, Low rate Call girls in Shivaji Enclave Delhi NCR8447779800, Low rate Call girls in Shivaji Enclave Delhi NCR
8447779800, Low rate Call girls in Shivaji Enclave Delhi NCR
 
Call Girls Miyapur 7001305949 all area service COD available Any Time
Call Girls Miyapur 7001305949 all area service COD available Any TimeCall Girls Miyapur 7001305949 all area service COD available Any Time
Call Girls Miyapur 7001305949 all area service COD available Any Time
 
Call US-88OO1O2216 Call Girls In Mahipalpur Female Escort Service
Call US-88OO1O2216 Call Girls In Mahipalpur Female Escort ServiceCall US-88OO1O2216 Call Girls In Mahipalpur Female Escort Service
Call US-88OO1O2216 Call Girls In Mahipalpur Female Escort Service
 
Marketplace and Quality Assurance Presentation - Vincent Chirchir
Marketplace and Quality Assurance Presentation - Vincent ChirchirMarketplace and Quality Assurance Presentation - Vincent Chirchir
Marketplace and Quality Assurance Presentation - Vincent Chirchir
 
Organizational Structure Running A Successful Business
Organizational Structure Running A Successful BusinessOrganizational Structure Running A Successful Business
Organizational Structure Running A Successful Business
 
Investment in The Coconut Industry by Nancy Cheruiyot
Investment in The Coconut Industry by Nancy CheruiyotInvestment in The Coconut Industry by Nancy Cheruiyot
Investment in The Coconut Industry by Nancy Cheruiyot
 
Call Us 📲8800102216📞 Call Girls In DLF City Gurgaon
Call Us 📲8800102216📞 Call Girls In DLF City GurgaonCall Us 📲8800102216📞 Call Girls In DLF City Gurgaon
Call Us 📲8800102216📞 Call Girls In DLF City Gurgaon
 
Flow Your Strategy at Flight Levels Day 2024
Flow Your Strategy at Flight Levels Day 2024Flow Your Strategy at Flight Levels Day 2024
Flow Your Strategy at Flight Levels Day 2024
 
(Best) ENJOY Call Girls in Faridabad Ex | 8377087607
(Best) ENJOY Call Girls in Faridabad Ex | 8377087607(Best) ENJOY Call Girls in Faridabad Ex | 8377087607
(Best) ENJOY Call Girls in Faridabad Ex | 8377087607
 
The CMO Survey - Highlights and Insights Report - Spring 2024
The CMO Survey - Highlights and Insights Report - Spring 2024The CMO Survey - Highlights and Insights Report - Spring 2024
The CMO Survey - Highlights and Insights Report - Spring 2024
 
Islamabad Escorts | Call 03274100048 | Escort Service in Islamabad
Islamabad Escorts | Call 03274100048 | Escort Service in IslamabadIslamabad Escorts | Call 03274100048 | Escort Service in Islamabad
Islamabad Escorts | Call 03274100048 | Escort Service in Islamabad
 
Kenya Coconut Production Presentation by Dr. Lalith Perera
Kenya Coconut Production Presentation by Dr. Lalith PereraKenya Coconut Production Presentation by Dr. Lalith Perera
Kenya Coconut Production Presentation by Dr. Lalith Perera
 
Lowrate Call Girls In Sector 18 Noida ❤️8860477959 Escorts 100% Genuine Servi...
Lowrate Call Girls In Sector 18 Noida ❤️8860477959 Escorts 100% Genuine Servi...Lowrate Call Girls In Sector 18 Noida ❤️8860477959 Escorts 100% Genuine Servi...
Lowrate Call Girls In Sector 18 Noida ❤️8860477959 Escorts 100% Genuine Servi...
 
8447779800, Low rate Call girls in Saket Delhi NCR
8447779800, Low rate Call girls in Saket Delhi NCR8447779800, Low rate Call girls in Saket Delhi NCR
8447779800, Low rate Call girls in Saket Delhi NCR
 

Media topline-final

  • 1. 2012 SHOPPER ENGAGEMENT STUDY MEDIA TOPLINE REPORT
  • 2. THE NEW SHOPPER JOURNEY More Decisions Are Being Made In-Store Than Ever Before Understanding the needs, purchasing behavior, and changing lifestyles of today’s shopper is critical in being able to deliver on their immediate and future needs. While it’s true that a As far back as the 1960’s, POPAI’s constituents had shopper’s decisions are no longer limited to in-store, POPAI’s 2012 Shopper Engagement the insight to know that they needed to understand Study finds that now more than ever shoppers are making an overwhelming number of the buying behaviors of shoppers in order to affect their purchasing decisions in-store. In fact, the in-store decision rate has climbed from 70% in 1995 to 76% in 2012. With today’s shopper being increasingly mobile, social and their purchase decisions through point of purchase in control what exactly has changed to push the in-store decision rate to an all time high? displays. Since then, every decade POPAI has There’s no denying that the shoppers’ path to purchase is considerably different today conducted a study that tells the story of how shoppers than it was for the shopper of yesteryear. With the advent of smartphones, shopping shop. This is the story of today’s shopper. apps, mobile coupons, and myriad other innovations, how can it not be? Yet, when we look at the data from POPAI’s series of long running shopper research projects aimed at providing new information on how shoppers behave when they are in different types of stores deciding which categories and brands to buy we see that it all comes down to on thing – in-store marketing. POPAI has a long history of fielding research around the effectiveness of displays and measuring the in-store decision rate, which creates quite the compelling case for investing in the in-store environment. Comprised of three key components, the in-store decision rate factors in generally planned purchases, brand substitution, and unplanned purchases to determine the true number of decisions being made at the shelf. Moreover, the data shows us that an important part of the marketing mix is the use of materials and devices that stimulate sales where the action is – the point of purchase. Often the decision- making process of shoppers does not occur until they actually see a product in the store. Therefore, the way a product is displayed in a store and is supported by in-store marketing materials can often be instrumental in leveraging sales. In this report you will find a top line summary of how shoppers are interacting with the in-store environment and how in-store marketing is playing a crucial role in today’s shopper journey. POPAI’S HIERARCHY OF SHOPPERS’ NEW BEHAVIORS >> Like to get exactly what they set out for Complete the >> Aim is to complete shopping trip task at hand >> Nearly half of all shoppers use pre-store media to plan their trip. Research and >> A large majority create a shopping list whether mental, handwritten, or digital. plan the trip >> Enjoys seeing what new products are available while shopping the store. Finding inspiration >> Enjoys getting meal ideas while grocery shopping. and solutions >> Overall fresh food quality, good service, quick checkout and value are the most important considerations for Product offering shoppers when choosing a retailer. and selection >> Willing to wait for sales >> Will shop multiple retailers for best prices Seeking better value 2 POINT OF PURCHASE ADVERTISING INTERNATIONAL | 2012 SHOPPER ENGAGEMENT STUDY
  • 3. UNDERSTANDING TODAY’S SHOPPER A Look At The Unique Shopper Profiles When shoppers walk into a supermarket, they do not just reveal where they like to buy their food but also a whole host of lifestyle values, from what they read and watch to what they SHOPPER SEGMENTS like doing in their spare time. But as POPAI’s Shopper Engagement Study proves, today it is increasingly difficult for retailers and brand manufacturers to shoe-horn their customers into one specific group. 22% 26% Time Stressed Our predictive shopper profiles contain insights on what shoppers like – based on their stated preferences, their browsing habits, and the products that they actually purchase or Explorer abandon in their shopping trips. Trip Planner Shoppers are clustered into segments to understand the attributes and characteristics that are most important to individuals as they decide where to shop. Shoppers were asked 23% Bargain Hunter to rate their level of agreement with a broad set of lifestyle and shopping characteristics 29% on a five-point scale. Using factor analysis we are able to create shopper groups based on these lifestyle and shopping statements. These factor groupings form the basis of the creation of shopper segments, which can be analyzed for shopping behavior patterns, price sensitivity, retailer preferences, retailer loyalty, demographic differences, and opportunities for conversion. These segments have unique attitudes and behaviors as they relate to their shopping patterns and retailer selection. So what shopper profiles have emerged with regards to today’s shoppers? The study revealed four basic profiles in shoppers’ paths to purchase across all the supermarkets we conducted the study in. TIME STRESSED EXPLORER TRIP PLANNER BARGAIN HUNTER I need to get in and get out. I want to be inspired. My trip is always organized. I’m looking for a good deal. Shopper who feels pressured A shopper who enjoys seeing A shopper whose goal is to get A shopper defined by the from not having enough time and what new products are available, the shopping trip over with and willingness to shop around for the seems to be always in a hurry. browsing the store in general and executed according to plan lowest price • Skews male and older (55+) • Least retailer loyal Adding to the time pressures are getting inspiration for meals while • Low circular use • Highest circular use perceived budgetary constraints shopping. • Most retailer loyal • Highest coupon use although this group is not low • Skews older (55+) and • Most consistent use of • Most likely to use pre store income. lower income (<45K) written list media to plan trip • Skews younger (18-44) and • Heavy use of circulars to • Not interested in bargain • The least satisfied shopper full time employed drive retailer choice hunting on overall satisfaction • Doesn’t use circulars or • High receptivity to stores • Describes self as controlled • Skews “taking care of the coupons with quality private label and restrained household” • Describes self as easily products as well as per- • Most accurate in predicting • Most likely to NOT purchase tempted ceived variety of product total spend an item (s)he planned to buy • Likely to be shopping with types and package sizes • Lowest percent impulse pre store children • The most satisfied shopper basket (67%) • Lowest total basket average • Least consistent use of on for overall satisfaction • Fewest number of trips per ($54) written list • Describes self as impulsive week • Second highest percent and easily tempted • Shortest time in store basket purchased on • Highest percent impulse impulse (70%) basket (72%) • Highest total basket • Makes most weekly trips • Spend longest time in store average ($67) POINT OF PURCHASE ADVERTISING INTERNATIONAL | 2012 SHOPPER ENGAGEMENT STUDY 3
  • 4. Anatomy Of The In-Store Decision Where Shoppers Are Making Purchasing Decisions In order to understand today’s shopper and better serve their needs, marketers have to first understand how and where shoppers are making a majority of their purchase decisions. To this end, POPAI has developed the in-store decision rate, which dates back to 1965. Purchases are broken down into four different categories and the in-store decision rate is one of the most reliable measures because it is based upon a pre and post shopping interviews -- what the shopper anticipates to purchase versus what they actually purchase. The four categories that purchases are classified into are: SPECIFICALLY PLANNED Purchases the shopper specifically identified by name in a pre-shopping interview and bought. GENERALLY PLANNED Purchases that were referred to generically in a pre-shopping interview, but not bought by brand. UNPLANNED Purchases that were not mentioned in the pre-shopping interview and bought on impulse. Purchases that were specifically identified by name in a pre-shopping interview, but actual purchase reflected SUBSTITUTES a substitute of brand or product. The in-store decision rate is calculated by taking the sum of the purchases that fall under Generally Planned, Unplanned, and Substitutes categories. Today the in-store decision rate has reached an all time high of 76%. Shoppers are specifically planning less and deciding more at the shelf, suggesting today’s shopper is more flexible than ever. Notably, unplanned decisions are down suggesting more pre-store planning at the category level is being conducted. And when shoppers did make an impulse purchase most claimed that the purchase stemmed from remembering that they needed or wanted an item once in the store with taking advantage of a sale as the second most cited reason for making an unplanned purchase. TODAY’S SUPERMARKET BUYING HABITS SUPERMARKET BUYING HABITS OVER THE DECADES A look at the in-store decision rate for today‘s shopper A look at the in-store decision rate over the past 60 Years UNPLANNED PURCHASE BRAND SWITCH GENERALLY PLANNED SPECIFICALLY PLANNED UNPLANNED PURCHASE BRAND SWITCH GENERALLY PLANNED SPECIFICALLY PLANNED In-Store Decision Rate In-Store Decision Rate Supermarket - 1965 Supermarket - 1977 31.1% 24% 35.2% 49.9% 46.8% 17.2% 55% 1.8% 3.2% 14.8% RESULTS 68.9% RESULTS 64.8% 15% In-Store Decision Rate In-Store Decision Rate Supermarket - 1986 Supermarket - 1995 6% 33.9% 30% 52.6% 60% 6% 10.6% 76% 2.9% 4% RESULTS RESULTS 66.1% RESULTS 70% 4 POINT OF PURCHASE ADVERTISING INTERNATIONAL | 2012 SHOPPER ENGAGEMENT STUDY
  • 5. On Display And In The Basket The Efficacy Of In-Store Displays Thousands of brands fill the shelves of today’s supermarket. A major part of this research was to audit the stores where interviewing was being conducted on that date. A number of details were recorded about each in-store display that was discovered. Some of these details included: type of display, location within the store, and the product that it was for. On average, 150 pieces of P.O.P. were observed in each store. Half of surveyed shoppers indicated that they recalled at least one display seen during their shopping trip with endcap and free standing displays being recalled most frequently. Additionally, 13% of all eye-fixations recorded were drawn to in-store displays. At first glance this may not seem like a significant number, but in the field of eye-tracking and neuroscience it is quite high. More than 1 in 6 purchases are made when a display with that brand is present in store. In 1995, 47% of displays were placed in secondary locations. By 2012, this number has risen to 60% as retailers have embraced the notion of cross promoting items and locating displays away from the home aisle. KING OF THE AISLE ALL EYES ON THE DISPLAY A look at the display types dominating in-store A look at the Fixation Rates of shoppers 13% 10% 12% 44% 34% 51% of Eye-Fixations were made to In-store Displays End Caps Power Wing and breakdown by type catching the shoppers eyes can be seen to the right. In Line Floor Stands 35% LOCATION, LOCATION, LOCATION A look at where displays are popping up in the supermarket End of Aisle 42% In Aisle 28% 3% 2% Perimeter 23% FLOORSTANDS ENDCAP POWERWING/ INLINE/ SIDEKICK GONDOLA Front End 7% POINT OF PURCHASE ADVERTISING INTERNATIONAL | 2012 SHOPPER ENGAGEMENT STUDY 5
  • 6. THE METHODOLOGY A New And Innovative Approach POPAI fielded its most recent study beginning in the fall of 2011 and concluding in March POPAI’s Shopper Engagement Study is an update to the 1995 2012, which was fully funded by the association. In-store intercept interviews were Consumer Buying Habits Study. The Shopper Engagement conducted with 2400 shoppers across the four broad U.S. census regions. In addition, a Study is comprised of two concurrently executed research subset of 210 shoppers were recruited to participate in the EEG/Eye-tracking portion of the modules. The Core Methodology included pre and post study. shopping interview formats with 2400 shoppers. The Secondary Module incorporates portable electroencephalography (EEG) CORE METHODOLOGY equipment, worn by respondents while they shop. This is SAMPLE A total sample of 2400 supermarket shoppers was interviewed for the core methodology. combined with eye tracking to tie shoppers’ physiological The study was executed across the four (4) broad US geographic census regions. The responses to exactly what they are looking at, eliminating such number of interviews conducted per region closely reflected a census balanced sample. issues as recall and denial. The study was conducted across twelve major supermarket banners. These outlets were large, high-volume stores selected from leading chains and were evenly divided among the four (4) geographic census regions. SHOPPER INTERCEPT INTERVIEWS Supermarket shoppers were randomly intercepted and screened at the entrance of each store location for being at least 18 years of age and on a routine stock up or fill in trip. These interviews were conducted across all day parts and all days of the week. The 10-minute entry interview gathered information on: • Planned purchases (unaided category and brand planning) • Any pre-store path-to-purchase activities shopper engaged in for planned purchases and in general • Amount budgeted/expect to spend for planned items and total basket • General shopping behaviors in channel • Demographics and profiling information Upon completion of the entry interview, shoppers were asked to return to the researchers after they completed their shopping trip for a 15-20 minute post-shopping interview. A $25 store gift card incentive was provided to each shopper who returned and completed the post-shop interview. Shoppers also agreed to have information on all of their purchased products recorded. The record of all purchases for each shopper was obtained through electronic capture of register receipts. After completing their shopping trip and checking out the ethnographer then conducted the exit interview and recorded products and brands purchased from shopper’s entire basket. The exit interview gathered information on: • Products purchased (category and brand level information) • Coupon, circular, mobile phone use, etc. used in purchase decisions • Recall/awareness of displays for product purchases • Attitudes and perceptions towards retail environment and specific categories. Each shopper was probed on at least three high volume categories - e.g. salty snacks, CSD, etc – so that expanded category specific insights could be provided. • Total amount spent and by category. • Method of payment STORE AUDIT Each day an audit of specific display types throughout the store was conducted prior to the start of interviewing. The purpose of the store audit was to record and identify the display materials for which to measure impact on decision-making and emotional response. The audit included photos of each display logged as well as coding of the following information: Display Type: Location of each display: Other variables: • Floorstands • End of aisle (front or back) • Category and brand the display is advertising • Endcaps • Perimeter/racetrack • Static vs. motion • Powerwings/sidekicks • In-aisle • Product on it vs. no product • In-line/gondola/full-line merchandisers • Front end • Whether it is interactive (specialty) Placement of display: • Whether it has video or audio • In-store media • Primary • Digital signage • Secondary 6 POINT OF PURCHASE ADVERTISING INTERNATIONAL | 2012 SHOPPER ENGAGEMENT STUDY
  • 7. THE METHODOLOGY A New And Innovative Approach SECONDARY METHODOLOGY individual to interpret what he/she sees. With Sands Research proprietary brain As an overlay to the core methodology, POPAI utilized mobile eye-tracking and imaging software, we measured activity in the orbital frontal lobe and displayed EEG on a sub-set of shoppers to understand the following: those results second by second in real time. Additionally, results of what • Degree to which displays (as defined earlier) make it into shoppers’ line percentage of the total study population viewed and which part of the design of sight. presentation achieved the largest response. This was achieved by marking • Identify the display types and locations that generate the most impressions when the participant fixates on a specific product or component with a unique and greatest activation. event code. This allows for analysis to sort and group responses based on that • Amount/percentage of time spent engaging with these displays (by audit unique event code. variables such as display type, location, and placement). • Degree to which these displays are noticed, stopped at, interacted with PARAMETERS AND PROCEDURES and drive purchases. Utilizing a neuromarketing analysis framework the responses of all 210 • What is the emotional response (valence) to these displays? participants was directly recorded combining EEG and eye-tracking in a real • What is the shopper’s track or path throughout the store? world environment and in real-time. The in-depth study included 64 channels • What are the search patterns and navigational strategies shoppers use of EEG data along with eye-tracking. While the eye-tracking data can provide to find and select products? How much time is spent considering these interesting insights, its inclusion with EEG data allows the brain activity to be categories? synchronized with specific objects of interest that the participant is fixating on. SAMPLE The testing parameters and procedures for the retail EEG/Eye- tracking were Traditional primary research methods measure introspective opinions. They rely as follows: on techniques such as surveys or facilitated focus groups. These measures • The sample consisted of 210 participants within the market segments of require a large sample size in order to ensure valid results. interest. • Individuals were recruited to participate in the study. Participants were The individual responses analyzed with the secondary methodology exhibit low staggered at 45 or 60-minute intervals to reduce flow congestion. variability within a specified demographic. In order for us to achieve the linkage • Two acquisition teams were deployed into the field into separate markets between the core methodology and secondary methodology the sub-set of eye- simultaneously. tracked shoppers came from the pool of in-store interviews conducted in the core methodology. Shoppers were not forced to view any specific displays so Participants were prepped using the following planned sequence: as to not create bias. 1. Pre-testing 2. EEG and Eye-tracking prep A sample of 210 study participants evenly spread across the four (4) census 3. Recording EEG & Eye-tracking data across 20+ categories regions yielded stable and valid results. 4. Removal of equipment 5. Post questioning sequence ELECTROENCEPHALOGRAM DATA 6. Issued incentive The primary research tool utilized in the secondary methodology of the study was high-density Electroencephalogram (EEG) data. When groups of neurons SIGNIFICANCE OF METHODOLOGY are activated in the brain, a small electrical charge is generated, resulting in an This research project is the first of it’s kind in both size and breadth to be electrical field. EEG is a method that is used to measure these fields by placing conducted utilizing such a wide range of data gathering techniques. The electrodes on a person’s scalp. The measured signals are then amplified for triangulation of data and insights sourced from one sample of shoppers in a live analysis. retail environment has never been achieved before to this degree, which will be especially relevant in a sea of emerging shopper insights research from a These electrical fields were interpreted and projected onto a high-resolution, myriad of sources. There is little doubt that the results from the study will prove three-dimensional representation of a brain. The result is the ability to determine to be a solid framework through which future shopper market research should what areas of the brain are activated at specific moments. be conducted to get a more accurate and complete picture of shopping patterns and behaviors. Utilizing a standard mobile EEG framework, the testing procedures followed advanced neuroscience-based acquisition and analysis protocol. By running one participant at a time the study was able to maintain absolute quality of EEG data to ensure effective and valid results with statistical confidence. SYNCHRONIZED EYE-TRACKING The use of eye-tracking data is common in market research studies. However, adding a real-time interpretation of the brains response to a specific instant in a recording, to interpret why a subject is looking at a target, is not. Correlating EEG and eye-tracking data allows for a time-locked analysis of how shopper interaction plays into the perception of the presented material. By utilizing traditional methods of market research as well as brain response tied to eye-tracking we were able to relate unparalleled accuracy in actual shopper experience. With eye-tracking and statistical analysis combined with the EEG recording, we were able to evaluate how much effortful processing is necessary for an POINT OF PURCHASE ADVERTISING INTERNATIONAL | 2012 SHOPPER ENGAGEMENT STUDY 7