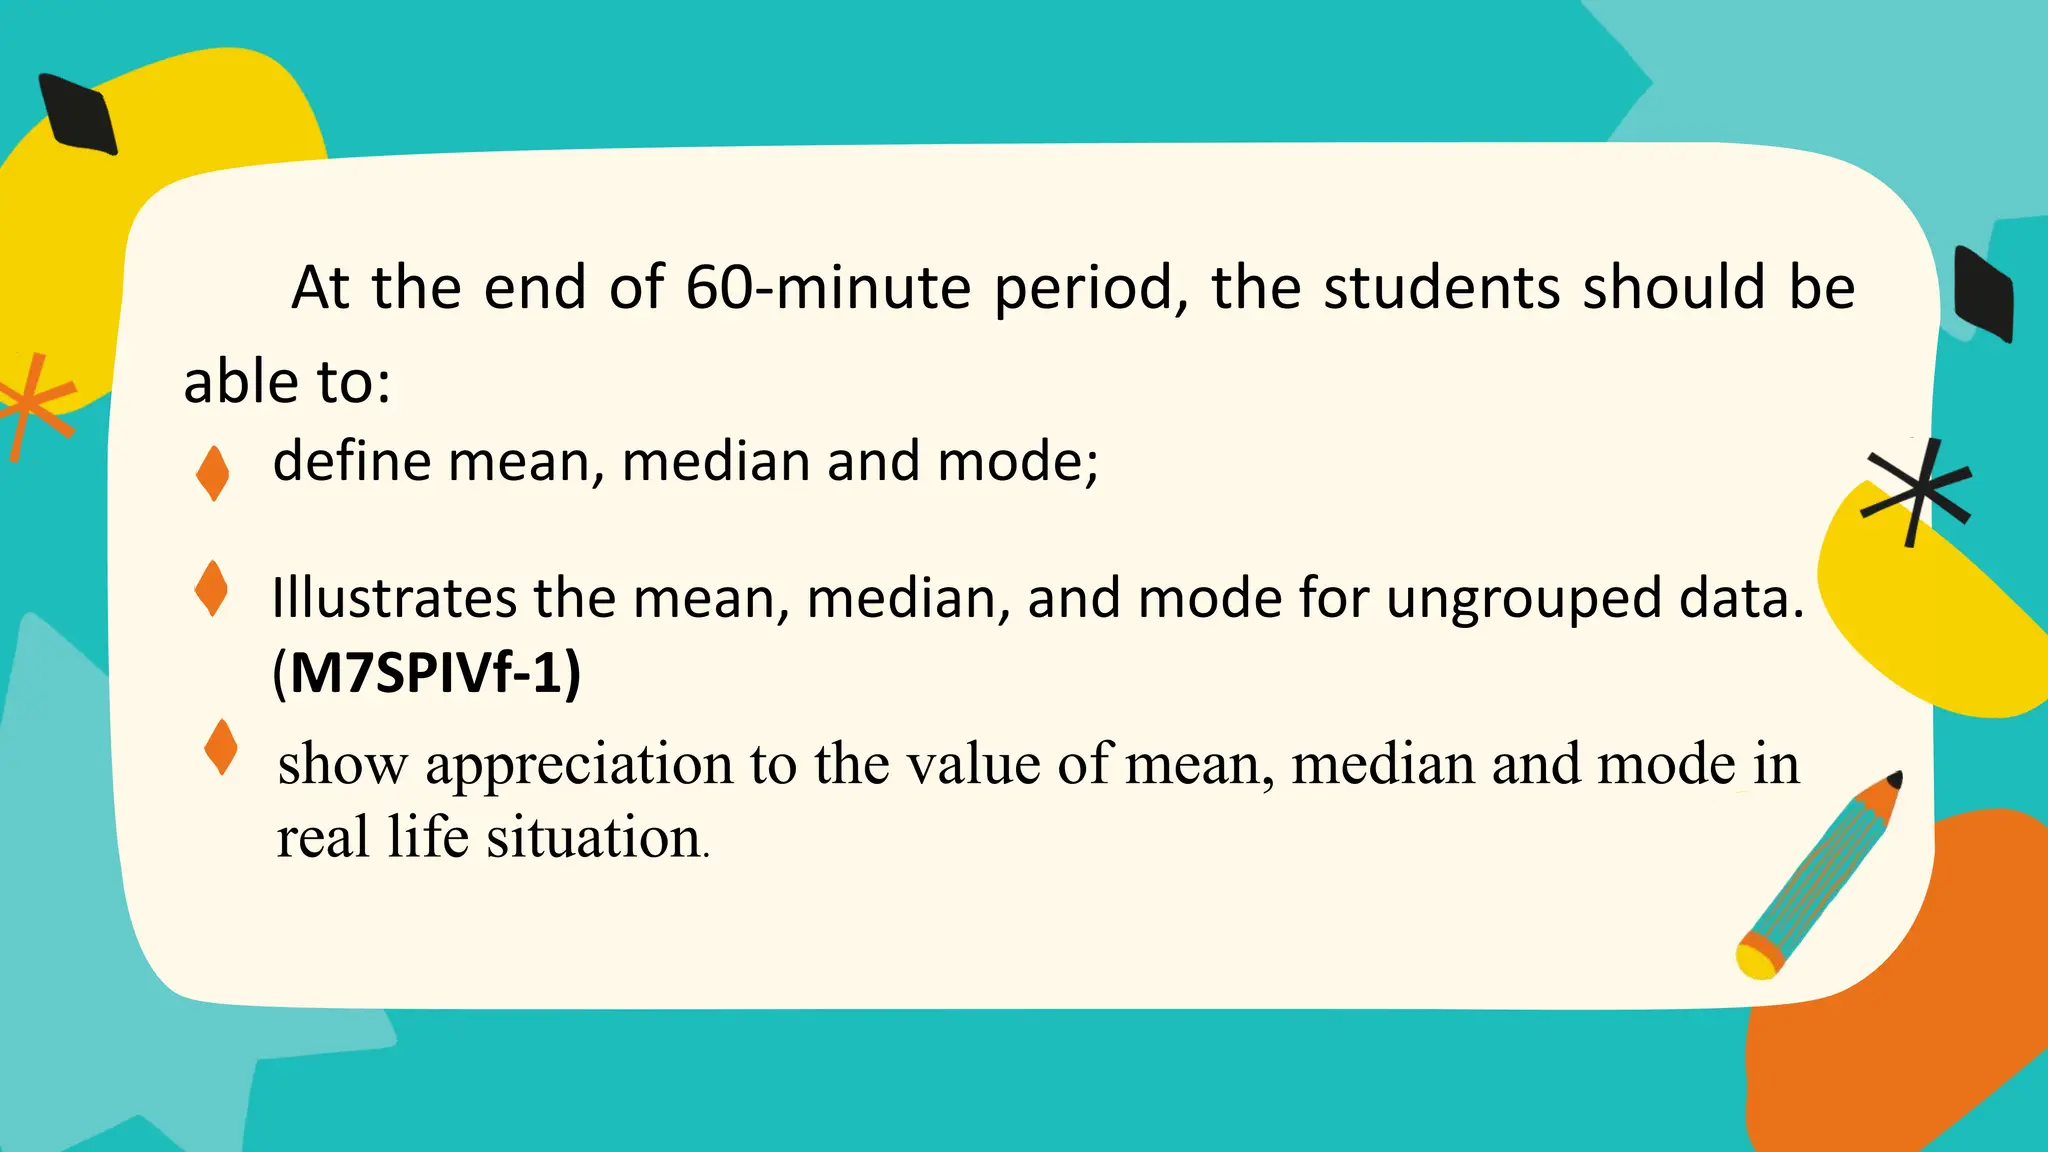
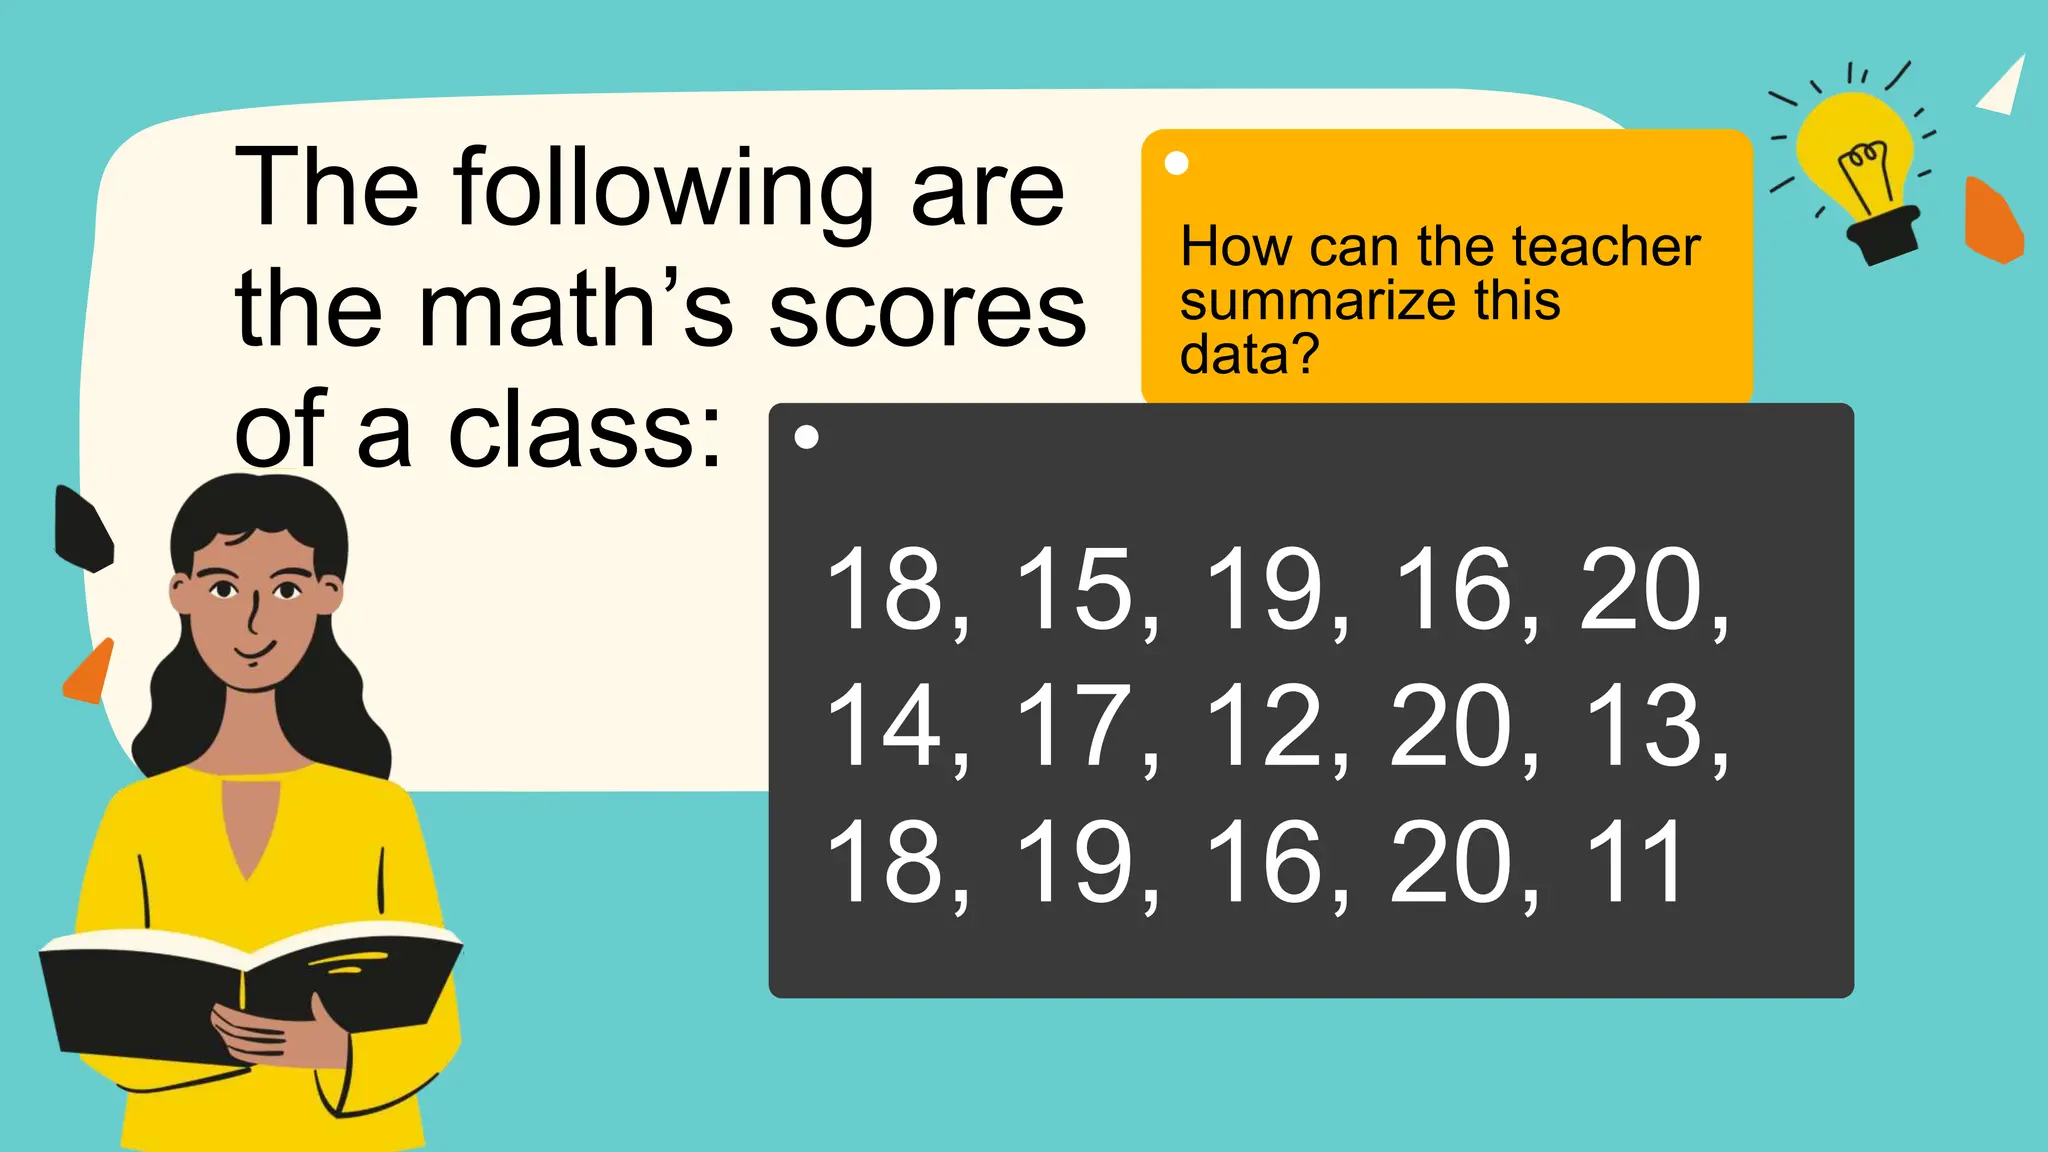
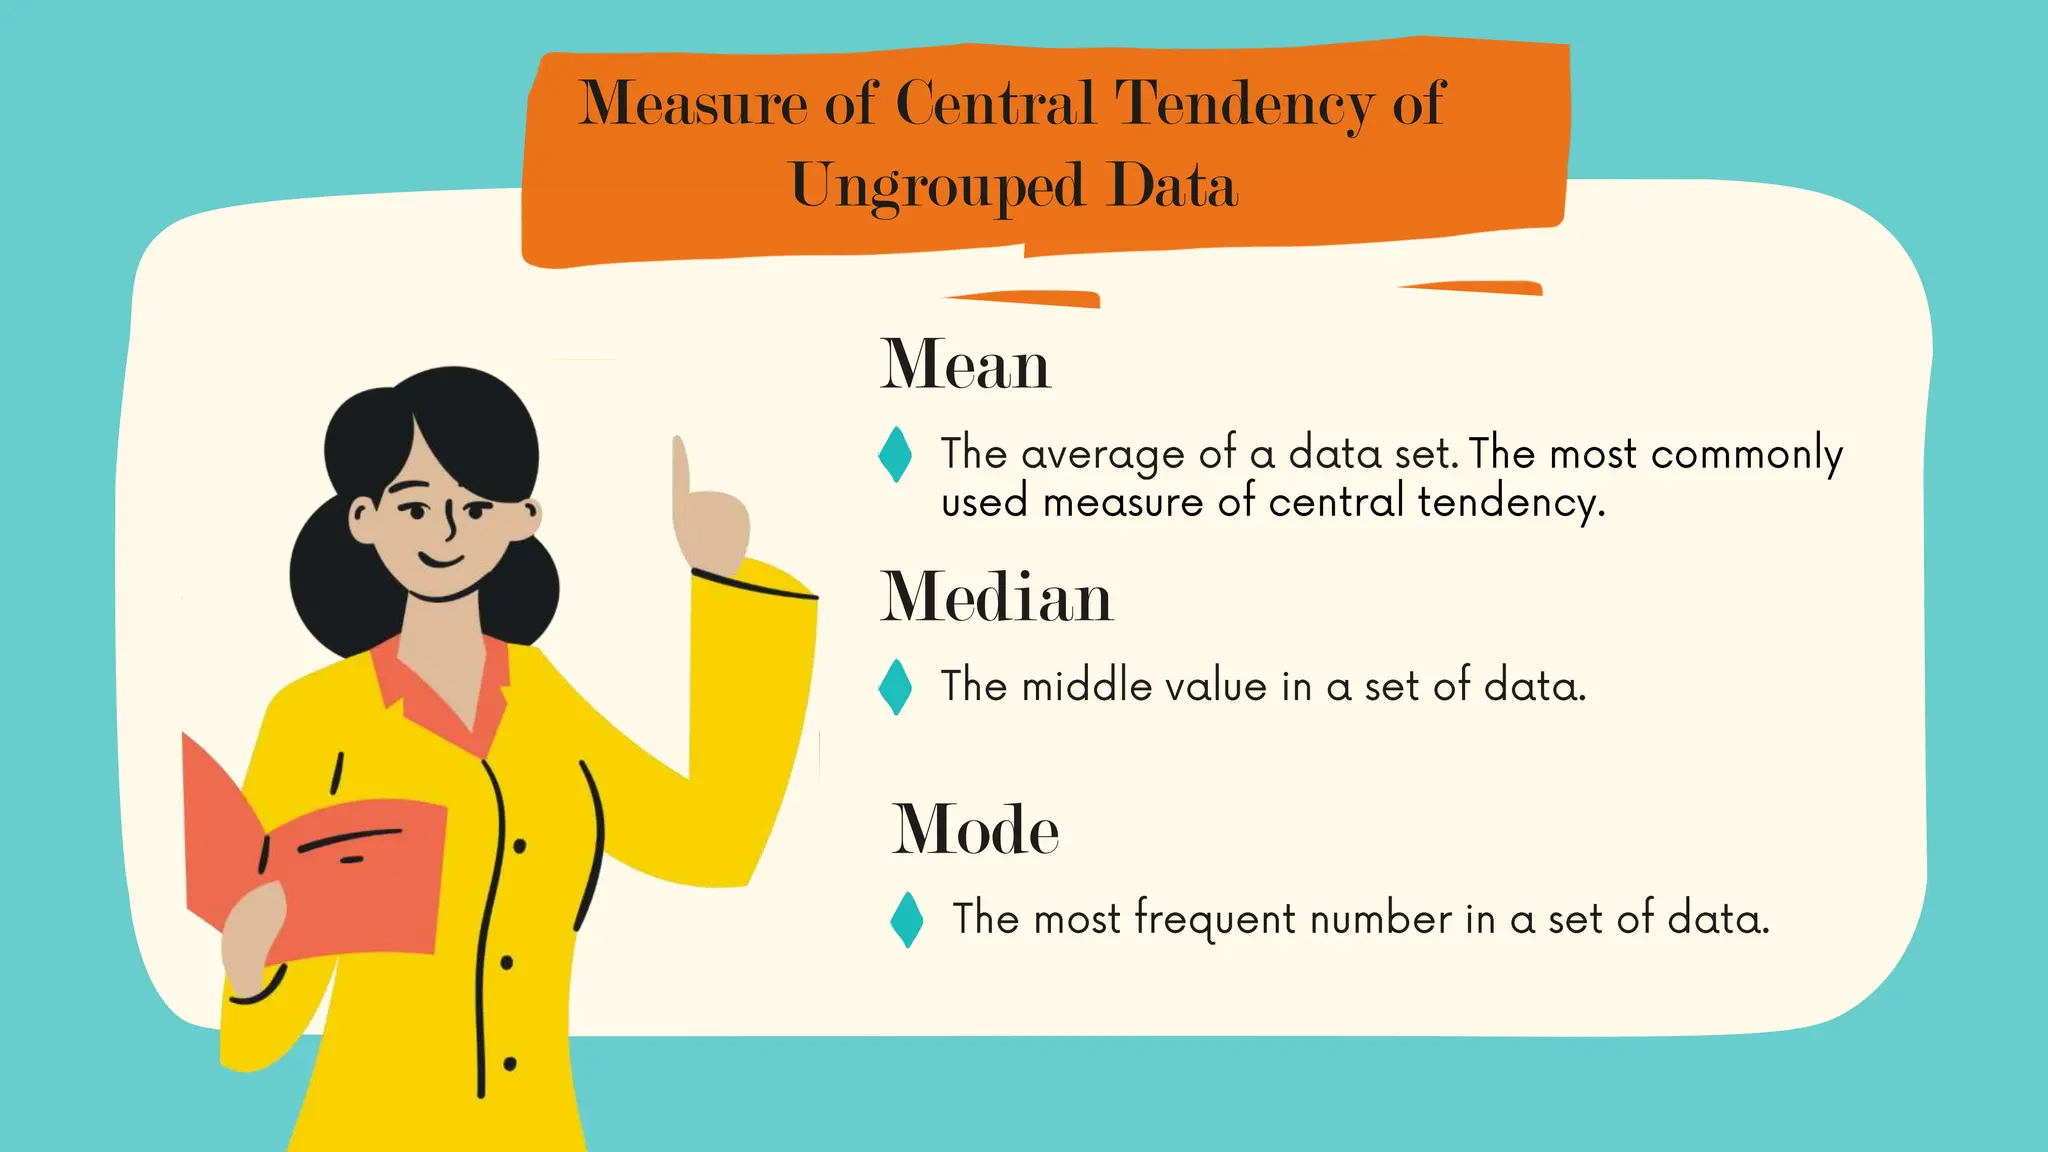
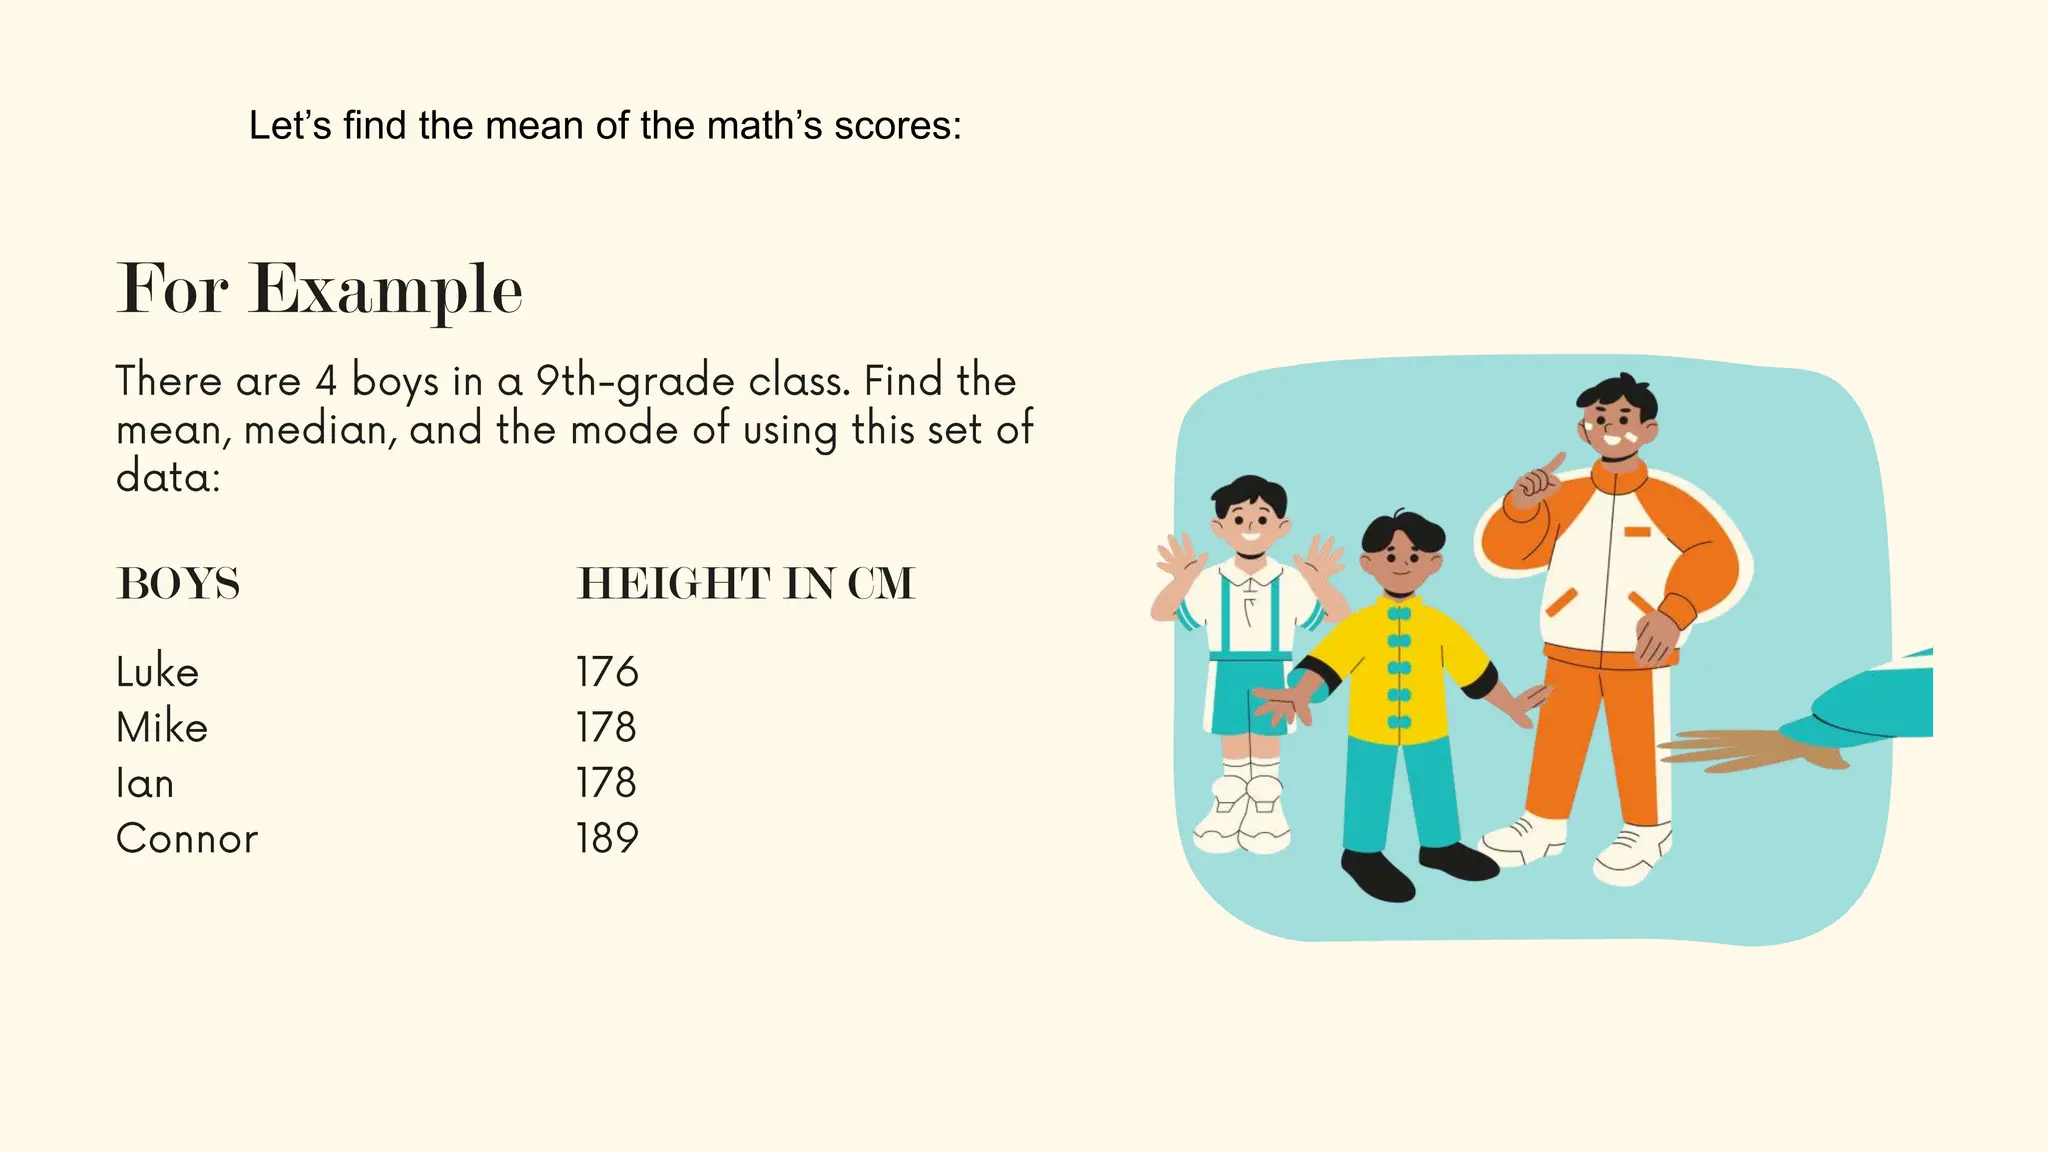
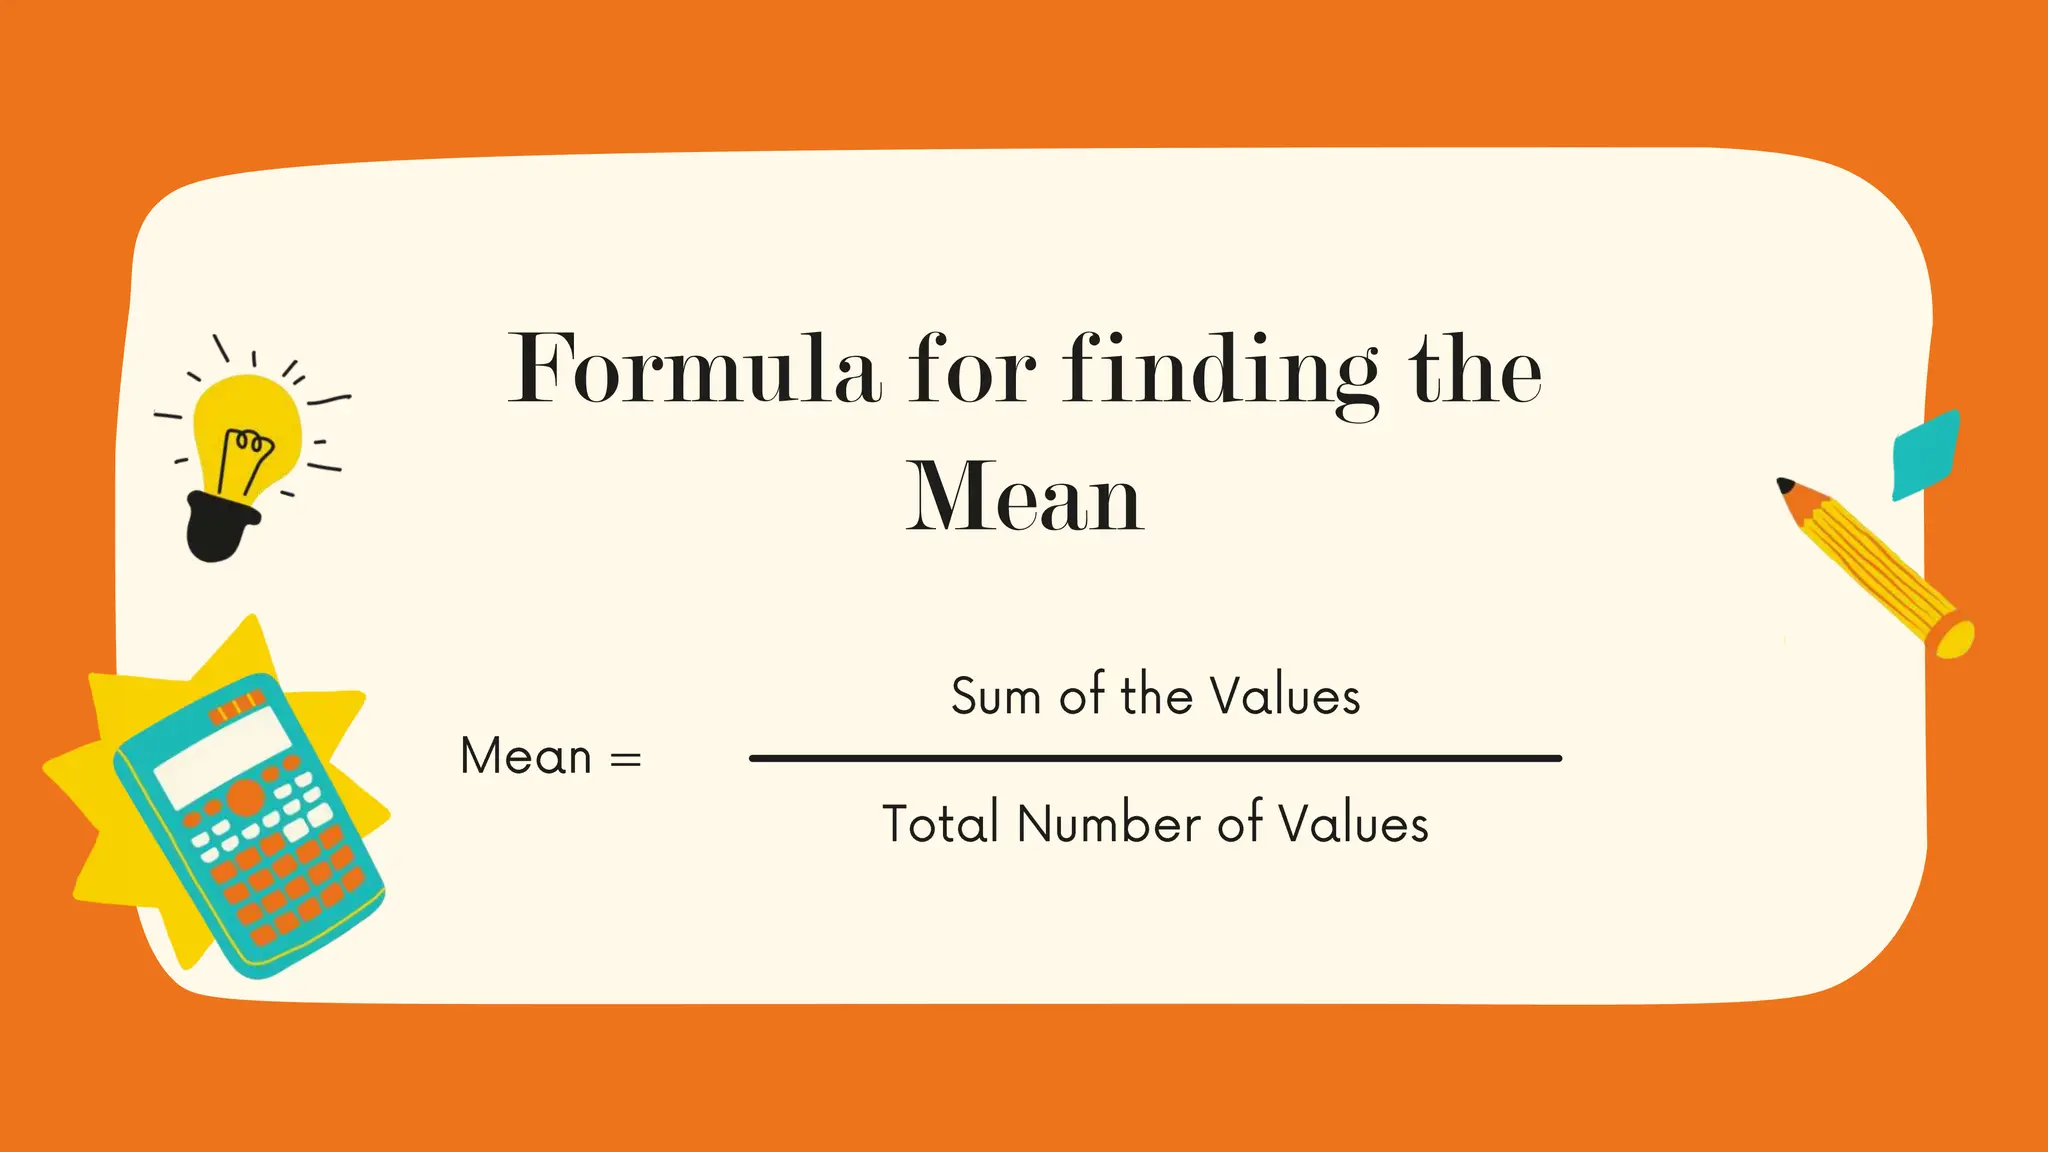
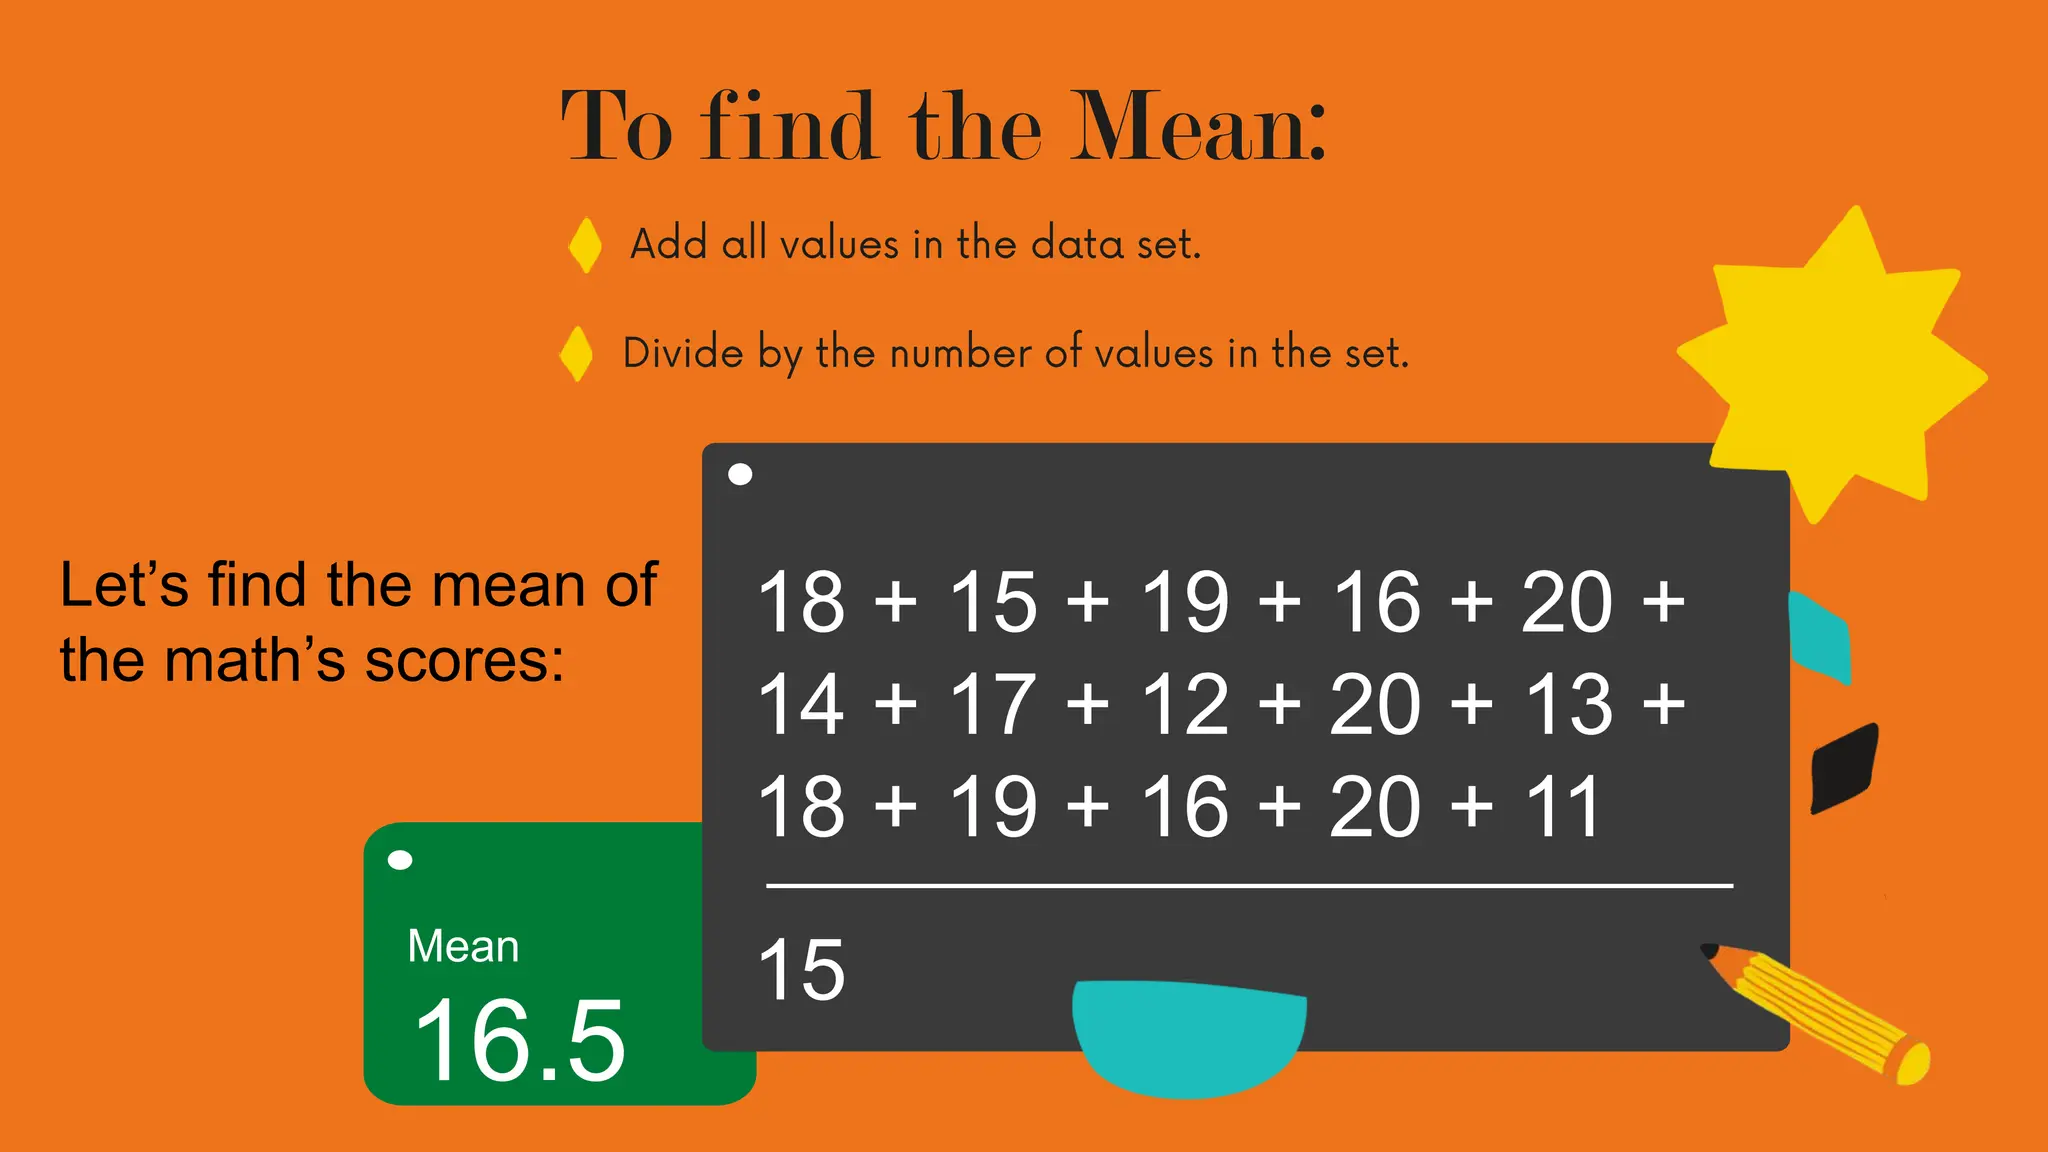
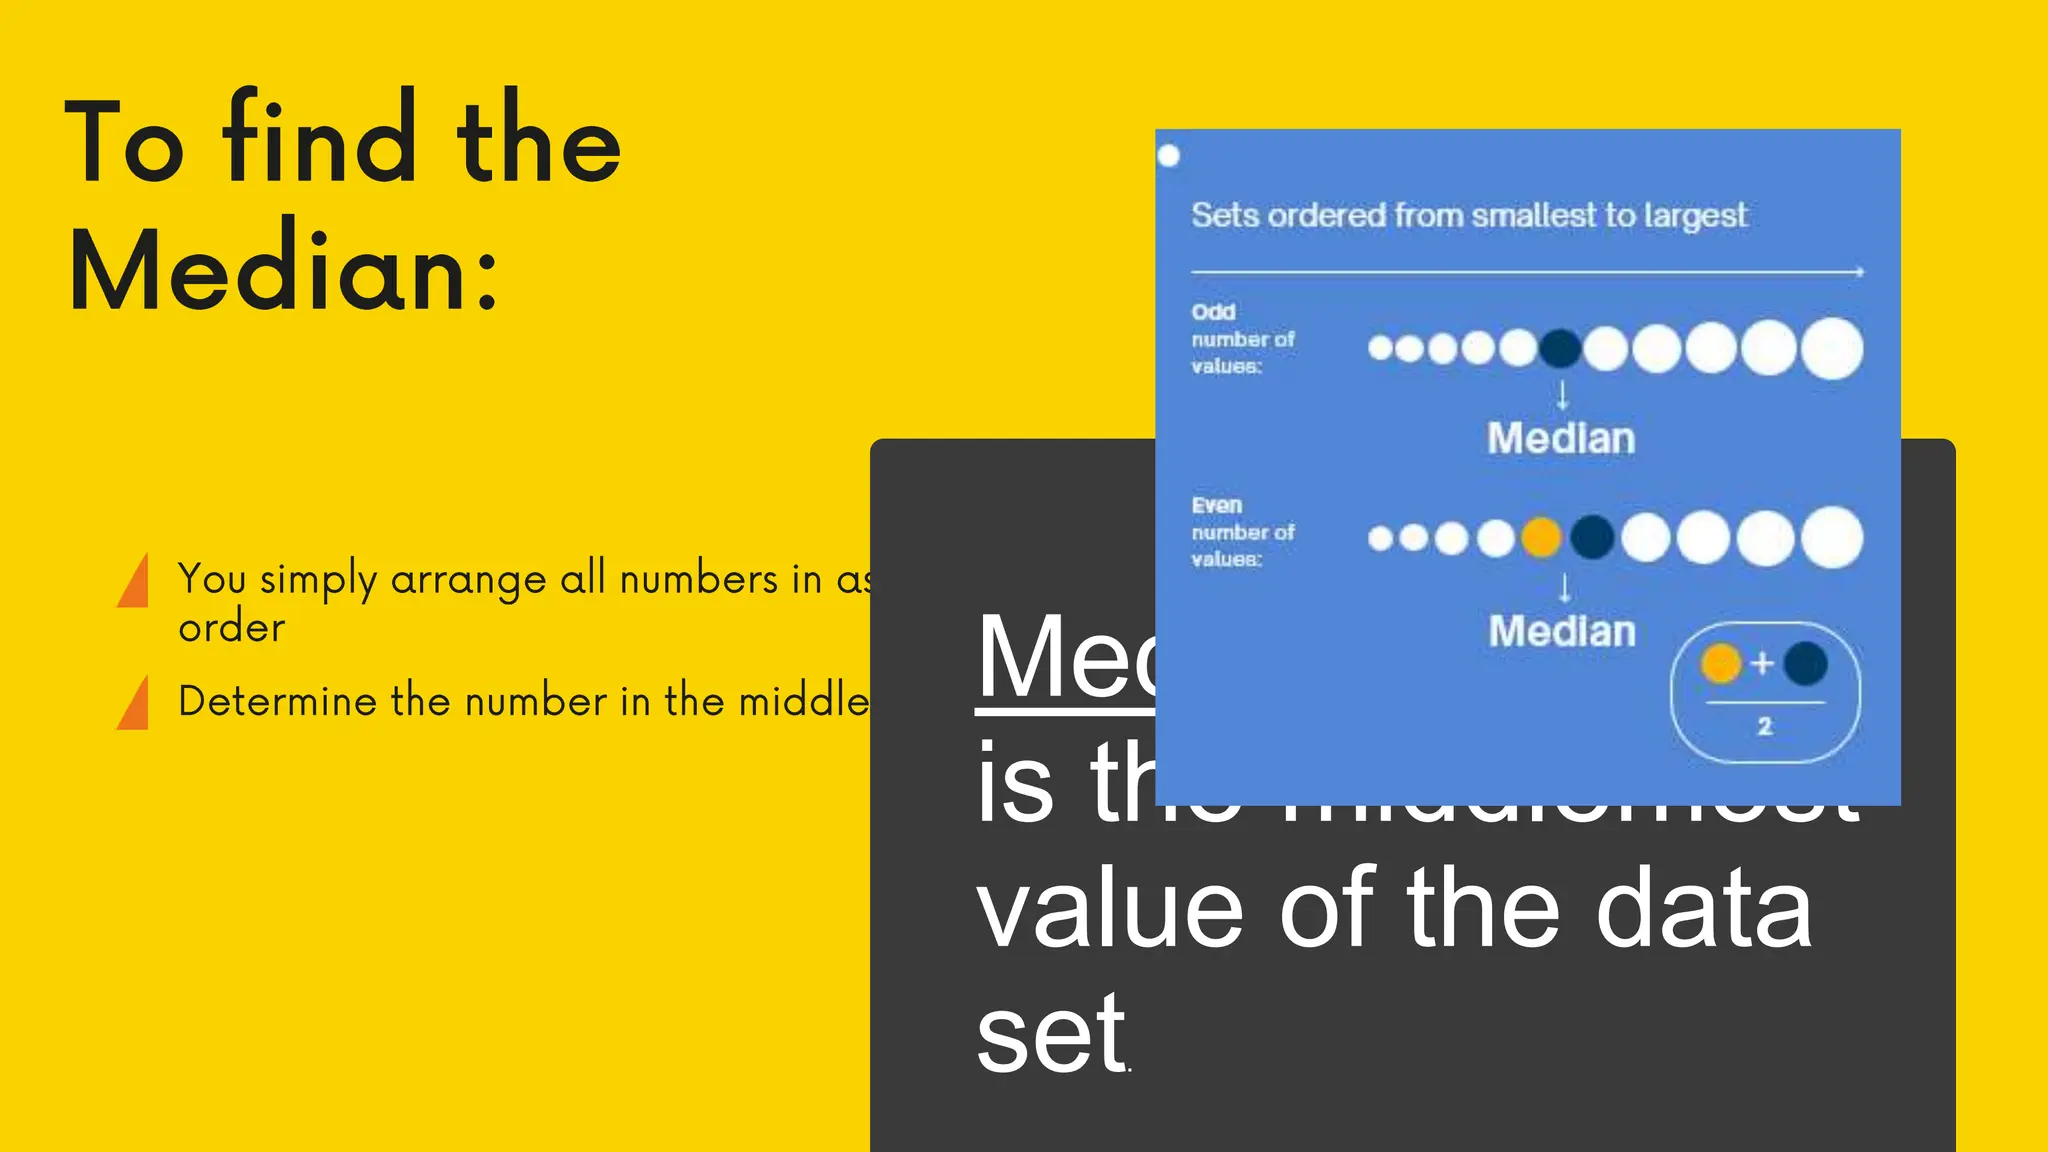
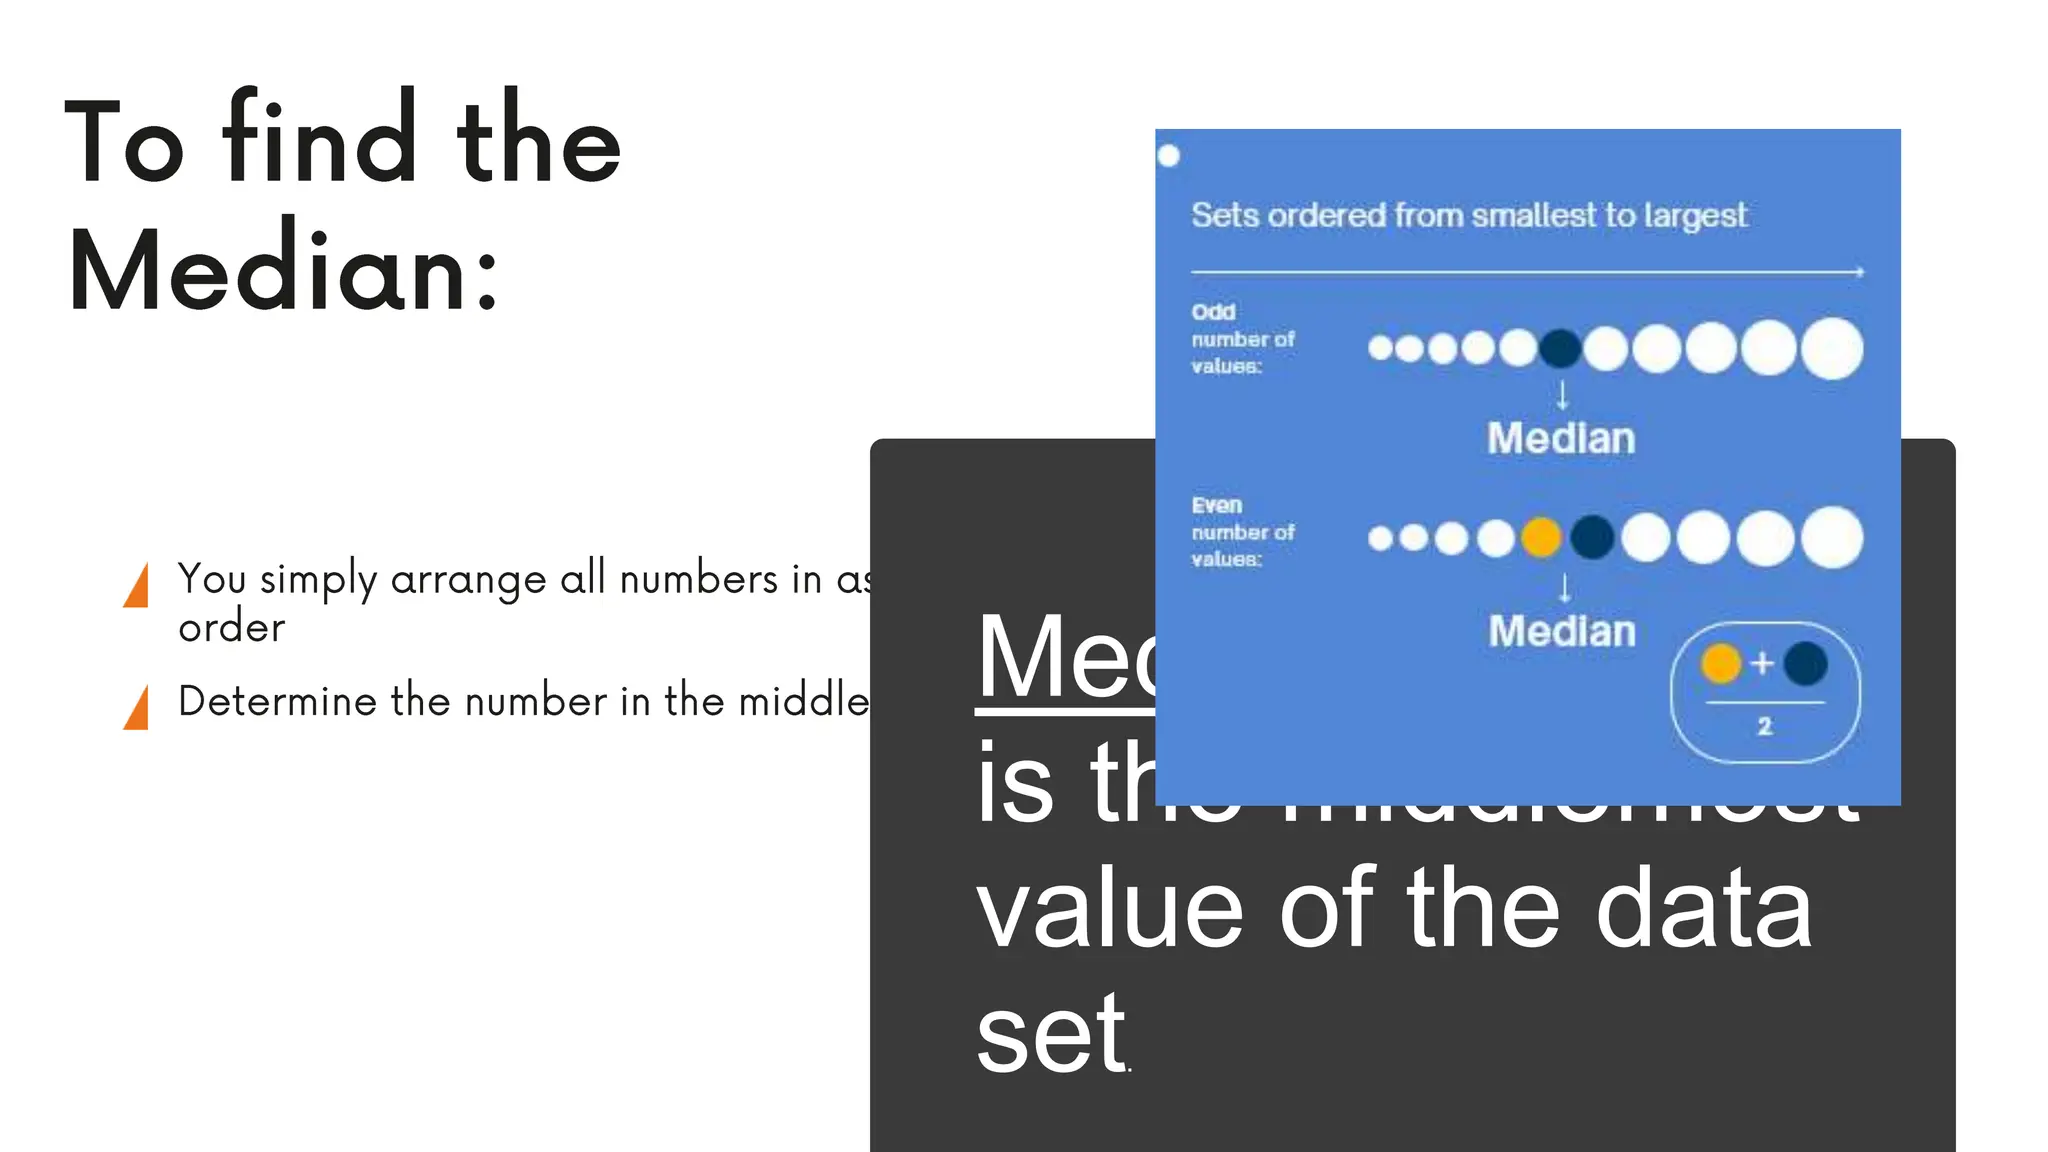
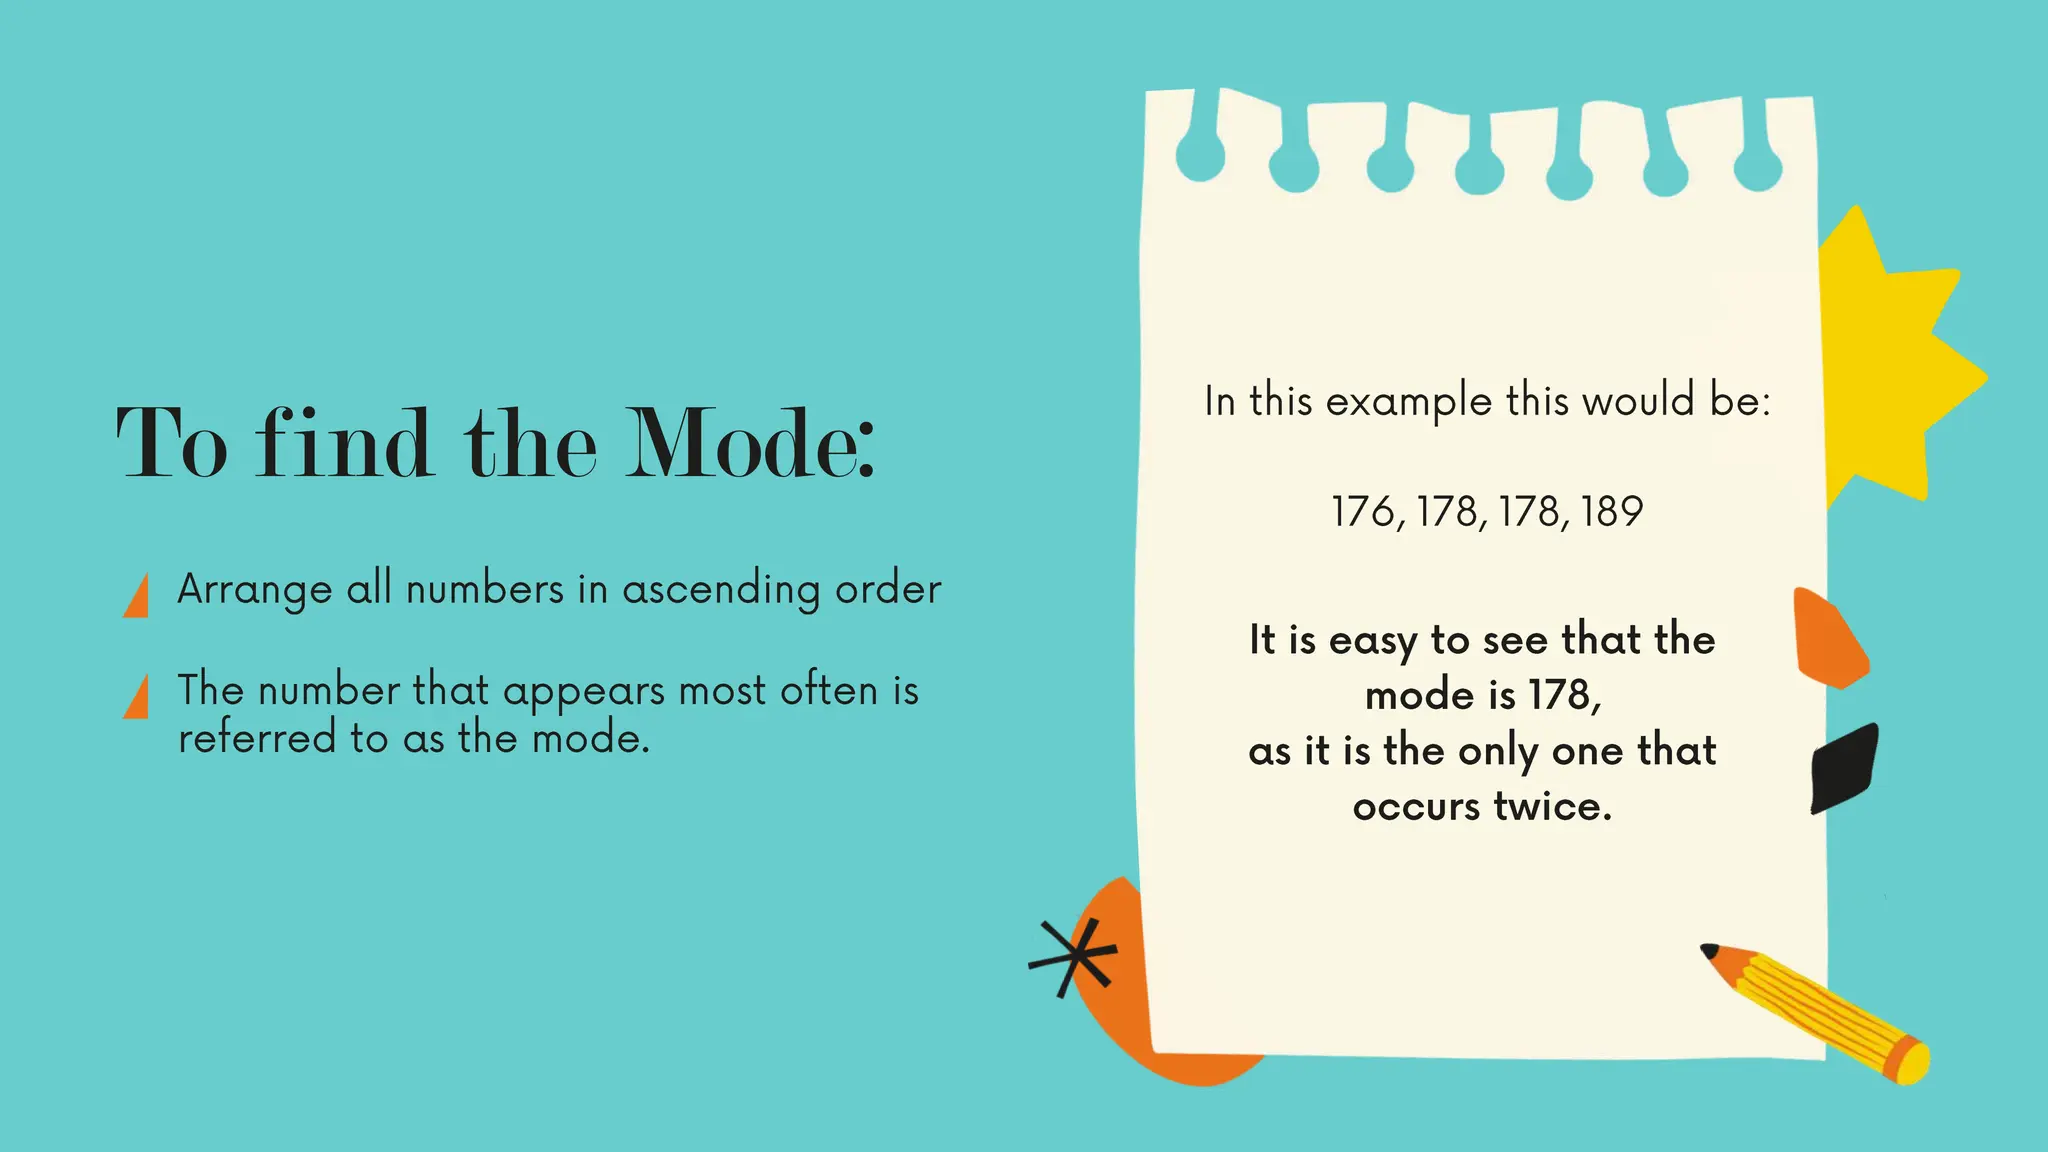
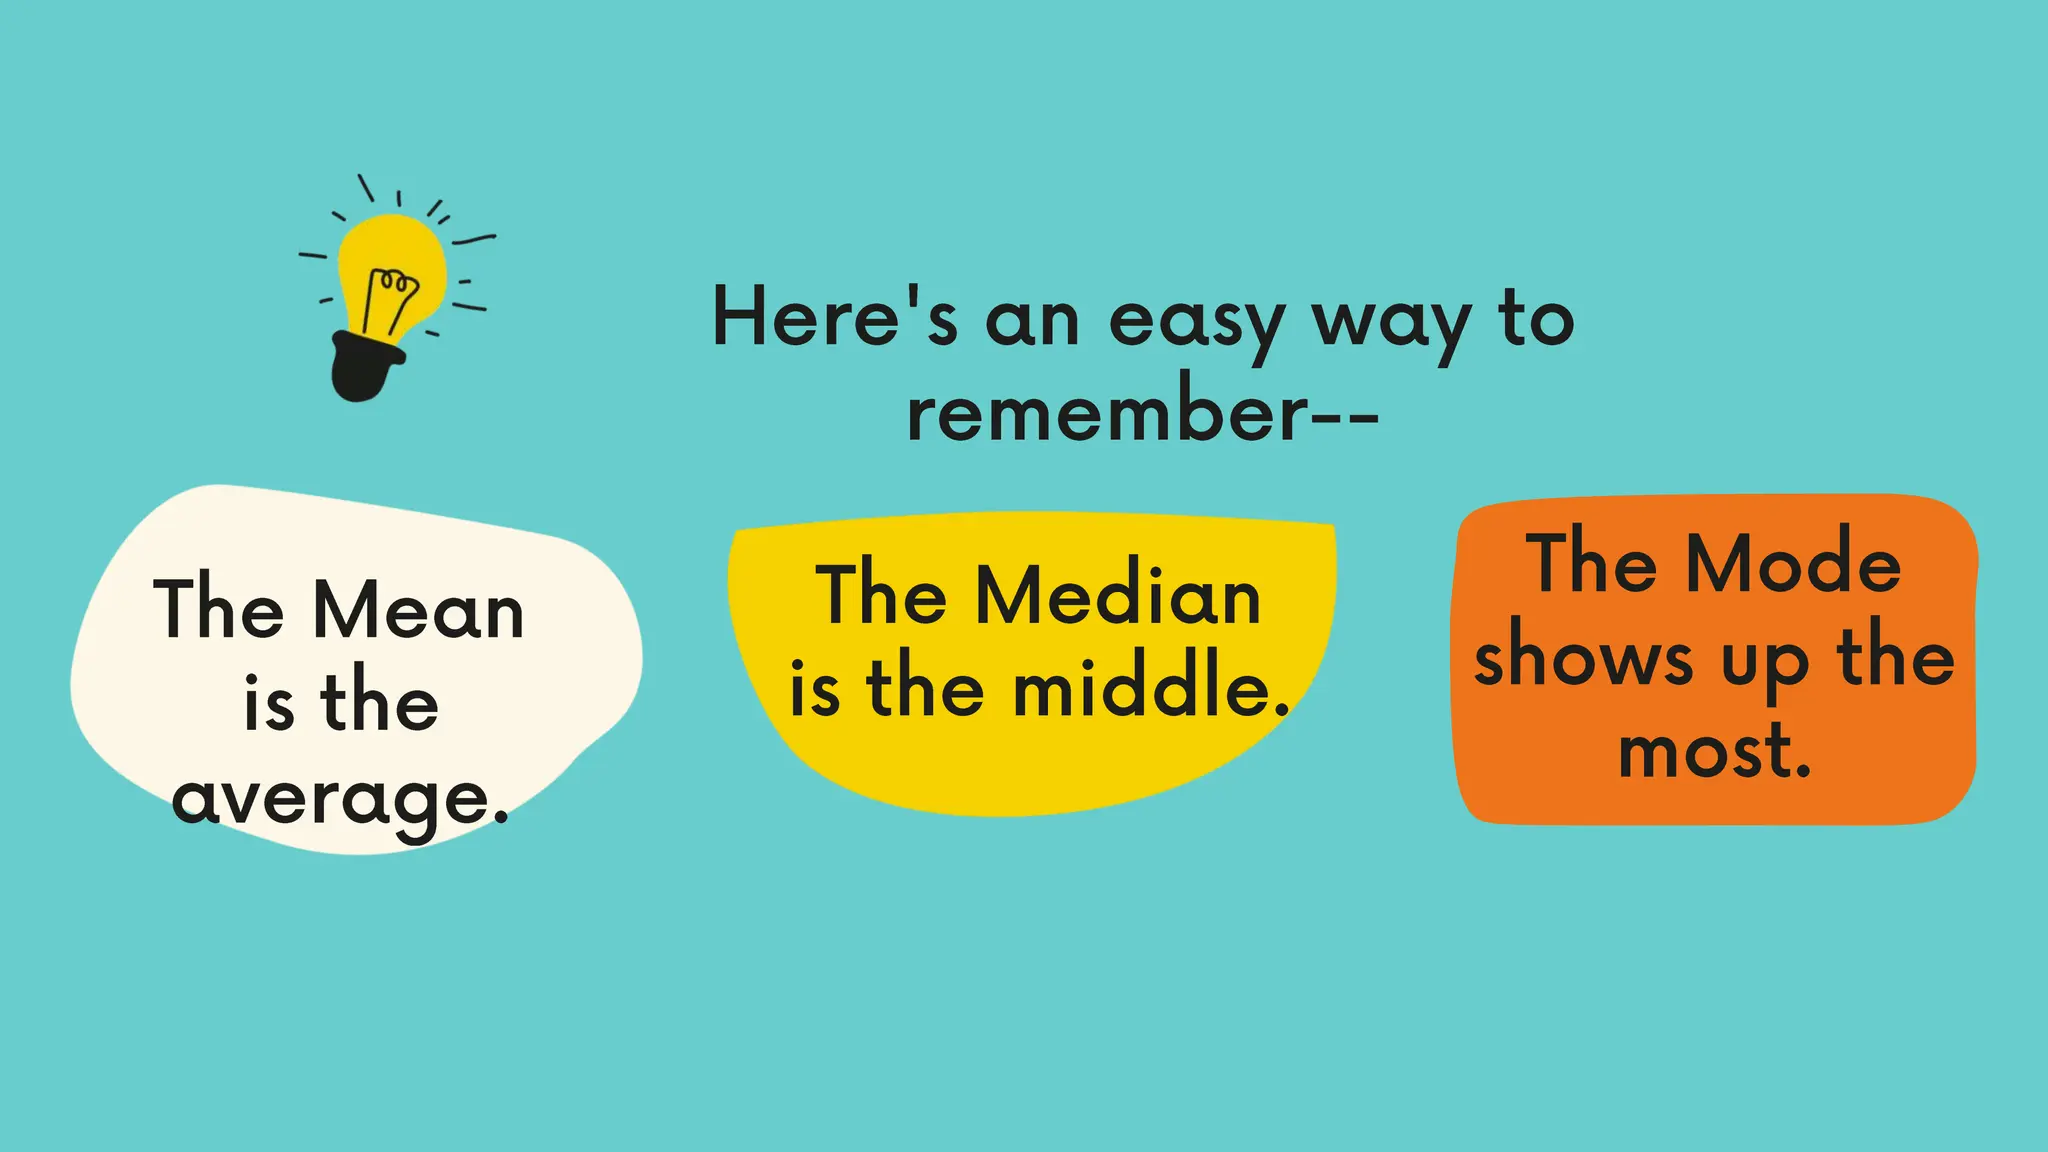
The document discusses measures of central tendency for ungrouped data including the mean, median, and mode. It defines these terms and provides an example to calculate each for a set of math scores: mean is found using the formula of adding all values and dividing by the number of data points (16.5), median is the middlemost value when data is arranged in order (16), and mode is the value that occurs most frequently (18, 20). The document illustrates how to find these measures of central tendency and their application to real-life situations.


![Measures of central_tendency._mean,median,mode[1]](https://cdn.slidesharecdn.com/ss_thumbnails/measuresofcentraltendency-200527065616-thumbnail.jpg?width=640&height=640&fit=bounds)


