Downloaded 109 times


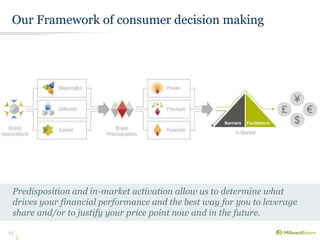


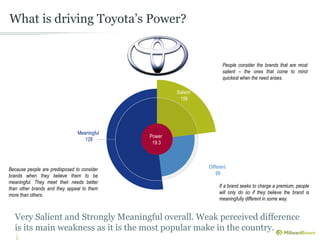


This document discusses building meaningful brands through the Millward Brown Brand Philosophy framework. It emphasizes that meaningful brands which are perceived as different and salient by consumers can command higher market share and price premiums. The framework uses metrics like Power, Premium and Potential to predict brand performance. It also highlights how mobile surveys can provide high quality insights by better representing consumers in an increasingly digital world.


![[Millward Brown] Brandz report 2014](https://cdn.slidesharecdn.com/ss_thumbnails/2014brandztop100report-140928232328-phpapp01-thumbnail.jpg?width=640&height=640&fit=bounds)


