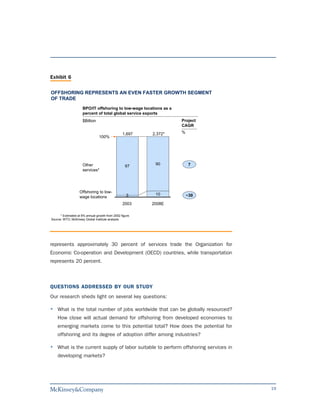
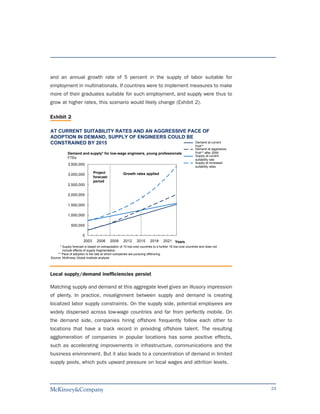
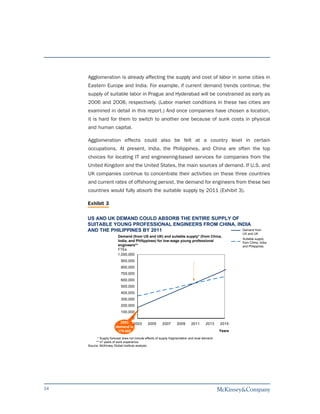
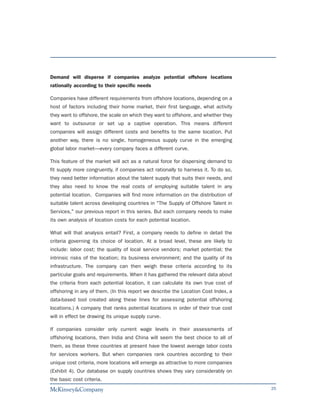
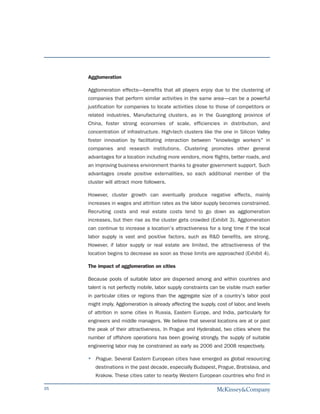
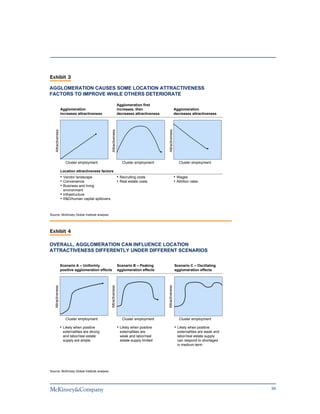
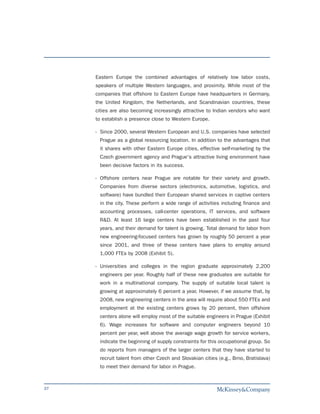
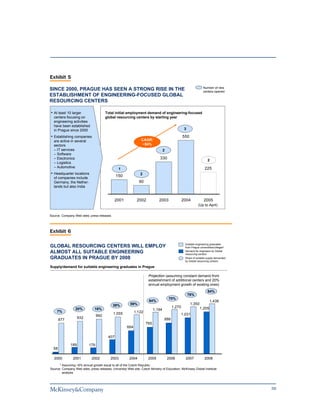
McKinsey Global Institute


The Emerging Global Labor Market:
Part III—How Supply and Demand for Offshore
Talent Meet
                               June 2005
The McKinsey Global Institute (MGI) was established in 1990 as an independent
think tank within McKinsey & Company, Inc., to conduct original research and
reach a better understanding of the workings of the global economy. From time
to time, MGI issues public reports. These reports are issued at the discretion
of MGI’s director, Diana Farrell, and its McKinsey Advisory Board when they
conclude that MGI's international perspective and its ability to access
McKinsey’s knowledge of industry economics enable it to provide a valuable fact
base to policy debates. The McKinsey Advisory Board is made up of McKinsey
partners from Europe, Asia-Pacific, and the Americas.

MGI's staff members are drawn primarily from McKinsey’s consultants. They
serve 6- to 12-month assignments and then return to client work. MGI also
commissions leading academics to participate in its research.

The McKinsey Global Institute is based in San Francisco and has a presence in
Washington, DC, New York and Shanghai. MGI research fellows are based
around the world as needed for individual research projects.
The Emerging Global Labor Market:
Part III—How Supply and Demand for Offshore
Talent Meet

                               Diana Farrell
                               Martha Laboissière
                               Robert Pascal
                               Charles de Segundo
                               Jaeson Rosenfeld
                               Sascha Stürze
                               Fusayo Umezawa
Preface
    The Emerging Global Labor Market series is the end product of a year-long
    project by the McKinsey Global Institute (MGI), working in collaboration with our
    colleagues in McKinsey offices and practice groups around the world. This
    research builds on our extensive work on offshoring, global industry
    restructuring, and the impact of multinational company investment in developing
    countries. It spans detailed cases of eight industry sectors (automotive, health
    care, insurance, IT services, packaged software, pharma, retail, and retail
    banking) and an analysis of the available talent pool in 28 low-wage countries
    and another 8 mid- to high-wage ones. It also includes the Location Cost Index,
    a tool for companies to evaluate location attractiveness based on six groups of
    criteria: labor cost, vendor landscape, market potential, risk profile, business
    environment, quality of infrastructure.

    MGI Fellows Martha Laboissière from McKinsey's São Paulo Office and Jaeson
    Rosenfeld, previously from McKinsey's Boston Office, worked closely with me to
    provide leadership to this project. The project team also included MGI Fellows
    Robert Pascal from McKinsey's North America Knowledge Center in Boston,
    Charles de Segundo from McKinsey's London Office, Sascha Stürze from
    McKinsey's Berlin Office, and Fusayo Umezawa from McKinsey's Tokyo Office.

    We have benefited enormously from the extensive input received from
    McKinsey's global network of industry and functional experts, especially Ajay
    Dhankhar, Detlev Hoch, Chris Ip, Noshir Kaka, Krish Krishnakanthan, Glen
    Mercer, and Anupan Sahay, and from our external Academic Advisory Board,
    which included Martin Baily, senior advisor to MGI and senior fellow at the


4
Institute for International Economics and formerly Chairman of the Council of
Economic Advisors to President Clinton; Olivier Blanchard at the Massachusetts
Institute of Technology; and Richard Freeman at Harvard University.

Tim Beacom, MGI's dedicated research and information specialist, Nitin Seth
from McKinsey's India Knowledge Center and Vivien Singer from McKinsey's
North America Knowledge Center in Boston provided essential research
support. Susan Lund and Gina Campbell provided thoughtful input and editorial
support. Morever, Deadra Henderson, MGI’s Practice Administrator, Terry Gatto,
our Executive Assistant and Rebeca Robboy, MGI’s External Relations,
supported the effort throughout.

As always, the findings and conclusions draw from the unique perspectives that
our colleagues bring to bear on the sectors and countries researched here.
These perspectives are a product of intensive client work with the world's
leading firms. They are supplemented by in-depth analytical work and extensive
interviews and dialogues with executives, government officials, and other
leading thinkers. As with all MGI projects, this work is independent and has not
been commissioned or sponsored in any way by any business, government, or
other institution.

Our aspiration is to provide a fact base to the public debate on offshoring and
the emerging global labor market to enable policy makers and business leaders
to make more informed and better decisions.

                                                 Diana Farrell
                                                 June 2005


                                                                                   5
Additional Acknowledgements

    Beyond the project contributors already mentioned in the preface, we would also
    like to explicitly acknowledge McKinsey colleagues, executives and experts
    around the world who contributed specifically their industry, local market
    insights and knowledge to this study. To those who chose to remain anonymous
    we also extend our gratitude. McKinsey & Company's unparalleled network is
    an essential component of any McKinsey Global Institute effort.


    DEMAND SECTOR CASES
    Auto
    Daniela Craemer-Kuhn, Parmeet Grover, Russell Hensley, Jeff Holland, Thilo
    Ittner, Lars Krause, TV Kumaresh, Gerrit Marx, Kelly McKenzie, Harald Meilicke,
    Glenn Mercer, Guntram Noeth, Arne Schneider, Carsten von der Ohe, Andreas
    Zielke
    Health care
    Leigh-Ann Allen, Isaach Barchas, Brendan Buescher, Takiko Fukumoto, Nathan
    Gunn, Judith Hazlewood, Brian Helgoe, Nico Henke, Mike Jackman, Yongah Kim,
    Bob Kocher, Paul Mango, James Mountford, Mona Mourshed, Vasnat
    Narasimham, Tory Ramaker, Ravi Rao, Russell Richmond, John Schilling, Saum
    Sutaria, Juergen Wettke
    Insurance
    Vivek Agrawal, Mark Anema, Amy Badertscher, Henk Broeders, Shashi Buluswar,
    Jeff Chookaszian, Ivan Clatanoff, Onur Erzan, Vijay Gosula, Roland Knorren,
    Shameek Kundu, Michal Kwiecinsky, Oliver Lang, Charles Mander, Gary Moe,
    John Mulhall, Paul Oakes, Paolo Pecchiari, John Peters, Witold Salwach, Ishaan
    Seth, Alex Singla, Gerard Speksnijder, Jessica Tan, Tim Welsh, Patrick Wetzel,
    Elizabeth Ziegler
    IT Services
    Andre Andonian, Marcus Beck, Atul Bhandari, Nay-Yasmine Ghorayeb, Prashant
    Gupta, Ozan Gursel, Detlev Hoch, Detlev Hülsebusch, Denis Idanoff, Joel Jones,
    Noshir Kaka, Knut Lagies, Niklas Larsson, Boris Lipiainen, Sunil Mehta, A.S.
    Murthy, Vivek Pandit, Tor Jakob Ramsøy, Rob Rosiello, Jayant Sinha, Simen
    Teigre, Stephan Zimmermann
    Packaged SW
    Marcus Beck, Ken Berryman, Atul Bhandari, Roxane Divol, Nay-Yasmine
    Ghorayeb, Detlev Hoch, Detlev Hülsebusch, Denis Idanoff, Joel Jones, Rajiv
    Kaul, Krish Krishnakanthan, Knut Lagies, David Mark, Vivek Pandit, Jeffrey
    Rhodes, Roger Roberts, Tobias Schwarz, Rupert Stützle, Kevin Walsh


6
Additional Acknowledgements

Pharmaceutical
Michael Bloch, Vikash Daga, Ruth De Backer, Ajay Dhankhar, Raj Garg, Indranil
Ghosh, Linda Gleason, Maria Gordian, Judith Hazlewood, Tom Hensey, Elizabeth
Laws, David Lennon, Ahmed Mitwalli, Shankar Narayanan, Eckhard Niemeier,
Paul Oppold, Chandrika Pasricha, Peter Pfeiffer, Ron Piervincenzi, Miguel
Schmidt, Navjot Singh, Ramesh Srinivasan, Lara Sullivan, Takashi Takenoshita,
Yujiro Tsutsumi, Hema Viswanath, Arthur White, Kristin Yarema, Rachel Zhang
Retail
Wendy Becker, Michael Bloch, Peter Breuer, Shannon Brownell, Barney Burgess,
Sebastian Chaitas, Jochen Fabritius, Lorenzo Forina, Paul Gormley, Chris
Grosso, John Hansen, Amy Howe, Juliet Johansson, Ari Kertesz, Bernd
Klosterkemper, Lorraine Kron du Luart, Elizabeth Ledet, Yannick Migotto, David
Moucheron, Pierre-Dominique Oubrier, Syed Rizvi, Lucio Rossetto, Justin Ryan,
Vivek Sankaran, Vivien Singer, Christiana Shi, Thomas Skiles, Janos Stromayer,
Kirsten Weerda, Matthias Wunderlin
Retail banking
Ignácio Bernard, Dominic Casserley, Sebastian Chaitas, Atanas Christov, Andy
Eichfeld, Marcos Fernandes, Antonino Gitto, Jakob Haesler, Wendy Harrington,
Chris Ip, Vikram Malhotra, Frank Mattern, Deepak Mishra, Oscar Rodriguez,
Vikas Saggi, Anupam Sahay, Alexandre Sawaya, Joydeep Sengupta, Sanjiv
Somani, Sasi Sunkara, Sergio Waisser, Katalin Walter, Paul Wilmott, Eckart
Windhagen


LABOR SUPPLY AND LOCATION ATTRACTIVENESS EVALUATIONS
Brazil
Sofia E. do Amaral, Luis Giolo, Marcos Machuca, Rosana Marotto, Antonio
Mendonça, Renata Mendonça, Jose Carlos Papa, Alcino da Silva Therezo Junior,
Andrea Waslander
China
Stefan Albrecht, Delan Beah, Joseph Chang, Georges Desvaux, Mavis Ji, Wing-
dar Ker, Paul Gao, Laura Lu, Shahrukh Marfatia, Shamus Mok, Gordon Orr,
Gerald Simbuerger, Harry Song, Kevin Walsh, Lilian Woo, Hugh Yu, Wendy Zhang,
Florence Zheng
Czech Republic
Jan Bubenik, Craig Comstock, Michael Mayher, Martin Mlcoch, Barbora
Pazderova, Stuart Watkins
Germany
Janin Böttcher, Saule Serikova, Peter Weigang

                                                                                 7
Additional Acknowledgements

    Hungary
    Dr. Zsolt Ekler, Peter Fröhlich, Beata Fürjesz, György Györfi, Laszlo Hadi, Adam
    Homonnay, Gabriella Kiszely, Peter Lukacs, Kristian Merenyi, Anthony Radev,
    Varga Zoltan
    India
    Nandini Aggarwal, Shiv Aggrawal, E Balaji, Uddalak Bose, Maneesh Chhabra,
    Craig Comstock, Abhishek Gupta, Noshir Kaka, Rajiv Kaul, Knut Lagies, J.R.
    Manoj, Sunil Mehta, A.S. Murthy, Dennis Ross, Abhishek R Sharma, Jayant
    Sinha, Kunal Suri, Ambika Walia
    Japan
    Yumi Kiuchi
    Malaysia
    Ruzita Ahmad, Adleen Ariffin, Sheenu Chandra, EK Cheah, Adrian Groom, Effendi
    Ibnoe, Bob Olivier, Adam Schwarz, Tony Thomas, Khoon Tee Tan, Cheryl Wong
    México
    Roberto Barreda, Liliana del Bosque, Enrique Lopez, José Manuel Macías, María
    Moreno
    Philippines
    Chris Beshouri, Antonette Consuelo, Vince Dizon, Jim Franke, Daphne Go, Cris
    Rosenthal , Paul Santos, Grace C. Sorongon
    Poland
    Jerek Bachowski, Jacek Drabik, Andrzej Halesiak, Rick Lada, Romek
    Lubaczewski, Malgorzata Nocen, Thomas Rüdel, Anna Slodka
    Russia
    Dmitri Angarov, Elena Cherkasova, Elena Kuznetsova, Valentin Makarov, Rinat
    Minullin, Alexander Nikiforev, Alexey Odinokov, Alexis Sukharev, Tatyana Tyrnova,
    Eberhard von Löhneysen, Xeniya Yakovleva
    South Africa
    Sujit Chakrabarty, Andrew Stein
    UK
    Emma Lawrence
    USA and Canada
    John Beardsley, Steven Carden, David Dreszer, Janique Robert, Tim Shavers,
    Vivien Singer, Elizabeth Stephenson, David Tanner, Anna Tarasova


8
Contents
Guiding Principles   10
Introduction         11
Executive Summary    21
Synthesis            30


                          9
Guiding Principles

       Any job that is not confined to a particular location has the potential to be
       globally resourced, or performed anywhere in the world. Broadly speaking, this
       includes any task that requires no physical or complex interaction between an
       employee and customers or colleagues, and little or no local knowledge.

       Such jobs can be performed wherever a company deems most attractive. A
       company may choose to have a particular location insensitive job performed in
       the demand market (that is, in the market in which the resulting output is sold),
       in a border zone (nearshore), or remotely (offshore). Therefore, not all location
       insensitive jobs will move offshore.

       We evaluate only service sector jobs. Although manufacturing jobs may be
       insensitive to their location as well, this study focuses on service jobs, whether
       they are in service sectors or in a back-office service function (e.g., accounting)
       in a manufacturing sector.

       We focus on the demand for low-wage employment from high-wage countries.
       To estimate potential demand for globally resourced labor, we treat countries as
       neither inherently on the supply side nor inherently on the demand side in the
       global labor market. However, since cost is a major determinant of companies'
       location decisions, developed countries are most likely to provide the bulk of
       demand for offshore labor, and developing countries the bulk of supply. When
       we evaluate the actual rate of offshoring today and how fast it will grow, we
       examine only the demand for low-wage labor from high-wage countries.

       We assume that demand for labor for a particular activity is the same onshore
       and offshore. In reality, capital/labor tradeoffs and increased service levels may
       cause high-wage countries to seek more labor in low-wage countries than they
       would for performing the same activity in the demand market. Productivity
       differences between the original location and the new location may also
       influence demand for labor. Since these effects can be either positive or
       negative and tend to level over time, our default assumption is that the number
       of FTEs1 needed for an activity is the same whether located onshore or offshore.

       For the demand evaluations we do not consider any supply constraints. All
       evaluations are made under the assumption that global supply will be able to
       meet demand. Actual supply conditions are examined in the second report in
       this series, "The Supply of Offshore Talent in Services".


     1 Full time equivalent


10
Introduction
Offshoring has rapidly become part of the everyday social lexicon. Conflicting
and sensational reports of developed-world companies moving jobs to
emerging markets like India and Brazil are now a staple of the news media and
political debate.

The trend alarms many observers. Some believe that almost any job is subject
to dispatch abroad, and that soon the developed world will lose even high-paid,
professional service jobs that previously were not at risk: "If you can describe a
job precisely, or write rules for doing it, it's unlikely to survive. Either we'll
program a computer to do it, or we'll teach a foreigner to do it."1 Others claim
that offshoring white-collar jobs in R&D and elsewhere will erode one of the main
sources of competitive advantage for developed countries, and eventually
reduce their standard of living. They point to offshoring as a key cause of weak
employment growth in the United States, maintaining that jobs lost abroad will
not return soon. Swayed by such arguments, policy makers on both sides of the
Atlantic have adopted or are now considering legislation that would penalize
companies for offshoring jobs and prohibit any state-funded projects from being
performed abroad.

But there are equally forceful proponents of offshoring. They argue that
offshoring increases company productivity and profits, bringing benefits to their
home economies. They say it represents a well-functioning global free market in

1 David Wessel, "Barbell effect—the future of jobs: new ones arise, wage gap widens,"
  Wall Street Journal, April 2, 2004.


                                                                                        11
labor: "arguing that [offshoring] hurts is arguing that free trade hurts."2 They
     also suggest it affects only a tiny proportion of jobs in developed countries, and
     accelerates economic growth in the countries hosting offshore employment.

     A big problem in this debate has been the shortage of hard facts with which to
     resolve conflicting arguments and reach a clearer understanding of offshoring's
     potential impact on the global economy. The purpose of the research described
     in this report is therefore to provide this fact base and help bring more clarity to
     the discussion.

     For reasons described below, our research has concentrated on the offshoring
     of service jobs rather than jobs in manufacturing, and on jobs offshored from
     the United States and Western Europe to low-wage markets. The report's
     findings should help companies and policy makers in both developed and
     emerging markets to address the different issues raised for them by offshoring.

     This introduction examines the context for our research, defines terms used in
     the report, explains the report's scope, and introduces the questions covered by
     each of the report's three sections.


     CONTEXT FOR THE RESEARCH
     Relocating jobs is nothing new. As communications have improved, companies
     have migrated jobs in high-labor-cost areas to cheaper and less restrictive labor
     markets. Initially they moved jobs within countries. For example, many
     manufacturing plants in the Northeastern United States shifted to the South and
     Southwest during the 1980s to take advantage of lower infrastructure costs, a
     less unionized workforce, and tax incentives. Then improving information and
     communication technologies made it possible for companies to disaggregate
     the value chain and outsource either entire processes or pieces of them to other
     companies in the same country. Numerous companies now provide other firms
     with technology support, software development, transactions processing,
     accounting, human resources management, and other tasks.


     2 Timothy Aeppel quoting Haseeb Ahmed in "Leadership (A special report) --- Offshore face-off:
       moving jobs overseas can cut a company's costs; But is it bad for the U.S. economy? Two
       economists debate the issue," Wall Street Journal May 10, 2004.


12
Recently, a confluence of factors has made it possible for companies to relocate
or outsource their service activities even farther afield, to lower-wage locations
offshore. These factors include further liberalization, improvements in
information technology, a decrease in the perceived risk of operating in
developing countries, and a shortage of labor in developed countries.

Ireland was one of the first offshoring locations, but emerging markets such as
India and the Philippines were fast followers. Exhibit 1 shows the approximate
value of offshore services in countries that supply them.

When companies decide where to locate a particular activity, they have to weigh
the feasibility of performing it in a different location, away from the home
market, against the benefits offered by performing it in that specific location,
such as economies of scale and low labor costs.


Exhibit 1

INDIA AND IRELAND ARE THE DOMINANT PRODUCING COUNTRIES
           Offshored services market size (BPO and IT, captive and outsourced)
           $Billion, 2003                                                                                               2.3
                                                                                        0.3
                                                                        0.6
                                                                                     Russia                      Other Asia
                                                                   Eastern
                                                                   Europe*
                              3.8
                                                          8.6 **
                          Canada                                                                                                        3.4 ***

                                                       Ireland                                                                       China
                                                                                                                                   1.7
                          0.5
                                                                                                 12.2                       Philippines
                       Mexico                                3.6 **/****
                                                                                                                                       0.1

                          1.8                              Israel                                                                  Thailand
                                                                                 0.1            India                0.4
                 Latin America
                                                                        South Africa                           Australia
       *   Includes Poland, Romania, Hungary, Ukraine, and Czech Republic.
      **   Primarily composed of MNC captives.
     ***   Estimate, based on total Chinese BPO and IT services revenue (7.8) minus domestic demand for IT services (4.4).
    ****   Estimate, based on 2001 market size of 3.0 and assumed growth rate of 20% p.a.
 Source:   Software Associations; U.S. country commercial reports; press articles; Gartner; IDC; Country government Web sites; Ministry of
           Information Technology for various countries; Enterprise Ireland; NASSCOM; McKinsey Global Institute analysis                          1


                                                                                                                                                      13
In the 1990s the lowering of bandwidth and telecommunications costs made many
     services less sensitive to their location. Manufacturing was similarly affected—
     better communication made it easier to operate a remote manufacturing
     location—but to a lesser extent, because cheaper communications didn't do much
     to help manufacturers with the costs of transporting their physical inputs and
     outputs. At the same time, the risks, both real and perceived, of locating service
     activities in developing countries, were lowered. The successes of early movers
     and supporting measures taken by governments in emerging markets, for
     example, to protect intellectual property, made other companies more confident of
     moving their services to these locations.

     As companies continue to learn how to manage globally dispersed processes,
     the exact location of many functions will matter less and less. Already, a great
     many business processes can be performed remotely, and several can be
     performed anywhere in the world. A customer service call can be answered, an
     MRI can be read, and R&D can take place remotely.           But how many such
     processes are performed remotely today? How fast is that number growing? To
     begin answering such questions, we need to define more precisely the options
     facing the companies driving this trend.


     DEFINITIONS
     We define as "global resourcing" the process a company goes through to decide
     which of its activities could be performed anywhere in the world, where to locate
     them, and who will do them.

     Any activity that is not constrained by the need for customer contact or local
     knowledge or by complex interactions is subject to global resourcing: it can be
     performed wherever a company deems most attractive (Exhibit 2). An obvious
     example of such an activity is answering customer service calls for a bank;
     these calls can be answered just as easily in Chicago, Dublin, or Manila.

     Having identified services that could be performed remotely, a company faces
     two sets of decisions illustrated in the matrix in Exhibit 3. First, should it
     "offshore" those services, by which we mean perform them in another country
     outside the market where they are sold? Or should it perform them "onshore,"
     in the same market in which it sells them?3 And, second, should the company


14
Exhibit 2

GLOBAL RESOURCING ENTAILS CHOOSING THE OPTIMAL LOCATION
TO PERFORM PROCESSES THAT COULD BE LOCATED ANYWHERE
                                   Demand

                                                                 Local resourcing
                                                               demand ("needs to be
                                                                 close to customer
                                                                     market")                                                    X
                   X
                                                                      Global                                                                  X
                                                               resourcing demand
                                                                ("can be performed                                                        X
                                                                  anywhere in the
                                                                      world")

                                   Supply
                                    Cost structure including


                               X
                                    wages/location
                                    attractiveness


                                                                           Region 2

                                                                                      Region 3

                                                                                                  Region 4
                                                                                                             Region 5
                                                                Region 1


                                                                                                 Labor quantity


Source: McKinsey Global Institute analysis                                                                                                                         2


Exhibit 3

OUTSOURCING AND OFFSHORING DEFINED                                                                                                                Offshored services
                                                                                                                                                  case focus
            Revenues
            $ billion, 2001
                        Outsource
                                                  Onshore                                                               Offshore
                                                  outsourcing                                                           outsourcing

                                                                           227


                                                                                                                                10
            Control
                                                  Shared                                                                Captive
                                                  services                                                              offshoring

                                                                Not available

                                                                                                                                22
                        Captive
                                             Onshore                                                                                  Offshore
                                                                                                  Location
Source: Gartner; IDC; Aberdeen Group; UBS Warburg; Nasscom; U.S. import-export data; McKinsey Global Institute
        analysis                                                                                                                                                  3


                                                                                                                                                                       15
perform those activities in a wholly-owned "captive" unit? Or should it
     "outsource" them, by which we mean buy them from a third party?

     The following are examples of location decisions that fall into each quadrant of the
     matrix:

        Wells Fargo operates call centers for its business units in several locations in
        the United States, including Utah and California. This is a captive onshore
        activity.

        Halliburton outsources software applications management to Accenture in the
        United States. This is an outsourced onshore activity.

        DHL, a German company, locates its European ITservices center in Prague. This
        is a captive offshore activity.

        The South African Depository System has its software application development
        performed by TCS, an Indian firm. This is an outsourced offshore activity.

     The main focus of our study will be to understand the shift from "onshore" to
     "offshore" locations, although we will also touch on the "captive" versus
     "outsourced" decision. We also limit our attention to jobs that are relocated from
     high-wage to low-wage countries, even though the reverse process also occurs. For
     instance, R&D centers are often located in the United States even though they
     serve many countries, including developing ones.

     Many service activities are labor intensive, so companies would benefit if they could
     offshore them to places with lower labor costs. But not all services can be
     offshored: some are much more sensitive to their location than others. Computer
     programming, for example, is relatively location insensitive. It can be done just
     about anywhere, because computer code can be cheaply and instantaneously
     "shipped" via the Internet to and from virtually any location in the world. At the other
     end of the spectrum comes services like haircuts, which have to be done close to
     the customer.

     It is not necessarily rational for companies to transfer all location insensitive
     activities offshore. Consider server maintenance for United States companies.

     3 The term "nearshoring" means offshoring to a country near the home market.


16
Even though server maintenance could be relocated elsewhere, that may not make
sense because the United States has in place a better infrastructure and lower risk
levels for server maintenance than other locations (this example will be explored in
more detail in our IT services case).

Regulatory or organizational factors may also prevent a company from relocating
services offshore. For instance, an insurance company might want to relocate its
US property and casualty operation to a developing country; however, industry
regulations require some of these services to be performed by a registered
insurance agent. Since it is not possible to gain certification as a US agent in a
foreign country, the activity has to remain in the US. Organizational factors play a
part in the decision too. A software company might achieve lower wage costs by
offshoring certain lower-end elements of its software development process.
However, the company's process is well-developed and understood within the
organization, and its smooth working depends on all members of the development
team being in the same place.


WHY WE FOCUS ON OFFSHORING SERVICES TO DEVELOPING COUNTRIES
Within the universe of jobs that are not constrained to one location, the focus of
this report is the offshoring of service jobs from developed economies to
developing markets. This is the issue that has dominated both the media and
political debate, and for good reason. The service sector in developed countries
supplies most jobs and the bulk of many countries' positive trade balances, and
the trend toward offshoring jobs is growing fast. An additional reason for our focus
on this area is the absence of data on its effects on the individuals, companies,
and countries that provide offshored service labor.

The service sector is the biggest source of employment in developed countries
(Exhibit 4), because they have already experienced the gradual shift in employment
from agriculture to services that occurs as a country grows its GDP per capita. And
while world trade has been growing at a brisk 6.9 percent annually for both
services and manufacturing from 1980 to 2002, the offshoring of services to
emerging markets, though still small, has been growing even faster (Exhibit 5). It
is projected to grow at 30 percent annually from 2003 to 2008 (Exhibit 6). This
would increase its share of services trade from 3 percent to 10 percent, making
it a significant subcomponent of services trade. To put this in perspective, travel


                                                                                       17
Exhibit 4

     THE SERVICE SECTOR PROVIDES THE BULK OF EMPLOYMENT IN HIGH-
     WAGE ECONOMIES                                      Agriculture
                                                                                                                          Manufacturing
       Share of employment by economic sector
       %, 2003                                                                                                            Services

       100% =      428     737      31      74     13     32     10     65      2      4      5       63      16    138    38       28
       (million)

                   23.0
                           38.2
                                   47.0
                                                  53.0   56.0   53.7                        55.6
                                           59.4                        58.7          61.2
                   17.0                                                       65.8                  66.1                   66.4
                                                                                                            74.7   75.6             75.5

                           17.7
                                   15.6


                                                  28.6   25.9
                   60.0                    20.0                 32.0
                                                                       31.3                 39.6
                           44.1                                               27.7   33.3
                                   37.4                                                             29.3                   31.1
                                                                                                            22.4   21.8             23.2
                                           20.6   18.4   18.1   14.3
                                                                       10.0    6.5   5.5    4.8      4.6    2.8    2.5     2.5      1.3
                   India* China Philip- Brazil Poland Mexico Malay- Russia Ireland Hun- Czech    Japan      Can-   U.S.   Ger-      U.K.
                                pines                        sia                   gary Republic            ada           many
     GDP per
     capita
     PPP           3,879   5,925   3,545   9,204 13,292 10,970 11,600 15,629 36,009 14,747 21,115 29,895 35,456 41,880 27,216 30,226
     2005

           * Shares as of 1999.
     Source: ILO; Global Insight WMM; CIA World Factbook                                                                                   4


     Exhibit 5
     GLOBAL SERVICES AND MANUFACTURING TRADE
     HAVE GROWN RAPIDLY OVER THE LAST 20 YEARS

     Global exports by major category – 1980-2002                                                                          CAGR
     $Billion                                                                                      Sector                  1980-2002
     9,000                                                                                                                 %
     8,000

     7,000

     6,000

     5,000                                                                                         Manufacturing                  6.9

     4,000

     3,000
                                                                                                   Services                       6.9
     2,000

     1,000                                                                                         Mining                         1.4

          0                                                                                        Agriculture                    0.1
          1980 1982 1984 1986 1988 1990 1992 1994 1996 1998 2000 2002


       Note: Exports were used to measure global trade. In addition, the data are in nominal dollars since no deflators were
             available from the WTO for services trade.
     Source: WTO; "International Trade Statistics 2003"                                                                                   5


18
Exhibit 6

OFFSHORING REPRESENTS AN EVEN FASTER GROWTH SEGMENT
OF TRADE
                     BPO/IT offshoring to low-wage locations as a
                     percent of total global service exports
                     $Billion                                       Project
                                                                    CAGR

                                                 1,697    2,372*    %
                                 100%


                     Other                                 90            7
                                                   97
                     services*


                   Offshoring to low-
                                                    3      10           ~30
                   wage locations
                                                 2003     2008E

      * Estimated at 6% annual growth from 2002 figure.
Source: WTO; McKinsey Global Institute analysis                               6


represents approximately 30 percent of services trade the Organization for
Economic Co-operation and Development (OECD) countries, while transportation
represents 20 percent.


QUESTIONS ADDRESSED BY OUR STUDY
Our research sheds light on several key questions:

    What is the total number of jobs worldwide that can be globally resourced?
    How close will actual demand for offshoring from developed economies to
    emerging markets come to this potential total? How does the potential for
    offshoring and its degree of adoption differ among industries?

    What is the current supply of labor suitable to perform offshoring services in
    developing markets?


                                                                                     19
How does supply and demand meet? Which countries will provide offshoring
        labor? Will different types of offshoring be attracted to different countries?
        How will offshoring affect employment and wages in developing and
        developed countries?

     The report covers offshoring between a wide range of developed and developing
     countries (36 countries in all). To assess the situation on the ground, six full-
     time team members devoted 12 months to this research. In addition we tapped
     the expertise of consultants at 82 McKinsey offices in 44 countries, as well as
     conducting nearly one hundred interviews with companies in our focus
     countries.

     We also collected the most comprehensive data available on actual offshoring
     demand through interviews with companies and from their own and analysts'
     reports. We collected detailed statistics on labor supply for 16 countries from
     sources of national statistics—making adjustments for consistency when
     necessary—to build the most comprehensive view of global labor markets that
     exists.   We also collected data on 50 separate measures of the cost of
     operating in the 16 focus countries to understand which countries would serve
     as the most attractive offshore locations.

     We determined not only the potential number of jobs that theoretically could be
     relocated offshore, but also the actual demand to date and how that will grow
     over the next five years. In addition, we determined both the potential supply of
     labor in each country as well as the realistic level of supply that is sufficiently
     skilled to provide services to overseas companies. This analysis allows us to
     understand the dynamics that bring together supply and demand in the global
     labor market, including the constraints that might appear and the potential
     impacts on wages and employment in both developed and developing countries.

     We hope that this analysis will ultimately lead to a new way of looking at the
     range of issues presented by the offshoring of services.


20
Executive Summary
“Something new is going on. America is short of jobs as never before, and the
major candidates for our offshore outsourcing are ramping up employment as
never before. So yes, I think two and two is four.”1

"The essential conclusion remains that offshoring, and more broadly import
competition, while clearly having an important effect on some industries,
workers, and communities, were not significant causes of the 'jobless
recovery.'"2

Opinions differ about the dynamics of supply and demand in the emerging global
market for service labor. Some argue that the potential supply of offshore talent
is nearly limitless, while others point to signs of limited supply already forcing
wage increases. Having analyzed potential and likely demand for offshore talent
in the first report in our series, and quantified potential supply in the second, in
this third and final report we look at the fit between the two.

Supply and demand necessarily clear through price, represented in the labor
market by wages. Mapping likely demand for offshore talent against the
potential suitable supply shows that, as the conflicting views indicate, this
market is not clearing smoothly. We discuss measures to improve the market's
efficiency that could be taken both by companies on the demand side and by
policy-makers in countries on the supply side.


1 Stephen S. Roach as quoted in "Who Wins and Who Loses as Jobs Move Overseas?" Erica Kinetz,
  7 December 2003. The New York Times.
2 Charles L. Schnultze. Offshoring, Import Competition and the Jobless Recovery." August 2004.
  Brookings Policy Brief No. 136


                                                                                                 21
Potential supply of low-wage talent is greater than likely demand

     Our results show that, at an aggregate level, the potential supply of suitable
     talent from the 28 low-wage countries we studied exceeds demand for offshore
     talent from companies in high-wage countries. This is true for each of the eight
     occupations we analyzed (Exhibit 1).3 For instance, in 2008 the supply of
     support staff suitable for employment by multinational firms will exceed demand
     by 98 percentage points, and the suitable supply of young professional
     generalists will be 78 percentage points greater than expected demand.

     Exhibit 1

     POTENTIAL SUITABLE SUPPLY EXCEEDS LIKELY DEMAND FOR
     GLOBALLY RESOURCED TALENT IN MOST YOUNG PROFESSIONAL (YP)*
     OCCUPATIONS                                         Likely demand
                                                                                                                     Suitable supply
     Likely low-wage labor demand and suitable supply**, 2008                                                   x    Demand as a
     FTEs thousand                                                                                                   percentage of
                                                                                                                     supply (%)
             31,296


                             3,245


                                             2,184
                                                            1,799

                                                                            1,089           946
       752             722                                                            596                      742
                                                                                                                             333
                                       112             50               0                             2                 1

        Support       Generalist      Finance/        Analyst YP       Nurses       Engineering        Doctors       Life science
        staff         YP              accounting                                    YP                               YP
                                      YP
             2             22                5              3               0             63              ~0                ~0

           * 7 years of work experience.
          ** Assuming constant suitability rates from 2003 to 2008; aggregated low-wage supply from 28 countries.
     Source: McKinsey Global Institute analysis


     Only the supply of available engineers in low-wage countries is less abundant,
     contrary to opinion among many engineers in high-wage countries. Even if the
     combined supply of all 28 low-wage countries we studied is utilized, wage rises
     for engineers would reflect constraints in low-wage supply as early as 2015 if
     we assume an aggressive rate of growth in offshore demand for this occupation,

     3 The occupations are: engineers, finance and accounting professionals, analysts, life science
       researchers, doctors, nurses, generalists, and support staff.


22
and an annual growth rate of 5 percent in the supply of labor suitable for
employment in multinationals. If countries were to implement measures to make
more of their graduates suitable for such employment, and supply were thus to
grow at higher rates, this scenario would likely change (Exhibit 2).

Exhibit 2

AT CURRENT SUITABILITY RATES AND AN AGGRESSIVE PACE OF
ADOPTION IN DEMAND, SUPPLY OF ENGINEERS COULD BE
CONSTRAINED BY 2015                              Demand at current
                                                                                                           PoA**
                                                                                                           Demand at aggressive
            Demand and supply* for low-wage engineers, young professionals                                 PoA** after 2008
                                                                                                           Supply at current
            FTEs                                                                                           suitability rate
                                                                                                           Supply at increased
            3,500,000
                                                                                                           suitability rates
                               Project               Growth rates applied
            3,000,000
                               forecast
                               period
            2,500,000

            2,000,000

            1,500,000

            1,000,000

               500,000

                       0
                       2003       2006     2009      2012      2015      2018      2021 Years
       * Supply forecast is based on extrapolation of 10 low-cost countries to a further 18 low-cost countries and does not
         include effects of supply fragmentation.
     ** Pace of adoption is the rate at which companies are pursuing offshoring.
Source: McKinsey Global Institute analysis


Local supply/demand inefficiencies persist

Matching supply and demand at this aggregate level gives an illusory impression
of plenty. In practice, misalignment between supply and demand is creating
localized labor supply constraints. On the supply side, potential employees are
widely dispersed across low-wage countries and far from perfectly mobile. On
the demand side, companies hiring offshore frequently follow each other to
locations that have a track record in providing offshore talent. The resulting
agglomeration of companies in popular locations has some positive effects,
such as accelerating improvements in infrastructure, communications and the
business environment. But it also leads to a concentration of demand in limited
supply pools, which puts upward pressure on local wages and attrition levels.


                                                                                                                                  23
Agglomeration is already affecting the supply and cost of labor in some cities in
     Eastern Europe and India. For example, if current demand trends continue, the
     supply of suitable labor in Prague and Hyderabad will be constrained as early as
     2006 and 2008, respectively. (Labor market conditions in these two cities are
     examined in detail in this report.) And once companies have chosen a location,
     it is hard for them to switch to another one because of sunk costs in physical
     and human capital.

     Agglomeration effects could also be felt at a country level in certain
     occupations. At present, India, the Philippines, and China are often the top
     choices for locating IT and engineering-based services for companies from the
     United Kingdom and the United States, the main sources of demand. If U.S. and
     UK companies continue to concentrate their activities on these three countries
     and current rates of offshoring persist, the demand for engineers from these two
     countries would fully absorb the suitable supply by 2011 (Exhibit 3).

     Exhibit 3

     US AND UK DEMAND COULD ABSORB THE ENTIRE SUPPLY OF
     SUITABLE YOUNG PROFESSIONAL ENGINEERS FROM CHINA, INDIA
     AND THE PHILIPPINES BY 2011                         Demand from
                                                                                                          US and UK
                          Demand (from US and UK) and suitable supply* (from China,
                                                                                                          Suitable supply
                          India, and Philippines) for low-wage young professional                         from China, India,
                          engineers**                                                                     and Philippines
                          FTEs
                          1,000,000
                            900,000
                            800,000
                            700,000
                            600,000
                            500,000
                            400,000
                            300,000
                            200,000
                            100,000
                                 0
                          2003 2003            2005       2007      2009       2011      2013     2015
                        demand is
                         170,000                                                                  Years

           * Supply forecast does not include effects of supply fragmentation and local demand.
          ** 7 years of work experience.
     Source: McKinsey Global Institute analysis


24
Demand will disperse if companies analyze potential offshore locations
rationally according to their specific needs

Companies have different requirements from offshore locations, depending on a
host of factors including their home market, their first language, what activity
they want to offshore, the scale on which they want to offshore, and whether they
want to outsource or set up a captive operation. This means different
companies will assign different costs and benefits to the same location. Put
another way, there is no single, homogeneous supply curve in the emerging
global labor market—every company faces a different curve.

This feature of the market will act as a natural force for dispersing demand to
fit supply more congruently, if companies act rationally to harness it. To do so,
they need better information about the talent supply that suits their needs, and
they also need to know the real costs of employing suitable talent in any
potential location. Companies will find more information on the distribution of
suitable talent across developing countries in "The Supply of Offshore Talent in
Services," our previous report in this series. But each company needs to make
its own analysis of location costs for each potential location.

What will that analysis entail? First, a company needs to define in detail the
criteria governing its choice of location. At a broad level, these are likely to
include: labor cost; the quality of local service vendors; market potential; the
intrinsic risks of the location; its business environment; and the quality of its
infrastructure. The company can then weigh these criteria according to its
particular goals and requirements. When it has gathered the relevant data about
the criteria from each potential location, it can calculate its own true cost of
offshoring in any of them. (In this report we describe the Location Cost Index, a
data-based tool created along these lines for assessing potential offshoring
locations.) A company that ranks potential locations in order of their true cost
will in effect be drawing its unique supply curve.

If companies consider only current wage levels in their assessments of
offshoring locations, then India and China will seem the best choice to all of
them, as these three countries at present have the lowest average labor costs
for services workers. But when companies rank countries according to their
unique cost criteria, more locations will emerge as attractive to more companies
(Exhibit 4). Our database on supply countries shows they vary considerably on
the basic cost criteria.
                                                                                    25
Exhibit 4

     RANKING OF POTENTIAL OFFSHORE LOCATIONS VARY
     ACCORDING TO COMPANY'S UNIQUE CRITERIA                                                                                                                     Attractive country

     Company specific Reference
     weighting factor country*** Company specific LCI for countries****


                                                                                                                                                                 Germany
                                                           Malaysia


                                                                                                            Republic
                                                                                                  Hungary


                                                                                                                                       Canada
                                                                                         Mexico


                                                                                                                       Poland


                                                                                                                                                                           Ireland
                                                                                                                                                Russia
                                                                                                            Czech
                                                                      Philip-


                                                                                                                                                                                      Japan
                                                   China


                                                                                Brazil
                                                                      pines
                                           India


                                                                                                                                U.S.


                                                                                                                                                         U.K.
       Highest                                                                                                                                  3.2      3.4    3.5        3.5       3.7
                                                           2.5                  2.7      2.7      2.9        2.9       3.0      3.0    3.1
       weight on               U.S.       2.3      2.4                 2.6
       cost*


     Relatively high
     weight on                                                                                                                                  3.3                        3.2       3.6
                               U.S.       2.8      3.0     2.7         3.0               2.6      2.8        2.8       3.0      2.5    2.5               3.0    3.1
     business                                                                   2.6
     environment
     (convenience)**


     Relatively high
     weight on                                                                           3.1                                           3.1                                           3.6
                                          2.5      2.8     2.6         2.9      2.8                                    2.5      3.0             2.8      2.9    2.6        2.8
     business               Germany                                                               2.3        2.3
     environment
     (convenience)**

            * Cost:50%, vendor landscape:10%, market potential:10%, risk profile:10%, business environment:10%, quality of infrastructure:10%
           ** Cost:35%, vendor landscape:0%, market potential:0%, risk profile:20%, business environment:35%, quality of infrastructure:10%.
              Within business environment, travel time is assigned higher weighting
          *** The reference country is the company's home country from whose viewpoint locations are evaluated
         **** Location Cost Index. In this ranking 1 is the most attractive and 5 is the least attractive
      Source: Location cost index database


     Global resourcing will raise average wages in low-wage countries and have
     muted impact on employment and wages in high-wage countries

     What would be the effect on wages of engineers in low-wage countries if labor
     cost was the most important factor in the choice of location for all U.S.
     companies seeking to employ engineers offshore? Our analysis shows that
     demand would be satisfied by supply from the Asian countries plus a fraction of
     supply from Latin American countries (Exhibit 5). Average wage levels in
     countries to the left of the point where the market clears in this analysis could
     likely double. While wages will increase, making offshoring to low-wage countries
     less attractive, they will not reach wage levels for the same occupations
     prevailing in the United States or Western Europe. Instead, the market will clear
     when wages for offshore engineers are roughly equivalent to the level of wages
     in Mexico or Brazil, or about 30 percent the level of wages for engineers in the
     United States (Exhibit 6).


26
Exhibit 5

IF ALL COMPANIES SEEKING YOUNG PROFESSIONAL ENGINEERS
WERE COST-DRIVEN, THEIR LIKELY DEMAND WOULD BE SATISFIED BY
TALENT FROM COUNTRIES LEFT OF MEXICO…
Demand for remote labor vs. supply curve – young professional engineers*, 2008


LCI**
                                              Demand: 596k
3.80
                                                                                                                                                                                                                                                                        Ireland
                         Other Latin American
3.40                                                                                                                                                                   South Africa
                         countries***
                                          Hungary                                                         Czech Republic


                                                                                                                                                                                                                     Mid-wage Asia-Pacific Countries***
3.00


                                                                                                                                                                        Other Eastern European countries***
                                                  Mexico
                                                        Brazil
                                                         Other low-wage Asian countries***


2.60
                         Malaysia


                                                                                                                                                                                                                                                                            Germany

                                                                                                                                                                                                                                                                                       Japan
2.20
                                                                                                                                                  Canada                                                                                                         U.K.
                                                                                                                                                            Russia
                                                                                                      Poland
                                          Philippines


                                                                                                                            U.S.
1.80
           India         China

1.40


1.00
       0           200              400                                                      600               800        1,000      1,200         1,400                                             1,600                                                  1,800                2,000

                                                                                                                                                                                                                                                          Size of suitable labor pool
                                                                                                                                                                                                                                                          thousands
       * 7 years of work experience; supply does not consider limited talent accessibility and domestic labor demand
      ** Location cost index. Applied the weighting of cost: 50%, vendor: 10%, market: 10%, risk: 10%, infrastructure: 10%, and environment: 10%
     *** The LCI values for the other countries are estimated
Source: McKinsey Global Institute analysis


Exhibit 6

…AND WAGES OF YOUNG PROFESSIONAL ENGINEERS IN THOSE
COUNTRIES COULD RISE TO APPROXIMATELY 30% OF U.S. LEVEL*
                                                                                                                                                                                                                                                                    Current labor cost
                                                                                                                                                                                                                                                                    Estimate of
Comparison of hourly labor cost; Index**, U.S. = 100                                                                                                                                                                                                                wage inflation

                                                                                                                                                                                                                                                                                               158


 Assumption
 • 596,000
   engineer young                                                                                                                                                                                                                                                                116
   professionals                                                                                                                                                                                                                                           108      111
   are globally                                                                                                                                                                                                100
   resourced
   in 2008                                                                                                                                                            84
 • All companies
   are strong cost
   seekers***
 • Wage in low-
   cost countries
                                                                                                                                                       46
                                                                                                                                             41
   raise to match                                                                                  30-35                      36    37
                            25-30                              25-30                                                 28
   LCI value of                      20-25                                                                     27
   Brazil/Mexico

                                                                                             19     20
                              12          13

                            India Philip- China Mala- Mex- Brazil Po-                                                              Hun-   Czech Rus-                 Can-                                     U.S.                                        Ire-      U.K. Japan Ger-
                                  pines         ysia ico          land                                                             gary   Re-    sia                 ada                                                                                  land                 many
                                                                                                                                          public
      * Does not consider stickiness, limited talent accessibility, domestic labor demand and manager scarcity which
        might inflate wages beyond these levels at least for some occupational categories.
     ** Hourly labor cost reflects average of all job categories within a country
    *** Weighting of labor cost with 50% within LCI
Source: Watson Wyatt; local sources (e.g., Labor census); interviews, McKinsey Global Institute analysis


                                                                                                                                                                                                                                                                                                     27
Wage costs overall in supply countries will rise more slowly if companies select
     locations according to their unique requirements. The resulting mixture of
     rational location strategies will disperse demand so that it fits more evenly with
     the distribution of suitable supply.

     In contrast, local wage inflation will likely continue in some offshoring locations
     as long as companies concentrate their demand on a few cities. Because it is
     hard for companies to switch locations quickly, individual companies may see
     wages in their chosen offshoring location rise above the levels of neighboring
     countries along their individual cost curve, if demand in their chosen location
     begins to outstrip supply.

     Offshoring will have little effect on wage levels in developed countries because
     it will have only a small impact on overall employment in those countries in the
     occupations we analyzed. Consider the impact in the United States. Over the
     past 30 years, the United States has experienced an 11 percentage point
     decline in manufacturing jobs, but wages have remained stable. By comparison,
     we estimate that a total of 9 percent of jobs in services in the United States
     could theoretically be performed remotely. However, it is unlikely that all these
     potentially transferable jobs will move offshore over the next thirty years,
     because of the considerable barriers to offshoring detailed in the first report in
     this series.4 Assuming that half the potentially transferable service jobs—a
     more realistic estimate, although still high—are actually relocated offshore over
     that period, the resulting job turnover would be around 225,000 jobs per year—
     or 1-2 percent of the 16 million jobs created5 per year in the U.S. economy.

     Countries providing offshore talent can take steps to attract "best fit"
     companies

     Since there is no general, fixed ranking of offshoring locations from the demand
     perspective, there is no preordained set of "winners and losers" on the supply
     side. Individual countries seeking to attract offshoring investment should target
     those companies and sectors whose requirements most closely match what the
     country can already offer, and then hone their attractive features. That strategy


     4 The Emerging Global Labor Market. Part I-Demand for Offshore Talent in Services. Available at
       www.mckinsey.com/mgi.
     5 Douglas Brown and Scott Wilson The Black Book of Outsourcing: How to Manage the Changes,
       Challenges and Opportunities. Wiley, 2004.


28
depends on supply countries forming a clear understanding of their potentially
attractive features and which sectors or companies might favor them. Countries
on the supply side of the emerging labor market will also benefit greatly from
marketing their attractions to their target sectors. This is especially true for
countries whose characteristics are rather similar to surrounding, and therefore
competing, peers.

Concerning the attractiveness of a location's labor supply, the focus of
government efforts should be on improving the quality of graduates rather than
growing sheer numbers of graduates, as we explain in our second report in this
series.6 Other important attractiveness factors that governments can influence
in the short to medium term are their support for foreign investors, the state of
the infrastructure, the competitiveness of their tax regime, and the effectiveness
of intellectual property law.

Finally, policy-makers and educational institutions in high-wage countries should
equip their graduates to work effectively with their peers in today’s low-wage
countries. In Europe, for example, those countries and companies that
encourage their graduates to look for opportunities to the east, with appropriate
language training, funded exchange programs and internships, will be best
placed to benefit from the talent pool represented by new EU members, such as
Hungary, the Czech Republic, and Poland and by emerging markets in Asia.


                                           ***


6 The Emerging Global Labor Market Part II-Supply of Offshore Talent in Services. Available at
  www.mckinsey.com/mgi


                                                                                                 29
Synthesis
INTRODUCTION
Opinions differ about the fit between supply and demand in the emerging global
market for service labor. Some argue that the potential supply of offshore talent
relative to demand is nearly limitless, while others point to signs of limited
supply already forcing wage increases. To date, however, the facts required to
resolve this debate have been missing, in particular the answers to the following
key questions:

    How does demand for offshore labor from companies in high-wage countries
    match the supply of suitable offshore labor from low-wage countries?

    Will a defined set of countries with similar supply characteristics continue to
    provide the bulk of offshoring labor, or will different countries attract different
    types of offshored functions?

    How will offshoring affect employment and wages in developing and
    developed countries?

Building on research described in the two previous reports in this series, in this
third and final report, the McKinsey Global Institute (MGI) offers answers to
these and several related questions.

The first report in the series, "The Demand for Offshore Talent in Services,"
presented estimates of current and future demand at an occupational level from
eight sectors1 for jobs that could be resourced globally (i.e., performed anywhere

1 The eight sectors evaluated were: auto, health care, insurance, IT services, packaged software,
  pharmaceuticals, retail banking, and retail

                                                                                                    30
in the world). These sectors together account for approximately 15 percent of
     the world's nonagricultural employment.

     The second report, "The Supply of Offshore Talent in Services," estimated the
     availability of low-wage labor to meet this demand at an occupational level. It
     quantified the supply of talent suitable for employment in multinational
     companies (MNCs) in 28 low-wage countries and eight mid- to high-wage
     countries.2

     In this report we analyze how demand and supply meet for the eight
     occupations3 that we previously evaluated. In the end, supply and demand will
     necessarily clear through price, represented in this market by wages.4 However,
     mapping likely demand against potential supply shows that, as the conflicting
     views reported previously indicate, this market is not clearing efficiently. The
     report shows where inefficiencies in the market are apparent, and the impact of
     the market's development on both high-wage and low-wage countries. We
     discuss measures to improve the market's efficiency that could be taken both
     by companies in high-wage economies on the demand side and by policy-makers
     in low-wage countries that wish to attract offshoring investment.

     The report is divided into five sections:

         Matching supply and demand at a global level examines the fit between the
         supply of suitable talent from low-wage countries and the likely demand for
         offshore talent from companies in high-wage countries.

         Evaluating inefficiencies in the market discusses reasons for inefficiencies
         in the fit between potential supply and likely demand, including
         agglomeration effects (and their particular impact on two current offshoring
         "hub" cities), and "stickiness" effects.


     2 Mid- to high-wage countries studied in-depth were: Canada, Germany, Ireland, Japan, the United
       Kingdom, and the United States; Australia and South Korea were studied by way of extrapolation.
       Low-wage countries included in the in-depth study were: Brazil, China, Czech Republic, Hungary,
       India, Malaysia, Mexico, Philippines, Poland, and Russia; other low-wage countries studied were:
       Argentina, Bulgaria, Chile, Colombia, Croatia, Estonia, Indonesia, Latvia, Lithuania, Romania,
       Slovakia, Slovenia, South Africa, Thailand, Turkey, Ukraine, Venezuela, and Vietnam.
     3 The eight occupations analyzed were: engineers, finance and accounting professionals, analysts,
       life science researchers, doctors, nurses, generalists, and support staff.
     4 Therefore, when we refer to "supply exceeding demand" in a market, this can be properly viewed
       as a situation where pressure on wages will be present.


31
Selecting locations for global resourcing discusses how companies can take
   a more analytical approach to selecting offshore locations and the impact
   that will have on the emerging global labor market. This section introduces
   the Location Cost Index, a data-based tool for evaluating offshoring locations
   populated with data from the potential offshoring locations we studied.

   The impact of offshoring on wages in low-wage and high-wage countries
   presents the potential evolution of wages in developing nations in the light
   of offshoring and explains why its effect on wages in developed countries is
   likely to be negligible.

   Implications for companies and countries examines what these findings
   mean for multinational companies seeking to locate service functions in low-
   wage countries, for developing countries seeking to attract such investment,
   and for policy-makers in developed countries.


MATCHING SUPPLY AND DEMAND AT A GLOBAL LEVEL
We matched our estimates of aggregate demand for globally resourced labor
from companies in high-wage countries to the supply of labor suitable for
employment in multinational companies in 28 low-wage countries. The results
show that—at this effectively global level—the potential supply of labor in low-
wage locations exceeds demand for the eight occupations we analyzed to 2008
(Exhibit 1). Only the available supply of engineers in low-wage countries is
somewhat less abundant at this level, contrary to opinion among many
engineers in high-wage countries. Other occupations with a relatively closer
match between supply and demand are young professional generalists and
young professional analysts.

However, it is important to note that our estimate of total supply is based on
data collected from 10 low-wage countries and extrapolated to a further 18 low-
wage countries. In addition it assumes that all talent is available. It does not
take into consideration the facts that not all suitable graduates in supply
countries are accessible to multinationals for employment and that, in China,
offshoring companies must compete with demand for talent from players serving
the fast-growing domestic market and export-oriented manufacturing. (Both are
discussed in depth in "The Supply of Offshore Talent in Services"). Lastly, we


                                                                                    32
include in our analysis countries that, although they have low wage levels and
     are indeed potential locations for offshored activities, are not currently
     considered by companies as top offshoring locations.

     Exhibit 1
                                                                                                                     Likely demand
     POTENTIAL SUITABLE SUPPLY EXCEEDS LIKELY DEMAND
                                                                                                                     Suitable supply
     FOR GLOBALLY RESOURCED TALENT IN MOST YOUNG
                                                                                                                 x Demand as a
     PROFESSIONAL (YP)* OCCUPATIONS                                                                                percentage of
     Likely low-wage labor demand and suitable supply**, 2008                                                      supply (%)

     FTEs thousand
             31,296


                             3,245


                                             2,184
                                                            1,799

                                                                            1,089           946
       752             722                                                            596                      742
                                                                                                                             333
                                       112             50               0                             2                 1

        Support       Generalist      Finance/        Analyst YP       Nurses       Engineering        Doctors       Life science
        staff         YP              accounting                                    YP                               YP
                                      YP
             2             22                5              3               0             63              ~0                ~0

           * 7 years of work experience.
          ** Assuming constant suitability rates from 2003 to 2008; aggregated low-wage supply from 28 countries.
     Source: McKinsey Global Institute analysis


     Engineers

     At current rates of growth in offshoring by companies and growth in the supply
     pool, we estimate that the combined supply of qualified young professional
     engineers from all 28 low-wage locations might begin to be constrained by
     2023. Indeed, average wages for engineers from the 28 supply countries would
     rise as early as 2015 if we assume an aggressive rate of growth in demand for
     this occupation. However, these supply constraints arise when we assume an
     annual growth rate of 5 percent in the supply of labor suitable for employment
     in multinationals. If countries were to implement measures to make more of
     their graduates suitable for such employment and supply were thus to grow at
     higher rates, these scenarios would likely change (Exhibit 2).


33
Exhibit 2
                                                                                                           Demand at current
AT CURRENT SUITABILITY RATES AND AN                                                                        PoA**
AGGRESSIVE PACE OF ADOPTION IN DEMAND,                                                                     Demand at aggressive
                                                                                                           PoA** after 2008
SUPPLY OF ENGINEERS COULD BE CONSTRAINED BY                                                                Supply at current
                                                                                                           suitability rate
2015                                                                                                       Supply at increased
            Demand and supply* for low-wage engineers, young professionals                                 suitability rates
            FTEs
            3,500,000

                               Project               Growth rates applied
            3,000,000
                               forecast
                               period
            2,500,000

            2,000,000

            1,500,000

            1,000,000

               500,000

                       0
                       2003       2006     2009      2012      2015      2018      2021 Years
       * Supply forecast is based on extrapolation of 10 low-cost countries to a further 18 low-cost countries and does not
         include effects of supply fragmentation.
     ** Pace of adoption is the rate at which companies are pursuing offshoring.
Source: McKinsey Global Institute analysis


Generalists and pure analysts

For these two groups, our analysis shows that no constraints on supply will
appear if all 28 low-wage countries are considered. Since supply is not
constrained, changes in the level of demand will do the most to determine the
evolution of the emerging global market for talent in these occupations.


EVALUATING INEFFICIENCIES IN THE MARKET
The impression given by these figures of plentiful supply at the global and
country level is somewhat illusory. In fact, companies hiring offshore frequently
follow each other to cities or locations that already have a track record in
providing offshore talent. The resulting agglomeration of companies in popular
locations has some positive effects, such as accelerating improvements in
infrastructure, communications, and the business environment. But it also leads
to concentrated demand, which in turn leads to higher local wages and levels of
attrition. These negative effects may persist because of "stickiness" factors
making it hard for companies to switch locations.

                                                                                                                                  34
Agglomeration

     Agglomeration effects—benefits that all players enjoy due to the clustering of
     companies that perform similar activities in the same area—can be a powerful
     justification for companies to locate activities close to those of competitors or
     related industries. Manufacturing clusters, as in the Guangdong province of
     China, foster strong economies of scale, efficiencies in distribution, and
     concentration of infrastructure. High-tech clusters like the one in Silicon Valley
     foster innovation by facilitating interaction between "knowledge workers" in
     companies and research institutions. Clustering promotes other general
     advantages for a location including more vendors, more flights, better roads, and
     an improving business environment thanks to greater government support. Such
     advantages create positive externalities, so each additional member of the
     cluster will attract more followers.

     However, cluster growth can eventually produce negative effects, mainly
     increases in wages and attrition rates as the labor supply becomes constrained.
     Recruiting costs and real estate costs tend to go down as agglomeration
     increases, but then rise as the cluster gets crowded (Exhibit 3). Agglomeration
     can continue to increase a location's attractiveness for a long time if the local
     labor supply is vast and positive factors, such as R&D benefits, are strong.
     However, if labor supply or real estate are limited, the attractiveness of the
     location begins to decrease as soon as those limits are approached (Exhibit 4).

     The impact of agglomeration on cities

     Because pools of suitable labor are dispersed among and within countries and
     talent is not perfectly mobile, labor supply constraints can be visible much earlier
     in particular cities or regions than the aggregate size of a country's labor pool
     might imply. Agglomeration is already affecting the supply, cost of labor, and levels
     of attrition in some cities in Russia, Eastern Europe, and India, particularly for
     engineers and middle managers. We believe that several locations are at or past
     the peak of their attractiveness. In Prague and Hyderabad, two cities where the
     number of offshore operations has been growing strongly, the supply of suitable
     engineering labor may be constrained as early as 2006 and 2008 respectively.

        Prague. Several Eastern European cities have emerged as global resourcing
        destinations in the past decade, especially Budapest, Prague, Bratislava, and
        Krakow. These cities cater to nearby Western European countries who find in

35
Exhibit 3

AGGLOMERATION CAUSES SOME LOCATION ATTRACTIVENESS
FACTORS TO IMPROVE WHILE OTHERS DETERIORATE

                                                                        Agglomeration first
                     Agglomeration                                      increases, then                              Agglomeration
                     increases attractiveness                           decreases attractiveness                     decreases attractiveness


                                                                                                    Attractiveness
    Attractiveness


                                                       Attractiveness


                        Cluster employment                                 Cluster employment                           Cluster employment

                     Location attractiveness factors
                     • Vendor landscape                                 • Recruiting costs                           • Wages
                     • Convenience                                      • Real estate costs                          • Attrition rates
                     • Business and living
                      environment
                     • Infrastructure
                     • R&D/human capital spillovers


Source: McKinsey Global Institute analysis


Exhibit 4

OVERALL, AGGLOMERATION CAN INFLUENCE LOCATION
ATTRACTIVENESS DIFFERENTLY UNDER DIFFERENT SCENARIOS


                     Scenario A – Uniformly                             Scenario B – Peaking                         Scenario C – Oscillating
                     positive agglomeration effects                     agglomeration effects                        agglomeration effects
                                                      Attractiveness


                                                                                                   Attractiveness
   Attractiveness


                        Cluster employment                                 Cluster employment                           Cluster employment

                     • Likely when positive                             • Likely when positive                       • Likely when positive
                      externalities are strong                           externalities are                             externalities are weak and
                      and labor/real estate                              weak and labor/real                           labor/real estate supply
                      supply are ample                                   estate supply limited                         can respond to shortages
                                                                                                                       in medium-term


Source: McKinsey Global Institute analysis


                                                                                                                                                    36
Eastern Europe the combined advantages of relatively low labor costs,
     speakers of multiple Western languages, and proximity. While most of the
     companies that offshore to Eastern Europe have headquarters in Germany,
     the United Kingdom, the Netherlands, and Scandinavian countries, these
     cities are also becoming increasingly attractive to Indian vendors who want
     to establish a presence close to Western Europe.

     - Since 2000, several Western European and U.S. companies have selected
      Prague as a global resourcing location. In addition to the advantages that
      it shares with other Eastern Europe cities, effective self-marketing by the
      Czech government agency and Prague's attractive living environment have
      been decisive factors in its success.

     - Offshore centers near Prague are notable for their variety and growth.
      Companies from diverse sectors (electronics, automotive, logistics, and
      software) have bundled their European shared services in captive centers
      in the city. These perform a wide range of activities including finance and
      accounting processes, call-center operations, IT services, and software
      R&D. At least 16 large centers have been established in the past four
      years, and their demand for talent is growing. Total demand for labor from
      new engineering-focused centers has grown by roughly 50 percent a year
      since 2001, and three of these centers have plans to employ around
      1,000 FTEs by 2008 (Exhibit 5).

     - Universities and colleges in the region graduate approximately 2,200
      engineers per year. Roughly half of these new graduates are suitable for
      work in a multinational company. The supply of suitable local talent is
      growing at approximately 6 percent a year. However, if we assume that, by
      2008, new engineering centers in the area will require about 550 FTEs and
      employment at the existing centers grows by 20 percent, then offshore
      centers alone will employ most of the suitable engineers in Prague (Exhibit
      6). Wage increases for software and computer engineers beyond 10
      percent per year, well above the average wage growth for service workers,
      indicate the beginning of supply constraints for this occupational group. So
      do reports from managers of the larger centers that they have started to
      recruit talent from other Czech and Slovakian cities (e.g., Brno, Bratislava)
      to meet their demand for labor in Prague.


37
Exhibit 5
                                                                                                                 Number of new
SINCE 2000, PRAGUE HAS SEEN A STRONG RISE IN THE                                                                 centers opened
ESTABLISHMENT OF ENGINEERING-FOCUSED GLOBAL
RESOURCING CENTERS

• At least 10 larger                   Total initial employment demand of engineering-focused
  centers focusing on                  global resourcing centers by starting year
  engineering activities
  have been established
  in Prague since 2000                                                                           3

• Establishing companies                                                                        550
  are active in several                                         CAGR:
  sectors                                                       ~54%
  – IT services                                                                   2
  – Software
  – Electronics                                                              330                                     2
  – Logistics
  – Automotive                                                                                                    225
                                                1
• Headquarter locations                                        2
  of companies include
                                               150
  Germany, the Nether-                                         90
  lands but also India


                                             2001            2002            2003               2004              2005
                                                                                                             (Up to April)

Source: Company Web sites; press releases


Exhibit 6

                                                                                                  Suitable engineering graduates
GLOBAL RESOURCING CENTERS WILL EMPLOY                                                             from Prague universities/colleges*
ALMOST ALL SUITABLE ENGINEERING                                                                   Demand for engineers by Global
                                                                                                  resourcing centers
GRADUATES IN PRAGUE BY 2008                                                                       Share of suitable supply demanded
                                                                                                  by Global resourcing centers

Supply/demand for suitable engineering graduates in Prague

                                                                     Projection (assuming constant demand from
                                                                     establishment of additional centers and 20%
                                                                     annual employment growth of existing ones)
                                                                                                                     84%
                                                                                                     76%
                                                                                      70%
                                                                      64%                                              1,436
                                            39%         59%                                           1,350
                                                                                        1,270                 1,205
                 20%           18%                                        1,194
    7%                                                      1,122
                                            1,055                                               1,031
                                 992
                    932                                                           886
       877
                                                                    765
                                                      664

                                         407

              189          179
  58

  2000          2001         2002         2003          2004         2005             2006        2007            2008
      * Assuming ~6% annual growth equal to all of the Czech Republic.
Source: Company Web sites; press releases; University Web site; Czech Ministry of Education; McKinsey Global Institute
        analysis


                                                                                                                                       38
Hyderabad. The scarcity of local engineers in Hyderabad is even more
     striking.

     - In the late 1990s, some companies, mostly U.S. and Indian, began to look
       beyond the "first tier" of offshoring locations in India such as Bangalore
       and Mumbai. Hyderabad emerged as a sizable hub for software and IT
       intensive activities once large IT outsourcers like TCS and Satyam
       established operations there. Even though business process outsourcers
       followed, Hyderabad is still a location largely for software/IT-industry
       activities. Several major U.S. software vendors have established captive
       centers in the city.

     - Altogether, at least 20 large centers focusing on engineering activities have
       been established in Hyderabad since 1998. The years from 2002 onward
       saw explosive growth in activity in the city. In 2004 alone, six new centers
       were established, together employing approximately 5,000 FTEs (Exhibit 7).

      Exhibit 7
                                                                                                               Number of new
      SINCE 1998, HYDERABAD HAS SEEN THE ESTABLISHMENT                                                         centers opened
      OF MANY LARGE ENGINEERING-FOCUSED GLOBAL
      RESOURCING CENTERS

       • At least 20 larger                  Total initial employment demand of engineering-focused global
           centers focusing on               resourcing centers by starting year*
           engineering activities
           have been established
           in Hyderabad since
           1998                                                                                                    6
       •   Establishing companies
           are mostly active in IT
                                                                                                                 5,100
           services and software                                               CAGR:                    6
           development                                                         ~60%
                                                                                                      3,800
       •   Operations are equally
           captive and third party
       • Headquarter locations
           of companies are                                                                  4
           almost exclusively US
           and India                               1          1         1             1    1,300

                                                 300        400        480        460


                                                 1998       1999       2000       2001      2002      2003       2004

              * Starting year employment was calculated based on 2004 employment using an assumed 20% annual growth rate
      Source: Company Web sites; press releases; McKinsey Global Institute analysis


39
- Universities and colleges in the region graduate roughly 25,000 engineers
      a year, of whom about 25 percent are likely to be suitable for work in
      multinationals. That will not be enough to meet demand for engineers at
      current growth rates. Demand for engineers will surpass suitable local
      supply as early as 2006, and reach 138 percent of supply by 2008. In
      2006, offshore centers in Hyderabad will already be relying on recruiting
      labor from elsewhere, even at the young professional level (Exhibit 8).

     Exhibit 8
                                                                                                             Suitable engineering graduates
     AT CURRENT GROWTH RATES, DEMAND FOR                                                                     from Hyderabad
                                                                                                             universities/colleges*
     SUITABLE ENGINEERS IN HYDERABAD WILL                                                                    Demand for engineers by Global
                                                                                                             resourcing centers
     EXCEED LOCAL SUPPLY BY MORE THAN 3,000                                                                  Share of suitable supply demanded
                                                                                                             by Global resourcing centers
     Supply/demand for suitable engineering graduates in Hyderabad
     Thousand

                                                                                           Projection (assuming constant demand
                                                                                           from establishment of additional centers
                                                                                           and 20% annual employment growth of
                                                                                           existing ones)

                                                                                                                                    138%

                                                                                                                      121%        11.3

                                                                                                       106%           9.4
                                                                                           93%
                                                                                81%                                                      8.2
                                                        23%         58%                                7.8                  7.8
                                                10%                                              7.1          7.4
         4%         7%              9%                                               6.7   6.5
                                                             6.1         6.4
                                    5.5          5.8
            5.0         5.3                                                    5.5

                                                                   3.7


                                                       1.4
      0.2         0.4         0.5         0.6


        1998        1999        2000        2001        2002        2003        2004        2005        2006           2007          2008


            * Assuming ~5% annual growth equal to all of India
     Source: Company Web sites; press releases; McKinsey Global Institute analysis


The impact of agglomeration on countries

Agglomeration effects could be felt at a country level in certain occupations if
current trends continue. Using data from the case studies of sectoral demand
that form part of the first report in this series,5 we found that the United States
and the United Kingdom together will account for 69 percent of the demand for
globally resourced young professional engineers by 2008, while demand from


5 "The Demand for Offshore Talent in Services"


                                                                                                                                                 40
Germany and Japan will be much less significant (Exhibit 9). On the supply side,
     although several other countries are also offshoring locations, India, the
     Philippines, and China are very often the top choices among companies
     offshoring IT- and engineering-based services. We therefore matched demand
     for young professional engineers from the United States and the United
     Kingdom to the supply from India and China. We found that it would exhaust
     supply from these two countries by 2008. If supply from the Philippines is
     included, demand from the United States and the United Kingdom growing at
     current rates will exhaust the supply of young professional engineers from these
     three countries by 2011 (Exhibit 10).


     Exhibit 9

                                                                             Percent of total
     THE U.S. ACCOUNTS FOR AROUND HALF OF
                                                                           SPLIT BASED ON
     DEMAND FOR OFFSHORED ENGINEERS                                      IT SERVICES CASE

     Demand for offshored engineers, 2008
     FTEs, thousand

       U.S.                                          315        53


       U.K.                               95                    16


       Rest – EU 15                       94                    16


       Germany                   33                             6


       Japan                13                                  2


       Other*                     43                            7


                                                  Total offshored engineers (young
                                                   professional) in 2008: 596,000
           * E.g., Canada, Ireland.
     Source: McKinsey Global Institute analysis


41
Exhibit 10
                                                                                                          Demand from
U.S. AND U.K. DEMAND COULD ABSORB THE ENTIRE                                                              US and UK
SUPPLY OF SUITABLE YOUNG PROFESSIONAL                                                                     Supply from
ENGINEERS FROM CHINA, INDIA AND THE PHILIPPINES                                                           China, India,
                                                                                                          and Philippines
BY 2011
                     Demand (from US and UK) and supply* (from China, India, and
                     Philippines) for low-wage young professional engineers**
                     FTEs
                     1,000,000
                       900,000
                       800,000
                       700,000
                       600,000
                       500,000
                       400,000
                       300,000
                       200,000
                       100,000
                           0
                    2003    2003          2005      2007      2009       2011      2013      2015 Years
                  demand is
                   170,000
      * Supply forecast does not include effects of supply fragmentation and competing demand.
     ** 7 years of work experience.
Source: McKinsey Global Institute analysis


Stickiness

If a company finds that agglomeration makes conditions in its chosen offshore
location deteriorate, management may not be able to relocate quickly to a better
place. The higher a company's initial capital outlay to set up an offshore
enterprise, the "stickier" the location is likely to prove, because management
will be looking for enough cost savings from any new location to make good the
investment sunk in the first one. Offshored activities require different levels of
investment in physical capital, making some "stickier" than others (Exhibit 11).

Similarly, companies invest heavily in developing human capital in their offshore
activities, just as they do in their existing locations, with the development of
knowledge workers requiring the most time and resources. The more a company
has invested in human capital formation in their chosen location, the less likely
it is to move as conditions in that locale deteriorate.

The cost of building human capital is difficult to measure, so we have no means
of estimating objectively the degree of stickiness it creates. Anecdotal evidence,
however, suggests that human capital investments are indeed an important


                                                                                                                            42
factor in relocation decisions. Lower human capital investments may even offset
     the stickiness created by high physical sunk costs. A call center needs a big
     initial investment in physical capital but much less investment in human capital
     than would an R&D or analytics operation, for example several companies have
     easily relocated call centers from Ireland and even India to the Philippines.

     Finally, companies that use vendors to provide offshore services generally have
     fewer sunk costs in physical and human capital in any location. Consequently it
     is easier for them to change locations. However, switching vendors does incur
     some "start-up" costs, for example, spending on systems integration. The
     greater these costs, the "stickier" the location will appear to the management
     team that has invested in them.


     Exhibit 11

     ONE-TIME/INVESTMENTS COSTS FOR BPO CENTERS – INDIA


                                    Cost for 250 seat center
                                    $Million*

                                            5.2


                                                       1.7           1.7


                                          Call       Shared       Analytics
                                          center     services –
                                                     HR


           * Does not include severance costs.
     Source: McKinsey analysis


43
SELECTING LOCATIONS FOR GLOBAL RESOURCING
As the supply of labor for particular occupations in some countries gets tight, and
agglomeration makes supply even tighter in some cities, companies are likely to
start tapping the supply of available labor in a wider range of countries. The way
in which companies select locations for offshoring will become increasingly
critical to the performance and profitability of their offshore ventures.

Companies have different requirements from offshore locations, depending on a
host of factors including their home market, their first language, what activity
they want to outsource, the scale on which they want to offshore, and whether
they want to outsource or set up a captive operation. This means different
companies will assign different costs and benefits to the same location. Put
another way, there is no single, homogeneous supply curve in the emerging
global labor market—every company faces a different curve.

This feature of the emerging global labor market will act as a natural force for
dispersing demand to fit supply more congruently if companies analyze carefully
the cost of accessing labor in various global resourcing locales before choosing
where to establish their facilities. Companies do this already, but not always
comprehensively. To make a rational analysis, companies need better information
about the location of talent that suits their needs, and they also need to know
the real costs of employing suitable talent in any potential location.

What will that analysis entail? First, a company needs to define in detail the
criteria governing its choice of location. At a broad level, these are likely to
include: labor cost, the quality of local service vendors, local market potential,
the intrinsic risks of the location, the nature of its business environment, and
the quality of its infrastructure. The company can then weight these criteria
according to its particular goals and requirements. When the company has
gathered the relevant data about the criteria from each potential location, it can
calculate its own true "cost" of offshoring in any of them based on both
quantitative and qualitative measures. Using the Location Cost Index (LCI)
database6 (see gray box), we can estimate the total cost to a particular company
or group of companies of accessing labor in potential locations, and rank the
locations accordingly (Exhibit 12).


6 Proprietary database developed in this study which evaluates countries along 50 different factors
  and creates comparative indexes.


                                                                                                      44
Exhibit 12

     SAMPLE RANKING OF LOCATION ATTRACTIVENESS FOR A                                                                                                                            Attractive
                                                                                                                                                                                country
     COST-DRIVEN COMPANY BASED IN THE UNITED STATES                                                                                                                             Unattractive
                                                                                                                                                                                country
     Index                                                                                                                                                                       Company
     components           Countries                                                                                                                                              specific
                                                                                                                                                                                 weighting


                                                                                                                                                   Germany
                                              Malaysia


                                                                                               Republic
                                                                                     Hungary


                                                                                                                          Canada
                                                                            Mexico


                                                                                                          Poland
                                                                                                                                                                                 factor


                                                                                                                                   Russia


                                                                                                                                                             Ireland
                                                                                               Czech
                                                         Philip-


                                                                                                                                                                        Japan
                                      China


                                                                   Brazil
                                                         pines
                              India


                                                                                                                                            U.K.
                                                                                                                   U.S.
                                                                                                                   4.4    3.9               4.6    4.4       4.5       4.9
                                                                   2.2      2.2      2.6         2.6      2.7                      3.0
      Cost                    1.5     1.8     1.7         1.5                                                                                                                        40


                                      3.7     4.7         4.5               4.7      4.7         4.7      4.0                      4.5
      Vendor                                                       3.5                                                    3.2                      2.5       3.5
                              2.2                                                                                                           1.8                        2.2           20
      landscape                                                                                                    1.0

                              3.5             3.3         3.5      4.2               3.3         3.5      3.3
      Market                                                                2.8                                    2.7    2.5      2.8      2.8    3.0       2.8       3.0
                                      1.8                                                                                                                                            10
      potential

      Risk                            3.4                 3.9      2.8      3.5                                                    3.5
                              2.7             2.2                                    2.3         2.2      2.7      1.7                      2.1    1.9                 2.0
                                                                                                                          1.5                                1.5                     10
      profile

      Environment             3.6     3.6     3.4         3.7      3.0               2.8         3.0      3.1                      3.3                                 3.1
                                                                            2.6                                           1.7               2.1    2.5       2.5
                                                                                                                   1.3                                                               10
      business

      Quality of              3.3     2.5     2.5         2.8                        2.8         3.0      3.0                      3.3      2.3    2.8       2.8       2.3
                                                                   2.0      2.0                                    1.5    2.0                                                        10
      infrastructure


                                                          2.6      2.7      2.7      2.9        2.9       3.0      3.0    3.1      3.2      3.4    3.5       3.5       3.7
     Company                 2.3      2.4     2.5
     specific LCI*


           * In this ranking 1 is the most attractive and 5 is the least attractive.
     Source: Location cost index database


     The countries that emerge as lowest cost will vary depending on the preferences
     of the company making the analysis. As a consequence, an increasing number
     of countries will likely emerge as attractive to more companies, and so begin to
     participate in the global market for talent.

     India, Philippines, and China, the most popular offshoring destinations today, are
     not necessarily the most attractive locations for all companies, even though they
     have the lowest average labor costs (Exhibit 13). Exhibits 14 and 15 demonstrate
     this fact using location cost analyses from real companies as examples.

     Exhibit 14 shows the location ranking for a U.S. based company with some
     concern for cost but more interest in finding the right talent to undertake R&D.
     For this company, the United States turned out to be the best location—indeed,
     high-wage countries often emerge as the most attractive location for R&D
     functions. In contrast, Exhibit 15 shows the result for a European based
     company with a strong preference for convenience. For this company, easy flight
     access, a close time zone, and similar culture were important. As a
     consequence, it ranked nearby Eastern European countries the highest.


45
Exhibit 13

INDIA AND PHILIPPINES ARE THE MOST ATTRACTIVE
COUNTRIES IN TERMS OF LABOR COST*
                 Comparison of hourly labor cost; Index**, U.S. = 100
                                                                                                                                                                                                                                158


                                                                                                                                                                                                                      116
                                                                                                                                                                                                 108         111
                                                                                                                                                                      100

                                                                                                                                           84


                                                                                                              46
                                                                                                    41
                                                                         36         37
                                                         27    28
                                      19      20
                     12      13


                     India Philip- China Mala-       Mex- Brazil         Po-    Hun-         Czech Rus-                                Can-                          U.S.                       Ire-       U.K.      Japan Ger-
                           pines         ysia        ico                 land   gary         Re-    sia                                ada                                                      land                       many
                                                                                             public

Average
working
                 2,347 2,301 1,958 2,152 2,281 1,869 1,901 2,012 1,946 1,784 1,869 1,895 1,779 1,787 1,864 1,674
hours – 2003
hours/year
        * Labor costs include benefits and taxes; averaged across a variety of professional job categories. *
       ** Index is based on dollar wages; exchange rate: 12 months average as of January 2005.
 Source: Watson Wyatt; Local sources (e.g., Labor census); Interviews


Exhibit 14

FOR A U.S. COMPANY ASSIGNING A RELATIVELY LOW WEIGHTING TO
COST AND A HIGH WEIGHTING TO CONVENIENCE, THE U.S. RANKS AS
THE MOST ATTRACTIVE LOCATION
               Location Cost
               Index    4.0
                                                                        Mexico                                                                                                                                     Ireland
                                                                          Brazil
Reference                                                                   Other Latin America**
country – US               3.5                                                 Malaysia
                                                                                     Czech Republic
                                                                                      Hungary
Cost                  35                                                               Poland
                                                                                       South Africa
                           3.0
Domestic
market           0

Environ-              35   2.5
ment*
                                                                                                                                                                      Mid wage Asia Pacific**
                                                                                                                                            Other Eastern Europe**
                                                                                                                   Other low wage Asia**


Vendor
                                                                                            Philippines


landscape        0
                           2.0
                                                                                                                                                                                                       Germany


                                                                                                          China
                                                               Canada


                                                                                                                                                                                                                  Russia
                                                                                                                                                                                                                  Japan


Risk profile         20                                                                                                                                                                         U.K.
                                            U.S.
                                                                            India
Quality of
infrastructure    10       1.5


                           1.0
                                 0      200        400        600        800        1,000                 1,200    1,400                                             1,600                       1,800           2,000       2,200
                                 Size of suitable labor pool, all young professionals***
        * Within environment, convenience (e.g., travel time) is assigned higher weighting
       ** Location Cost Index values are estimated
      *** University-graduated, suitable workforce; 7 years of work experience; supply does not consider limited
          talent accessibility and domestic labor demand
Source: McKinsey Global Institute analysis


                                                                                                                                                                                                                                      46
Exhibit 15

     FOR A CONVENIENCE-DRIVEN COMPANY BASED IN GERMANY,
     EASTERN EUROPEAN COUNTRIES ARE MORE ATTRACTIVE THAN INDIA
                    Location Cost
                    Index     4.0
                                         Hungary                                                                                                                                     Mexico
                                         Czech Republic                                                                                                                               **Mid wage
     Reference                                                                                                                                                                        Asia Pacific
     country – Germany                    Poland
                               3.5
                                                   Malaysia
                                                                                             South Africa                     Brazil
     Cost                 35                                                                                                      Ireland
                               3.0
     Domestic
     market           0

     Environ-             35   2.5


                                                                                                                                                                                           Other Latin America**
     ment*
                                                    Other Eastern Europe**


                                                                                                      Other low wage Asia**
     Vendor
     landscape        0


                                                                                                                                                                                                                    Canada
                                                                                                                                                                                                                     Japan
                               2.0


                                                                                                                                               Philippines
                                                                                   Germany


                                                                                                                              Russia
     Risk profile         20
                                         India                                                China                                     U.K.                        U.S.
     Quality of
     infrastructure    10      1.5


                               1.0
                                     0      200                              400             600       800                             1,000            1,200   1,400      1,600   1,800                           2,000     2,200
                                     Size of suitable labor pool, all young professionals***
             * Within environment, convenience (e.g., travel time) is assigned a high weighting
            ** Location Cost Index values are estimated
           *** University-graduated, suitable workforce; 7 years of work experience; supply does not consider limited
               talent accessibility and domestic labor demand
     Source: McKinsey Global Institute analysis


     These examples show that when companies take an analytical approach to
     selecting their offshore locations, they choose different locations from each
     other. In fact, demand for offshore talent is already dispersing: a recent MGI
     survey of senior executives finds that companies are locating a significant
     number of offshore activities outside India, especially activities other than IT and
     call centers, India's established strengths (Exhibit 16). This suggests
     companies are beginning to make more detailed appraisals of their potential
     offshore locations. Such careful analysis will only become more important in the
     future, as more cities made popular by a "follow the leader" approach begin to
     hit supply constraints.


47
Exhibit 16

INDIA’S LEADING POSITION IN IT IS STRONGER THAN IN OTHER AREAS

Percent of share of survey respondents’ current or future offshoring centers by country
          U.S.             100% =   99                 102           102           100             99                97
          Canada                  0 3 2                 2
                                                             2
                                                                               0
                                                                                    3
          West Europe                                                                             10                 9
                                                        4             12
          East Europe and Russia* 0 4                   2                                                            0
          Africa                                   2                   0           17                   3
                                     7                                                          0 0         0
          Latin America                                                8
                                                       10                                         10
          Other Asia and Pacific     7                                                                               21
                                                                       4            6
          Malaysia                   1                  6
                                                                       6            0
          China                      7
                                                                                    9             15                      0
                                                       11                                                            3
                                                                       8                                             3
                                                                                    9
                                                        7                                          7
                                                                      12                                             18
                                                                                    6
                                                                       2                          10
                                                                       4            8                                0


          India                            68                                                                        21

                                                       55
                                                                      43           43             45


                                                                                                                     24


                                   IT           Call center      Business    Finance and      Human             Industry-
                                                help desk        research    administration   resource          specific R&D
                                                                 analytics
          Total number                     21          16             15           12             14                17
          of countries
      * Includes Turkey
Source: McKinsey Global Institute Survey


THE IMPACT OF OFFSHORING ON WAGES IN LOW-WAGE AND HIGH-
WAGE COUNTRIES
Wage levels can rise as the gap between demand and supply narrows, changing
the relative attractiveness of countries over time. Some offshoring companies
have already experienced wage inflation for engineers in low-cost countries. For
example, in India the wages for software/IT middle-managers stood at 5 percent
of the United States levels in 1998, but by 2003 had reached 15 percent.

How high could wage levels rise in what are now low-wage countries? To tackle
this question, we modeled what would happen to wage levels for young
professional engineers in supply countries if, in 2008, all companies in the
United States seeking to hire such engineers offshore placed their highest
weight on labor costs. Under this scenario, the demand would be met, moving
up the supply curve, from India, the Philippines, Malaysia, China, other Asian
countries (e.g., Indonesia), and Brazil (Exhibit 17). As a consequence wages in
countries to the left of Mexico—the next most attractive country after Brazil—
on the curve would be likely to rise to Mexican levels, or to about 30 percent of
the United States levels (Exhibit 18).


                                                                                                                               48
Exhibit 17

     IF ALL COMPANIES SEEKING YOUNG PROFESSIONAL ENGINEERS
     WERE COST-DRIVEN, THEIR LIKELY DEMAND WOULD BE SATISFIED BY
     TALENT FROM COUNTRIES LEFT OF MEXICO…
     Demand for remote labor vs. supply curve – young professional engineers*, 2008

     LCI**
                                                   Demand: 596k
     3.80
                                                                                                                                                                                                                                                                   Ireland
                              Other Latin American
     3.40                                                                                                                                                                South Africa
                              countries***
                                               Hungary                                                         Czech Republic
     3.00


                                                                                                                                                                          Other Eastern European countries***
                                                       Mexico


                                                                                                                                                                                                                       Mid-wage Asian Countries***
                                                             Brazil
                                                              Other low-wage Asian countries***


     2.60
                              Malaysia


                                                                                                                                                                                                                                                                       Germany

                                                                                                                                                                                                                                                                                 Japan
     2.20
                                                                                                                                                                                                                                                            U.K.


                                                                                                                                                       Canada

                                                                                                                                                                Russia
                                                                                                           Poland
                                               Philippines


                                                                                                                                 U.S.
     1.80
                India         China

     1.40


     1.00
            0           200              400                                                      600               800        1,000      1,200         1,400                                          1,600                                            1,800               2,000

                                                                                                                                                                                                                                                     Size of suitable labor pool
                                                                                                                                                                                                                                                     thousands
            * 7 years of work experience; supply does not consider limited talent accessibility and domestic labor demand
           ** Location cost index. Applied the weighting of cost: 50%, vendor: 10%, market: 10%, risk: 10%, infrastructure: 10%, and environment: 10%
          *** The LCI values for the other countries are estimated
     Source: McKinsey Global Institute analysis


     Exhibit 18

                                                                                                                                                                                                                                                               Current labor cost
     …AND WAGES OF YOUNG PROFESSIONAL ENGINEERS
                                                                                                                                                                                                                                                               Estimate of
     IN THOSE COUNTRIES COULD RISE TO                                                                                                                                                                                                                          wage inflation
     APPROXIMATELY 30% OF US LEVEL*
     Comparison of hourly labor cost**; Index*, U.S. = 100

                                                                                                                                                                                                                                                                                         158
      Assumption

      • 596,000
         engineer young
         professionals                                                                                                                                                                                                                                                     116
                                                                                                                                                                                                                                                      108      111
         are globally
         resourced                                                                                                                                                                                               100
         in 2008
                                                                                                                                                                         84
      • All companies
         are strong cost
         seekers***
      • Wage in low-
         cost countries                                                                                                                                    46
                                                                                                                                                  41
         raise to match                                                                                 30-35                     36     37
         LCI value of            25-30                         25-30                                                      28
                                          20-25                                                                     27
         Brazil/Mexico

                                                                                           19            20
                                  12           13

                                 India Philip- China Mala- Mex- Brazil Po-                                                              Hun-   Czech Rus-            Can-                                       U.S.                                 Ire-     U.K. Japan Ger-
                                       pines         ysia ico          land                                                             gary   Re-    sia            ada                                                                             land                many
                                                                                                                                               public


           * Does not consider stickiness, limited talent accessibility, domestic labor demand and manager scarcity which might inflate
             wages beyond these levels at least for some occupational categories.
          ** Hourly labor cost reflects average of all job categories within a country
         *** Put 50% of weighting to cost
     Source: Watson Wyatt; local sources (e.g., Labor census); interviews, McKinsey Global Institute analysis


49
However, just because one country's wages increase to a higher level than
wages in another country does not mean the two countries will exchange their
positions in a particular company's location ranking, since each company's
location analysis will rest on many factors other than wage costs. Indeed, wages
in the first country may rise significantly higher than wages in the second before
the first becomes less attractive if it has other location cost factors strongly in
its favor. Consider an IT services company that places a heavy weight on labor
costs and prefers to use a vendor. India's strong vendor base means that wages
in India would have to increase 25 percent above those in Brazil—the next most
attractive country—before India would rank lower (Exhibit 19).

Exhibit 19

INDIAN WAGES HAVE TO INCREASE ~25% ABOVE BRAZIL’S BEFORE
INDIA CEASES TO BE THE BEST LOCATION FOR THIS U.S. VENDOR-
SEEKING COMPANY
                                        Breakdown along with the criteria                   Breakdown within cost
                                        Criteria
                                        weighting                                            Labor
                     India has
                                         Cost           2.6                                  cost*      2.0-2.5
                       strong                                   2.2      1.8    1.7                                2.0      1.5    1.5
                    vendor base          (50%)                                               (75%)
                                                         1.5                                               1.0
                                                       India   Brazil   China Malaysia                   India    Brazil   China Malaysia
                                                                               4.7
                                                                3.5      3.7                 Other
                                                        2.2                                                2.0     2.9      2.8    2.3
LCI value of top 4 countries             Vendor                                              cost
for U.S. cost seeks                      (20%)                                               (25%)
                                                       India   Brazil   China Malaysia                   India    Brazil   China Malaysia
                                         Infrastruc-     3.3            2.5     2.5
                                                                2.0                       India's wage
  2.6     2.6     2.6     2.6            ture
                                                                                          must increase
                                         (10%)
  2.1                                                                                     25% above
                                                       India   Brazil   China Malaysia    Brazil
 India   Brazil   China Malaysia
                                                        2.7     2.8      3.4
                                         Risk                                  2.3
                                         (10%)
                                                       India   Brazil   China Malaysia
                                                                3.8            3.5
                                         Environ-       2.8
                                                                         1.8
                                         ment
                                         (10%)
                                                       India   Brazil   China Malaysia
                                                        3.5     4.2             3.3
                                         Market                          1.8
                                         potential
                                         (0%)
                                                       India   Brazil   China Malaysia

      * Index of a labor cost: 1.0: ~15% of the U.S., 1.5: 15-25%of the U.S., 2.0: 25-35% of the U.S., 2.5: 35-45% of the U.S.
Source: McKinsey Global Institute analysis


Several location cost factors tend to improve together as a country's
participation in the global labor market increases. This can often partially
counteract the negative impact of rising wages on a location's total costs (see
the outline of positive agglomeration effects in the previous section).


                                                                                                                                            50
In developed countries, offshoring will have little effect on wage levels because
     it will have only a small impact on overall employment in those countries in the
     occupations we analyzed. Consider the impact in the United States. Over the
     past 30 years, the United States has experienced an 11 percentage point
     decline in manufacturing jobs, but wages have remained stable. By comparison,
     we estimate that a total of 9 percent of jobs in services in the United States
     could theoretically be performed remotely. However, it is unlikely that all these
     potentially transferable jobs will move offshore over the next thirty years
     because of the considerable barriers to offshoring detailed in the first report in
     this series.7 Assuming that half the potentially transferable service jobs—a
     more realistic estimate, although still high—are actually relocated offshore over
     that period, the resulting job turnover would be around 225,000 jobs per year—
     or 1–2 percent of the 16 million jobs created8 per year in the U.S. economy.


     IMPLICATIONS FOR COMPANIES AND COUNTRIES
     Implications for companies

     A variety of company needs meets a variety of country strengths. One major
     lesson from our evaluation of labor supply is that widely varying company
     requirements concerning supply locations face widely varying characteristics
     among potential supply countries. This implies there is no fixed ranking of
     supply countries: different companies will rationally choose different countries
     as their optimal location. For companies assigning more weight to cost reduction
     than any other criterion, then locations with the lowest wage costs—India, the
     Philippines, and China—will rank as most attractive. However, for companies
     with special environment or infrastructure requirements, or offshoring activities
     that go beyond IT support or call centers, other locations will be worth
     considering.

     Careful selection of locations will become more important as more supply
     countries come into the market. This also suggests that more and more
     locations can and will participate as sources of supply in the global labor market


     7 The Emerging Global Labor Market. Part I-Demand for Offshore Talent in Services. Available at
       www.mckinsey.com/mgi.
     8 Douglas Brown and Scott Wilson The Black Book of Outsourcing: How to Manage the Changes,
       Challenges and Opportunities. Wiley, 2004.


51
in the future. Companies that simply "follow the leader" to popular supply
locations have already caused—and experienced—growing wages and high
attrition rates in several city labor markets. As more and more countries come
into the market, companies will find an analytical approach to selecting an
offshore location increasingly helpful for avoiding the negative effects of
agglomeration. This approach needs to be complemented by an evaluation of
the supply of suitable labor (see "The Supply of Offshore Talent in Services" for
detailed recommendations on evaluating supply), but also the evolution of
demand from other companies seeking talent in each potential location

Using vendors can reduce stickiness. An offshoring company should consider
using a vendor in locations where wages are accelerating quickly, as the
generally reduced "stickiness" of vendor contracts can allow the company to
shift more easily to a more favorable location if wages in the first one rise too
high. However, companies should check whether this comparative freedom of
movement remains when the additional cost of vendor margins, the length of the
contractual commitment, and any cost increase provisions in the contract are
taken into account.

Implications for low-wage countries

Many countries can compete successfully on the supply side of the market.
Since there is no general, fixed ranking of offshoring locations from the demand
perspective, there is no preordained set of "winners and losers" on the supply
side. Individual countries seeking to attract offshoring investment should target
those companies and sectors whose requirements most closely match what the
country can already offer, and then hone their attractive features. They might
choose to highlight or improve one particular area to differentiate their country
from other locations. This strategy depends on supply countries forming a clear
understanding of their potentially attractive features and which sectors or
companies might favor them.

Improving a country's attractiveness as an offshoring location will take time and
effort. Improving a country's attractiveness as an offshoring location is a long
term endeavour for policy-makers, since several important criteria affecting
companies' location decisions are either largely beyond their control (labor cost)
or are cultural as much as policy-driven (the business environment). They will


                                                                                     52
also be competing against other countries following the same strategy. But
     since several countries have a similar profile of overall location costs, it is all
     the more important for individual countries to nurture areas of distinctiveness.

     High-priority areas can be improved even in the mid-term. On the other hand,
     there are several location cost factors of high priority to almost all companies
     that policy-makers can improve in the short to mid-term. They can reduce
     government bureaucracy, establish industry associations, make their taxation
     schemes more competitive relative to similar supply countries, improve laws
     protecting intellectual property and enforce them better, and strengthen the
     infrastructure of their dedicated "offshoring parks." Furthermore, our interviews
     suggest that smaller low-wage countries will find marketing their offer is itself a
     powerful tool for improving their attractiveness: management perceptions of a
     country and reality sometimes differ, and dedicated country marketing efforts
     can set them straight.

     Implications for high-wage countries

     Displaced service professionals should be retrained for employment in growing
     sectors of high-wage economies. Service sector workers displaced by offshoring
     are likely to include a higher percentage of college-educated workers than
     displaced manufacturing workers. Their higher education levels suggest they
     may also be more amenable to acquiring new skills through retraining, which
     could lessen the potential impact of displacement on their earning power.

     Policy-makers in high-wage countries should collaborate with companies to
     ensure that retraining programs direct workers toward growing areas of the
     economy—for example health care. Furthermore, policy-makers should ensure
     that primary and secondary education responds to the shrinking share of
     repetitive, "rules-based" jobs in high-wage economies, as a result of both
     automation and offshoring.9 The more flexible graduates the education system
     produces, with strong mathematical, problem solving and teamwork skills, the
     more adaptable they will be to an ever-changing, innovative economy.


     9 Frank Levy and Richard Munrane, "How Computers are Creating the Next Job Market." Princeton
       University Press, Princeton, NJ, 2004.


53
Graduates should be equipped to work effectively with their peers in low-wage
economies. Finally, policy-makers and educational institutions in high-wage
countries should equip their graduates to work effectively with their peers in
today's low-wage countries. In Europe, for example, those countries and
companies that encourage their graduates to look for opportunities to the east,
with appropriate language training, funded exchange programs and internships,
will be best placed to benefit from the talent pool represented by new EU
members, such as Hungary, the Czech Repubic, and Poland and by emerging
markets in Asia.


                                                                                  54
Constructing an Analytical Approach to Location Selection

     An analytical approach to selecting offshoring locations allows us to analyze
     preferences on a more general basis. Our experience and our interview base
     suggest the most important general location criteria are cost, quality of
     infrastructure, vendor landscape, risk profile, environment and market
     potential. Each general criterion comprises several sub-criteria:

        Cost includes labor cost, infrastructure cost, and corporate tax. Within
        infrastructure cost, telecom, real estate, and power supply were selected
        as representative measures.

        Market potential includes both domestic market potential, measured by
        size and growth of GDP and access to attractive nearby markets. A
                                ,
        company would rank market potential highly if it aimed to use a global
        resourcing location partly to enter or grow its share of an offshore
        market.

        Environment consists of government support, the business and living
        environment, and the convenience of doing business.

        Risk profile comprises disruptive events, security risks, regulatory risks,
        country investment risks, and data protection risks.

        Vendor landscape is based on available information on the IT/BPO
        market size and vendors in each of our countries. Note that this category
        could be made more specific to the process in question (e.g.
        pharmaceutical R&D) if it were being used to guide a company's decision
        for certain activity. However, for the purposes of this higher level model,
        we rely on general measures.

        Quality of infrastructure is based on measures of telecom/network
        service infrastructure quality and real estate availability.

     Note that companies can place their own importance weights on each
     criterion and sub-criterion, resulting in different overall location rankings.
     Additionally, some criteria depend on the current "home" country from which
     the activity will be offshored. For example, if the United States is the home
     country, the time difference to India will be different than if Germany were
     the home country. Companies should take a forward-looking view of LCI—
     especially with respect to determining future wage growth. Implicit in this
     forward-looking wage analysis is an assessment of the supply and demand
     situation for the most important occupations to be hired.

55
McKinsey Global Institute
05/06/15
Copyright © McKinsey & Company
www.mckinsey.com/knowledge/mgi
Design by New Media, McKinsey & Company, Sydney

Mc Kinsey

  • 1.
    McKinsey Global Institute TheEmerging Global Labor Market: Part III—How Supply and Demand for Offshore Talent Meet June 2005
  • 2.
    The McKinsey GlobalInstitute (MGI) was established in 1990 as an independent think tank within McKinsey & Company, Inc., to conduct original research and reach a better understanding of the workings of the global economy. From time to time, MGI issues public reports. These reports are issued at the discretion of MGI’s director, Diana Farrell, and its McKinsey Advisory Board when they conclude that MGI's international perspective and its ability to access McKinsey’s knowledge of industry economics enable it to provide a valuable fact base to policy debates. The McKinsey Advisory Board is made up of McKinsey partners from Europe, Asia-Pacific, and the Americas. MGI's staff members are drawn primarily from McKinsey’s consultants. They serve 6- to 12-month assignments and then return to client work. MGI also commissions leading academics to participate in its research. The McKinsey Global Institute is based in San Francisco and has a presence in Washington, DC, New York and Shanghai. MGI research fellows are based around the world as needed for individual research projects.
  • 3.
    The Emerging GlobalLabor Market: Part III—How Supply and Demand for Offshore Talent Meet Diana Farrell Martha Laboissière Robert Pascal Charles de Segundo Jaeson Rosenfeld Sascha Stürze Fusayo Umezawa
  • 4.
    Preface The Emerging Global Labor Market series is the end product of a year-long project by the McKinsey Global Institute (MGI), working in collaboration with our colleagues in McKinsey offices and practice groups around the world. This research builds on our extensive work on offshoring, global industry restructuring, and the impact of multinational company investment in developing countries. It spans detailed cases of eight industry sectors (automotive, health care, insurance, IT services, packaged software, pharma, retail, and retail banking) and an analysis of the available talent pool in 28 low-wage countries and another 8 mid- to high-wage ones. It also includes the Location Cost Index, a tool for companies to evaluate location attractiveness based on six groups of criteria: labor cost, vendor landscape, market potential, risk profile, business environment, quality of infrastructure. MGI Fellows Martha Laboissière from McKinsey's São Paulo Office and Jaeson Rosenfeld, previously from McKinsey's Boston Office, worked closely with me to provide leadership to this project. The project team also included MGI Fellows Robert Pascal from McKinsey's North America Knowledge Center in Boston, Charles de Segundo from McKinsey's London Office, Sascha Stürze from McKinsey's Berlin Office, and Fusayo Umezawa from McKinsey's Tokyo Office. We have benefited enormously from the extensive input received from McKinsey's global network of industry and functional experts, especially Ajay Dhankhar, Detlev Hoch, Chris Ip, Noshir Kaka, Krish Krishnakanthan, Glen Mercer, and Anupan Sahay, and from our external Academic Advisory Board, which included Martin Baily, senior advisor to MGI and senior fellow at the 4
  • 5.
    Institute for InternationalEconomics and formerly Chairman of the Council of Economic Advisors to President Clinton; Olivier Blanchard at the Massachusetts Institute of Technology; and Richard Freeman at Harvard University. Tim Beacom, MGI's dedicated research and information specialist, Nitin Seth from McKinsey's India Knowledge Center and Vivien Singer from McKinsey's North America Knowledge Center in Boston provided essential research support. Susan Lund and Gina Campbell provided thoughtful input and editorial support. Morever, Deadra Henderson, MGI’s Practice Administrator, Terry Gatto, our Executive Assistant and Rebeca Robboy, MGI’s External Relations, supported the effort throughout. As always, the findings and conclusions draw from the unique perspectives that our colleagues bring to bear on the sectors and countries researched here. These perspectives are a product of intensive client work with the world's leading firms. They are supplemented by in-depth analytical work and extensive interviews and dialogues with executives, government officials, and other leading thinkers. As with all MGI projects, this work is independent and has not been commissioned or sponsored in any way by any business, government, or other institution. Our aspiration is to provide a fact base to the public debate on offshoring and the emerging global labor market to enable policy makers and business leaders to make more informed and better decisions. Diana Farrell June 2005 5
  • 6.
    Additional Acknowledgements Beyond the project contributors already mentioned in the preface, we would also like to explicitly acknowledge McKinsey colleagues, executives and experts around the world who contributed specifically their industry, local market insights and knowledge to this study. To those who chose to remain anonymous we also extend our gratitude. McKinsey & Company's unparalleled network is an essential component of any McKinsey Global Institute effort. DEMAND SECTOR CASES Auto Daniela Craemer-Kuhn, Parmeet Grover, Russell Hensley, Jeff Holland, Thilo Ittner, Lars Krause, TV Kumaresh, Gerrit Marx, Kelly McKenzie, Harald Meilicke, Glenn Mercer, Guntram Noeth, Arne Schneider, Carsten von der Ohe, Andreas Zielke Health care Leigh-Ann Allen, Isaach Barchas, Brendan Buescher, Takiko Fukumoto, Nathan Gunn, Judith Hazlewood, Brian Helgoe, Nico Henke, Mike Jackman, Yongah Kim, Bob Kocher, Paul Mango, James Mountford, Mona Mourshed, Vasnat Narasimham, Tory Ramaker, Ravi Rao, Russell Richmond, John Schilling, Saum Sutaria, Juergen Wettke Insurance Vivek Agrawal, Mark Anema, Amy Badertscher, Henk Broeders, Shashi Buluswar, Jeff Chookaszian, Ivan Clatanoff, Onur Erzan, Vijay Gosula, Roland Knorren, Shameek Kundu, Michal Kwiecinsky, Oliver Lang, Charles Mander, Gary Moe, John Mulhall, Paul Oakes, Paolo Pecchiari, John Peters, Witold Salwach, Ishaan Seth, Alex Singla, Gerard Speksnijder, Jessica Tan, Tim Welsh, Patrick Wetzel, Elizabeth Ziegler IT Services Andre Andonian, Marcus Beck, Atul Bhandari, Nay-Yasmine Ghorayeb, Prashant Gupta, Ozan Gursel, Detlev Hoch, Detlev Hülsebusch, Denis Idanoff, Joel Jones, Noshir Kaka, Knut Lagies, Niklas Larsson, Boris Lipiainen, Sunil Mehta, A.S. Murthy, Vivek Pandit, Tor Jakob Ramsøy, Rob Rosiello, Jayant Sinha, Simen Teigre, Stephan Zimmermann Packaged SW Marcus Beck, Ken Berryman, Atul Bhandari, Roxane Divol, Nay-Yasmine Ghorayeb, Detlev Hoch, Detlev Hülsebusch, Denis Idanoff, Joel Jones, Rajiv Kaul, Krish Krishnakanthan, Knut Lagies, David Mark, Vivek Pandit, Jeffrey Rhodes, Roger Roberts, Tobias Schwarz, Rupert Stützle, Kevin Walsh 6
  • 7.
    Additional Acknowledgements Pharmaceutical Michael Bloch,Vikash Daga, Ruth De Backer, Ajay Dhankhar, Raj Garg, Indranil Ghosh, Linda Gleason, Maria Gordian, Judith Hazlewood, Tom Hensey, Elizabeth Laws, David Lennon, Ahmed Mitwalli, Shankar Narayanan, Eckhard Niemeier, Paul Oppold, Chandrika Pasricha, Peter Pfeiffer, Ron Piervincenzi, Miguel Schmidt, Navjot Singh, Ramesh Srinivasan, Lara Sullivan, Takashi Takenoshita, Yujiro Tsutsumi, Hema Viswanath, Arthur White, Kristin Yarema, Rachel Zhang Retail Wendy Becker, Michael Bloch, Peter Breuer, Shannon Brownell, Barney Burgess, Sebastian Chaitas, Jochen Fabritius, Lorenzo Forina, Paul Gormley, Chris Grosso, John Hansen, Amy Howe, Juliet Johansson, Ari Kertesz, Bernd Klosterkemper, Lorraine Kron du Luart, Elizabeth Ledet, Yannick Migotto, David Moucheron, Pierre-Dominique Oubrier, Syed Rizvi, Lucio Rossetto, Justin Ryan, Vivek Sankaran, Vivien Singer, Christiana Shi, Thomas Skiles, Janos Stromayer, Kirsten Weerda, Matthias Wunderlin Retail banking Ignácio Bernard, Dominic Casserley, Sebastian Chaitas, Atanas Christov, Andy Eichfeld, Marcos Fernandes, Antonino Gitto, Jakob Haesler, Wendy Harrington, Chris Ip, Vikram Malhotra, Frank Mattern, Deepak Mishra, Oscar Rodriguez, Vikas Saggi, Anupam Sahay, Alexandre Sawaya, Joydeep Sengupta, Sanjiv Somani, Sasi Sunkara, Sergio Waisser, Katalin Walter, Paul Wilmott, Eckart Windhagen LABOR SUPPLY AND LOCATION ATTRACTIVENESS EVALUATIONS Brazil Sofia E. do Amaral, Luis Giolo, Marcos Machuca, Rosana Marotto, Antonio Mendonça, Renata Mendonça, Jose Carlos Papa, Alcino da Silva Therezo Junior, Andrea Waslander China Stefan Albrecht, Delan Beah, Joseph Chang, Georges Desvaux, Mavis Ji, Wing- dar Ker, Paul Gao, Laura Lu, Shahrukh Marfatia, Shamus Mok, Gordon Orr, Gerald Simbuerger, Harry Song, Kevin Walsh, Lilian Woo, Hugh Yu, Wendy Zhang, Florence Zheng Czech Republic Jan Bubenik, Craig Comstock, Michael Mayher, Martin Mlcoch, Barbora Pazderova, Stuart Watkins Germany Janin Böttcher, Saule Serikova, Peter Weigang 7
  • 8.
    Additional Acknowledgements Hungary Dr. Zsolt Ekler, Peter Fröhlich, Beata Fürjesz, György Györfi, Laszlo Hadi, Adam Homonnay, Gabriella Kiszely, Peter Lukacs, Kristian Merenyi, Anthony Radev, Varga Zoltan India Nandini Aggarwal, Shiv Aggrawal, E Balaji, Uddalak Bose, Maneesh Chhabra, Craig Comstock, Abhishek Gupta, Noshir Kaka, Rajiv Kaul, Knut Lagies, J.R. Manoj, Sunil Mehta, A.S. Murthy, Dennis Ross, Abhishek R Sharma, Jayant Sinha, Kunal Suri, Ambika Walia Japan Yumi Kiuchi Malaysia Ruzita Ahmad, Adleen Ariffin, Sheenu Chandra, EK Cheah, Adrian Groom, Effendi Ibnoe, Bob Olivier, Adam Schwarz, Tony Thomas, Khoon Tee Tan, Cheryl Wong México Roberto Barreda, Liliana del Bosque, Enrique Lopez, José Manuel Macías, María Moreno Philippines Chris Beshouri, Antonette Consuelo, Vince Dizon, Jim Franke, Daphne Go, Cris Rosenthal , Paul Santos, Grace C. Sorongon Poland Jerek Bachowski, Jacek Drabik, Andrzej Halesiak, Rick Lada, Romek Lubaczewski, Malgorzata Nocen, Thomas Rüdel, Anna Slodka Russia Dmitri Angarov, Elena Cherkasova, Elena Kuznetsova, Valentin Makarov, Rinat Minullin, Alexander Nikiforev, Alexey Odinokov, Alexis Sukharev, Tatyana Tyrnova, Eberhard von Löhneysen, Xeniya Yakovleva South Africa Sujit Chakrabarty, Andrew Stein UK Emma Lawrence USA and Canada John Beardsley, Steven Carden, David Dreszer, Janique Robert, Tim Shavers, Vivien Singer, Elizabeth Stephenson, David Tanner, Anna Tarasova 8
  • 9.
    Contents Guiding Principles 10 Introduction 11 Executive Summary 21 Synthesis 30 9
  • 10.
    Guiding Principles Any job that is not confined to a particular location has the potential to be globally resourced, or performed anywhere in the world. Broadly speaking, this includes any task that requires no physical or complex interaction between an employee and customers or colleagues, and little or no local knowledge. Such jobs can be performed wherever a company deems most attractive. A company may choose to have a particular location insensitive job performed in the demand market (that is, in the market in which the resulting output is sold), in a border zone (nearshore), or remotely (offshore). Therefore, not all location insensitive jobs will move offshore. We evaluate only service sector jobs. Although manufacturing jobs may be insensitive to their location as well, this study focuses on service jobs, whether they are in service sectors or in a back-office service function (e.g., accounting) in a manufacturing sector. We focus on the demand for low-wage employment from high-wage countries. To estimate potential demand for globally resourced labor, we treat countries as neither inherently on the supply side nor inherently on the demand side in the global labor market. However, since cost is a major determinant of companies' location decisions, developed countries are most likely to provide the bulk of demand for offshore labor, and developing countries the bulk of supply. When we evaluate the actual rate of offshoring today and how fast it will grow, we examine only the demand for low-wage labor from high-wage countries. We assume that demand for labor for a particular activity is the same onshore and offshore. In reality, capital/labor tradeoffs and increased service levels may cause high-wage countries to seek more labor in low-wage countries than they would for performing the same activity in the demand market. Productivity differences between the original location and the new location may also influence demand for labor. Since these effects can be either positive or negative and tend to level over time, our default assumption is that the number of FTEs1 needed for an activity is the same whether located onshore or offshore. For the demand evaluations we do not consider any supply constraints. All evaluations are made under the assumption that global supply will be able to meet demand. Actual supply conditions are examined in the second report in this series, "The Supply of Offshore Talent in Services". 1 Full time equivalent 10
  • 11.
    Introduction Offshoring has rapidlybecome part of the everyday social lexicon. Conflicting and sensational reports of developed-world companies moving jobs to emerging markets like India and Brazil are now a staple of the news media and political debate. The trend alarms many observers. Some believe that almost any job is subject to dispatch abroad, and that soon the developed world will lose even high-paid, professional service jobs that previously were not at risk: "If you can describe a job precisely, or write rules for doing it, it's unlikely to survive. Either we'll program a computer to do it, or we'll teach a foreigner to do it."1 Others claim that offshoring white-collar jobs in R&D and elsewhere will erode one of the main sources of competitive advantage for developed countries, and eventually reduce their standard of living. They point to offshoring as a key cause of weak employment growth in the United States, maintaining that jobs lost abroad will not return soon. Swayed by such arguments, policy makers on both sides of the Atlantic have adopted or are now considering legislation that would penalize companies for offshoring jobs and prohibit any state-funded projects from being performed abroad. But there are equally forceful proponents of offshoring. They argue that offshoring increases company productivity and profits, bringing benefits to their home economies. They say it represents a well-functioning global free market in 1 David Wessel, "Barbell effect—the future of jobs: new ones arise, wage gap widens," Wall Street Journal, April 2, 2004. 11
  • 12.
    labor: "arguing that[offshoring] hurts is arguing that free trade hurts."2 They also suggest it affects only a tiny proportion of jobs in developed countries, and accelerates economic growth in the countries hosting offshore employment. A big problem in this debate has been the shortage of hard facts with which to resolve conflicting arguments and reach a clearer understanding of offshoring's potential impact on the global economy. The purpose of the research described in this report is therefore to provide this fact base and help bring more clarity to the discussion. For reasons described below, our research has concentrated on the offshoring of service jobs rather than jobs in manufacturing, and on jobs offshored from the United States and Western Europe to low-wage markets. The report's findings should help companies and policy makers in both developed and emerging markets to address the different issues raised for them by offshoring. This introduction examines the context for our research, defines terms used in the report, explains the report's scope, and introduces the questions covered by each of the report's three sections. CONTEXT FOR THE RESEARCH Relocating jobs is nothing new. As communications have improved, companies have migrated jobs in high-labor-cost areas to cheaper and less restrictive labor markets. Initially they moved jobs within countries. For example, many manufacturing plants in the Northeastern United States shifted to the South and Southwest during the 1980s to take advantage of lower infrastructure costs, a less unionized workforce, and tax incentives. Then improving information and communication technologies made it possible for companies to disaggregate the value chain and outsource either entire processes or pieces of them to other companies in the same country. Numerous companies now provide other firms with technology support, software development, transactions processing, accounting, human resources management, and other tasks. 2 Timothy Aeppel quoting Haseeb Ahmed in "Leadership (A special report) --- Offshore face-off: moving jobs overseas can cut a company's costs; But is it bad for the U.S. economy? Two economists debate the issue," Wall Street Journal May 10, 2004. 12
  • 13.
    Recently, a confluenceof factors has made it possible for companies to relocate or outsource their service activities even farther afield, to lower-wage locations offshore. These factors include further liberalization, improvements in information technology, a decrease in the perceived risk of operating in developing countries, and a shortage of labor in developed countries. Ireland was one of the first offshoring locations, but emerging markets such as India and the Philippines were fast followers. Exhibit 1 shows the approximate value of offshore services in countries that supply them. When companies decide where to locate a particular activity, they have to weigh the feasibility of performing it in a different location, away from the home market, against the benefits offered by performing it in that specific location, such as economies of scale and low labor costs. Exhibit 1 INDIA AND IRELAND ARE THE DOMINANT PRODUCING COUNTRIES Offshored services market size (BPO and IT, captive and outsourced) $Billion, 2003 2.3 0.3 0.6 Russia Other Asia Eastern Europe* 3.8 8.6 ** Canada 3.4 *** Ireland China 1.7 0.5 12.2 Philippines Mexico 3.6 **/**** 0.1 1.8 Israel Thailand 0.1 India 0.4 Latin America South Africa Australia * Includes Poland, Romania, Hungary, Ukraine, and Czech Republic. ** Primarily composed of MNC captives. *** Estimate, based on total Chinese BPO and IT services revenue (7.8) minus domestic demand for IT services (4.4). **** Estimate, based on 2001 market size of 3.0 and assumed growth rate of 20% p.a. Source: Software Associations; U.S. country commercial reports; press articles; Gartner; IDC; Country government Web sites; Ministry of Information Technology for various countries; Enterprise Ireland; NASSCOM; McKinsey Global Institute analysis 1 13
  • 14.
    In the 1990sthe lowering of bandwidth and telecommunications costs made many services less sensitive to their location. Manufacturing was similarly affected— better communication made it easier to operate a remote manufacturing location—but to a lesser extent, because cheaper communications didn't do much to help manufacturers with the costs of transporting their physical inputs and outputs. At the same time, the risks, both real and perceived, of locating service activities in developing countries, were lowered. The successes of early movers and supporting measures taken by governments in emerging markets, for example, to protect intellectual property, made other companies more confident of moving their services to these locations. As companies continue to learn how to manage globally dispersed processes, the exact location of many functions will matter less and less. Already, a great many business processes can be performed remotely, and several can be performed anywhere in the world. A customer service call can be answered, an MRI can be read, and R&D can take place remotely. But how many such processes are performed remotely today? How fast is that number growing? To begin answering such questions, we need to define more precisely the options facing the companies driving this trend. DEFINITIONS We define as "global resourcing" the process a company goes through to decide which of its activities could be performed anywhere in the world, where to locate them, and who will do them. Any activity that is not constrained by the need for customer contact or local knowledge or by complex interactions is subject to global resourcing: it can be performed wherever a company deems most attractive (Exhibit 2). An obvious example of such an activity is answering customer service calls for a bank; these calls can be answered just as easily in Chicago, Dublin, or Manila. Having identified services that could be performed remotely, a company faces two sets of decisions illustrated in the matrix in Exhibit 3. First, should it "offshore" those services, by which we mean perform them in another country outside the market where they are sold? Or should it perform them "onshore," in the same market in which it sells them?3 And, second, should the company 14
  • 15.
    Exhibit 2 GLOBAL RESOURCINGENTAILS CHOOSING THE OPTIMAL LOCATION TO PERFORM PROCESSES THAT COULD BE LOCATED ANYWHERE Demand Local resourcing demand ("needs to be close to customer market") X X Global X resourcing demand ("can be performed X anywhere in the world") Supply Cost structure including X wages/location attractiveness Region 2 Region 3 Region 4 Region 5 Region 1 Labor quantity Source: McKinsey Global Institute analysis 2 Exhibit 3 OUTSOURCING AND OFFSHORING DEFINED Offshored services case focus Revenues $ billion, 2001 Outsource Onshore Offshore outsourcing outsourcing 227 10 Control Shared Captive services offshoring Not available 22 Captive Onshore Offshore Location Source: Gartner; IDC; Aberdeen Group; UBS Warburg; Nasscom; U.S. import-export data; McKinsey Global Institute analysis 3 15
  • 16.
    perform those activitiesin a wholly-owned "captive" unit? Or should it "outsource" them, by which we mean buy them from a third party? The following are examples of location decisions that fall into each quadrant of the matrix: Wells Fargo operates call centers for its business units in several locations in the United States, including Utah and California. This is a captive onshore activity. Halliburton outsources software applications management to Accenture in the United States. This is an outsourced onshore activity. DHL, a German company, locates its European ITservices center in Prague. This is a captive offshore activity. The South African Depository System has its software application development performed by TCS, an Indian firm. This is an outsourced offshore activity. The main focus of our study will be to understand the shift from "onshore" to "offshore" locations, although we will also touch on the "captive" versus "outsourced" decision. We also limit our attention to jobs that are relocated from high-wage to low-wage countries, even though the reverse process also occurs. For instance, R&D centers are often located in the United States even though they serve many countries, including developing ones. Many service activities are labor intensive, so companies would benefit if they could offshore them to places with lower labor costs. But not all services can be offshored: some are much more sensitive to their location than others. Computer programming, for example, is relatively location insensitive. It can be done just about anywhere, because computer code can be cheaply and instantaneously "shipped" via the Internet to and from virtually any location in the world. At the other end of the spectrum comes services like haircuts, which have to be done close to the customer. It is not necessarily rational for companies to transfer all location insensitive activities offshore. Consider server maintenance for United States companies. 3 The term "nearshoring" means offshoring to a country near the home market. 16
  • 17.
    Even though servermaintenance could be relocated elsewhere, that may not make sense because the United States has in place a better infrastructure and lower risk levels for server maintenance than other locations (this example will be explored in more detail in our IT services case). Regulatory or organizational factors may also prevent a company from relocating services offshore. For instance, an insurance company might want to relocate its US property and casualty operation to a developing country; however, industry regulations require some of these services to be performed by a registered insurance agent. Since it is not possible to gain certification as a US agent in a foreign country, the activity has to remain in the US. Organizational factors play a part in the decision too. A software company might achieve lower wage costs by offshoring certain lower-end elements of its software development process. However, the company's process is well-developed and understood within the organization, and its smooth working depends on all members of the development team being in the same place. WHY WE FOCUS ON OFFSHORING SERVICES TO DEVELOPING COUNTRIES Within the universe of jobs that are not constrained to one location, the focus of this report is the offshoring of service jobs from developed economies to developing markets. This is the issue that has dominated both the media and political debate, and for good reason. The service sector in developed countries supplies most jobs and the bulk of many countries' positive trade balances, and the trend toward offshoring jobs is growing fast. An additional reason for our focus on this area is the absence of data on its effects on the individuals, companies, and countries that provide offshored service labor. The service sector is the biggest source of employment in developed countries (Exhibit 4), because they have already experienced the gradual shift in employment from agriculture to services that occurs as a country grows its GDP per capita. And while world trade has been growing at a brisk 6.9 percent annually for both services and manufacturing from 1980 to 2002, the offshoring of services to emerging markets, though still small, has been growing even faster (Exhibit 5). It is projected to grow at 30 percent annually from 2003 to 2008 (Exhibit 6). This would increase its share of services trade from 3 percent to 10 percent, making it a significant subcomponent of services trade. To put this in perspective, travel 17
  • 18.
    Exhibit 4 THE SERVICE SECTOR PROVIDES THE BULK OF EMPLOYMENT IN HIGH- WAGE ECONOMIES Agriculture Manufacturing Share of employment by economic sector %, 2003 Services 100% = 428 737 31 74 13 32 10 65 2 4 5 63 16 138 38 28 (million) 23.0 38.2 47.0 53.0 56.0 53.7 55.6 59.4 58.7 61.2 17.0 65.8 66.1 66.4 74.7 75.6 75.5 17.7 15.6 28.6 25.9 60.0 20.0 32.0 31.3 39.6 44.1 27.7 33.3 37.4 29.3 31.1 22.4 21.8 23.2 20.6 18.4 18.1 14.3 10.0 6.5 5.5 4.8 4.6 2.8 2.5 2.5 1.3 India* China Philip- Brazil Poland Mexico Malay- Russia Ireland Hun- Czech Japan Can- U.S. Ger- U.K. pines sia gary Republic ada many GDP per capita PPP 3,879 5,925 3,545 9,204 13,292 10,970 11,600 15,629 36,009 14,747 21,115 29,895 35,456 41,880 27,216 30,226 2005 * Shares as of 1999. Source: ILO; Global Insight WMM; CIA World Factbook 4 Exhibit 5 GLOBAL SERVICES AND MANUFACTURING TRADE HAVE GROWN RAPIDLY OVER THE LAST 20 YEARS Global exports by major category – 1980-2002 CAGR $Billion Sector 1980-2002 9,000 % 8,000 7,000 6,000 5,000 Manufacturing 6.9 4,000 3,000 Services 6.9 2,000 1,000 Mining 1.4 0 Agriculture 0.1 1980 1982 1984 1986 1988 1990 1992 1994 1996 1998 2000 2002 Note: Exports were used to measure global trade. In addition, the data are in nominal dollars since no deflators were available from the WTO for services trade. Source: WTO; "International Trade Statistics 2003" 5 18
  • 19.
    Exhibit 6 OFFSHORING REPRESENTSAN EVEN FASTER GROWTH SEGMENT OF TRADE BPO/IT offshoring to low-wage locations as a percent of total global service exports $Billion Project CAGR 1,697 2,372* % 100% Other 90 7 97 services* Offshoring to low- 3 10 ~30 wage locations 2003 2008E * Estimated at 6% annual growth from 2002 figure. Source: WTO; McKinsey Global Institute analysis 6 represents approximately 30 percent of services trade the Organization for Economic Co-operation and Development (OECD) countries, while transportation represents 20 percent. QUESTIONS ADDRESSED BY OUR STUDY Our research sheds light on several key questions: What is the total number of jobs worldwide that can be globally resourced? How close will actual demand for offshoring from developed economies to emerging markets come to this potential total? How does the potential for offshoring and its degree of adoption differ among industries? What is the current supply of labor suitable to perform offshoring services in developing markets? 19
  • 20.
    How does supplyand demand meet? Which countries will provide offshoring labor? Will different types of offshoring be attracted to different countries? How will offshoring affect employment and wages in developing and developed countries? The report covers offshoring between a wide range of developed and developing countries (36 countries in all). To assess the situation on the ground, six full- time team members devoted 12 months to this research. In addition we tapped the expertise of consultants at 82 McKinsey offices in 44 countries, as well as conducting nearly one hundred interviews with companies in our focus countries. We also collected the most comprehensive data available on actual offshoring demand through interviews with companies and from their own and analysts' reports. We collected detailed statistics on labor supply for 16 countries from sources of national statistics—making adjustments for consistency when necessary—to build the most comprehensive view of global labor markets that exists. We also collected data on 50 separate measures of the cost of operating in the 16 focus countries to understand which countries would serve as the most attractive offshore locations. We determined not only the potential number of jobs that theoretically could be relocated offshore, but also the actual demand to date and how that will grow over the next five years. In addition, we determined both the potential supply of labor in each country as well as the realistic level of supply that is sufficiently skilled to provide services to overseas companies. This analysis allows us to understand the dynamics that bring together supply and demand in the global labor market, including the constraints that might appear and the potential impacts on wages and employment in both developed and developing countries. We hope that this analysis will ultimately lead to a new way of looking at the range of issues presented by the offshoring of services. 20
  • 21.
    Executive Summary “Something newis going on. America is short of jobs as never before, and the major candidates for our offshore outsourcing are ramping up employment as never before. So yes, I think two and two is four.”1 "The essential conclusion remains that offshoring, and more broadly import competition, while clearly having an important effect on some industries, workers, and communities, were not significant causes of the 'jobless recovery.'"2 Opinions differ about the dynamics of supply and demand in the emerging global market for service labor. Some argue that the potential supply of offshore talent is nearly limitless, while others point to signs of limited supply already forcing wage increases. Having analyzed potential and likely demand for offshore talent in the first report in our series, and quantified potential supply in the second, in this third and final report we look at the fit between the two. Supply and demand necessarily clear through price, represented in the labor market by wages. Mapping likely demand for offshore talent against the potential suitable supply shows that, as the conflicting views indicate, this market is not clearing smoothly. We discuss measures to improve the market's efficiency that could be taken both by companies on the demand side and by policy-makers in countries on the supply side. 1 Stephen S. Roach as quoted in "Who Wins and Who Loses as Jobs Move Overseas?" Erica Kinetz, 7 December 2003. The New York Times. 2 Charles L. Schnultze. Offshoring, Import Competition and the Jobless Recovery." August 2004. Brookings Policy Brief No. 136 21
  • 22.
    Potential supply oflow-wage talent is greater than likely demand Our results show that, at an aggregate level, the potential supply of suitable talent from the 28 low-wage countries we studied exceeds demand for offshore talent from companies in high-wage countries. This is true for each of the eight occupations we analyzed (Exhibit 1).3 For instance, in 2008 the supply of support staff suitable for employment by multinational firms will exceed demand by 98 percentage points, and the suitable supply of young professional generalists will be 78 percentage points greater than expected demand. Exhibit 1 POTENTIAL SUITABLE SUPPLY EXCEEDS LIKELY DEMAND FOR GLOBALLY RESOURCED TALENT IN MOST YOUNG PROFESSIONAL (YP)* OCCUPATIONS Likely demand Suitable supply Likely low-wage labor demand and suitable supply**, 2008 x Demand as a FTEs thousand percentage of supply (%) 31,296 3,245 2,184 1,799 1,089 946 752 722 596 742 333 112 50 0 2 1 Support Generalist Finance/ Analyst YP Nurses Engineering Doctors Life science staff YP accounting YP YP YP 2 22 5 3 0 63 ~0 ~0 * 7 years of work experience. ** Assuming constant suitability rates from 2003 to 2008; aggregated low-wage supply from 28 countries. Source: McKinsey Global Institute analysis Only the supply of available engineers in low-wage countries is less abundant, contrary to opinion among many engineers in high-wage countries. Even if the combined supply of all 28 low-wage countries we studied is utilized, wage rises for engineers would reflect constraints in low-wage supply as early as 2015 if we assume an aggressive rate of growth in offshore demand for this occupation, 3 The occupations are: engineers, finance and accounting professionals, analysts, life science researchers, doctors, nurses, generalists, and support staff. 22
  • 23.
    and an annualgrowth rate of 5 percent in the supply of labor suitable for employment in multinationals. If countries were to implement measures to make more of their graduates suitable for such employment, and supply were thus to grow at higher rates, this scenario would likely change (Exhibit 2). Exhibit 2 AT CURRENT SUITABILITY RATES AND AN AGGRESSIVE PACE OF ADOPTION IN DEMAND, SUPPLY OF ENGINEERS COULD BE CONSTRAINED BY 2015 Demand at current PoA** Demand at aggressive Demand and supply* for low-wage engineers, young professionals PoA** after 2008 Supply at current FTEs suitability rate Supply at increased 3,500,000 suitability rates Project Growth rates applied 3,000,000 forecast period 2,500,000 2,000,000 1,500,000 1,000,000 500,000 0 2003 2006 2009 2012 2015 2018 2021 Years * Supply forecast is based on extrapolation of 10 low-cost countries to a further 18 low-cost countries and does not include effects of supply fragmentation. ** Pace of adoption is the rate at which companies are pursuing offshoring. Source: McKinsey Global Institute analysis Local supply/demand inefficiencies persist Matching supply and demand at this aggregate level gives an illusory impression of plenty. In practice, misalignment between supply and demand is creating localized labor supply constraints. On the supply side, potential employees are widely dispersed across low-wage countries and far from perfectly mobile. On the demand side, companies hiring offshore frequently follow each other to locations that have a track record in providing offshore talent. The resulting agglomeration of companies in popular locations has some positive effects, such as accelerating improvements in infrastructure, communications and the business environment. But it also leads to a concentration of demand in limited supply pools, which puts upward pressure on local wages and attrition levels. 23
  • 24.
    Agglomeration is alreadyaffecting the supply and cost of labor in some cities in Eastern Europe and India. For example, if current demand trends continue, the supply of suitable labor in Prague and Hyderabad will be constrained as early as 2006 and 2008, respectively. (Labor market conditions in these two cities are examined in detail in this report.) And once companies have chosen a location, it is hard for them to switch to another one because of sunk costs in physical and human capital. Agglomeration effects could also be felt at a country level in certain occupations. At present, India, the Philippines, and China are often the top choices for locating IT and engineering-based services for companies from the United Kingdom and the United States, the main sources of demand. If U.S. and UK companies continue to concentrate their activities on these three countries and current rates of offshoring persist, the demand for engineers from these two countries would fully absorb the suitable supply by 2011 (Exhibit 3). Exhibit 3 US AND UK DEMAND COULD ABSORB THE ENTIRE SUPPLY OF SUITABLE YOUNG PROFESSIONAL ENGINEERS FROM CHINA, INDIA AND THE PHILIPPINES BY 2011 Demand from US and UK Demand (from US and UK) and suitable supply* (from China, Suitable supply India, and Philippines) for low-wage young professional from China, India, engineers** and Philippines FTEs 1,000,000 900,000 800,000 700,000 600,000 500,000 400,000 300,000 200,000 100,000 0 2003 2003 2005 2007 2009 2011 2013 2015 demand is 170,000 Years * Supply forecast does not include effects of supply fragmentation and local demand. ** 7 years of work experience. Source: McKinsey Global Institute analysis 24
  • 25.
    Demand will disperseif companies analyze potential offshore locations rationally according to their specific needs Companies have different requirements from offshore locations, depending on a host of factors including their home market, their first language, what activity they want to offshore, the scale on which they want to offshore, and whether they want to outsource or set up a captive operation. This means different companies will assign different costs and benefits to the same location. Put another way, there is no single, homogeneous supply curve in the emerging global labor market—every company faces a different curve. This feature of the market will act as a natural force for dispersing demand to fit supply more congruently, if companies act rationally to harness it. To do so, they need better information about the talent supply that suits their needs, and they also need to know the real costs of employing suitable talent in any potential location. Companies will find more information on the distribution of suitable talent across developing countries in "The Supply of Offshore Talent in Services," our previous report in this series. But each company needs to make its own analysis of location costs for each potential location. What will that analysis entail? First, a company needs to define in detail the criteria governing its choice of location. At a broad level, these are likely to include: labor cost; the quality of local service vendors; market potential; the intrinsic risks of the location; its business environment; and the quality of its infrastructure. The company can then weigh these criteria according to its particular goals and requirements. When it has gathered the relevant data about the criteria from each potential location, it can calculate its own true cost of offshoring in any of them. (In this report we describe the Location Cost Index, a data-based tool created along these lines for assessing potential offshoring locations.) A company that ranks potential locations in order of their true cost will in effect be drawing its unique supply curve. If companies consider only current wage levels in their assessments of offshoring locations, then India and China will seem the best choice to all of them, as these three countries at present have the lowest average labor costs for services workers. But when companies rank countries according to their unique cost criteria, more locations will emerge as attractive to more companies (Exhibit 4). Our database on supply countries shows they vary considerably on the basic cost criteria. 25
  • 26.
    Exhibit 4 RANKING OF POTENTIAL OFFSHORE LOCATIONS VARY ACCORDING TO COMPANY'S UNIQUE CRITERIA Attractive country Company specific Reference weighting factor country*** Company specific LCI for countries**** Germany Malaysia Republic Hungary Canada Mexico Poland Ireland Russia Czech Philip- Japan China Brazil pines India U.S. U.K. Highest 3.2 3.4 3.5 3.5 3.7 2.5 2.7 2.7 2.9 2.9 3.0 3.0 3.1 weight on U.S. 2.3 2.4 2.6 cost* Relatively high weight on 3.3 3.2 3.6 U.S. 2.8 3.0 2.7 3.0 2.6 2.8 2.8 3.0 2.5 2.5 3.0 3.1 business 2.6 environment (convenience)** Relatively high weight on 3.1 3.1 3.6 2.5 2.8 2.6 2.9 2.8 2.5 3.0 2.8 2.9 2.6 2.8 business Germany 2.3 2.3 environment (convenience)** * Cost:50%, vendor landscape:10%, market potential:10%, risk profile:10%, business environment:10%, quality of infrastructure:10% ** Cost:35%, vendor landscape:0%, market potential:0%, risk profile:20%, business environment:35%, quality of infrastructure:10%. Within business environment, travel time is assigned higher weighting *** The reference country is the company's home country from whose viewpoint locations are evaluated **** Location Cost Index. In this ranking 1 is the most attractive and 5 is the least attractive Source: Location cost index database Global resourcing will raise average wages in low-wage countries and have muted impact on employment and wages in high-wage countries What would be the effect on wages of engineers in low-wage countries if labor cost was the most important factor in the choice of location for all U.S. companies seeking to employ engineers offshore? Our analysis shows that demand would be satisfied by supply from the Asian countries plus a fraction of supply from Latin American countries (Exhibit 5). Average wage levels in countries to the left of the point where the market clears in this analysis could likely double. While wages will increase, making offshoring to low-wage countries less attractive, they will not reach wage levels for the same occupations prevailing in the United States or Western Europe. Instead, the market will clear when wages for offshore engineers are roughly equivalent to the level of wages in Mexico or Brazil, or about 30 percent the level of wages for engineers in the United States (Exhibit 6). 26
  • 27.
    Exhibit 5 IF ALLCOMPANIES SEEKING YOUNG PROFESSIONAL ENGINEERS WERE COST-DRIVEN, THEIR LIKELY DEMAND WOULD BE SATISFIED BY TALENT FROM COUNTRIES LEFT OF MEXICO… Demand for remote labor vs. supply curve – young professional engineers*, 2008 LCI** Demand: 596k 3.80 Ireland Other Latin American 3.40 South Africa countries*** Hungary Czech Republic Mid-wage Asia-Pacific Countries*** 3.00 Other Eastern European countries*** Mexico Brazil Other low-wage Asian countries*** 2.60 Malaysia Germany Japan 2.20 Canada U.K. Russia Poland Philippines U.S. 1.80 India China 1.40 1.00 0 200 400 600 800 1,000 1,200 1,400 1,600 1,800 2,000 Size of suitable labor pool thousands * 7 years of work experience; supply does not consider limited talent accessibility and domestic labor demand ** Location cost index. Applied the weighting of cost: 50%, vendor: 10%, market: 10%, risk: 10%, infrastructure: 10%, and environment: 10% *** The LCI values for the other countries are estimated Source: McKinsey Global Institute analysis Exhibit 6 …AND WAGES OF YOUNG PROFESSIONAL ENGINEERS IN THOSE COUNTRIES COULD RISE TO APPROXIMATELY 30% OF U.S. LEVEL* Current labor cost Estimate of Comparison of hourly labor cost; Index**, U.S. = 100 wage inflation 158 Assumption • 596,000 engineer young 116 professionals 108 111 are globally 100 resourced in 2008 84 • All companies are strong cost seekers*** • Wage in low- cost countries 46 41 raise to match 30-35 36 37 25-30 25-30 28 LCI value of 20-25 27 Brazil/Mexico 19 20 12 13 India Philip- China Mala- Mex- Brazil Po- Hun- Czech Rus- Can- U.S. Ire- U.K. Japan Ger- pines ysia ico land gary Re- sia ada land many public * Does not consider stickiness, limited talent accessibility, domestic labor demand and manager scarcity which might inflate wages beyond these levels at least for some occupational categories. ** Hourly labor cost reflects average of all job categories within a country *** Weighting of labor cost with 50% within LCI Source: Watson Wyatt; local sources (e.g., Labor census); interviews, McKinsey Global Institute analysis 27
  • 28.
    Wage costs overallin supply countries will rise more slowly if companies select locations according to their unique requirements. The resulting mixture of rational location strategies will disperse demand so that it fits more evenly with the distribution of suitable supply. In contrast, local wage inflation will likely continue in some offshoring locations as long as companies concentrate their demand on a few cities. Because it is hard for companies to switch locations quickly, individual companies may see wages in their chosen offshoring location rise above the levels of neighboring countries along their individual cost curve, if demand in their chosen location begins to outstrip supply. Offshoring will have little effect on wage levels in developed countries because it will have only a small impact on overall employment in those countries in the occupations we analyzed. Consider the impact in the United States. Over the past 30 years, the United States has experienced an 11 percentage point decline in manufacturing jobs, but wages have remained stable. By comparison, we estimate that a total of 9 percent of jobs in services in the United States could theoretically be performed remotely. However, it is unlikely that all these potentially transferable jobs will move offshore over the next thirty years, because of the considerable barriers to offshoring detailed in the first report in this series.4 Assuming that half the potentially transferable service jobs—a more realistic estimate, although still high—are actually relocated offshore over that period, the resulting job turnover would be around 225,000 jobs per year— or 1-2 percent of the 16 million jobs created5 per year in the U.S. economy. Countries providing offshore talent can take steps to attract "best fit" companies Since there is no general, fixed ranking of offshoring locations from the demand perspective, there is no preordained set of "winners and losers" on the supply side. Individual countries seeking to attract offshoring investment should target those companies and sectors whose requirements most closely match what the country can already offer, and then hone their attractive features. That strategy 4 The Emerging Global Labor Market. Part I-Demand for Offshore Talent in Services. Available at www.mckinsey.com/mgi. 5 Douglas Brown and Scott Wilson The Black Book of Outsourcing: How to Manage the Changes, Challenges and Opportunities. Wiley, 2004. 28
  • 29.
    depends on supplycountries forming a clear understanding of their potentially attractive features and which sectors or companies might favor them. Countries on the supply side of the emerging labor market will also benefit greatly from marketing their attractions to their target sectors. This is especially true for countries whose characteristics are rather similar to surrounding, and therefore competing, peers. Concerning the attractiveness of a location's labor supply, the focus of government efforts should be on improving the quality of graduates rather than growing sheer numbers of graduates, as we explain in our second report in this series.6 Other important attractiveness factors that governments can influence in the short to medium term are their support for foreign investors, the state of the infrastructure, the competitiveness of their tax regime, and the effectiveness of intellectual property law. Finally, policy-makers and educational institutions in high-wage countries should equip their graduates to work effectively with their peers in today’s low-wage countries. In Europe, for example, those countries and companies that encourage their graduates to look for opportunities to the east, with appropriate language training, funded exchange programs and internships, will be best placed to benefit from the talent pool represented by new EU members, such as Hungary, the Czech Republic, and Poland and by emerging markets in Asia. *** 6 The Emerging Global Labor Market Part II-Supply of Offshore Talent in Services. Available at www.mckinsey.com/mgi 29
  • 30.
    Synthesis INTRODUCTION Opinions differ aboutthe fit between supply and demand in the emerging global market for service labor. Some argue that the potential supply of offshore talent relative to demand is nearly limitless, while others point to signs of limited supply already forcing wage increases. To date, however, the facts required to resolve this debate have been missing, in particular the answers to the following key questions: How does demand for offshore labor from companies in high-wage countries match the supply of suitable offshore labor from low-wage countries? Will a defined set of countries with similar supply characteristics continue to provide the bulk of offshoring labor, or will different countries attract different types of offshored functions? How will offshoring affect employment and wages in developing and developed countries? Building on research described in the two previous reports in this series, in this third and final report, the McKinsey Global Institute (MGI) offers answers to these and several related questions. The first report in the series, "The Demand for Offshore Talent in Services," presented estimates of current and future demand at an occupational level from eight sectors1 for jobs that could be resourced globally (i.e., performed anywhere 1 The eight sectors evaluated were: auto, health care, insurance, IT services, packaged software, pharmaceuticals, retail banking, and retail 30
  • 31.
    in the world).These sectors together account for approximately 15 percent of the world's nonagricultural employment. The second report, "The Supply of Offshore Talent in Services," estimated the availability of low-wage labor to meet this demand at an occupational level. It quantified the supply of talent suitable for employment in multinational companies (MNCs) in 28 low-wage countries and eight mid- to high-wage countries.2 In this report we analyze how demand and supply meet for the eight occupations3 that we previously evaluated. In the end, supply and demand will necessarily clear through price, represented in this market by wages.4 However, mapping likely demand against potential supply shows that, as the conflicting views reported previously indicate, this market is not clearing efficiently. The report shows where inefficiencies in the market are apparent, and the impact of the market's development on both high-wage and low-wage countries. We discuss measures to improve the market's efficiency that could be taken both by companies in high-wage economies on the demand side and by policy-makers in low-wage countries that wish to attract offshoring investment. The report is divided into five sections: Matching supply and demand at a global level examines the fit between the supply of suitable talent from low-wage countries and the likely demand for offshore talent from companies in high-wage countries. Evaluating inefficiencies in the market discusses reasons for inefficiencies in the fit between potential supply and likely demand, including agglomeration effects (and their particular impact on two current offshoring "hub" cities), and "stickiness" effects. 2 Mid- to high-wage countries studied in-depth were: Canada, Germany, Ireland, Japan, the United Kingdom, and the United States; Australia and South Korea were studied by way of extrapolation. Low-wage countries included in the in-depth study were: Brazil, China, Czech Republic, Hungary, India, Malaysia, Mexico, Philippines, Poland, and Russia; other low-wage countries studied were: Argentina, Bulgaria, Chile, Colombia, Croatia, Estonia, Indonesia, Latvia, Lithuania, Romania, Slovakia, Slovenia, South Africa, Thailand, Turkey, Ukraine, Venezuela, and Vietnam. 3 The eight occupations analyzed were: engineers, finance and accounting professionals, analysts, life science researchers, doctors, nurses, generalists, and support staff. 4 Therefore, when we refer to "supply exceeding demand" in a market, this can be properly viewed as a situation where pressure on wages will be present. 31
  • 32.
    Selecting locations forglobal resourcing discusses how companies can take a more analytical approach to selecting offshore locations and the impact that will have on the emerging global labor market. This section introduces the Location Cost Index, a data-based tool for evaluating offshoring locations populated with data from the potential offshoring locations we studied. The impact of offshoring on wages in low-wage and high-wage countries presents the potential evolution of wages in developing nations in the light of offshoring and explains why its effect on wages in developed countries is likely to be negligible. Implications for companies and countries examines what these findings mean for multinational companies seeking to locate service functions in low- wage countries, for developing countries seeking to attract such investment, and for policy-makers in developed countries. MATCHING SUPPLY AND DEMAND AT A GLOBAL LEVEL We matched our estimates of aggregate demand for globally resourced labor from companies in high-wage countries to the supply of labor suitable for employment in multinational companies in 28 low-wage countries. The results show that—at this effectively global level—the potential supply of labor in low- wage locations exceeds demand for the eight occupations we analyzed to 2008 (Exhibit 1). Only the available supply of engineers in low-wage countries is somewhat less abundant at this level, contrary to opinion among many engineers in high-wage countries. Other occupations with a relatively closer match between supply and demand are young professional generalists and young professional analysts. However, it is important to note that our estimate of total supply is based on data collected from 10 low-wage countries and extrapolated to a further 18 low- wage countries. In addition it assumes that all talent is available. It does not take into consideration the facts that not all suitable graduates in supply countries are accessible to multinationals for employment and that, in China, offshoring companies must compete with demand for talent from players serving the fast-growing domestic market and export-oriented manufacturing. (Both are discussed in depth in "The Supply of Offshore Talent in Services"). Lastly, we 32
  • 33.
    include in ouranalysis countries that, although they have low wage levels and are indeed potential locations for offshored activities, are not currently considered by companies as top offshoring locations. Exhibit 1 Likely demand POTENTIAL SUITABLE SUPPLY EXCEEDS LIKELY DEMAND Suitable supply FOR GLOBALLY RESOURCED TALENT IN MOST YOUNG x Demand as a PROFESSIONAL (YP)* OCCUPATIONS percentage of Likely low-wage labor demand and suitable supply**, 2008 supply (%) FTEs thousand 31,296 3,245 2,184 1,799 1,089 946 752 722 596 742 333 112 50 0 2 1 Support Generalist Finance/ Analyst YP Nurses Engineering Doctors Life science staff YP accounting YP YP YP 2 22 5 3 0 63 ~0 ~0 * 7 years of work experience. ** Assuming constant suitability rates from 2003 to 2008; aggregated low-wage supply from 28 countries. Source: McKinsey Global Institute analysis Engineers At current rates of growth in offshoring by companies and growth in the supply pool, we estimate that the combined supply of qualified young professional engineers from all 28 low-wage locations might begin to be constrained by 2023. Indeed, average wages for engineers from the 28 supply countries would rise as early as 2015 if we assume an aggressive rate of growth in demand for this occupation. However, these supply constraints arise when we assume an annual growth rate of 5 percent in the supply of labor suitable for employment in multinationals. If countries were to implement measures to make more of their graduates suitable for such employment and supply were thus to grow at higher rates, these scenarios would likely change (Exhibit 2). 33
  • 34.
    Exhibit 2 Demand at current AT CURRENT SUITABILITY RATES AND AN PoA** AGGRESSIVE PACE OF ADOPTION IN DEMAND, Demand at aggressive PoA** after 2008 SUPPLY OF ENGINEERS COULD BE CONSTRAINED BY Supply at current suitability rate 2015 Supply at increased Demand and supply* for low-wage engineers, young professionals suitability rates FTEs 3,500,000 Project Growth rates applied 3,000,000 forecast period 2,500,000 2,000,000 1,500,000 1,000,000 500,000 0 2003 2006 2009 2012 2015 2018 2021 Years * Supply forecast is based on extrapolation of 10 low-cost countries to a further 18 low-cost countries and does not include effects of supply fragmentation. ** Pace of adoption is the rate at which companies are pursuing offshoring. Source: McKinsey Global Institute analysis Generalists and pure analysts For these two groups, our analysis shows that no constraints on supply will appear if all 28 low-wage countries are considered. Since supply is not constrained, changes in the level of demand will do the most to determine the evolution of the emerging global market for talent in these occupations. EVALUATING INEFFICIENCIES IN THE MARKET The impression given by these figures of plentiful supply at the global and country level is somewhat illusory. In fact, companies hiring offshore frequently follow each other to cities or locations that already have a track record in providing offshore talent. The resulting agglomeration of companies in popular locations has some positive effects, such as accelerating improvements in infrastructure, communications, and the business environment. But it also leads to concentrated demand, which in turn leads to higher local wages and levels of attrition. These negative effects may persist because of "stickiness" factors making it hard for companies to switch locations. 34
  • 35.
    Agglomeration Agglomeration effects—benefits that all players enjoy due to the clustering of companies that perform similar activities in the same area—can be a powerful justification for companies to locate activities close to those of competitors or related industries. Manufacturing clusters, as in the Guangdong province of China, foster strong economies of scale, efficiencies in distribution, and concentration of infrastructure. High-tech clusters like the one in Silicon Valley foster innovation by facilitating interaction between "knowledge workers" in companies and research institutions. Clustering promotes other general advantages for a location including more vendors, more flights, better roads, and an improving business environment thanks to greater government support. Such advantages create positive externalities, so each additional member of the cluster will attract more followers. However, cluster growth can eventually produce negative effects, mainly increases in wages and attrition rates as the labor supply becomes constrained. Recruiting costs and real estate costs tend to go down as agglomeration increases, but then rise as the cluster gets crowded (Exhibit 3). Agglomeration can continue to increase a location's attractiveness for a long time if the local labor supply is vast and positive factors, such as R&D benefits, are strong. However, if labor supply or real estate are limited, the attractiveness of the location begins to decrease as soon as those limits are approached (Exhibit 4). The impact of agglomeration on cities Because pools of suitable labor are dispersed among and within countries and talent is not perfectly mobile, labor supply constraints can be visible much earlier in particular cities or regions than the aggregate size of a country's labor pool might imply. Agglomeration is already affecting the supply, cost of labor, and levels of attrition in some cities in Russia, Eastern Europe, and India, particularly for engineers and middle managers. We believe that several locations are at or past the peak of their attractiveness. In Prague and Hyderabad, two cities where the number of offshore operations has been growing strongly, the supply of suitable engineering labor may be constrained as early as 2006 and 2008 respectively. Prague. Several Eastern European cities have emerged as global resourcing destinations in the past decade, especially Budapest, Prague, Bratislava, and Krakow. These cities cater to nearby Western European countries who find in 35
  • 36.
    Exhibit 3 AGGLOMERATION CAUSESSOME LOCATION ATTRACTIVENESS FACTORS TO IMPROVE WHILE OTHERS DETERIORATE Agglomeration first Agglomeration increases, then Agglomeration increases attractiveness decreases attractiveness decreases attractiveness Attractiveness Attractiveness Attractiveness Cluster employment Cluster employment Cluster employment Location attractiveness factors • Vendor landscape • Recruiting costs • Wages • Convenience • Real estate costs • Attrition rates • Business and living environment • Infrastructure • R&D/human capital spillovers Source: McKinsey Global Institute analysis Exhibit 4 OVERALL, AGGLOMERATION CAN INFLUENCE LOCATION ATTRACTIVENESS DIFFERENTLY UNDER DIFFERENT SCENARIOS Scenario A – Uniformly Scenario B – Peaking Scenario C – Oscillating positive agglomeration effects agglomeration effects agglomeration effects Attractiveness Attractiveness Attractiveness Cluster employment Cluster employment Cluster employment • Likely when positive • Likely when positive • Likely when positive externalities are strong externalities are externalities are weak and and labor/real estate weak and labor/real labor/real estate supply supply are ample estate supply limited can respond to shortages in medium-term Source: McKinsey Global Institute analysis 36
  • 37.
    Eastern Europe thecombined advantages of relatively low labor costs, speakers of multiple Western languages, and proximity. While most of the companies that offshore to Eastern Europe have headquarters in Germany, the United Kingdom, the Netherlands, and Scandinavian countries, these cities are also becoming increasingly attractive to Indian vendors who want to establish a presence close to Western Europe. - Since 2000, several Western European and U.S. companies have selected Prague as a global resourcing location. In addition to the advantages that it shares with other Eastern Europe cities, effective self-marketing by the Czech government agency and Prague's attractive living environment have been decisive factors in its success. - Offshore centers near Prague are notable for their variety and growth. Companies from diverse sectors (electronics, automotive, logistics, and software) have bundled their European shared services in captive centers in the city. These perform a wide range of activities including finance and accounting processes, call-center operations, IT services, and software R&D. At least 16 large centers have been established in the past four years, and their demand for talent is growing. Total demand for labor from new engineering-focused centers has grown by roughly 50 percent a year since 2001, and three of these centers have plans to employ around 1,000 FTEs by 2008 (Exhibit 5). - Universities and colleges in the region graduate approximately 2,200 engineers per year. Roughly half of these new graduates are suitable for work in a multinational company. The supply of suitable local talent is growing at approximately 6 percent a year. However, if we assume that, by 2008, new engineering centers in the area will require about 550 FTEs and employment at the existing centers grows by 20 percent, then offshore centers alone will employ most of the suitable engineers in Prague (Exhibit 6). Wage increases for software and computer engineers beyond 10 percent per year, well above the average wage growth for service workers, indicate the beginning of supply constraints for this occupational group. So do reports from managers of the larger centers that they have started to recruit talent from other Czech and Slovakian cities (e.g., Brno, Bratislava) to meet their demand for labor in Prague. 37
  • 38.
    Exhibit 5 Number of new SINCE 2000, PRAGUE HAS SEEN A STRONG RISE IN THE centers opened ESTABLISHMENT OF ENGINEERING-FOCUSED GLOBAL RESOURCING CENTERS • At least 10 larger Total initial employment demand of engineering-focused centers focusing on global resourcing centers by starting year engineering activities have been established in Prague since 2000 3 • Establishing companies 550 are active in several CAGR: sectors ~54% – IT services 2 – Software – Electronics 330 2 – Logistics – Automotive 225 1 • Headquarter locations 2 of companies include 150 Germany, the Nether- 90 lands but also India 2001 2002 2003 2004 2005 (Up to April) Source: Company Web sites; press releases Exhibit 6 Suitable engineering graduates GLOBAL RESOURCING CENTERS WILL EMPLOY from Prague universities/colleges* ALMOST ALL SUITABLE ENGINEERING Demand for engineers by Global resourcing centers GRADUATES IN PRAGUE BY 2008 Share of suitable supply demanded by Global resourcing centers Supply/demand for suitable engineering graduates in Prague Projection (assuming constant demand from establishment of additional centers and 20% annual employment growth of existing ones) 84% 76% 70% 64% 1,436 39% 59% 1,350 1,270 1,205 20% 18% 1,194 7% 1,122 1,055 1,031 992 932 886 877 765 664 407 189 179 58 2000 2001 2002 2003 2004 2005 2006 2007 2008 * Assuming ~6% annual growth equal to all of the Czech Republic. Source: Company Web sites; press releases; University Web site; Czech Ministry of Education; McKinsey Global Institute analysis 38
  • 39.
    Hyderabad. The scarcityof local engineers in Hyderabad is even more striking. - In the late 1990s, some companies, mostly U.S. and Indian, began to look beyond the "first tier" of offshoring locations in India such as Bangalore and Mumbai. Hyderabad emerged as a sizable hub for software and IT intensive activities once large IT outsourcers like TCS and Satyam established operations there. Even though business process outsourcers followed, Hyderabad is still a location largely for software/IT-industry activities. Several major U.S. software vendors have established captive centers in the city. - Altogether, at least 20 large centers focusing on engineering activities have been established in Hyderabad since 1998. The years from 2002 onward saw explosive growth in activity in the city. In 2004 alone, six new centers were established, together employing approximately 5,000 FTEs (Exhibit 7). Exhibit 7 Number of new SINCE 1998, HYDERABAD HAS SEEN THE ESTABLISHMENT centers opened OF MANY LARGE ENGINEERING-FOCUSED GLOBAL RESOURCING CENTERS • At least 20 larger Total initial employment demand of engineering-focused global centers focusing on resourcing centers by starting year* engineering activities have been established in Hyderabad since 1998 6 • Establishing companies are mostly active in IT 5,100 services and software CAGR: 6 development ~60% 3,800 • Operations are equally captive and third party • Headquarter locations of companies are 4 almost exclusively US and India 1 1 1 1 1,300 300 400 480 460 1998 1999 2000 2001 2002 2003 2004 * Starting year employment was calculated based on 2004 employment using an assumed 20% annual growth rate Source: Company Web sites; press releases; McKinsey Global Institute analysis 39
  • 40.
    - Universities andcolleges in the region graduate roughly 25,000 engineers a year, of whom about 25 percent are likely to be suitable for work in multinationals. That will not be enough to meet demand for engineers at current growth rates. Demand for engineers will surpass suitable local supply as early as 2006, and reach 138 percent of supply by 2008. In 2006, offshore centers in Hyderabad will already be relying on recruiting labor from elsewhere, even at the young professional level (Exhibit 8). Exhibit 8 Suitable engineering graduates AT CURRENT GROWTH RATES, DEMAND FOR from Hyderabad universities/colleges* SUITABLE ENGINEERS IN HYDERABAD WILL Demand for engineers by Global resourcing centers EXCEED LOCAL SUPPLY BY MORE THAN 3,000 Share of suitable supply demanded by Global resourcing centers Supply/demand for suitable engineering graduates in Hyderabad Thousand Projection (assuming constant demand from establishment of additional centers and 20% annual employment growth of existing ones) 138% 121% 11.3 106% 9.4 93% 81% 8.2 23% 58% 7.8 7.8 10% 7.1 7.4 4% 7% 9% 6.7 6.5 6.1 6.4 5.5 5.8 5.0 5.3 5.5 3.7 1.4 0.2 0.4 0.5 0.6 1998 1999 2000 2001 2002 2003 2004 2005 2006 2007 2008 * Assuming ~5% annual growth equal to all of India Source: Company Web sites; press releases; McKinsey Global Institute analysis The impact of agglomeration on countries Agglomeration effects could be felt at a country level in certain occupations if current trends continue. Using data from the case studies of sectoral demand that form part of the first report in this series,5 we found that the United States and the United Kingdom together will account for 69 percent of the demand for globally resourced young professional engineers by 2008, while demand from 5 "The Demand for Offshore Talent in Services" 40
  • 41.
    Germany and Japanwill be much less significant (Exhibit 9). On the supply side, although several other countries are also offshoring locations, India, the Philippines, and China are very often the top choices among companies offshoring IT- and engineering-based services. We therefore matched demand for young professional engineers from the United States and the United Kingdom to the supply from India and China. We found that it would exhaust supply from these two countries by 2008. If supply from the Philippines is included, demand from the United States and the United Kingdom growing at current rates will exhaust the supply of young professional engineers from these three countries by 2011 (Exhibit 10). Exhibit 9 Percent of total THE U.S. ACCOUNTS FOR AROUND HALF OF SPLIT BASED ON DEMAND FOR OFFSHORED ENGINEERS IT SERVICES CASE Demand for offshored engineers, 2008 FTEs, thousand U.S. 315 53 U.K. 95 16 Rest – EU 15 94 16 Germany 33 6 Japan 13 2 Other* 43 7 Total offshored engineers (young professional) in 2008: 596,000 * E.g., Canada, Ireland. Source: McKinsey Global Institute analysis 41
  • 42.
    Exhibit 10 Demand from U.S. AND U.K. DEMAND COULD ABSORB THE ENTIRE US and UK SUPPLY OF SUITABLE YOUNG PROFESSIONAL Supply from ENGINEERS FROM CHINA, INDIA AND THE PHILIPPINES China, India, and Philippines BY 2011 Demand (from US and UK) and supply* (from China, India, and Philippines) for low-wage young professional engineers** FTEs 1,000,000 900,000 800,000 700,000 600,000 500,000 400,000 300,000 200,000 100,000 0 2003 2003 2005 2007 2009 2011 2013 2015 Years demand is 170,000 * Supply forecast does not include effects of supply fragmentation and competing demand. ** 7 years of work experience. Source: McKinsey Global Institute analysis Stickiness If a company finds that agglomeration makes conditions in its chosen offshore location deteriorate, management may not be able to relocate quickly to a better place. The higher a company's initial capital outlay to set up an offshore enterprise, the "stickier" the location is likely to prove, because management will be looking for enough cost savings from any new location to make good the investment sunk in the first one. Offshored activities require different levels of investment in physical capital, making some "stickier" than others (Exhibit 11). Similarly, companies invest heavily in developing human capital in their offshore activities, just as they do in their existing locations, with the development of knowledge workers requiring the most time and resources. The more a company has invested in human capital formation in their chosen location, the less likely it is to move as conditions in that locale deteriorate. The cost of building human capital is difficult to measure, so we have no means of estimating objectively the degree of stickiness it creates. Anecdotal evidence, however, suggests that human capital investments are indeed an important 42
  • 43.
    factor in relocationdecisions. Lower human capital investments may even offset the stickiness created by high physical sunk costs. A call center needs a big initial investment in physical capital but much less investment in human capital than would an R&D or analytics operation, for example several companies have easily relocated call centers from Ireland and even India to the Philippines. Finally, companies that use vendors to provide offshore services generally have fewer sunk costs in physical and human capital in any location. Consequently it is easier for them to change locations. However, switching vendors does incur some "start-up" costs, for example, spending on systems integration. The greater these costs, the "stickier" the location will appear to the management team that has invested in them. Exhibit 11 ONE-TIME/INVESTMENTS COSTS FOR BPO CENTERS – INDIA Cost for 250 seat center $Million* 5.2 1.7 1.7 Call Shared Analytics center services – HR * Does not include severance costs. Source: McKinsey analysis 43
  • 44.
    SELECTING LOCATIONS FORGLOBAL RESOURCING As the supply of labor for particular occupations in some countries gets tight, and agglomeration makes supply even tighter in some cities, companies are likely to start tapping the supply of available labor in a wider range of countries. The way in which companies select locations for offshoring will become increasingly critical to the performance and profitability of their offshore ventures. Companies have different requirements from offshore locations, depending on a host of factors including their home market, their first language, what activity they want to outsource, the scale on which they want to offshore, and whether they want to outsource or set up a captive operation. This means different companies will assign different costs and benefits to the same location. Put another way, there is no single, homogeneous supply curve in the emerging global labor market—every company faces a different curve. This feature of the emerging global labor market will act as a natural force for dispersing demand to fit supply more congruently if companies analyze carefully the cost of accessing labor in various global resourcing locales before choosing where to establish their facilities. Companies do this already, but not always comprehensively. To make a rational analysis, companies need better information about the location of talent that suits their needs, and they also need to know the real costs of employing suitable talent in any potential location. What will that analysis entail? First, a company needs to define in detail the criteria governing its choice of location. At a broad level, these are likely to include: labor cost, the quality of local service vendors, local market potential, the intrinsic risks of the location, the nature of its business environment, and the quality of its infrastructure. The company can then weight these criteria according to its particular goals and requirements. When the company has gathered the relevant data about the criteria from each potential location, it can calculate its own true "cost" of offshoring in any of them based on both quantitative and qualitative measures. Using the Location Cost Index (LCI) database6 (see gray box), we can estimate the total cost to a particular company or group of companies of accessing labor in potential locations, and rank the locations accordingly (Exhibit 12). 6 Proprietary database developed in this study which evaluates countries along 50 different factors and creates comparative indexes. 44
  • 45.
    Exhibit 12 SAMPLE RANKING OF LOCATION ATTRACTIVENESS FOR A Attractive country COST-DRIVEN COMPANY BASED IN THE UNITED STATES Unattractive country Index Company components Countries specific weighting Germany Malaysia Republic Hungary Canada Mexico Poland factor Russia Ireland Czech Philip- Japan China Brazil pines India U.K. U.S. 4.4 3.9 4.6 4.4 4.5 4.9 2.2 2.2 2.6 2.6 2.7 3.0 Cost 1.5 1.8 1.7 1.5 40 3.7 4.7 4.5 4.7 4.7 4.7 4.0 4.5 Vendor 3.5 3.2 2.5 3.5 2.2 1.8 2.2 20 landscape 1.0 3.5 3.3 3.5 4.2 3.3 3.5 3.3 Market 2.8 2.7 2.5 2.8 2.8 3.0 2.8 3.0 1.8 10 potential Risk 3.4 3.9 2.8 3.5 3.5 2.7 2.2 2.3 2.2 2.7 1.7 2.1 1.9 2.0 1.5 1.5 10 profile Environment 3.6 3.6 3.4 3.7 3.0 2.8 3.0 3.1 3.3 3.1 2.6 1.7 2.1 2.5 2.5 1.3 10 business Quality of 3.3 2.5 2.5 2.8 2.8 3.0 3.0 3.3 2.3 2.8 2.8 2.3 2.0 2.0 1.5 2.0 10 infrastructure 2.6 2.7 2.7 2.9 2.9 3.0 3.0 3.1 3.2 3.4 3.5 3.5 3.7 Company 2.3 2.4 2.5 specific LCI* * In this ranking 1 is the most attractive and 5 is the least attractive. Source: Location cost index database The countries that emerge as lowest cost will vary depending on the preferences of the company making the analysis. As a consequence, an increasing number of countries will likely emerge as attractive to more companies, and so begin to participate in the global market for talent. India, Philippines, and China, the most popular offshoring destinations today, are not necessarily the most attractive locations for all companies, even though they have the lowest average labor costs (Exhibit 13). Exhibits 14 and 15 demonstrate this fact using location cost analyses from real companies as examples. Exhibit 14 shows the location ranking for a U.S. based company with some concern for cost but more interest in finding the right talent to undertake R&D. For this company, the United States turned out to be the best location—indeed, high-wage countries often emerge as the most attractive location for R&D functions. In contrast, Exhibit 15 shows the result for a European based company with a strong preference for convenience. For this company, easy flight access, a close time zone, and similar culture were important. As a consequence, it ranked nearby Eastern European countries the highest. 45
  • 46.
    Exhibit 13 INDIA ANDPHILIPPINES ARE THE MOST ATTRACTIVE COUNTRIES IN TERMS OF LABOR COST* Comparison of hourly labor cost; Index**, U.S. = 100 158 116 108 111 100 84 46 41 36 37 27 28 19 20 12 13 India Philip- China Mala- Mex- Brazil Po- Hun- Czech Rus- Can- U.S. Ire- U.K. Japan Ger- pines ysia ico land gary Re- sia ada land many public Average working 2,347 2,301 1,958 2,152 2,281 1,869 1,901 2,012 1,946 1,784 1,869 1,895 1,779 1,787 1,864 1,674 hours – 2003 hours/year * Labor costs include benefits and taxes; averaged across a variety of professional job categories. * ** Index is based on dollar wages; exchange rate: 12 months average as of January 2005. Source: Watson Wyatt; Local sources (e.g., Labor census); Interviews Exhibit 14 FOR A U.S. COMPANY ASSIGNING A RELATIVELY LOW WEIGHTING TO COST AND A HIGH WEIGHTING TO CONVENIENCE, THE U.S. RANKS AS THE MOST ATTRACTIVE LOCATION Location Cost Index 4.0 Mexico Ireland Brazil Reference Other Latin America** country – US 3.5 Malaysia Czech Republic Hungary Cost 35 Poland South Africa 3.0 Domestic market 0 Environ- 35 2.5 ment* Mid wage Asia Pacific** Other Eastern Europe** Other low wage Asia** Vendor Philippines landscape 0 2.0 Germany China Canada Russia Japan Risk profile 20 U.K. U.S. India Quality of infrastructure 10 1.5 1.0 0 200 400 600 800 1,000 1,200 1,400 1,600 1,800 2,000 2,200 Size of suitable labor pool, all young professionals*** * Within environment, convenience (e.g., travel time) is assigned higher weighting ** Location Cost Index values are estimated *** University-graduated, suitable workforce; 7 years of work experience; supply does not consider limited talent accessibility and domestic labor demand Source: McKinsey Global Institute analysis 46
  • 47.
    Exhibit 15 FOR A CONVENIENCE-DRIVEN COMPANY BASED IN GERMANY, EASTERN EUROPEAN COUNTRIES ARE MORE ATTRACTIVE THAN INDIA Location Cost Index 4.0 Hungary Mexico Czech Republic **Mid wage Reference Asia Pacific country – Germany Poland 3.5 Malaysia South Africa Brazil Cost 35 Ireland 3.0 Domestic market 0 Environ- 35 2.5 Other Latin America** ment* Other Eastern Europe** Other low wage Asia** Vendor landscape 0 Canada Japan 2.0 Philippines Germany Russia Risk profile 20 India China U.K. U.S. Quality of infrastructure 10 1.5 1.0 0 200 400 600 800 1,000 1,200 1,400 1,600 1,800 2,000 2,200 Size of suitable labor pool, all young professionals*** * Within environment, convenience (e.g., travel time) is assigned a high weighting ** Location Cost Index values are estimated *** University-graduated, suitable workforce; 7 years of work experience; supply does not consider limited talent accessibility and domestic labor demand Source: McKinsey Global Institute analysis These examples show that when companies take an analytical approach to selecting their offshore locations, they choose different locations from each other. In fact, demand for offshore talent is already dispersing: a recent MGI survey of senior executives finds that companies are locating a significant number of offshore activities outside India, especially activities other than IT and call centers, India's established strengths (Exhibit 16). This suggests companies are beginning to make more detailed appraisals of their potential offshore locations. Such careful analysis will only become more important in the future, as more cities made popular by a "follow the leader" approach begin to hit supply constraints. 47
  • 48.
    Exhibit 16 INDIA’S LEADINGPOSITION IN IT IS STRONGER THAN IN OTHER AREAS Percent of share of survey respondents’ current or future offshoring centers by country U.S. 100% = 99 102 102 100 99 97 Canada 0 3 2 2 2 0 3 West Europe 10 9 4 12 East Europe and Russia* 0 4 2 0 Africa 2 0 17 3 7 0 0 0 Latin America 8 10 10 Other Asia and Pacific 7 21 4 6 Malaysia 1 6 6 0 China 7 9 15 0 11 3 8 3 9 7 7 12 18 6 2 10 4 8 0 India 68 21 55 43 43 45 24 IT Call center Business Finance and Human Industry- help desk research administration resource specific R&D analytics Total number 21 16 15 12 14 17 of countries * Includes Turkey Source: McKinsey Global Institute Survey THE IMPACT OF OFFSHORING ON WAGES IN LOW-WAGE AND HIGH- WAGE COUNTRIES Wage levels can rise as the gap between demand and supply narrows, changing the relative attractiveness of countries over time. Some offshoring companies have already experienced wage inflation for engineers in low-cost countries. For example, in India the wages for software/IT middle-managers stood at 5 percent of the United States levels in 1998, but by 2003 had reached 15 percent. How high could wage levels rise in what are now low-wage countries? To tackle this question, we modeled what would happen to wage levels for young professional engineers in supply countries if, in 2008, all companies in the United States seeking to hire such engineers offshore placed their highest weight on labor costs. Under this scenario, the demand would be met, moving up the supply curve, from India, the Philippines, Malaysia, China, other Asian countries (e.g., Indonesia), and Brazil (Exhibit 17). As a consequence wages in countries to the left of Mexico—the next most attractive country after Brazil— on the curve would be likely to rise to Mexican levels, or to about 30 percent of the United States levels (Exhibit 18). 48
  • 49.
    Exhibit 17 IF ALL COMPANIES SEEKING YOUNG PROFESSIONAL ENGINEERS WERE COST-DRIVEN, THEIR LIKELY DEMAND WOULD BE SATISFIED BY TALENT FROM COUNTRIES LEFT OF MEXICO… Demand for remote labor vs. supply curve – young professional engineers*, 2008 LCI** Demand: 596k 3.80 Ireland Other Latin American 3.40 South Africa countries*** Hungary Czech Republic 3.00 Other Eastern European countries*** Mexico Mid-wage Asian Countries*** Brazil Other low-wage Asian countries*** 2.60 Malaysia Germany Japan 2.20 U.K. Canada Russia Poland Philippines U.S. 1.80 India China 1.40 1.00 0 200 400 600 800 1,000 1,200 1,400 1,600 1,800 2,000 Size of suitable labor pool thousands * 7 years of work experience; supply does not consider limited talent accessibility and domestic labor demand ** Location cost index. Applied the weighting of cost: 50%, vendor: 10%, market: 10%, risk: 10%, infrastructure: 10%, and environment: 10% *** The LCI values for the other countries are estimated Source: McKinsey Global Institute analysis Exhibit 18 Current labor cost …AND WAGES OF YOUNG PROFESSIONAL ENGINEERS Estimate of IN THOSE COUNTRIES COULD RISE TO wage inflation APPROXIMATELY 30% OF US LEVEL* Comparison of hourly labor cost**; Index*, U.S. = 100 158 Assumption • 596,000 engineer young professionals 116 108 111 are globally resourced 100 in 2008 84 • All companies are strong cost seekers*** • Wage in low- cost countries 46 41 raise to match 30-35 36 37 LCI value of 25-30 25-30 28 20-25 27 Brazil/Mexico 19 20 12 13 India Philip- China Mala- Mex- Brazil Po- Hun- Czech Rus- Can- U.S. Ire- U.K. Japan Ger- pines ysia ico land gary Re- sia ada land many public * Does not consider stickiness, limited talent accessibility, domestic labor demand and manager scarcity which might inflate wages beyond these levels at least for some occupational categories. ** Hourly labor cost reflects average of all job categories within a country *** Put 50% of weighting to cost Source: Watson Wyatt; local sources (e.g., Labor census); interviews, McKinsey Global Institute analysis 49
  • 50.
    However, just becauseone country's wages increase to a higher level than wages in another country does not mean the two countries will exchange their positions in a particular company's location ranking, since each company's location analysis will rest on many factors other than wage costs. Indeed, wages in the first country may rise significantly higher than wages in the second before the first becomes less attractive if it has other location cost factors strongly in its favor. Consider an IT services company that places a heavy weight on labor costs and prefers to use a vendor. India's strong vendor base means that wages in India would have to increase 25 percent above those in Brazil—the next most attractive country—before India would rank lower (Exhibit 19). Exhibit 19 INDIAN WAGES HAVE TO INCREASE ~25% ABOVE BRAZIL’S BEFORE INDIA CEASES TO BE THE BEST LOCATION FOR THIS U.S. VENDOR- SEEKING COMPANY Breakdown along with the criteria Breakdown within cost Criteria weighting Labor India has Cost 2.6 cost* 2.0-2.5 strong 2.2 1.8 1.7 2.0 1.5 1.5 vendor base (50%) (75%) 1.5 1.0 India Brazil China Malaysia India Brazil China Malaysia 4.7 3.5 3.7 Other 2.2 2.0 2.9 2.8 2.3 LCI value of top 4 countries Vendor cost for U.S. cost seeks (20%) (25%) India Brazil China Malaysia India Brazil China Malaysia Infrastruc- 3.3 2.5 2.5 2.0 India's wage 2.6 2.6 2.6 2.6 ture must increase (10%) 2.1 25% above India Brazil China Malaysia Brazil India Brazil China Malaysia 2.7 2.8 3.4 Risk 2.3 (10%) India Brazil China Malaysia 3.8 3.5 Environ- 2.8 1.8 ment (10%) India Brazil China Malaysia 3.5 4.2 3.3 Market 1.8 potential (0%) India Brazil China Malaysia * Index of a labor cost: 1.0: ~15% of the U.S., 1.5: 15-25%of the U.S., 2.0: 25-35% of the U.S., 2.5: 35-45% of the U.S. Source: McKinsey Global Institute analysis Several location cost factors tend to improve together as a country's participation in the global labor market increases. This can often partially counteract the negative impact of rising wages on a location's total costs (see the outline of positive agglomeration effects in the previous section). 50
  • 51.
    In developed countries,offshoring will have little effect on wage levels because it will have only a small impact on overall employment in those countries in the occupations we analyzed. Consider the impact in the United States. Over the past 30 years, the United States has experienced an 11 percentage point decline in manufacturing jobs, but wages have remained stable. By comparison, we estimate that a total of 9 percent of jobs in services in the United States could theoretically be performed remotely. However, it is unlikely that all these potentially transferable jobs will move offshore over the next thirty years because of the considerable barriers to offshoring detailed in the first report in this series.7 Assuming that half the potentially transferable service jobs—a more realistic estimate, although still high—are actually relocated offshore over that period, the resulting job turnover would be around 225,000 jobs per year— or 1–2 percent of the 16 million jobs created8 per year in the U.S. economy. IMPLICATIONS FOR COMPANIES AND COUNTRIES Implications for companies A variety of company needs meets a variety of country strengths. One major lesson from our evaluation of labor supply is that widely varying company requirements concerning supply locations face widely varying characteristics among potential supply countries. This implies there is no fixed ranking of supply countries: different companies will rationally choose different countries as their optimal location. For companies assigning more weight to cost reduction than any other criterion, then locations with the lowest wage costs—India, the Philippines, and China—will rank as most attractive. However, for companies with special environment or infrastructure requirements, or offshoring activities that go beyond IT support or call centers, other locations will be worth considering. Careful selection of locations will become more important as more supply countries come into the market. This also suggests that more and more locations can and will participate as sources of supply in the global labor market 7 The Emerging Global Labor Market. Part I-Demand for Offshore Talent in Services. Available at www.mckinsey.com/mgi. 8 Douglas Brown and Scott Wilson The Black Book of Outsourcing: How to Manage the Changes, Challenges and Opportunities. Wiley, 2004. 51
  • 52.
    in the future.Companies that simply "follow the leader" to popular supply locations have already caused—and experienced—growing wages and high attrition rates in several city labor markets. As more and more countries come into the market, companies will find an analytical approach to selecting an offshore location increasingly helpful for avoiding the negative effects of agglomeration. This approach needs to be complemented by an evaluation of the supply of suitable labor (see "The Supply of Offshore Talent in Services" for detailed recommendations on evaluating supply), but also the evolution of demand from other companies seeking talent in each potential location Using vendors can reduce stickiness. An offshoring company should consider using a vendor in locations where wages are accelerating quickly, as the generally reduced "stickiness" of vendor contracts can allow the company to shift more easily to a more favorable location if wages in the first one rise too high. However, companies should check whether this comparative freedom of movement remains when the additional cost of vendor margins, the length of the contractual commitment, and any cost increase provisions in the contract are taken into account. Implications for low-wage countries Many countries can compete successfully on the supply side of the market. Since there is no general, fixed ranking of offshoring locations from the demand perspective, there is no preordained set of "winners and losers" on the supply side. Individual countries seeking to attract offshoring investment should target those companies and sectors whose requirements most closely match what the country can already offer, and then hone their attractive features. They might choose to highlight or improve one particular area to differentiate their country from other locations. This strategy depends on supply countries forming a clear understanding of their potentially attractive features and which sectors or companies might favor them. Improving a country's attractiveness as an offshoring location will take time and effort. Improving a country's attractiveness as an offshoring location is a long term endeavour for policy-makers, since several important criteria affecting companies' location decisions are either largely beyond their control (labor cost) or are cultural as much as policy-driven (the business environment). They will 52
  • 53.
    also be competingagainst other countries following the same strategy. But since several countries have a similar profile of overall location costs, it is all the more important for individual countries to nurture areas of distinctiveness. High-priority areas can be improved even in the mid-term. On the other hand, there are several location cost factors of high priority to almost all companies that policy-makers can improve in the short to mid-term. They can reduce government bureaucracy, establish industry associations, make their taxation schemes more competitive relative to similar supply countries, improve laws protecting intellectual property and enforce them better, and strengthen the infrastructure of their dedicated "offshoring parks." Furthermore, our interviews suggest that smaller low-wage countries will find marketing their offer is itself a powerful tool for improving their attractiveness: management perceptions of a country and reality sometimes differ, and dedicated country marketing efforts can set them straight. Implications for high-wage countries Displaced service professionals should be retrained for employment in growing sectors of high-wage economies. Service sector workers displaced by offshoring are likely to include a higher percentage of college-educated workers than displaced manufacturing workers. Their higher education levels suggest they may also be more amenable to acquiring new skills through retraining, which could lessen the potential impact of displacement on their earning power. Policy-makers in high-wage countries should collaborate with companies to ensure that retraining programs direct workers toward growing areas of the economy—for example health care. Furthermore, policy-makers should ensure that primary and secondary education responds to the shrinking share of repetitive, "rules-based" jobs in high-wage economies, as a result of both automation and offshoring.9 The more flexible graduates the education system produces, with strong mathematical, problem solving and teamwork skills, the more adaptable they will be to an ever-changing, innovative economy. 9 Frank Levy and Richard Munrane, "How Computers are Creating the Next Job Market." Princeton University Press, Princeton, NJ, 2004. 53
  • 54.
    Graduates should beequipped to work effectively with their peers in low-wage economies. Finally, policy-makers and educational institutions in high-wage countries should equip their graduates to work effectively with their peers in today's low-wage countries. In Europe, for example, those countries and companies that encourage their graduates to look for opportunities to the east, with appropriate language training, funded exchange programs and internships, will be best placed to benefit from the talent pool represented by new EU members, such as Hungary, the Czech Repubic, and Poland and by emerging markets in Asia. 54
  • 55.
    Constructing an AnalyticalApproach to Location Selection An analytical approach to selecting offshoring locations allows us to analyze preferences on a more general basis. Our experience and our interview base suggest the most important general location criteria are cost, quality of infrastructure, vendor landscape, risk profile, environment and market potential. Each general criterion comprises several sub-criteria: Cost includes labor cost, infrastructure cost, and corporate tax. Within infrastructure cost, telecom, real estate, and power supply were selected as representative measures. Market potential includes both domestic market potential, measured by size and growth of GDP and access to attractive nearby markets. A , company would rank market potential highly if it aimed to use a global resourcing location partly to enter or grow its share of an offshore market. Environment consists of government support, the business and living environment, and the convenience of doing business. Risk profile comprises disruptive events, security risks, regulatory risks, country investment risks, and data protection risks. Vendor landscape is based on available information on the IT/BPO market size and vendors in each of our countries. Note that this category could be made more specific to the process in question (e.g. pharmaceutical R&D) if it were being used to guide a company's decision for certain activity. However, for the purposes of this higher level model, we rely on general measures. Quality of infrastructure is based on measures of telecom/network service infrastructure quality and real estate availability. Note that companies can place their own importance weights on each criterion and sub-criterion, resulting in different overall location rankings. Additionally, some criteria depend on the current "home" country from which the activity will be offshored. For example, if the United States is the home country, the time difference to India will be different than if Germany were the home country. Companies should take a forward-looking view of LCI— especially with respect to determining future wage growth. Implicit in this forward-looking wage analysis is an assessment of the supply and demand situation for the most important occupations to be hired. 55
  • 57.
    McKinsey Global Institute 05/06/15 Copyright© McKinsey & Company www.mckinsey.com/knowledge/mgi Design by New Media, McKinsey & Company, Sydney