Download free for 30 days
Sign in
Upload
Language (EN)
Support
Business
Mobile
Social Media
Marketing
Technology
Art & Photos
Career
Design
Education
Presentations & Public Speaking
Government & Nonprofit
Healthcare
Internet
Law
Leadership & Management
Automotive
Engineering
Software
Recruiting & HR
Retail
Sales
Services
Science
Small Business & Entrepreneurship
Food
Environment
Economy & Finance
Data & Analytics
Investor Relations
Sports
Spiritual
News & Politics
Travel
Self Improvement
Real Estate
Entertainment & Humor
Health & Medicine
Devices & Hardware
Lifestyle
Change Language
Language
English
Español
Português
Français
Deutsche
Cancel
Save
EN
Uploaded by
Javier Gonzalez
320 views
INSEAD MBA Project - Nortel BU Analysis Appendix A
INSEAD MBA Project. NORTEL BU Analysis
Leadership & Management
◦
Read more
1
Save
Share
Embed
Embed presentation
Download
Download to read offline
1
/ 5
2
/ 5
3
/ 5
4
/ 5
5
/ 5
More Related Content
PDF
Anexo Decreto vino y mosto
by
Eduardo Nelson German
PDF
MatLab certifications
by
Marco Di Bartolo
PDF
Situacioni i furnitoreve
by
Self-employed
PDF
Situacioni i klienteve
by
Self-employed
PDF
Tim rogers polk_aims dmadetroit_final
by
dmadetroit
PDF
INSEAD MBA Project - Nortel BU Analysis
by
Javier Gonzalez
PDF
AIMS2012 Todd Stainbrook
by
dmadetroit
PPTX
AMMS Technology Orientation 2014
by
missrioux
Anexo Decreto vino y mosto
by
Eduardo Nelson German
MatLab certifications
by
Marco Di Bartolo
Situacioni i furnitoreve
by
Self-employed
Situacioni i klienteve
by
Self-employed
Tim rogers polk_aims dmadetroit_final
by
dmadetroit
INSEAD MBA Project - Nortel BU Analysis
by
Javier Gonzalez
AIMS2012 Todd Stainbrook
by
dmadetroit
AMMS Technology Orientation 2014
by
missrioux
Viewers also liked
PPTX
Wequest PD WolfTek
by
missrioux
PDF
D ast51 i
by
drakesterling
PPTX
Wiki - Thing 21
by
missrioux
PPTX
Gsj11 bcn fr_keynote_aldo
by
Gsj Barcelona
PPTX
Controversias en enfermedad celiaca.
by
Nombre Apellidos
PPS
Ly ruou mung qkt
by
Quyet Thoa
PPTX
Traumatismos y urgencias oftalmólogicas
by
Nombre Apellidos
PDF
The power of marketing metrics proving marketing's value to the organization ...
by
dmadetroit
PPT
Vacunación meningo b
by
Nombre Apellidos
PPT
Urgencias oftalmologicas pediatria[1]
by
Nombre Apellidos
PDF
Ed seminar creating a strategy - robinson - session3
by
dmadetroit
PPTX
Sistema de protección infantil
by
Nombre Apellidos
PPTX
Have got.ppt
by
isvego
PPTX
Starter1
by
isvego
PDF
Implications of 4G Deployments (MEF for MPLS World Congress Ethernet Wholesa...
by
Javier Gonzalez
Wequest PD WolfTek
by
missrioux
D ast51 i
by
drakesterling
Wiki - Thing 21
by
missrioux
Gsj11 bcn fr_keynote_aldo
by
Gsj Barcelona
Controversias en enfermedad celiaca.
by
Nombre Apellidos
Ly ruou mung qkt
by
Quyet Thoa
Traumatismos y urgencias oftalmólogicas
by
Nombre Apellidos
The power of marketing metrics proving marketing's value to the organization ...
by
dmadetroit
Vacunación meningo b
by
Nombre Apellidos
Urgencias oftalmologicas pediatria[1]
by
Nombre Apellidos
Ed seminar creating a strategy - robinson - session3
by
dmadetroit
Sistema de protección infantil
by
Nombre Apellidos
Have got.ppt
by
isvego
Starter1
by
isvego
Implications of 4G Deployments (MEF for MPLS World Congress Ethernet Wholesa...
by
Javier Gonzalez
INSEAD MBA Project - Nortel BU Analysis Appendix A
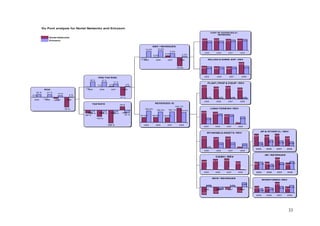
1.
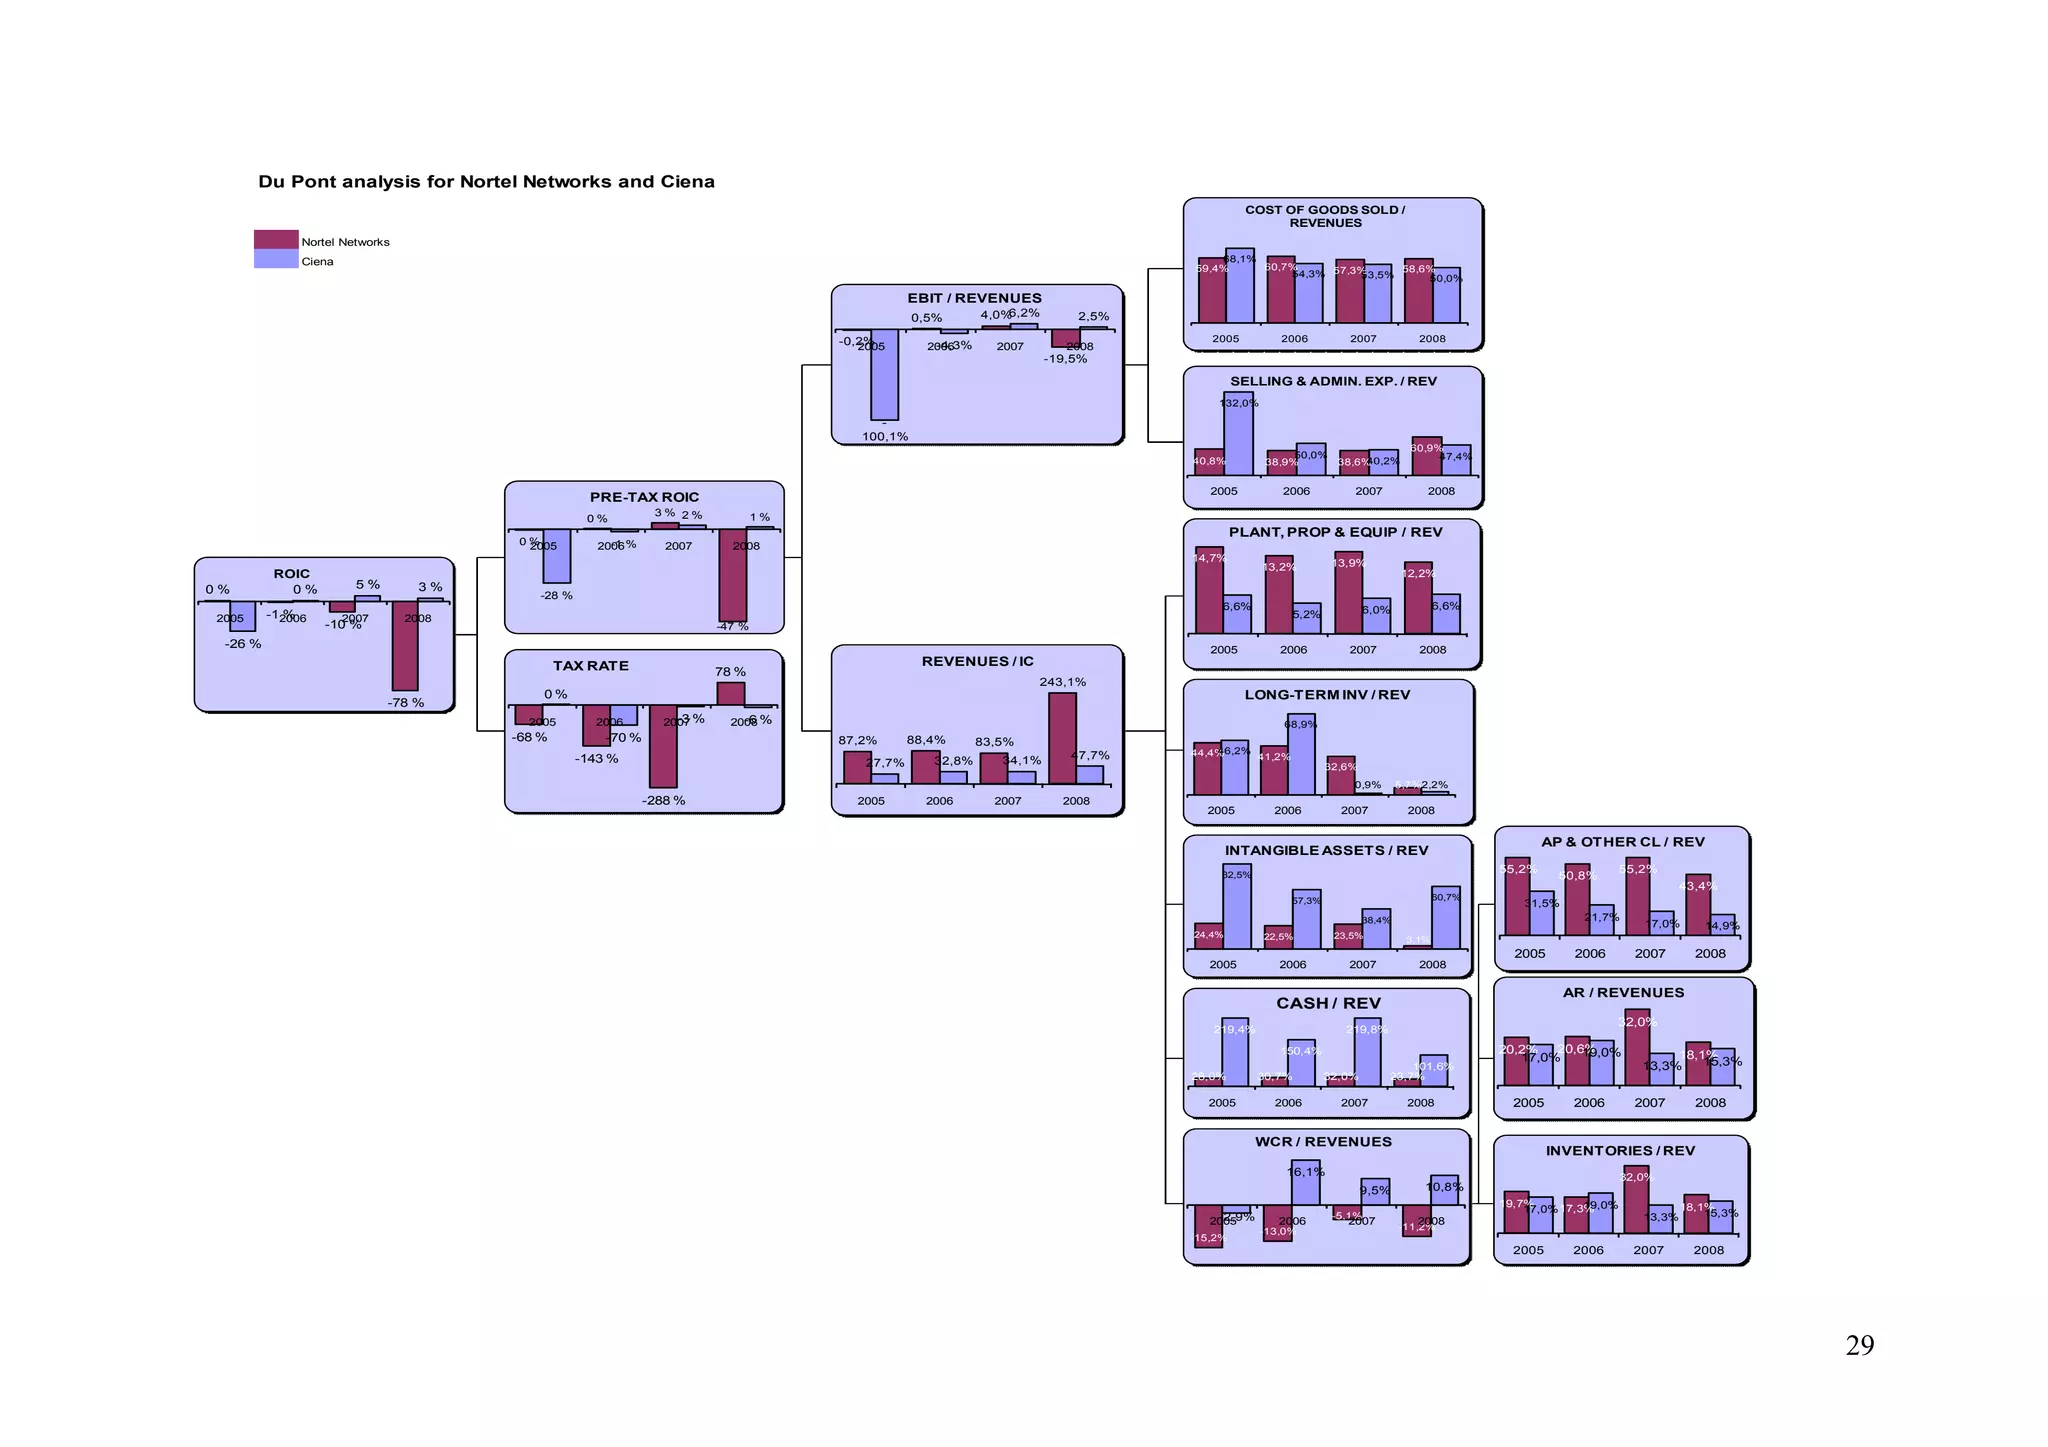
29 Du Pont
analysis for Nortel Networks and Ciena Nortel Networks Ciena 0 % ROIC -1 % -10 % -78 % -26 % 0 % 5 % 3 % 2005 2006 2007 2008 0 % PRE-TAX ROIC 0 % 3 % -47 % -28 % -1 % 2 % 1 % 2005 2006 2007 2008 TAX RATE 2005 2006 20-037 % 20-068 % -68 % -143 % -288 % 78 % 0 % -70 % -0,2% EBIT / REVENUES 0,5% 4,0% -19,5% - 100,1% -4,3% 6,2% 2,5% 2005 2006 2007 2008 REVENUES / IC 87,2% 88,4% 83,5% 243,1% 27,7% 32,8% 34,1% 47,7% 2005 2006 2007 2008 COST OF GOODS SOLD / 68,1% REVENUES 59,4% 60,7% 57,3% 58,6% 54,3% 53,5% 50,0% 2005 2006 2007 2008 SELLING & ADMIN. EXP. / REV 40,8% 38,9% 38,6% 60,9% 132,0% 50,0% 40,2% 47,4% 2005 2006 2007 2008 PLANT, PROP & EQUIP / REV 13,2% 13,9% 12,2% 6,6% 5,2% 6,0% 6,6% 2005 2006 2007 2008 LONG-TERM INV / REV 14,7% 44,4% 41,2% 32,6% 5,7% 46,2% 68,9% 0,9% 2,2% 2005 2006 2007 2008 INTANGIBLE ASSETS / REV 82,5% 57,3% 38,4% 24,4% 22,5% 23,5% 3,1% 60,7% 2005 2006 2007 2008 AP & OTHER CL / REV 55,2% 50,8% 55,2% 43,4% 21,7% 17,0% 14,9% 2005 2006 2007 2008 AR / REVENUES 31,5% 20,2% 20,6% 32,0% 17,0% 19,0% 18,1% 13,3% 15,3% 2005 2006 2007 2008 219,4% CASH / REV 150,4% 219,8% 101,6% 28,0% 30,7% 32,0% 23,7% 2005 2006 2007 2008 WCR / REVENUES -15,2% -13,0% -5,1% -11,2% -2,9% 16,1% 9,5% 10,8% 2005 2006 2007 2008 INVENTORIES / REV 19,7% 17,3% 32,0% 17,0% 19,0% 18,1% 13,3% 15,3% 2005 2006 2007 2008
2.
AP & OTHER
CL / REV 74,8% 57,1% 43,4% 2005 2006 2007 2008 61,6% 61,6% 30 Du Pont analysis for Nortel Networks and NSN Nortel Networks NSN 0 % -1 % 2005 2006 2007 20-028 % -10 % -78 % 0 % 0 % -10 % ROIC 0 % PRE-TAX ROIC 0 % 3 % 2005 2006 2007 200-38 % -47 % 0 % 0 % -16 % -68 % TAX RATE -143 % -288 % 78 % 0 % 0 % 2005 2006 20-0279 % 20-0287 % -0,2% EBIT / REVENUES 0,5% 4,0% 2005 2006 2007 20-028,0% -19,5% 0,0% 0,0% -12,3% REVENUES / IC 87,2% 88,4% 83,5% 243,1% 0,0% 0,0% 129,2% 176,2% 2005 2006 2007 2008 COST OF GOODS SOLD / REVENUES 59,4% 60,7% 57,3% 58,6% 0,0% 0,0% 74,2% 71,1% 2005 2006 2007 2008 SELLING & ADMIN. EXP. / REV 40,8% 38,9% 38,6% 60,9% 0,0% 0,0% 38,1% 30,9% 2005 2006 2007 2008 PLANT, PROP & EQUIP / REV 13,2% 13,9% 12,2% 0,0% 0,0% 6,9% 2005 2006 2007 2008 LONG-TERM INV / REV 14,7% 44,4% 41,2% 32,6% 5,0% 16,5% 0,0% 0,0% 12,7% 5,7% 2005 2006 2007 2008 INTANGIBLE ASSETS / REV 30,6% 24,4% 22,5% 23,5% 0,0% 0,0% 3,1% 21,2% 2005 2006 2007 2008 55,2% 50,8% 55,2% 0,0% 0,0% AR / REVENUES 20,2% 20,6% 74,3% 32,0% 0,0% 0,0% 18,1% 2005 2006 2007 2008 CASH / REV 28,0% 30,7% 32,0% 23,7% 0,0% 0,0% 10,4% 4,9% 2005 2006 2007 2008 -15,2% WCR / REVENUES -13,0% -5,1% -11,2% 0,0% 0,0% 11,1% 12,9% 2005 2006 2007 2008 INVENTORIES / REV 19,7% 17,3% 74,3% 32,0% 0,0% 0,0% 18,1% 2005 2006 2007 2008
3.
AP & OTHER
CL / REV 35,4% 36,6% 36,0% 31,6% 31 Du Pont analysis for Nortel Networks and Cisco Nortel Networks Cisco 14 % 11 % 12 % 12 % 0 % -1 % 2005 2006 2007 2008 -10 % -78 % ROIC 0 % 18 % 14 % 14 % 13 % 0 % 3 % 2005 2006 2007 2008 -47 % PRE-TAX ROIC -68 % TAX RATE -143 % -288 % 78 % 20-0259 % 20-0267 % 20-0272 % 20-0281 % -0,2% EBIT / REVENUES 0,5% 4,0% -19,5% 29,9% 24,6% 24,7% 23,9% 2005 2006 2007 2008 REVENUES / IC 87,2% 88,4% 83,5% 243,1% 60,3% 56,2% 55,4% 54,6% 2005 2006 2007 2008 COST OF GOODS SOLD / REVENUES 59,4% 60,7% 57,3% 58,6% 32,8% 34,2% 36,3% 35,9% 2005 2006 2007 2008 SELLING & ADMIN. EXP. / REV 40,8% 38,9% 38,6% 60,9% 37,3% 41,3% 39,1% 40,2% 2005 2006 2007 2008 PLANT, PROP & EQUIP / REV 13,2% 13,9% 12,2% 13,4% 12,1% 11,1% 10,5% 2005 2006 2007 2008 LONG-TERM INV / REV 14,7% 44,4% 41,2% 32,6% 29,1% 42,1% 10,9% 9,9% 5,7% 2005 2006 2007 2008 INTANGIBLE ASSETS / REV 24,4% 22,5% 23,5% 3,1% 23,6% 40,0% 42,0% 36,6% 2005 2006 2007 2008 55,2% 50,8% 55,2% 43,4% 2005 2006 2007 2008 AR / REVENUES 20,2% 20,6% 32,0% 18,1% 8,6% 11,6% 11,4% 9,7% 2005 2006 2007 2008 CASH / REV 64,7% 62,5% 63,8% 66,4% 28,0% 30,7% 32,0% 23,7% 2005 2006 2007 2008 2005 2006 2007 2008 -15,2% -13,0% -5,1% -11,2% -21,2% -20,2% -20,8% -18,8% WCR / REVENUES INVENTORIES / REV 19,7% 17,3% 32,0% 18,1% 8,9% 11,6% 11,4% 9,7% 2005 2006 2007 2008
4.
AP & OTHER
CL / REV 76,6% 82,6% 51,1% 57,5% 55,2% 50,8% 55,2% 43,4% 2005 2006 2007 2008 AR / REVENUES 23,1% 25,4% 32 Du Pont analysis for Nortel Networks and Alcatel Nortel Networks Alcatel-Lucent 0 % -1 % 2005 2006 2007 2008 -10 % -78 % 8 % 0 % -13 % -27 % ROIC 0 % 0 % 3 % 2005 2006 2007 2008 -47 % 8 % 0 % -17 % -30 % PRE-TAX ROIC -68 % TAX RATE -143 % -288 % 78 % -14 % -16 % 2 % 3 % 2005 2006 2007 2008 -0,2% 0,5% 4,0% 2005 2006 2007 2008 -19,5% 9,2% -1,0% -23,0% -30,6% EBIT / REVENUES REVENUES / IC 87,2% 88,4% 83,5% 243,1% 91,3% 38,7% 73,4% 97,2% 2005 2006 2007 2008 59,4% COST OF GOODS SOLD / REVENUES 60,7% 57,3% 58,6% 57,3% 61,7% 59,0% 58,3% 2005 2006 2007 2008 SELLING & ADMIN. EXP. / REV 40,8% 38,9% 38,6% 60,9% 33,5% 39,3% 64,0% 72,3% 2005 2006 2007 2008 PLANT, PROP & EQUIP / REV 14,8% 13,2% 13,9% 12,2% 9,8% 7,9% 7,9% 2005 2006 2007 2008 LONG-TERM INV / REV 14,7% 44,4% 41,2% 32,6% 5,7% 30,3% 61,2% 62,3% 41,2% 2005 2006 2007 2008 INTANGIBLE ASSETS / REV 40,5% 133,0% 64,0% 24,4% 22,5% 23,5% 3,1% 39,8% 2005 2006 2007 2008 31,6% 20,2% 20,6% 32,0% 18,8% 18,1% 2005 2006 2007 2008 CASH / REV 28,0% 30,7% 32,0% 23,7% 45,4% 48,8% 30,7% 28,7% 2005 2006 2007 2008 2005 2006 2007 2008 -15,2% -13,0% -5,1% -11,2% -33,8% -32,6% -15,7% -19,2% WCR / REVENUES INVENTORIES / REV 19,7% 17,3% 32,0% 18,1% 30,1% 31,6% 23,1% 25,4% 2005 2006 2007 2008
5.
AP & OTHER
CL / REV 43,4% 28,1% 24,3% 20,8% 2005 2006 2007 2008 33 Du Pont analysis for Nortel Networks and Ericsson Nortel Networks Ericsson 0 % ROIC 0 % -1 % -10 % -78 % 22 % 21 % 13 % 2 % 2005 2006 2007 2008 PRE-TAX ROIC 0 % 3 % -47 % 28 % 27 % 17 % 4 % 2005 2006 2007 2008 2005 2006 2007 2008 -68 % -143 % -288 % 78 % -26 % -24 % -28 % -61 % TAX RATE -0,2% EBIT / REVENUES 0,5% 4,0% -19,5% 14,0% 14,9% 9,4% 2,3% 2005 2006 2007 2008 REVENUES / IC 87,2% 88,4% 83,5% 243,1% 198,5% 180,2% 184,1% 172,8% 2005 2006 2007 2008 COST OF GOODS SOLD / REVENUES 59,4% 60,7% 57,3% 58,6% 48,0% 47,7% 53,5% 57,0% 2005 2006 2007 2008 SELLING & ADMIN. EXP. / REV 40,8% 38,9% 38,6% 60,9% 38,0% 37,4% 37,2% 40,7% 2005 2006 2007 2008 PLANT, PROP & EQUIP / REV 13,2% 13,9% 12,2% 0,7% 0,6% 1,3% 1,3% 2005 2006 2007 2008 LONG-TERM INV / REV 14,7% 44,4% 41,2% 32,6% 5,7% 21,3% 35,3% 32,8% 25,0% 2005 2006 2007 2008 INTANGIBLE ASSETS / REV 24,4% 22,5% 23,5% 11,6% 12,0% 1,0% 3,1% 9,5% 2005 2006 2007 2008 55,2% 50,8% 55,2% AR / REVENUES 17,6% 20,2% 20,6% 32,0% 20,1% 18,1% 14,9% 19,4% 22,3% 2005 2006 2007 2008 CASH / REV 28,0% 30,7% 32,0% 23,7% 0,2% 0,2% 0,3% 0,7% 2005 2006 2007 2008 -15,2% WCR / REVENUES -13,0% -5,1% -11,2% 3,4% -5,0% 2,3% 8,9% 2005 2006 2007 2008 INVENTORIES / REV 19,7% 17,3% 32,0% 18,1% 12,5% 14,9% 19,4% 22,3% 2005 2006 2007 2008
Download


![Urgencias oftalmologicas pediatria[1]](https://cdn.slidesharecdn.com/ss_thumbnails/urgenciasoftalmologicaspediatria1-140519080328-phpapp01-thumbnail.jpg?width=640&height=640&fit=bounds)


