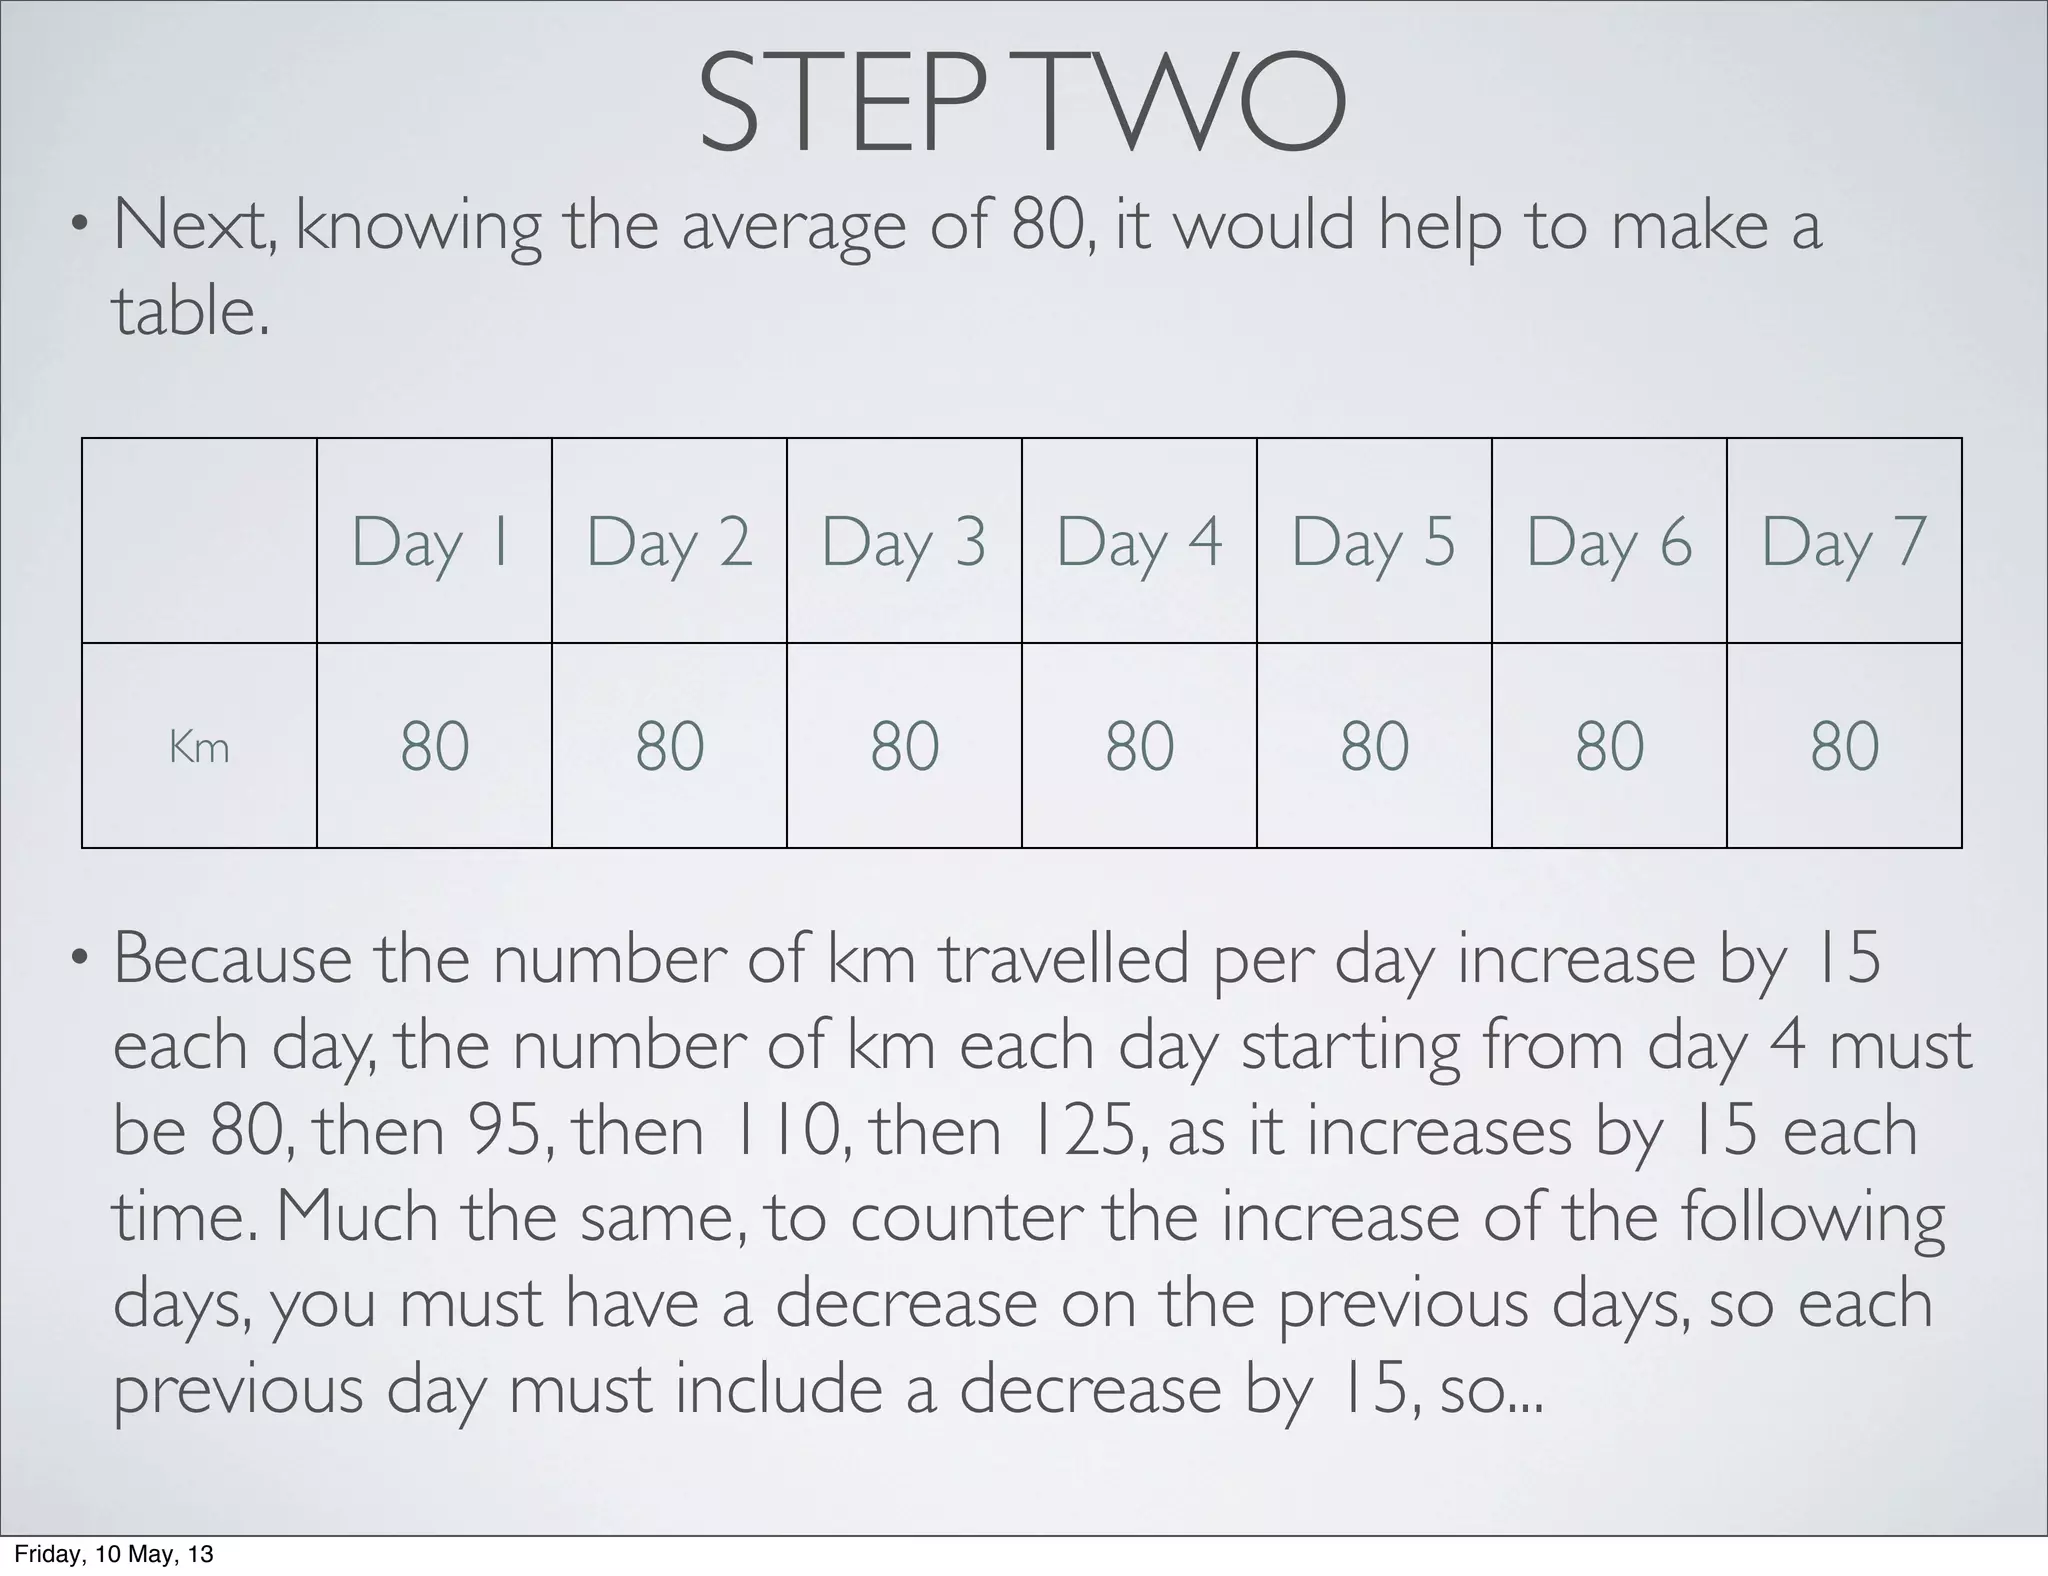
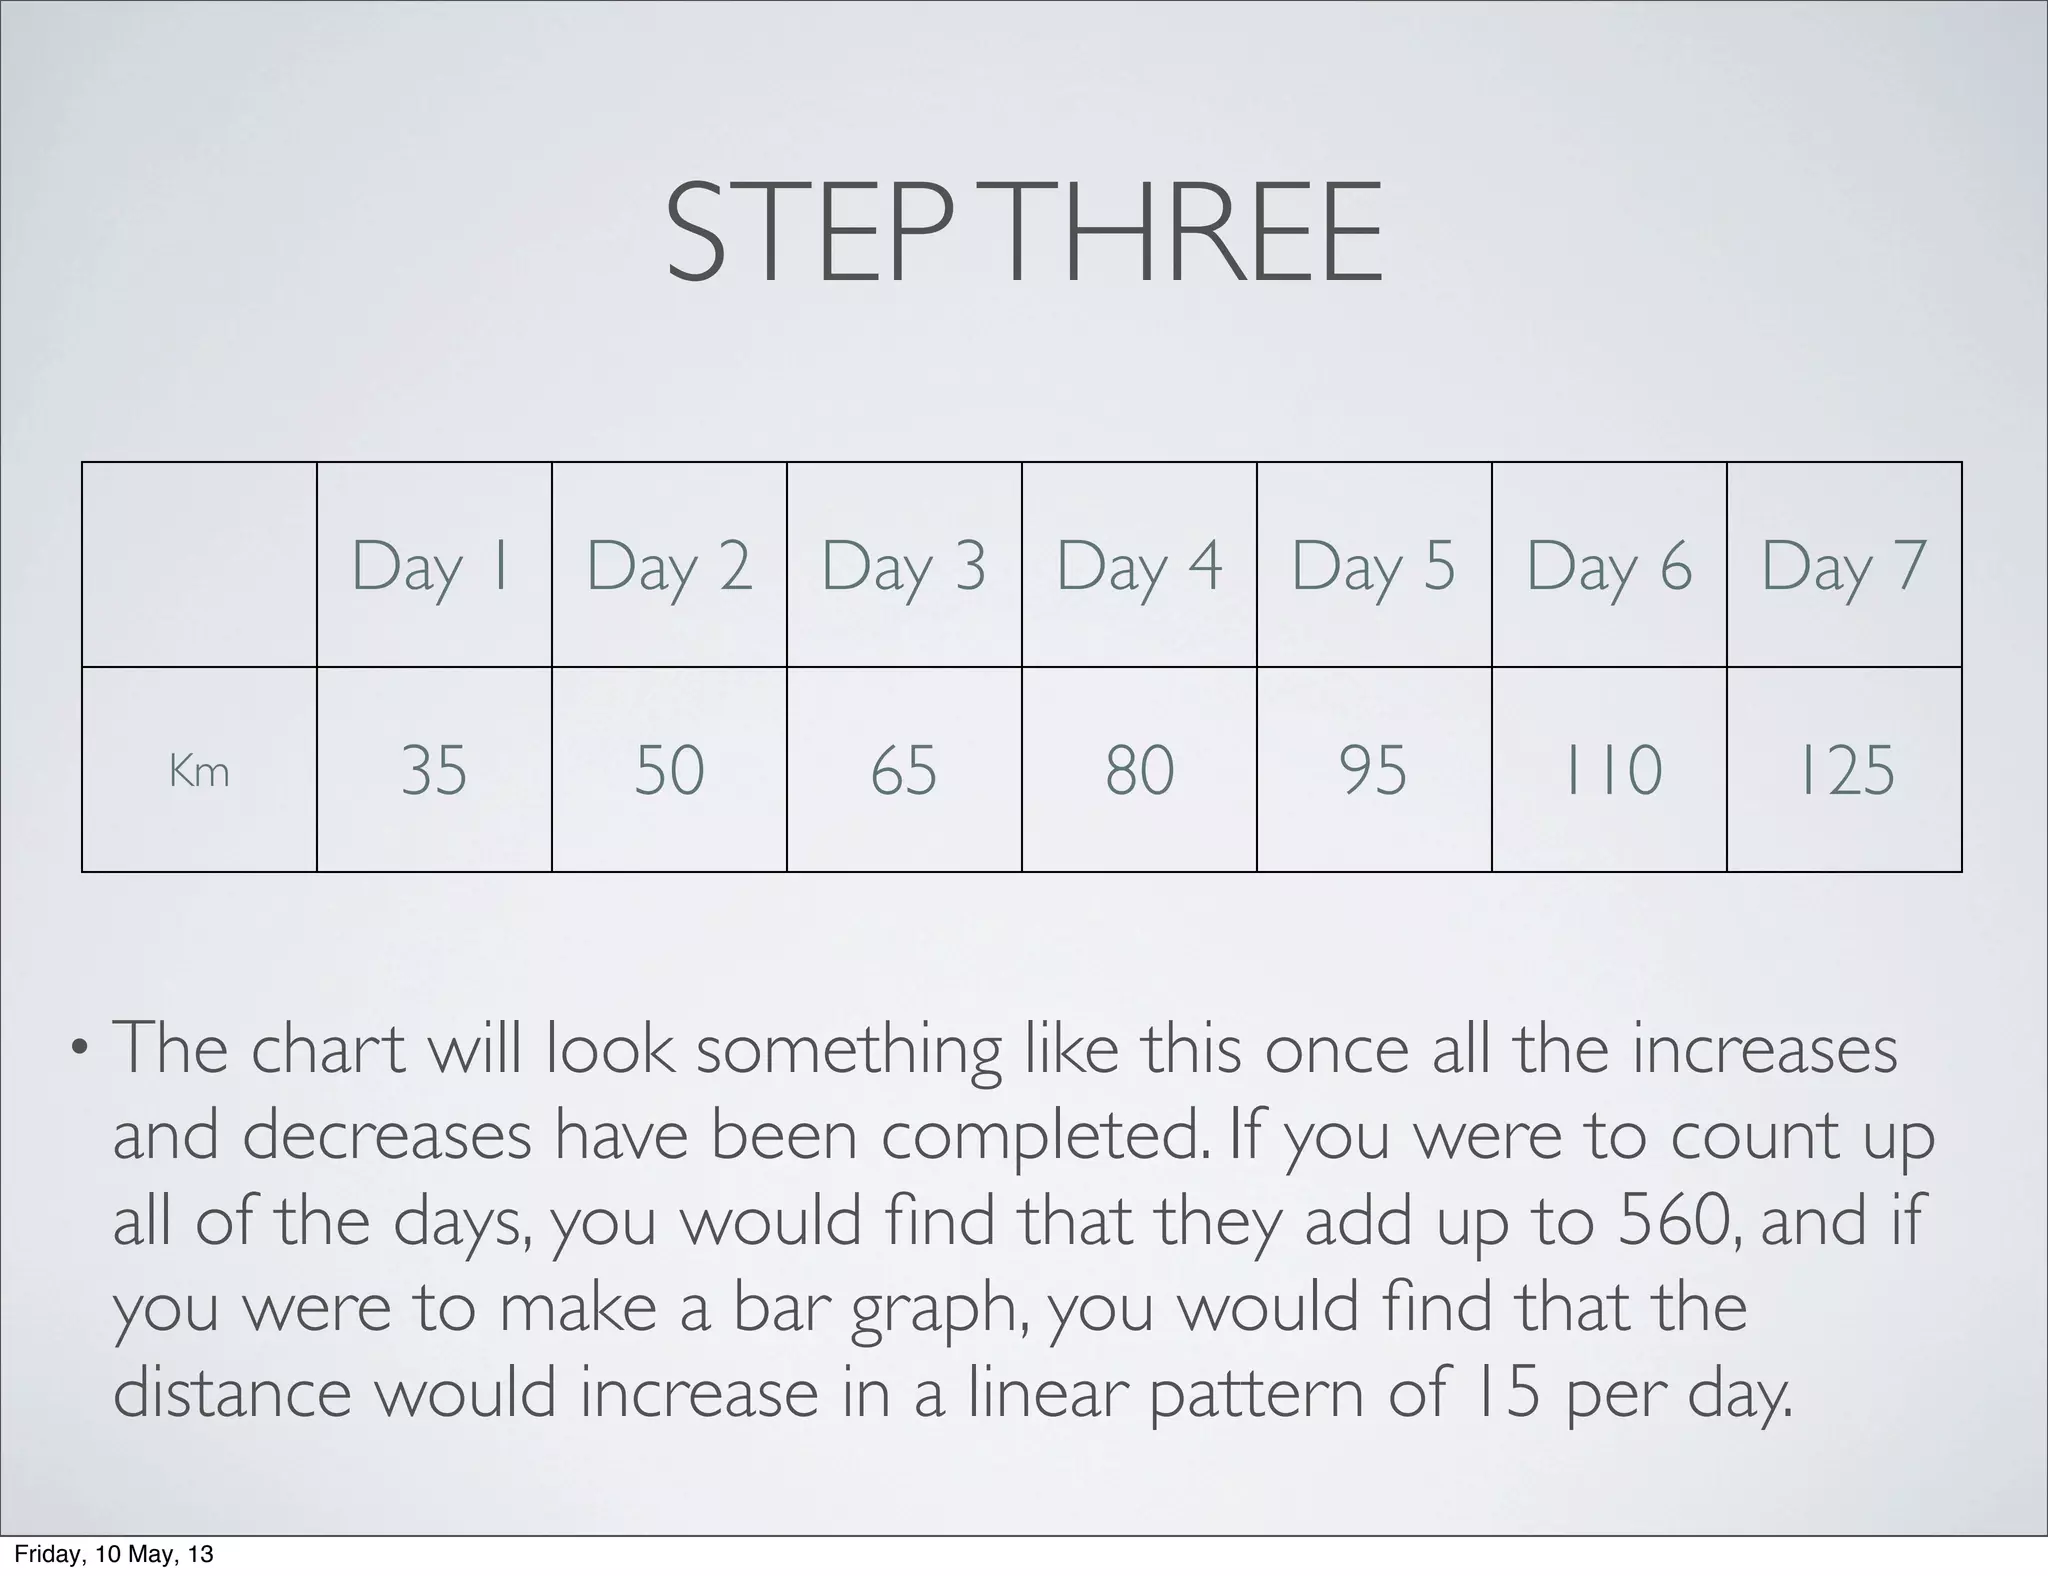
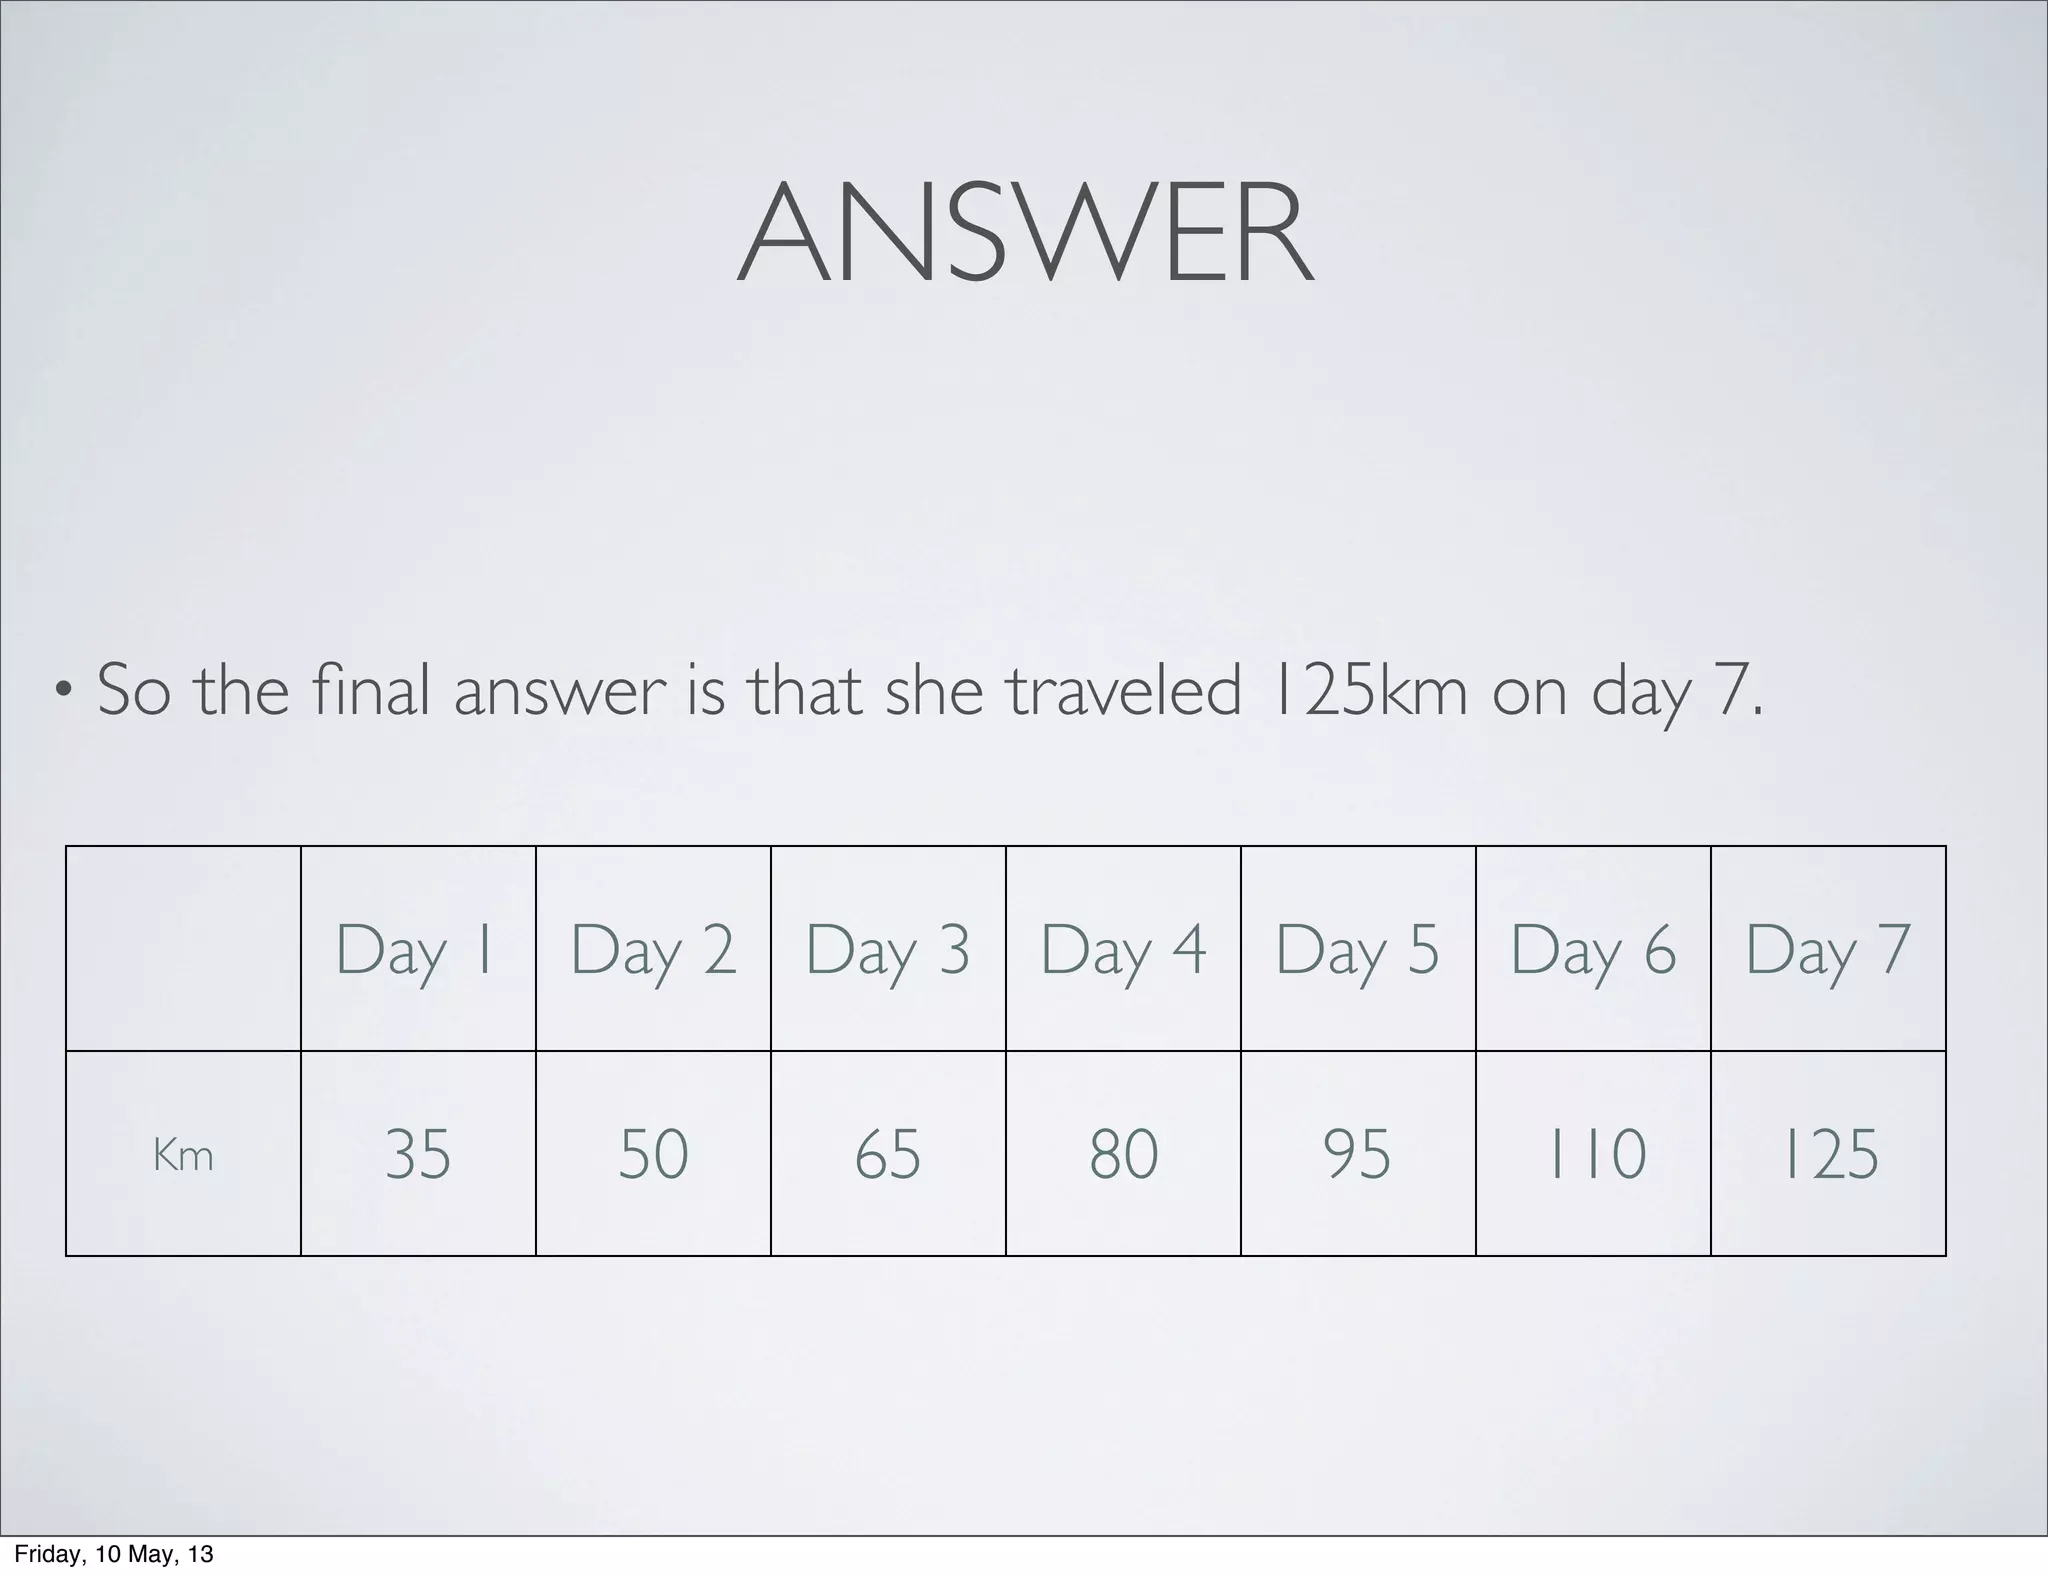
ROADTRIP
By, Nicholas, Michael B. and Justin
Friday, 10 May, 13
PROBLEM
Friday, 10 May, 13
STEP ONE
• First, you need to find the average distance per day, by dividing
the total by the number of days, making 80.
Friday, 10 May, 13
STEPTWO
• Next, knowing the average of 80, it would help to make a
table.
• Because the number of km travelled per day increase by 15
each day, the number of km each day starting from day 4 must
be 80, then 95, then 110, then 125, as it increases by 15 each
time. Much the same, to counter the increase of the following
days, you must have a decrease on the previous days, so each
previous day must include a decrease by 15, so...
Day 1 Day 2 Day 3 Day 4 Day 5 Day 6 Day 7
Km 80 80 80 80 80 80 80
Friday, 10 May, 13
STEPTHREE
• The chart will look something like this once all the increases
and decreases have been completed. If you were to count up
all of the days, you would find that they add up to 560, and if
you were to make a bar graph, you would find that the
distance would increase in a linear pattern of 15 per day.
Day 1 Day 2 Day 3 Day 4 Day 5 Day 6 Day 7
Km 35 50 65 80 95 110 125
Friday, 10 May, 13
ANSWER
• So the final answer is that she traveled 125km on day 7.
Day 1 Day 2 Day 3 Day 4 Day 5 Day 6 Day 7
Km 35 50 65 80 95 110 125
Friday, 10 May, 13

Math Investigation

  • 1.
    ROADTRIP By, Nicholas, MichaelB. and Justin Friday, 10 May, 13
  • 2.
  • 3.
    STEP ONE • First,you need to find the average distance per day, by dividing the total by the number of days, making 80. Friday, 10 May, 13
  • 4.
    STEPTWO • Next, knowingthe average of 80, it would help to make a table. • Because the number of km travelled per day increase by 15 each day, the number of km each day starting from day 4 must be 80, then 95, then 110, then 125, as it increases by 15 each time. Much the same, to counter the increase of the following days, you must have a decrease on the previous days, so each previous day must include a decrease by 15, so... Day 1 Day 2 Day 3 Day 4 Day 5 Day 6 Day 7 Km 80 80 80 80 80 80 80 Friday, 10 May, 13
  • 5.
    STEPTHREE • The chartwill look something like this once all the increases and decreases have been completed. If you were to count up all of the days, you would find that they add up to 560, and if you were to make a bar graph, you would find that the distance would increase in a linear pattern of 15 per day. Day 1 Day 2 Day 3 Day 4 Day 5 Day 6 Day 7 Km 35 50 65 80 95 110 125 Friday, 10 May, 13
  • 6.
    ANSWER • So thefinal answer is that she traveled 125km on day 7. Day 1 Day 2 Day 3 Day 4 Day 5 Day 6 Day 7 Km 35 50 65 80 95 110 125 Friday, 10 May, 13