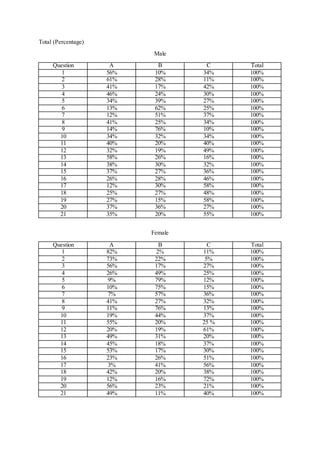
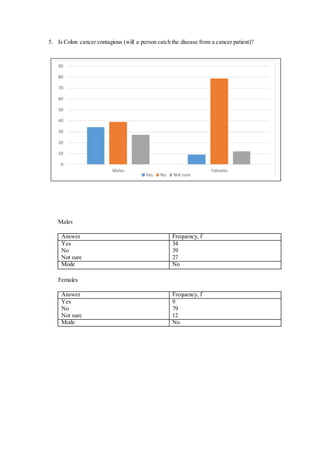
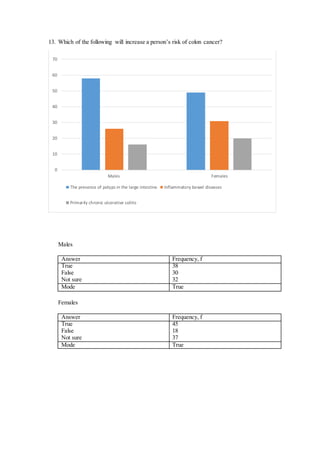
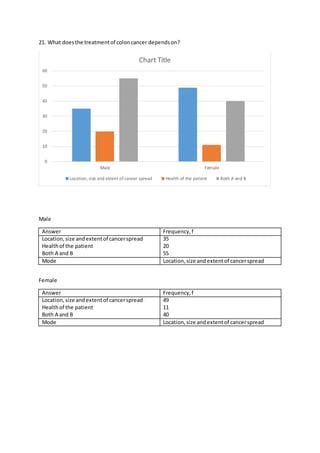
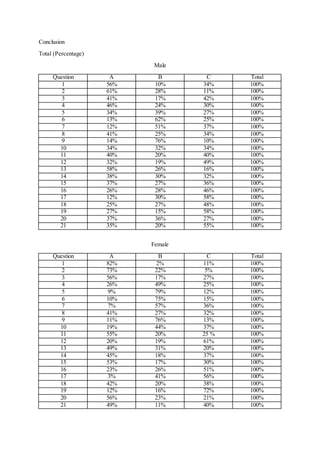
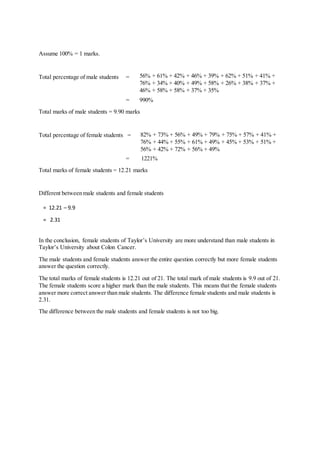
SCHOOL OF ARCHITECTURE, BUILDING AND
DESIGN
FOUNDATION IN NATURAL BUILD ENVIRONMENT
AUGUST 2014
MODULE: MATHEMATICS [MTH10304]
ASSIGNMENT: STATISTICS
LECTURER: MS ANN SEE PENG
SUBMISSION DATE: 1 JUNE 2015
Group member:
Ee Yun Shan 0319990
Lim Zia Huei 0321031
Nurafiqah Zariful 0321196
Nabila Hanim 0321368
Content
No. Title Page
1. Introduction
2. Objective
3. Methodology
4. Survey Forms (Empty)
5. Survey Forms (Answer)
6. Survey Forms (Responded)
7. Analysis
8. Conclusion
Introduction
A survey is a detailed study of a market or an area to gather data on attitudes, opinions,
understanding level etc. It have been used in diversity of forms in most places such as
hospitals, schools, hotels, restaurants and more. It enables us to improve or gain knowledge
upon other people’s understanding or opinion.
Regarding this assignment, we are required to do a survey about one of the chronic diseases
in Malaysia. When we are doing the research about the chronic diseases, we found that colon
cancer is the leading cause of death by cancer in Malaysia mainly due to a lack of urgency
among many people who are at greater risk from developing this cancer yet fail to seek
treatment until it is too late. They do not have much knowledge about this disease. Due to
this, we are more curious about this disease compare to other diseases. Hence, we decided to
do a survey about this disease.
Objective
The survey’s primary objective is to identify between two genders of students that have more
understanding ability on specific chronic disease in Malaysia. We were to conduct a survey around the
campus and organize a statistical data regarding the response on the two gender upon the survey. This
enables us to be able to calculate statistics in real life and gain knowledge from analysing it, to calculate
and conclude how much that each student and different genders could understand more on specific
disease happen in Malaysia. This enable us to differentiate between the two genders easily by looking
through the survey answers.
Through this project, we not only can improve our techniques in solving statistic questions, we also
can learn more about the chronic diseases in Malaysia. This group project enable us to learn to work
in group. We can practice our leadership skill, communication skill as well as tolerance in this way.
We also learn to be brave when we are trying to distribute the survey form. Learning outcome:
1. To analyse the statistical data based on the survey forms collected and draw
conclusion from the data.
2. To solve problems that involves various mathematical principles.
3. To understand and apply mathematical principles involved.
Methodology
We planned wisely before starting our project. We done our research before choosing a disease. Next,
we do the survey form by choosing suitable questions. After that, we divided our forms equally to be
distributed that was 50 forms per person. Two person will distributed it to the male while the other
two person will distributed it to the male. We decided to choose places that have more people such as
library, e-quarium or classrooms.
Places of interviewing chosen:
The library The classroom
The process of the interviewing
Total (Percentage)
Male
Question A B C Total
1 56 10 34 100
2 61 28 11 100
3 41 17 42 100
4 46 24 30 100
5 34 39 27 100
6 13 62 25 100
7 12 51 37 100
8 41 25 34 100
9 14 76 10 100
10 34 32 34 100
11 40 20 40 100
12 32 19 49 100
13 58 26 16 100
14 38 30 32 100
15 37 27 36 100
16 26 28 46 100
17 12 30 58 100
18 25 27 48 100
19 27 15 58 100
20 37 36 27 100
21 35 20 55 100
Female
Question A B C Total
1 82 2 11 100
2 73 22 5 100
3 56 17 27 100
4 26 49 25 100
5 9 79 12 100
6 10 75 15 100
7 7 57 36 100
8 41 27 32 100
9 11 76 13 100
10 19 44 37 100
11 55 20 25 100
12 20 19 61 100
13 49 31 20 100
14 45 18 37 100
15 53 17 30 100
16 23 26 51 100
17 3 41 56 100
18 42 20 38 100
19 12 16 72 100
20 56 23 21 100
21 49 11 40 100
Total (Percentage)
Male
Question A B C Total
1 56% 10% 34% 100%
2 61% 28% 11% 100%
3 41% 17% 42% 100%
4 46% 24% 30% 100%
5 34% 39% 27% 100%
6 13% 62% 25% 100%
7 12% 51% 37% 100%
8 41% 25% 34% 100%
9 14% 76% 10% 100%
10 34% 32% 34% 100%
11 40% 20% 40% 100%
12 32% 19% 49% 100%
13 58% 26% 16% 100%
14 38% 30% 32% 100%
15 37% 27% 36% 100%
16 26% 28% 46% 100%
17 12% 30% 58% 100%
18 25% 27% 48% 100%
19 27% 15% 58% 100%
20 37% 36% 27% 100%
21 35% 20% 55% 100%
Female
Question A B C Total
1 82% 2% 11% 100%
2 73% 22% 5% 100%
3 56% 17% 27% 100%
4 26% 49% 25% 100%
5 9% 79% 12% 100%
6 10% 75% 15% 100%
7 7% 57% 36% 100%
8 41% 27% 32% 100%
9 11% 76% 13% 100%
10 19% 44% 37% 100%
11 55% 20% 25 % 100%
12 20% 19% 61% 100%
13 49% 31% 20% 100%
14 45% 18% 37% 100%
15 53% 17% 30% 100%
16 23% 26% 51% 100%
17 3% 41% 56% 100%
18 42% 20% 38% 100%
19 12% 16% 72% 100%
20 56% 23% 21% 100%
21 49% 11% 40% 100%
Analysis
1. Colon cancer is the cancer of the large intestine, the lower part of your digestive system.
Males
Answer Frequency, f
True
False
Not sure
56
10
34
Mode True
Females
Answer Frequency, f
True
False
Not sure
82
2
11
Mode True
0
10
20
30
40
50
60
70
80
90
Males Females
TRUE FALSE Not sure
2. Colon cancer can also be called
Males
Answer Frequency, f
Colorectal cancer
Stomach cancer
Thyroid cancer
61
28
11
Mode Colorectal cancer
Females
Answer Frequency, f
Colorectal cancer
Stomach cancer
Thyroid cancer
73
22
5
Mode Colorectal cancer
0
10
20
30
40
50
60
70
80
Males Females
Colorectal cancer Stomach cancer Thyroid cancer
3. Most cases of colon cancer begin as small, non-cancerous clumps of cells called adenomatous
polyps. Over time some of these polyps become colon cancers.
Males
Answer Frequency, f
True
False
Not sure
41
17
42
Mode Not sure
Females
Answer Frequency, f
True
False
Not sure
56
17
27
Mode True
0
10
20
30
40
50
60
Males Females
TRUE FALSE Not sure
4. Do colon polyps and early cancer have any symptoms?
Males
Answer Frequency, f
Yes
No
Not sure
46
24
30
Mode Yes
Females
Answer Frequency, f
Yes
No
Not sure
26
49
25
Mode No
0
10
20
30
40
50
60
Males Females
Yes No Not sure
5. Is Colon cancer contagious (will a person catch the disease from a cancer patient)?
Males
Answer Frequency, f
Yes
No
Not sure
34
39
27
Mode No
Females
Answer Frequency, f
Yes
No
Not sure
9
79
12
Mode No
0
10
20
30
40
50
60
70
80
90
Males Females
Yes No Not sure
6. Will the patients show symptoms immediately after colon cancer present in their bodies?
Males
Answer Frequency, f
Yes
No
Not sure
13
62
25
Mode No
Females
Answer Frequency, f
Yes
No
Not sure
10
75
15
Mode No
0
10
20
30
40
50
60
70
80
Males Females
Yes No Not sure
7. Colon cancer is the ___________-leading cause of cancer deaths in both men and women.
Males
Answer Frequency, f
First
Second
Third
12
51
37
Mode Second
Females
Answer Frequency, f
First
Second
Third
7
57
36
Mode Second
0
10
20
30
40
50
60
Males Females
First Second Third
8. Which group of people has higher risk in affected by colon cancer?
Males
Answer Frequency, f
Men
Women
Not sure
41
25
34
Mode Men
Females
Answer Frequency, f
Men
Women
Not sure
41
27
32
Mode Men
0
5
10
15
20
25
30
35
40
45
Males Females
Men Women Not sure
9. Younger people or older people will have higher risk in affected by colon cancer?
Males
Answer Frequency, f
Younger
Older
Not sure
14
76
10
Mode Older
Females
Answer Frequency, f
Younger
Older
Not sure
11
76
13
Mode Older
0
10
20
30
40
50
60
70
80
Males Females
Younger Older Not sure
10. When is the National Dress in Blue Day?
Males
Answer Frequency, f
First Tuesday of March
First Friday of May
First Friday of March
34
32
34
Mode First Tuesday of March/ First Friday of
March
Females
Answer Frequency, f
First Tuesday of March
First Friday of May
First Friday of March
19
44
37
Mode First Friday of May
0
5
10
15
20
25
30
35
40
45
50
Males Females
First Tuesday of March First Friday of May First Friday of March
11. Will a person has a higher risk of colon cancer if his or her family has a history of having
colon cancer and polyps?
Males
Answer Frequency, f
Yes
No
Not sure
40
20
40
Mode Yes,Not sure
Females
Answer Frequency, f
Yes
No
Not sure
55
20
25
Mode Yes
0
10
20
30
40
50
60
Males Females
Yes No Not sure
12 . Which of the following will increase a person to have a higher risk of colon cancer?
Males
Answer Frequency, f
High calcium diet
High glucose diet
High fat diet
32
19
49
Mode High fat diet
Females
Answer Frequency, f
High calcium diet
High glucose diet
High fat diet
20
19
61
Mode High fat diet
0
10
20
30
40
50
60
70
Males Females
High calcium diet High glucose diet High fat diet
13. Which of the following will increase a person’s risk of colon cancer?
Males
Answer Frequency, f
True
False
Not sure
38
30
32
Mode True
Females
Answer Frequency, f
True
False
Not sure
45
18
37
Mode True
0
10
20
30
40
50
60
70
Males Females
The presence of polyps in the large intestine Inflammatory bowel diseases
Primarily chronic ulcerative colitis
14. The symptoms of colon cancer are similar although sometimes will be slightly different
according to the physical condition of the person.
Males
Answer Frequency, f
True
False
Not sure
58
26
16
Mode True
Females
Answer Frequency, f
True
False
Not sure
49
31
20
Mode True
0
10
20
30
40
50
60
70
Males Females
TRUE FALSE Not sure
15. The symptoms of the colon cancer vary according to where in the large intestine the tumor is
located.
Males
Answer Frequency, f
True
False
Not sure
58
26
16
Mode True
Females
Answer Frequency, f
True
False
Not sure
49
31
20
Mode True
0
10
20
30
40
50
60
Males Females
TRUE FALSE Not sure
16. A person with right-sided cancer will more likely to have partial or complete bowel
obstruction while left-sided cancers will have iron deficiency anemia.
Males
Answer Frequency, f
True
False
Not sure
26
28
46
Mode Not sure
Females
Answer Frequency, f
True
False
Not sure
23
26
51
Mode Not sure
0
10
20
30
40
50
60
Males Females
TRUE FALSE Not sure
17. What isthe mostcommontreatmentforcolon cancer?
.
Male
Answer Frequency,f
By usingmedicine
Chemotherapy
Surgery
12
30
58
Mode Surgery
Female
Answer Frequency,f
By usingmedicine
Chemotherapy
Surgery
3
41
56
Mode Surgery
0
10
20
30
40
50
60
70
Male Female
Chart Title
By using medicine Chemotherapy Surgery
18. Can coloncancer be preventedbyremoval of colon polyps?
Male
Answer Frequency,f
Yes
No
Notsure
25
27
48
Mode Notsure
Female
Answer Frequency,f
Yes
No
Notsure
42
20
38
Mode Yes
0
10
20
30
40
50
60
Male Female
Chart Title
Yes No Not sure
19. How can the diagnosisof coloncancerand locatingof tumourcan be done?
Male
Answer Frequency, f
BariumenemaX-ray
Colonoscopy
Both A and B
27
15
58
Mode Both A and B
Female
Answer Frequency,f
BariumenemaX-ray
Colonoscopy
Both A and B
12
16
72
Mode Both A and B
0
10
20
30
40
50
60
70
80
Male Female
Chart Title
Barium enema X-ray Colonoscopy Both A and B
20. What can chemotherapydotohelpthose whoare livingwithcolon cancer?
Male
Answer Frequency,f
Extendlife andimprove qualityof life
Cure the disease
Doesnot helpatall
37
36
27
Mode Extendlife andimprove qualityof life
Female
Answer Frequency,f
Extendlife andimprove qualityof life
Cure the disease
Doesnot helpatall
56
23
21
Mode Extendlife andimprove qualityof life
0
10
20
30
40
50
60
Male Female
Chart Title
Extend life and improve quality of life Cure the disease Does not help at all
21. What doesthe treatmentof coloncancer dependson?
Male
Answer Frequency,f
Location,size andextentof cancerspread
Healthof the patient
Both A and B
35
20
55
Mode Location,size andextentof cancerspread
Female
Answer Frequency,f
Location,size andextentof cancerspread
Healthof the patient
Both A and B
49
11
40
Mode Location,size andextentof cancerspread
0
10
20
30
40
50
60
Male Female
Chart Title
Location, size and extent of cancer spread Health of the patient Both A and B
Conclusion
Total (Percentage)
Male
Question A B C Total
1 56% 10% 34% 100%
2 61% 28% 11% 100%
3 41% 17% 42% 100%
4 46% 24% 30% 100%
5 34% 39% 27% 100%
6 13% 62% 25% 100%
7 12% 51% 37% 100%
8 41% 25% 34% 100%
9 14% 76% 10% 100%
10 34% 32% 34% 100%
11 40% 20% 40% 100%
12 32% 19% 49% 100%
13 58% 26% 16% 100%
14 38% 30% 32% 100%
15 37% 27% 36% 100%
16 26% 28% 46% 100%
17 12% 30% 58% 100%
18 25% 27% 48% 100%
19 27% 15% 58% 100%
20 37% 36% 27% 100%
21 35% 20% 55% 100%
Female
Question A B C Total
1 82% 2% 11% 100%
2 73% 22% 5% 100%
3 56% 17% 27% 100%
4 26% 49% 25% 100%
5 9% 79% 12% 100%
6 10% 75% 15% 100%
7 7% 57% 36% 100%
8 41% 27% 32% 100%
9 11% 76% 13% 100%
10 19% 44% 37% 100%
11 55% 20% 25 % 100%
12 20% 19% 61% 100%
13 49% 31% 20% 100%
14 45% 18% 37% 100%
15 53% 17% 30% 100%
16 23% 26% 51% 100%
17 3% 41% 56% 100%
18 42% 20% 38% 100%
19 12% 16% 72% 100%
20 56% 23% 21% 100%
21 49% 11% 40% 100%
Assume 100% = 1 marks.
Total percentage of male students =
= 990%
Total marks of male students = 9.90 marks
Total percentage of female students =
= 1221%
Total marks of female students = 12.21 marks
Different between male students and female students
In the conclusion, female students of Taylor’s University are more understand than male students in
Taylor’s University about Colon Cancer.
The male students and female students answer the entire question correctly but more female students
answer the question correctly.
The total marks of female students is 12.21 out of 21. The total mark of male students is 9.9 out of 21.
The female students score a higher mark than the male students. This means that the female students
answer more correct answer than male students. The difference female students and male students is
2.31.
The difference between the male students and female students is not too big.
56% + 61% + 42% + 46% + 39% + 62% + 51% + 41% +
76% + 34% + 40% + 49% + 58% + 26% + 38% + 37% +
46% + 58% + 58% + 37% + 35%
82% + 73% + 56% + 49% + 79% + 75% + 57% + 41% +
76% + 44% + 55% + 61% + 49% + 45% + 53% + 51% +
56% + 42% + 72% + 56% + 49%
= 12.21 – 9.9
= 2.31

Math Final Project Statistics

  • 1.
    SCHOOL OF ARCHITECTURE,BUILDING AND DESIGN FOUNDATION IN NATURAL BUILD ENVIRONMENT AUGUST 2014 MODULE: MATHEMATICS [MTH10304] ASSIGNMENT: STATISTICS LECTURER: MS ANN SEE PENG SUBMISSION DATE: 1 JUNE 2015 Group member: Ee Yun Shan 0319990 Lim Zia Huei 0321031 Nurafiqah Zariful 0321196 Nabila Hanim 0321368
  • 2.
    Content No. Title Page 1.Introduction 2. Objective 3. Methodology 4. Survey Forms (Empty) 5. Survey Forms (Answer) 6. Survey Forms (Responded) 7. Analysis 8. Conclusion
  • 3.
    Introduction A survey isa detailed study of a market or an area to gather data on attitudes, opinions, understanding level etc. It have been used in diversity of forms in most places such as hospitals, schools, hotels, restaurants and more. It enables us to improve or gain knowledge upon other people’s understanding or opinion. Regarding this assignment, we are required to do a survey about one of the chronic diseases in Malaysia. When we are doing the research about the chronic diseases, we found that colon cancer is the leading cause of death by cancer in Malaysia mainly due to a lack of urgency among many people who are at greater risk from developing this cancer yet fail to seek treatment until it is too late. They do not have much knowledge about this disease. Due to this, we are more curious about this disease compare to other diseases. Hence, we decided to do a survey about this disease.
  • 4.
    Objective The survey’s primaryobjective is to identify between two genders of students that have more understanding ability on specific chronic disease in Malaysia. We were to conduct a survey around the campus and organize a statistical data regarding the response on the two gender upon the survey. This enables us to be able to calculate statistics in real life and gain knowledge from analysing it, to calculate and conclude how much that each student and different genders could understand more on specific disease happen in Malaysia. This enable us to differentiate between the two genders easily by looking through the survey answers. Through this project, we not only can improve our techniques in solving statistic questions, we also can learn more about the chronic diseases in Malaysia. This group project enable us to learn to work in group. We can practice our leadership skill, communication skill as well as tolerance in this way. We also learn to be brave when we are trying to distribute the survey form. Learning outcome: 1. To analyse the statistical data based on the survey forms collected and draw conclusion from the data. 2. To solve problems that involves various mathematical principles. 3. To understand and apply mathematical principles involved.
  • 5.
    Methodology We planned wiselybefore starting our project. We done our research before choosing a disease. Next, we do the survey form by choosing suitable questions. After that, we divided our forms equally to be distributed that was 50 forms per person. Two person will distributed it to the male while the other two person will distributed it to the male. We decided to choose places that have more people such as library, e-quarium or classrooms. Places of interviewing chosen: The library The classroom The process of the interviewing
  • 6.
    Total (Percentage) Male Question AB C Total 1 56 10 34 100 2 61 28 11 100 3 41 17 42 100 4 46 24 30 100 5 34 39 27 100 6 13 62 25 100 7 12 51 37 100 8 41 25 34 100 9 14 76 10 100 10 34 32 34 100 11 40 20 40 100 12 32 19 49 100 13 58 26 16 100 14 38 30 32 100 15 37 27 36 100 16 26 28 46 100 17 12 30 58 100 18 25 27 48 100 19 27 15 58 100 20 37 36 27 100 21 35 20 55 100 Female Question A B C Total 1 82 2 11 100 2 73 22 5 100 3 56 17 27 100 4 26 49 25 100 5 9 79 12 100 6 10 75 15 100 7 7 57 36 100 8 41 27 32 100 9 11 76 13 100 10 19 44 37 100 11 55 20 25 100 12 20 19 61 100 13 49 31 20 100 14 45 18 37 100 15 53 17 30 100 16 23 26 51 100 17 3 41 56 100 18 42 20 38 100 19 12 16 72 100 20 56 23 21 100 21 49 11 40 100
  • 7.
    Total (Percentage) Male Question AB C Total 1 56% 10% 34% 100% 2 61% 28% 11% 100% 3 41% 17% 42% 100% 4 46% 24% 30% 100% 5 34% 39% 27% 100% 6 13% 62% 25% 100% 7 12% 51% 37% 100% 8 41% 25% 34% 100% 9 14% 76% 10% 100% 10 34% 32% 34% 100% 11 40% 20% 40% 100% 12 32% 19% 49% 100% 13 58% 26% 16% 100% 14 38% 30% 32% 100% 15 37% 27% 36% 100% 16 26% 28% 46% 100% 17 12% 30% 58% 100% 18 25% 27% 48% 100% 19 27% 15% 58% 100% 20 37% 36% 27% 100% 21 35% 20% 55% 100% Female Question A B C Total 1 82% 2% 11% 100% 2 73% 22% 5% 100% 3 56% 17% 27% 100% 4 26% 49% 25% 100% 5 9% 79% 12% 100% 6 10% 75% 15% 100% 7 7% 57% 36% 100% 8 41% 27% 32% 100% 9 11% 76% 13% 100% 10 19% 44% 37% 100% 11 55% 20% 25 % 100% 12 20% 19% 61% 100% 13 49% 31% 20% 100% 14 45% 18% 37% 100% 15 53% 17% 30% 100% 16 23% 26% 51% 100% 17 3% 41% 56% 100% 18 42% 20% 38% 100% 19 12% 16% 72% 100% 20 56% 23% 21% 100% 21 49% 11% 40% 100%
  • 8.
    Analysis 1. Colon canceris the cancer of the large intestine, the lower part of your digestive system. Males Answer Frequency, f True False Not sure 56 10 34 Mode True Females Answer Frequency, f True False Not sure 82 2 11 Mode True 0 10 20 30 40 50 60 70 80 90 Males Females TRUE FALSE Not sure
  • 9.
    2. Colon cancercan also be called Males Answer Frequency, f Colorectal cancer Stomach cancer Thyroid cancer 61 28 11 Mode Colorectal cancer Females Answer Frequency, f Colorectal cancer Stomach cancer Thyroid cancer 73 22 5 Mode Colorectal cancer 0 10 20 30 40 50 60 70 80 Males Females Colorectal cancer Stomach cancer Thyroid cancer
  • 10.
    3. Most casesof colon cancer begin as small, non-cancerous clumps of cells called adenomatous polyps. Over time some of these polyps become colon cancers. Males Answer Frequency, f True False Not sure 41 17 42 Mode Not sure Females Answer Frequency, f True False Not sure 56 17 27 Mode True 0 10 20 30 40 50 60 Males Females TRUE FALSE Not sure
  • 11.
    4. Do colonpolyps and early cancer have any symptoms? Males Answer Frequency, f Yes No Not sure 46 24 30 Mode Yes Females Answer Frequency, f Yes No Not sure 26 49 25 Mode No 0 10 20 30 40 50 60 Males Females Yes No Not sure
  • 12.
    5. Is Coloncancer contagious (will a person catch the disease from a cancer patient)? Males Answer Frequency, f Yes No Not sure 34 39 27 Mode No Females Answer Frequency, f Yes No Not sure 9 79 12 Mode No 0 10 20 30 40 50 60 70 80 90 Males Females Yes No Not sure
  • 13.
    6. Will thepatients show symptoms immediately after colon cancer present in their bodies? Males Answer Frequency, f Yes No Not sure 13 62 25 Mode No Females Answer Frequency, f Yes No Not sure 10 75 15 Mode No 0 10 20 30 40 50 60 70 80 Males Females Yes No Not sure
  • 14.
    7. Colon canceris the ___________-leading cause of cancer deaths in both men and women. Males Answer Frequency, f First Second Third 12 51 37 Mode Second Females Answer Frequency, f First Second Third 7 57 36 Mode Second 0 10 20 30 40 50 60 Males Females First Second Third
  • 15.
    8. Which groupof people has higher risk in affected by colon cancer? Males Answer Frequency, f Men Women Not sure 41 25 34 Mode Men Females Answer Frequency, f Men Women Not sure 41 27 32 Mode Men 0 5 10 15 20 25 30 35 40 45 Males Females Men Women Not sure
  • 16.
    9. Younger peopleor older people will have higher risk in affected by colon cancer? Males Answer Frequency, f Younger Older Not sure 14 76 10 Mode Older Females Answer Frequency, f Younger Older Not sure 11 76 13 Mode Older 0 10 20 30 40 50 60 70 80 Males Females Younger Older Not sure
  • 17.
    10. When isthe National Dress in Blue Day? Males Answer Frequency, f First Tuesday of March First Friday of May First Friday of March 34 32 34 Mode First Tuesday of March/ First Friday of March Females Answer Frequency, f First Tuesday of March First Friday of May First Friday of March 19 44 37 Mode First Friday of May 0 5 10 15 20 25 30 35 40 45 50 Males Females First Tuesday of March First Friday of May First Friday of March
  • 18.
    11. Will aperson has a higher risk of colon cancer if his or her family has a history of having colon cancer and polyps? Males Answer Frequency, f Yes No Not sure 40 20 40 Mode Yes,Not sure Females Answer Frequency, f Yes No Not sure 55 20 25 Mode Yes 0 10 20 30 40 50 60 Males Females Yes No Not sure
  • 19.
    12 . Whichof the following will increase a person to have a higher risk of colon cancer? Males Answer Frequency, f High calcium diet High glucose diet High fat diet 32 19 49 Mode High fat diet Females Answer Frequency, f High calcium diet High glucose diet High fat diet 20 19 61 Mode High fat diet 0 10 20 30 40 50 60 70 Males Females High calcium diet High glucose diet High fat diet
  • 20.
    13. Which ofthe following will increase a person’s risk of colon cancer? Males Answer Frequency, f True False Not sure 38 30 32 Mode True Females Answer Frequency, f True False Not sure 45 18 37 Mode True 0 10 20 30 40 50 60 70 Males Females The presence of polyps in the large intestine Inflammatory bowel diseases Primarily chronic ulcerative colitis
  • 21.
    14. The symptomsof colon cancer are similar although sometimes will be slightly different according to the physical condition of the person. Males Answer Frequency, f True False Not sure 58 26 16 Mode True Females Answer Frequency, f True False Not sure 49 31 20 Mode True 0 10 20 30 40 50 60 70 Males Females TRUE FALSE Not sure
  • 22.
    15. The symptomsof the colon cancer vary according to where in the large intestine the tumor is located. Males Answer Frequency, f True False Not sure 58 26 16 Mode True Females Answer Frequency, f True False Not sure 49 31 20 Mode True 0 10 20 30 40 50 60 Males Females TRUE FALSE Not sure
  • 23.
    16. A personwith right-sided cancer will more likely to have partial or complete bowel obstruction while left-sided cancers will have iron deficiency anemia. Males Answer Frequency, f True False Not sure 26 28 46 Mode Not sure Females Answer Frequency, f True False Not sure 23 26 51 Mode Not sure 0 10 20 30 40 50 60 Males Females TRUE FALSE Not sure
  • 24.
    17. What isthemostcommontreatmentforcolon cancer? . Male Answer Frequency,f By usingmedicine Chemotherapy Surgery 12 30 58 Mode Surgery Female Answer Frequency,f By usingmedicine Chemotherapy Surgery 3 41 56 Mode Surgery 0 10 20 30 40 50 60 70 Male Female Chart Title By using medicine Chemotherapy Surgery
  • 25.
    18. Can coloncancerbe preventedbyremoval of colon polyps? Male Answer Frequency,f Yes No Notsure 25 27 48 Mode Notsure Female Answer Frequency,f Yes No Notsure 42 20 38 Mode Yes 0 10 20 30 40 50 60 Male Female Chart Title Yes No Not sure
  • 26.
    19. How canthe diagnosisof coloncancerand locatingof tumourcan be done? Male Answer Frequency, f BariumenemaX-ray Colonoscopy Both A and B 27 15 58 Mode Both A and B Female Answer Frequency,f BariumenemaX-ray Colonoscopy Both A and B 12 16 72 Mode Both A and B 0 10 20 30 40 50 60 70 80 Male Female Chart Title Barium enema X-ray Colonoscopy Both A and B
  • 27.
    20. What canchemotherapydotohelpthose whoare livingwithcolon cancer? Male Answer Frequency,f Extendlife andimprove qualityof life Cure the disease Doesnot helpatall 37 36 27 Mode Extendlife andimprove qualityof life Female Answer Frequency,f Extendlife andimprove qualityof life Cure the disease Doesnot helpatall 56 23 21 Mode Extendlife andimprove qualityof life 0 10 20 30 40 50 60 Male Female Chart Title Extend life and improve quality of life Cure the disease Does not help at all
  • 28.
    21. What doesthetreatmentof coloncancer dependson? Male Answer Frequency,f Location,size andextentof cancerspread Healthof the patient Both A and B 35 20 55 Mode Location,size andextentof cancerspread Female Answer Frequency,f Location,size andextentof cancerspread Healthof the patient Both A and B 49 11 40 Mode Location,size andextentof cancerspread 0 10 20 30 40 50 60 Male Female Chart Title Location, size and extent of cancer spread Health of the patient Both A and B
  • 29.
    Conclusion Total (Percentage) Male Question AB C Total 1 56% 10% 34% 100% 2 61% 28% 11% 100% 3 41% 17% 42% 100% 4 46% 24% 30% 100% 5 34% 39% 27% 100% 6 13% 62% 25% 100% 7 12% 51% 37% 100% 8 41% 25% 34% 100% 9 14% 76% 10% 100% 10 34% 32% 34% 100% 11 40% 20% 40% 100% 12 32% 19% 49% 100% 13 58% 26% 16% 100% 14 38% 30% 32% 100% 15 37% 27% 36% 100% 16 26% 28% 46% 100% 17 12% 30% 58% 100% 18 25% 27% 48% 100% 19 27% 15% 58% 100% 20 37% 36% 27% 100% 21 35% 20% 55% 100% Female Question A B C Total 1 82% 2% 11% 100% 2 73% 22% 5% 100% 3 56% 17% 27% 100% 4 26% 49% 25% 100% 5 9% 79% 12% 100% 6 10% 75% 15% 100% 7 7% 57% 36% 100% 8 41% 27% 32% 100% 9 11% 76% 13% 100% 10 19% 44% 37% 100% 11 55% 20% 25 % 100% 12 20% 19% 61% 100% 13 49% 31% 20% 100% 14 45% 18% 37% 100% 15 53% 17% 30% 100% 16 23% 26% 51% 100% 17 3% 41% 56% 100% 18 42% 20% 38% 100% 19 12% 16% 72% 100% 20 56% 23% 21% 100% 21 49% 11% 40% 100%
  • 30.
    Assume 100% =1 marks. Total percentage of male students = = 990% Total marks of male students = 9.90 marks Total percentage of female students = = 1221% Total marks of female students = 12.21 marks Different between male students and female students In the conclusion, female students of Taylor’s University are more understand than male students in Taylor’s University about Colon Cancer. The male students and female students answer the entire question correctly but more female students answer the question correctly. The total marks of female students is 12.21 out of 21. The total mark of male students is 9.9 out of 21. The female students score a higher mark than the male students. This means that the female students answer more correct answer than male students. The difference female students and male students is 2.31. The difference between the male students and female students is not too big. 56% + 61% + 42% + 46% + 39% + 62% + 51% + 41% + 76% + 34% + 40% + 49% + 58% + 26% + 38% + 37% + 46% + 58% + 58% + 37% + 35% 82% + 73% + 56% + 49% + 79% + 75% + 57% + 41% + 76% + 44% + 55% + 61% + 49% + 45% + 53% + 51% + 56% + 42% + 72% + 56% + 49% = 12.21 – 9.9 = 2.31