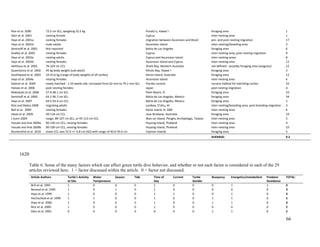
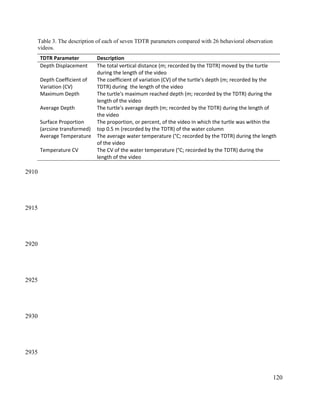
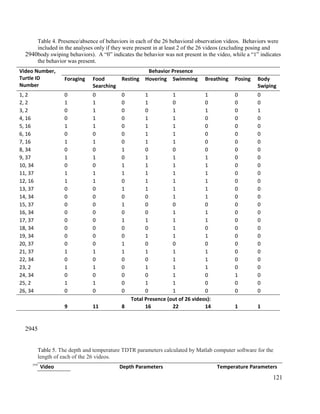
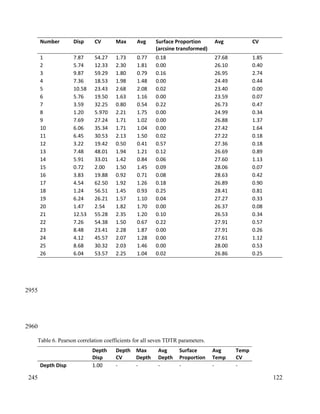
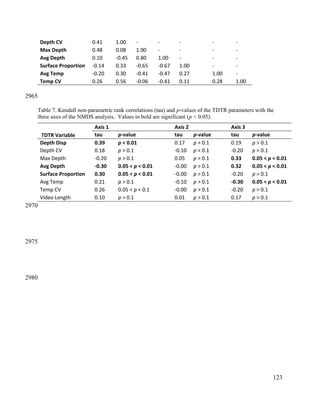
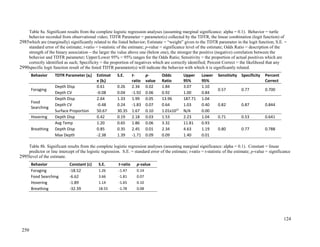
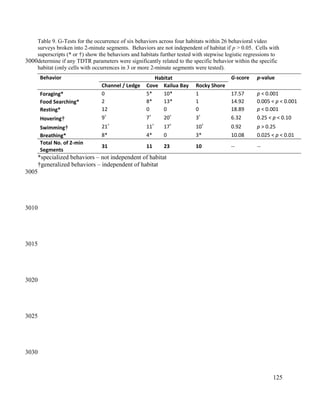
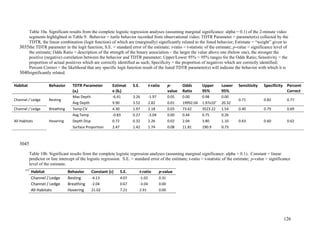
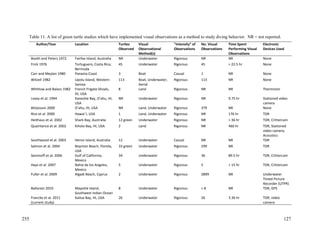
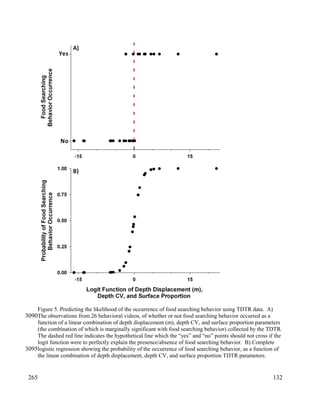
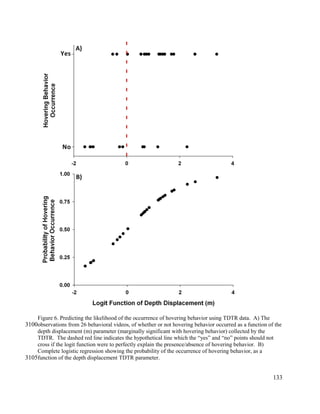
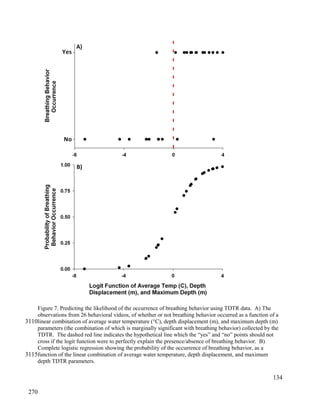
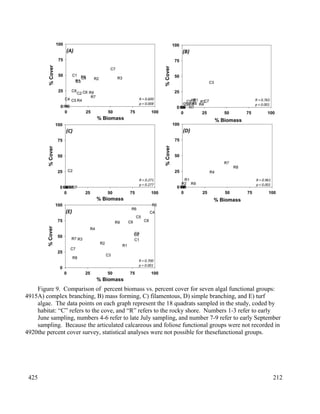
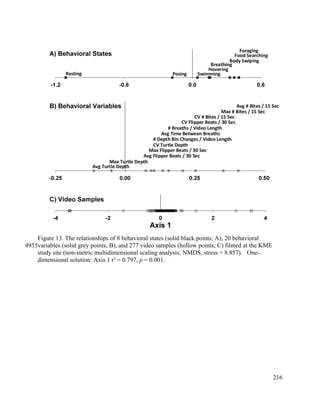
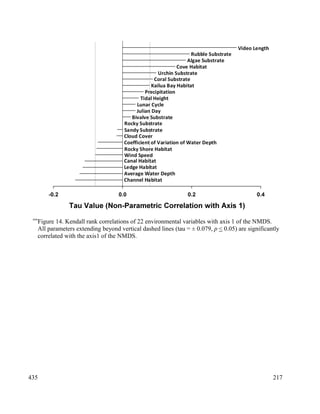
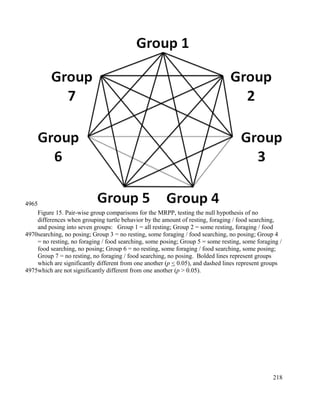
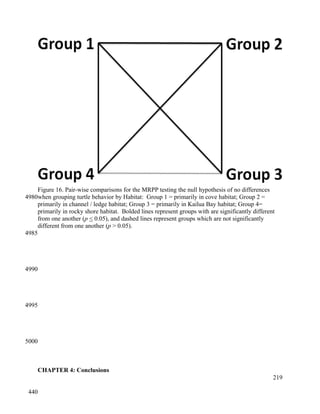
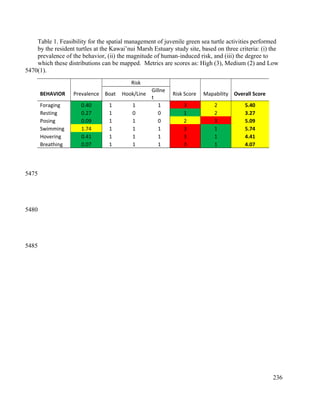
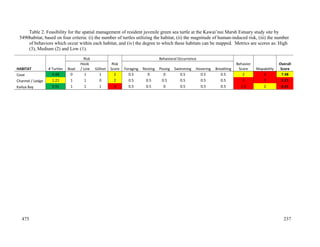
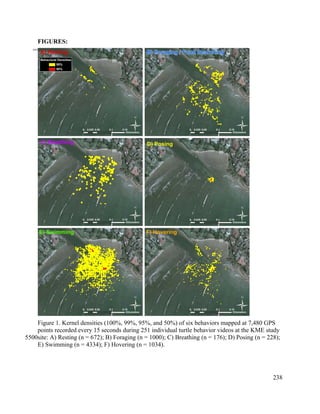
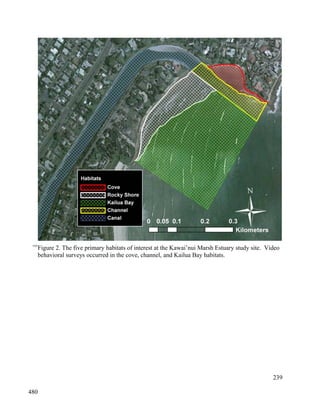
1
© 2011 Devon L. Francke
TABLE OF CONTENTS
2
5
10
15
20
25
30
35
40
5
Page
ACKNOWLEDGMENTS 4
CHAPTERS
1. Into the depths: a literature review of green turtle (Chelonia mydas) diving behavior
Abstract 5
Introduction 5
History of Sea Turtle Behavior Studies 7
Comparison of Satellite-Loggers to TDRs 10
Creating Dive Profiles Using Satellite-Loggers and TDRs 12
Methods and Devices Used to Collect Behavioral Dive Data 18
Studying, Organizing, and Analyzing Behavioral Dive Data 24
Authors’ Definitions of Behaviors 31
Study Site Locations 32
Study Sample Sizes 33
Factors Influencing Dive Behavior 34
Conclusions 49
References 53
Tables 60
Figures 68
2. Inferring the behavior of juvenile green sea turtles (Chelonia mydas) in a shallow coastal habitat:
augmenting time-depth-temperature records with visual observations
Abstract 71
Introduction 72
Methods 75
Results 83
Discussion 95
Conclusions 110
References 111
Tables 119
Figures 129
3. Juvenile green sea turtle (Chelonia mydas) diving behavior in relation to habitat heterogeneity and
water temperature in Kawai’nui, O’ahu (Hawai’i)
Abstract 135
Introduction 136
Methods 140
Results 151
Discussion 162
Conclusions 180
References 182
Tables 190
Figures 204
4. Conclusions 220
References 232
Tables 236
Figures 238
ACKNOWLEDGMENTS
3
45
50
55
60
65
70
75
80
85
90
95
100
I have a great many people and organizations that I would like to thank for their
contributions to my thesis. First, my committee members have been inspirational in supporting
my love and desire to pursue marine science and conservation as a career. David Hyrenbach
shared his vast knowledge, experience, and dedication with me nearly every single day over the
last two years; I could not be more grateful for the positive influence he has had on my life. Eric
Vetter provided valuable insight regarding methodological design, statistical, and thesis writing
techniques. Chris Winn provided expertise on oceanographic topics and assisted with thesis
writing. Stacy Hargrove, of the Marine Turtle Research Program (MTRP) of the National
Oceanographic and Atmospheric Administration Pacific Islands Fisheries Science Center
(NOAA-PIFSC) assisted with thesis writing and shared her sea turtle ecology knowledge.
The project could not have been completed without the support of George Balazs and his
team at MTRP NOAA-PIFSC. They directly worked with me in the field on a monthly basis
over the course of my study and allowed me to utilize their turtle research permits. They
provided great knowledge of green sea turtle ecology and field techniques, including proper sea
turtle catching, handling, and tagging techniques. In particular, George went out of his way on
multiple occasions to help me spot and catch tagged turtles, and I cannot thank him enough for
sharing his vast Hawaiian green turtle knowledge and being a great mentor.
My Pelagicos labmates Jessie Lopez, Shannon Lyday, Pamela Michael, Andrew Titmus
and David’s wife, Michelle, provided extensive support assisting me with field work, sharing
thoughtful commentary on my work and creative solutions to problems I encountered. Karen
Arthur provided detailed knowledge of Hawaiian algae, occasionally assisting with field work.
Brenda Asuncion trained me in multiple aspects of my research, including teaching me how to
use equipment and computer software, shared her great knowledge of the study site with me, and
assisted me with field work. I would also like to thank Jillian Bennett, Stephanie Bovia, and
Monica Mocaer for the countless number of hours each of them put in to be my kayaking,
snorkel, and algae-collection buddies over the course of my study.
This research was supported by in-kind contributions of time, equipment, and supplies
from a number of people and organizations. Hawai’i Pacific University furnished funding
through a Trustee’s Scholarship Endeavors Program grant, and the World Turtle Trust provided a
grant, both allowing me to purchase research supplies and analyze data for my thesis. Alan
Friedlander provided Vemco acoustic receivers and tags, the Yarborough family provided me
with a 2-person kayak to use for field work, and the Churchill family was essential in my daily
field work by allowing me to store my gear and set up in their backyard. The Perry and
Scherman families made their homes available to us during our turtle catching and tagging days.
I am extremely grateful for the generosity provided by these people and organizations.
Lastly, I would like to thank those people who provided me with extensive emotional,
moral, and financial (thanks, mom and dad!) support. Specifically, I would like to thank my
advisor, David Hyrenbach; my fellow Badgers Joel and Tiffany Bessire, Kristin Mocadlo,
Megan and Ross Moore, Nathan and Sarah Seegert, and Matt Ziehr; my Minnesota friends Eric
and Alexis Simonson, and Steven Torres; and an extremely special thank you to my family:
Elliot and Cheryl Francke, Tara and Russell Nadel, and Jordan Francke. Without these people,
my motivation and desire to continue working, even when the going got tough, would not have
existed. Thank you all for being such wonderful, amazing, inspirational influences in my life.
CHAPTER 1: Into the Depths: A Literature Review of Green Turtle (Chelonia mydas)
Diving Behavior
4
105
110
115
120
125
130
135
140
145
ABSTRACT:
A large number of articles have been written on marine animal diving behavior, but only
a fraction of these discuss turtles, with even a smaller number specifically addressing green sea
turtles (Chelonia mydas). In this literature review, 29 articles using electronic equipment in their
methodology to quantify and describe green turtle dive behavior are discussed in depth,
comparing how these devices are used to collect dive data, the methods by which these data can
be analyzed, and the dangers involved with making subjective decisions and comparisons of dive
data and dive behavior. The definitions used to describe distinct behaviors, such as foraging and
resting, are discussed. In addition, other ancillary data including the location of each study and
the sample size are considered. Finally, a wide range of additional ecological factors which can
affect a turtle’s dive behavior are also discussed. All of these factors must be taken into
consideration when researching the dive behavior of green sea turtles, as each can affect the
conclusions drawn from these studies.
INTRODUCTION:
There is a great lack of information regarding the at sea behavior of marine animals
(Godley et al. 2002). It is much harder to study the behaviors of marine animals that remain out
of view while submerged and occur far from shore (Hays et al. 2000; Hays et al. 2002b; Myers et
al. 2006). More specifically, data on sea turtle behavior are more limited than for other species,
such as seals, penguins, and diving birds. It is very important that turtle behavior be studied as
these creatures spend a much greater portion of their life underwater than other air-breathing
marine vertebrates, and are therefore likely to have different behavioral patterns than other
diving species (Hochscheid et al. 1999). Most importantly, studying turtle diving behavior can
5
150
155
160
165
170
10
give an insight to their energy expenditure and grazing habits, as well as provide useful
information to protect these animals through marine protected areas (Cooke et al. 2004).
Until recent technological developments within the last few decades, studies of sea turtles
while at sea have been limited to sporadic observations of behavior and fragmentary records of
long distance migrations from mark-recapture studies (Hays et al. 2000). The majority of the
published studies that focus on sea turtle behavior are limited to areas in which turtles can easily
be tagged, such as on beaches when females emerge to nest. Conversely, it is much more
difficult to catch and tag turtles when they are not on shore, for instance while they are migrating
or foraging (Rice and Balazs 2008), even though this has been done before, and is now becoming
a more common methodology. Expanding these behavioral studies to incorporate all habitats
utilized by turtles will assist conservation managers in their global effort to specifically protect
the green sea turtle (Chelonia mydas), a globally endangered species (Makowski et al. 2006).
This is because studying the three-dimensional movement of sea turtles, such as foraging
behavior, will help to determine how they allocate time to feeding and other activities
(Blumenthal et al. 2009), and will contribute to developing accurate budgets of energetic needs
and grazing (Hochscheid et al. 2005). A better understanding of green turtle behavior will help
conservation managers to protect critical areas for this species (Schofield et al. 2006). Choosing
small areas to protect will require detailed location-specific information on green turtle behavior
and small-scale movements within areas affected by human-caused mortality (Hochscheid et al.
1999; Hazel et al. 2009).
HISTORY OF SEA TURTLE BEHAVIOR STUDIES:
6
175
180
185
190
Even though relatively few manuscripts discuss green sea turtle dive behavior, the first
studies date back to the 1950s. Initially to study turtle movement behavior, mark/recapture
techniques were used to study long distance migration (Hays et al. 2001a). This was the
prominent method for studying turtle distribution and movement for decades (Keinath and
Musick 1993), but this method poorly described the daily movement of sea turtles (Blumenthal
et al. 2010). Instead, some researchers would study turtle movement by filling balloons with
helium and attaching them via a nonfilament line to the carapace of the turtles. Beginning in the
1970s, satellite telemetry was used to track terrestrial animals such as elk and deer, and shortly
thereafter it was used on marine animals such as fish, polar bears, birds, seals, manatees, and
dolphins (Renaud and Carpenter 1994). Satellite tracking of turtles did not begin until the 1980s,
and was quite limited at the time (Godley et al. 2008). These early instruments could only
measure location of the turtle (Renaud and Carpenter 1994). Into the 1990s, laboratory
experiments tested the mechanisms which turtles use to navigate during migration (e.g.,
Lohmann and Lohmann 1994), and organ analyses of dead specimens were conducted to realize
any changes in the body due to migration (Hays et al. 2001a). In the early 1990s, more
electronic equipment, such as radio and sonic telemetry, was used to track turtles over a short
range for the first time to obtain fine-scale movement data (e.g., Brill et al. 1995), but this
method was very expensive and dependent on the weather, making it unreliable and difficult to
track turtles in this fashion (Keinath and Musick 1993; Hazel 2009). The amount of data
collected by any of these techniques was quite limited and descriptive without much quantifiable
data on turtle behavior. Additionally, these devices required extensive hands-on effort for
tracking the turtles while at sea, creating a large amount of funding needed to compensate for
7
195
200
205
210
15
both the expensive devices as well as people-hours working in the field (Seminoff and Jones
2006).
The onset of electronic tags in the mid-1990s greatly advanced the study of turtle
behavior. Over the last 15-20 years, satellite-loggers have technologically advanced to the point
that they can now incorporate complex dive logging capabilities (Godley et al. 2008), such as
being able to measure heart rate, body temperature, speed of travel, diving depth, submergence
time, and water temperature (Renaud and Carpenter 1994). Quantifying these variables gives
researchers insight into the behavioral ecology of turtles while they migrate and forage (Hays et
al. 2001a). Satellite data can show dive profiles which could help to explain turtle behavior such
as resting, foraging, exploring, or a multitude of other behaviors, and can help to determine if
other factors, such as water temperature, could affect the turtle’s movement or diving patterns
(Myers et al. 2006).
In the late 1990s, a new emerging technology provided even more detailed results than
satellite-linked loggers, which are constrained to the rate of data they can deliver and thus often
provide only summaries of the data (Hays et al. 2001a). This new technology, a data logger,
commonly referred to as a TDR (time-depth recorder), is capable of storing all data within the
device itself, rather than delivering them to the satellite, therefore having the ability to record
more data points and thus achieve more detailed (fine-scale) results on turtle diving behavior
(Hays et al. 2001a). At first, these devices did not have much more memory capacity than
satellite-loggers (Fedak et al. 2001), but over time, the resolution of these devices has become
much finer, allowing for a much more in-depth analysis of data collected from tracked turtles.
Currently, the most advanced TDRs have the capability of recording ancillary data on flipper
beat frequency, acceleration, compass heading (Myers et al. 2006), biaxial motion, and
8
215
220
225
230
235
swimming speed (Yasuda and Arai 2009a). Many devices even log still images and video to
show the behavior that a turtle is performing within its environment (Seminoff et al. 2006). As
satellite and data logging technologies continue to expand, so will our knowledge of sea turtle
behavior at sea (Hays et al. 2002b).
Additionally, a new technology is emerging just within the last few years which can
measure fine-scale horizontal movement of diving animals. Previously, global positioning
system (GPS) units have not been used with marine animals, like green turtles, as they surface
too briefly for the device to communicate with the satellites. However, new fast-logging GPS
devices, such as Fastloc GPS (FGPS) can be used on marine animals which periodically surface
to breathe, allowing much better location accuracy and resolution than traditional satellite-
logging devices (Hazel et al. 2009). For instance, in a study by Hazel (2009) comparing the
efficacy of both regular satellite-loggers and FGPS units, the horizontal distance error was
between 150 to 1000 m for the satellite-loggers, while the FGPS units had an error of only 32 ±
36.9 m. The FGPS device also collected 50 times more data points than the satellite-logger.
And, even though acoustic tracking can be more exact than FGPS, this newer method is not
reliant on boat tracking, weather conditions, and is not labor intensive, while radio and sonic tags
are reliant on these things. Acoustic signals can also be disrupted by silty or vegetated
substrates, as well as wave action, vessel traffic, and even other animals, while FGPS is not
(Hazel 2009). However, this new technology still is in need of improvement – as the number of
satellites with which it communicates decreases, so does its accuracy. To ensure that it
communicates with the maximum number of satellites, its sampling rate must be set at a
maximum, which greatly decreases its battery life. And, there is a time delay of at least 24 hours
before the data from these devices is processed, therefore making real-time tracking of the
9
240
245
250
255
260
animal impossible (Hazel 2009). Until these potential problems are addressed, and these devices
also have the ability of recording depth, these devices will unlikely be used mainstream.
COMPARISON OF SATELLITE-LOGGERS TO TDRS:
Satellite and TDR logging devices have revolutionized the study of turtle diving behavior
(Houghton et al. 2003). However, there are specific advantages and disadvantages to both types
of devices. For instance, satellite-loggers can transmit the data collected back to the researchers
without needing to retrieve the device (unlike a TDR), which allows studies of animals that
cannot be recaptured (Fedak et al. 2001). Satellite tags are more expensive than TDRs
(Blumenthal et al. 2010), but they can be serviced for multiple deployments (Keinath and Musick
1993). Additionally, satellite-loggers reduce research costs by not requiring the additional field
work to recapture the animal (Renaud and Carpenter 1994). It may be more beneficial to use a
satellite-logger when studying the behaviors of turtles over a longer time period or longer
distance, as TDRs are better suited for shorter, smaller studies (Hays et al. 1999, 2000). Finally,
data collected via satellite can easily be uploaded and shared with the public (Godley et al.
2008). TDRs, on the other hand, may be better suited for studies in small areas as satellites have
difficulty collecting data in such small areas due to potentially large location errors with those
devices (Godley et al. 2002; Hazel 2009; Blumenthal et al. 2010; Hart and Fujisaki 2010),
especially where depth decreases with distance from shore (Hazel et al. 2009). Therefore,
satellite-loggers are better for studies involving larger individuals due to their large size, high
cost, low positional accuracy and dive resolution (Blumenthal et al. 2009), while TDRs are used
more often on smaller individuals which reside in confined areas because they can provide much
10
265
270
275
280
20
more detailed information regarding depth utilization, surfacing behavior, and dive durations
(Hays et al. 2007; Rice and Balazs 2008; Witt et al. 2010).
However, there are negative aspects to using both types of devices. One pervasive
limitation is that instrument and attachment failures can lead to the loss of the data (Renaud and
Carpenter 1994). Satellite devices have a smaller band width for data transmission than TDRs,
meaning that the typical data collection interval must be spaced out, typically somewhere
between every 40 to 200 seconds (Myers et al. 2006). Because data collected by satellite tags
usually build up on the device much faster than they can be relayed to the Argos satellite system,
the device must bin or average the data before uplinking to the satellite, possibly eliminating
variability in the data (Fedak et al. 2001; Myers et al. 2006). Furthermore, satellite-based
devices can only uplink to the satellite once the device is at the surface of the water, which may
not be enough time for the data to upload (Fedak et al. 2001). This is a problem for turtles which
spend the majority of their time underwater (Hochscheid et al. 1999; Myers et al. 2006). For
instance, in a study at Ascension Island, dives by green turtles were longer than those recorded in
other studies, meaning that the satellite-loggers were rarely at the surface to upload the data they
had collected, leading to data more prone to errors (Hays et al. 1999). Also, the data relayed by
satellite-loggers could have location errors in the order of one kilometer, but can reach as high as
tens of kilometers (Renaud and Carpenter 1994). In a study by Hart and Fujisaki (2010), the
authors removed many satellite data points due to possible location errors – many points
appeared as though the turtles were crossing land, or were just general outliers. Lastly, the large
size of the satellite-logging device can actually increase the swimming drag on a sea turtle by up
to 27-30%, reducing its swimming speed by 11% (Watson and Granger 1998).
11
285
290
295
300
There appears to be two major drawbacks in regards to the use of TDRs. The first is that
it can be very difficult to retrieve these devices, particularly if they are deployed on turtles with
unknown residency patterns (Hazel et al. 2009), or on turtles which are very fearful of humans
due to decades of negative interactions with people – catching these turtles a second time to
retrieve the devices can be nearly impossible (Seminoff et al. 2001). Because this limitation
constraints the species and locations in which these devices can be used, satellite tags are a more
suitable option for migrating and non-resident organisms (Myers et al. 2006). Nevertheless,
occasionally both instruments can be used. In a study by Hays et al. (2001a), TDRs confirmed
the results from satellite tags – both devices reported short and shallow dives during the
migration of green turtles between Brazil and Ascension Island. The second drawback is that
TDRs lack a spatial context, unlike satellite-loggers (Blumenthal et al. 2010). These devices
make it difficult to determine habitat use (Witt et al. 2010). A possible solution to these two
drawbacks is to use a tandem of remotely collected TDR technology along with video cameras
attached to the carapace of a turtle (Seminoff et al. 2001). However, this type of technology is
only suitable for larger individuals as this methodology involves very large units, is costly, and is
memory constrained (Moll et al. 2007).
CREATING DIVE PROFILES USING SATELLITE-LOGGERS AND TDRS:
The analysis of data collected by satellite-loggers and TDRs can still be difficult to
interpret because they provide a limited record of the behavior being performed by the tagged
turtle (Fedak et al. 2001), even if the fine-scale data collected by these devices can recreate the
three-dimensional movements of the animal into two dimensions – depth and time. Generally,
these data are represented in a dive profile, showing the turtle’s depth over time (Figure 1).
12
305
310
315
320
325
25
Remote-sensing technology, such as satellite-loggers and TDRs, can only determine if an animal
is active or inactive – they do not explicitly state the behavior being performed (Heithaus et al.
2001). So, using some basic assumptions, researchers can make predictions about the behaviors
the turtles perform at specific times and locations, using these basic time-depth profiles.
Until the mid-1990s, dive profiling had been applied to marine mammals and birds but
had rarely been done for turtles (Hochscheid et al. 1999). By developing these standardized
time-depth profiles for turtles, it is now possible to identify, quantify, and analyze sea turtle
diving behaviors. When a turtle’s dive depth is plotted as a function of time, the time-depth
profile can describe multiple “shapes,” which can be related to behavioral or ecological factors,
and can be compared between conspecifics, across locations, and even across species (Fedak et
al. 2001). Researchers have therefore been able to assign specific dive shapes to particular
behaviors, such as feeding, looking for prey, traveling, and resting.
However, because comparing dive shapes involves a great deal of subjective judgments
and arbitrary decisions (Fedak et al. 2001), there are a multitude of potential problems associated
with inferring behaviors or movements from dive profiles (Seminoff et al. 2006). This simplistic
approach may not be accurate as turtles are known to perform multiple different types of
behaviors on one single dive, meaning that their dive behavior is more complex than a shape
dive profile may suggest. For example, in a study by Hochscheid et al. (1999), turtles performed
a specific type of a dive (U-dive, described later in this review) to the benthos multiple times, but
three different behaviors were observed with this type of dive – resting, grazing while moving
short distances along the bottom between patches of food, and foraging while swimming at a
slow constant speed to search for more food and resting places. Activity indexes showed that
25.3% of the U-dives were used for resting with largely inactive turtles, 44.3% of the U-dives
13
330
335
340
345
350
showed a limited amount of turtle movement and activity, 30.3% showed green turtles were
active for >80% of the dive, and 12% of the dives showed constantly active turtles. In another
study, Seminoff et al. (2006) cautioned that applying a dive type to a specific behavior may not
be prudent as green turtles were observed to forage in both the mid-water column and the
bottom, and did not always rest when it was assumed they would while using the dive profile.
After classifying the individual dive profiles into six distinct shapes, this study showed that
turtles could either be resting or foraging during the same dive shape, suggesting that it may be
impossible to determine merely by using a dive profile if a turtle is foraging, resting, or
performing any other behavior on the bottom (Hochscheid et al. 1999; Hays et al. 2002a;
Seminoff et al. 2006). Furthermore, because the histograms created by these dive profiles fail to
describe the order in which certain dives occurred, researchers cannot investigate the particular
activity of the animal during a particular dive (Fedak et al. 2001).
Another problem associated with assigning behaviors to a dive profile is that the logging
devices themselves (satellite-loggers or TDRs) can show a bias. Along with the fact that the
volume of data stored on a logging device can overload the memory capacity of the device,
jumbling the analysis (Fedak et al. 2001), the device could also easily show a turtle rising from
depth very clearly but does not show whether or not the animal had been actively swimming to
the surface (exploring, foraging, etc.) or if the turtle had just been floating upwards (possibly
resting mid-water).
Another problem relates to the location at which a turtle is performing a specific dive
type. If behavior does change amongst all foraging sites and even between different inter-
nesting sites (Houghton et al. 2002), one cannot assume similar behavior by different turtles at
all different locations on the planet (Hays et al. 2002a; Hazel et al. 2009). For example, as green
14
355
360
365
370
turtles tend to show sudden increases in depth and length of dives upon reaching a coast during
migration, it is likely the individual is using the area for foraging during migrating (Godley et al.
2002). Another example is related to a behavior specific to deep water migrations, as well as to
the Hawaiian Islands – basking. Sea turtles may actually rest at the surface of the water during
migration, which had not been documented until a study by Hays et al. (1999). However, it is
unlikely that turtles would rest for extended periods of time while migrating, unless it happens
before deep dives or during digestion (Hays et al. 1999). Whittow and Balazs (1982) also
showed that this basking behavior is common in the shallow waters of Hawai’i, and that green
turtles may climb onto the shore for an extended period of time to warm in the sun. A third
example is illustrated in a study by Hays et al. (2004a), in which U-shaped dives to the sea floor
at Ascension Island were interpreted as resting dives because there is no food available at this
inter-nesting site, while U-shaped dives to the seafloor off Cyprus have been observed to be
foraging dives, to feed on the plentiful food at that location.
The opposite can be true as well – two locations which appear very different may actually
involve a similar behavior. In a study by Hatase et al. (2006), adult female green turtles were
recorded feeding in both shallow, neritic waters and in the surface waters of deeper water (>200
m), although they would only feed at the surface. It had been generally unknown that green
turtles would feed on plankton while in the open ocean during migrations before this study.
It may be deceptive to infer behaviors from dive profiles, as individual turtles at one
specific location can show great variability in dive behavior. For example, in a study by Hays et
al. (1999), all turtles showed individual variability in the lengths of dive submergence, velocities
traveled while migrating, and percent of time submerged. In this study, the authors did not
create dive profiles for their turtles, but rather interpreted the behaviors being performed by the
15
375
380
385
390
395
30
turtles on the basis of the dive data. Most studies compare and contrast turtle behavior by
individuals tagged at the same time and location. Even though each turtle tends to show their
own unique dive behavior patterns, the overall conclusions are drawn by comparing the dive
profiles of all the individuals tagged (Rice and Balazs 2008). However, researchers must be
cautious when comparing turtles which seem to be portraying very different dive profiles, and
thus possibly very different behaviors.
In areas with complex or unknown bathymetry, it can be very difficult to use TDRs to
determine horizontal movements. In a study by Blumenthal et al. (2010), the authors integrated
TDR data with bathymetric maps to determine the location of tagged turtles by inferring that the
dive depths corresponded with the bathymetry of the area. Witt et al. (2010) took the inference
of dive behavior to even another level – using those inferences to predict the habitat in which
hawksbill turtles (Eretmochelys imbricata) were performing those behaviors. When maximum
depth was repeatedly relatively shallow, it was assumed the turtles were on the shallow reef, and
when their maximum depth was relatively deep, they were assumed to have traveled quite a far
distance away from the reef. However, as TDRs do not record the location of the turtles, it is
very difficult to determine if the shallow dives performed by turtles are in shallow or deep water
(Blumenthal et al. 2010). One must be very careful when using TDR data to infer habitat type,
as this is taking the inference of turtle behavior to an even further level.
Another prejudice against the use of dive profiles is their inability to show whether a
behavior is being performed at multiple depths. In the study by Seminoff et al. (2006), foraging
was observed while stationary on the bottom, while actively moving on the bottom, and while
moving in mid-water. Thus, it may be impossible to determine from a dive profile if a turtle is
16
400
405
410
415
foraging or resting while on the bottom (Hochscheid et al. 1999, Hays et al. 2002a, Seminoff et
al. 2006).
Despite all of these potential limitations, there are ways to minimize these biases to study
diving behavior. Because it is impossible to determine the details of dive behavior from the
analysis of satellite-logger or TDR derived dive profiles alone (Hays et al. 2004a), these data
should be augmented with behavioral observation (Houghton et al. 2003). However, of the 29
articles reviewed on green turtle diving behavior, only five (~17%) augmented their study by
including behavioral observation (visual surveys and/or Crittercam video camera), implying that
24 of the studies (~83%) based their conclusions exclusively on data collected from the
electronic devices attached to the turtles (Table 1; see section 5 in this review).
Additional data, beyond mere dive depth and/or duration must be analyzed (these were
the only one or two variables measured in 11 out of 29 studies, or ~38% of the articles reviewed)
to better understand dive behavior. For example, visual imaging systems, activity and swim
speed sensors, or instruments that show jaw activity can show if specific activities occur during
dives (Hays et al. 2004a). Or perhaps, instead of creating a dive profile, a dimensionless index
of dive shape (Time Allocation of Depth Index, TAD), which is independent of dive depth and
time, could be created instead, which shows the range at which the turtle has concentrated its
dive activity. This method uses the concept of “time-depth area,” defined as the area enclosed by
the dive profile trajectory and the line of zero depth (or, in other words, the integral of the dive
depth over duration of the dive). Or, instead of using a dive profile, an algorithm could be used
to select the points where the dive angle changes the most drastically (Fedak et al. 2001). Yet, if
analyzing dive profiles appears to be the best method to study diving activity, it would be best to
use either a satellite-logger or TDR in conjunction with a flipper beat sensor, beak movement
17
420
425
430
435
440
35
sensor, visual confirmation, and a Crittercam video camera. However, all of these devices would
most likely greatly reduce the turtle’s hydrodynamic properties, and potentially alter its
behaviors. Thus, researchers must continue to use their best judgment and assumptions based on
environmental as well as physiological characteristics of the turtles to define dive behaviors
based on a dive profile.
METHODS AND DEVICES USED TO COLLECT BEHAVIORAL DIVE DATA:
A great number of different data logging devices and methods including traditional
TDRs, a VTDR (Video TDR), satellite-loggers, radio/sonic telemetry, movement sensors,
accelerometers, and visual surveys were used to collect data on green turtle dive behavior in the
29 reviewed articles (Table 1). While radio and sonic telemetry, as well as TDRs and satellite-
loggers can provide a great amount of data on sea turtle behavior, they cannot describe the full
range of behavioral patterns as well as when studied by the use of visual observation (Houghton
et al. 2002). This is because the use of electronic equipment requires that inferences be made
about behavior, as described above. However, visual observation allows the study of a species in
its natural habitat and provides an understanding of its function within the ecosystem (Schofield
et al. 2006). Field observations of behavior are critical for effective conservation of an organism
(Mills et al. 2005).
It may also be possible that visual observations may uncover behaviors previously
unrecorded. For example, Schofield et al. (2006) discovered a more diverse behavioral
repertoire for breeding loggerhead turtles (Caretta caretta) than was previously known. It is
therefore possible that previous studies using inferences made from TDRs or satellite-loggers
may have incorrectly assigned behaviors to dive profiles.
18
445
450
455
460
In general, there are very few studies which use this method to measure sea turtle
behavior, especially once the use of TDRs and satellite-loggers became more feasible. However,
to verify any results or conclusions, it is important to follow up electronic data with personal
observation. Of the 29 articles using electronic equipment reviewed here, only two (~7%) used
personal observation as part of their methodology (Rice et al. 2000; Salmon et al. 2004). In Rice
et al. (2000), two students conducted visual surveys on 23 days, recording each turtle’s location,
behavior, and activity along with the time and date. Later, this data was compared with the TDR
data collected from the same turtles over the same time periods.
However, visual observations are not always feasible to attempt. It can be very difficult
to make direct observations in the ocean due to the sea depth, sea state, visibility, availability of
natural light, possibility of physical danger, and adequate access to the animal being studied
(Hooker and Baird 2001). Additionally, the presence of the researcher could influence the
natural behavior of the subject, and the study site may not always be accessible for use by people
(Witt et al. 2010). So, due to these difficulties, most studies end up relying upon inferences from
animal-borne devices (Schofield et al. 2006).
Another option besides personal observation to obtain first-hand observation of sea turtle
behavior may be to attach a video camera or VTDR (commonly National Geographic’s
Crittercam) to the sea turtle (Heithaus et al. 2002; Seminoff et al. 2006; Hays et al. 2007). The
use of VTDRs attached to a turtle (or filming their behavior in a secluded setting, such as an
aquarium; Hochscheid et al. 2005) is a great method for studying their dive behavior. VTDRs
are capable of recording video and still imagery, as well as environmental data such as time,
water depth, and water temperature (Heithaus et al. 2002). Such visual surveys can be used to
confirm the behavior of a turtle at a specific time and location. This information can also be
19
465
470
475
480
485
used to validate dive data. Three studies (Heithaus et al. 2002; Seminoff et al. 2006; Hays et al.
2007) of the 29 reviewed here (~10%) used Crittercams or VTDRs attached to the carapaces of
turtles to monitor their behavior, and analyzed these visual observations in conjunction with
other dive analyses (Table 1). Just like personal visual surveys, VTDRs may reveal behavioral
information which would be counterintuitive to data collected by other electronic loggers. For
example, a study using VTDRs showed that herbivorous green turtles occasionally forage on
jellies and ctenophores while swimming in the water column (Heithaus et al. 2002). Previously,
this was a largely unknown behavior (Hochscheid et al. 2005). Also, Heithaus et al. (2002)
found that while green turtles spent a great amount of time in seagrass habitat where they could
forage as frequently as they pleased, only two individuals were recorded grazing on the seagrass,
and both for under two minute durations. This same study also recorded green turtles swimming
to the benthos to rub themselves on rocks and sponges to clean themselves, which may have
been inferred to be foraging dives in previous studies (Heithaus et al. 2002). This shows why
personal visual surveys or the use of VTDRs are so important in any sea turtle behavioral study.
Attaching cameras to diving turtles provides an innovative method to augment diving
studies. However, these devices have their limitations. For one, these devices can be very large
and expensive. Because they are quite large, they can alter the behavior of the turtle due to their
size and bulkiness. In particular, attached devices can impair the hydrodynamics of swimming
turtles by increasing drag.
Another method used to study turtle dive behavior is to attach an electronic movement
sensor to the turtle. For instance, a beak movement sensor can determine when an animal opens
and closes its mouth (a proxy for foraging). While none of the 29 examined studies on green
turtles used this method, it was applied to loggerhead turtles (Hochscheid et al. 2005). In this
20
490
495
500
505
510
40
study, the authors placed magnets on the upper and lower jaws of the turtles, along with an
IMASEN sensor that could determine the magnetic strength between the two magnets. The
closer together the two magnets, the stronger the signal picked up by the IMASEN sensor. Thus,
the authors recorded bite frequencies and were able to determine when the turtles were foraging,
the type of prey they were ingesting, and it could even be determined when the turtles lunged at
and missed their food. And, differences in beak movement could show whether the turtle was
breathing, or just allowing regular water movement through its mouth. Beak movement, along
with a dive profile, could provide great detail regarding diving behavior and foraging strategies.
However, one must be careful as even jaw activity patterns can be misinterpreted, as inferences
made using this device may likely only refer to foraging or breathing, while the jaws can also be
used to spar, bite at cleaner fish, and are also used during self cleaning (Schofield et al. 2006).
Hays et al. (2004a) used a different type of movement sensory unit to measure green
turtle diving behavior. The authors made use of an IMASU (Integrated Movement Assessing
Sensory Unit) to measure the flipper strokes of the turtle. Similarly to the beak movement
sensor, a magnet was placed on the flipper as well as on the carapace, and the IMASU would
measure the local magnetic field, which would fluctuate as the magnets moved closer and farther
apart. Using this type of device can augment the use of TDRs or other electronic equipment to
indicate the activity level of a turtle – great activity could indicate swimming or foraging, while
little activity could indicate gliding or resting.
Radio and sonic telemetry (used in two of the 29 studies, ~7%; Renaud et al. 1995;
Makowski et al. 2006) can be used to determine the location of an animal, and thus infer its
depth, but this usually requires the scientist(s) to follow the animal with a tracking device (Witt
et al. 2010). Another option may be to place acoustic receivers at strategic locations to record
21
515
520
525
530
horizontal movements, such as done by Blumenthal et al. (2009) in the study of hawksbill diving
behavior in the Cayman Islands, but it is necessary to complement this technique with other
methods of determining the depths obtained by the turtles. Using radio and sonic telemetry can
be very costly in terms of both time and money, and the depth data may not be as precise as if it
were collected by a TDR or satellite-logger, which may explain why it is used so sparingly to
study diving behavior of sea turtles. It is important to note that many of the 29 studies shown in
Table 1 did actually use radio or sonic telemetry, but only in the use of retrieving the other
electronic devices once they became detached from the study animal. The two studies listed
using radio and/or sonic telemetry are ones which used the methodology to obtain diving data.
Another type of device used in two of the 29 studies (~7%; Yasuda and Arai 2009a;
2009b) was an accelerometer. This device is capable of recording depth, ambient water
temperature, biaxial (flipper beat) acceleration, and swimming speed. Using the combination of
all of these variables provides a clearer picture of the turtle’s behavior than just collecting depth
data alone. It is likely that the use of this type of device may increase in popularity for sea turtle
diving studies in the future.
It is important to note that 15 of the 29 studies (~52%) used more than one electronic
device to record data on turtle diving behavior. Because each device has its own
resolution/accuracy and uses different sampling rates to collect depth and temperature data
(Table 2), integrating the data and comparing results between two different devices may be
difficult even if all of the devices were used in the same location and time.
The resolution and error of electronic devices used in these studies varied greatly, from
0.04 m (Hays et al. 2001a; 2004a) to 2.0 m (Hays et al. 2000; Glen et al. 2001), and from 0.05
degrees Celsius (Hochscheid et al. 1999; Rice and Balazs 2008; I-Jiunn 2009) to 0.5 degrees
22
535
540
545
550
555
45
Celsius (Southwood et al. 2003; Makowski et al. 2006; Rice and Balazs 2008; Table 2). The
smaller the resolution and the error, the more precise the data. Surprisingly, 13 of the 29 studies
(~45%) did not report the resolution or the accuracy of their devices, making it very difficult to
infer the reliability of their results.
The data sampling rates also varied greatly, ranging from every second (I-Jiunn 2009;
Yasuda and Arai 2009b) to every 300 seconds (Hays et al. 2000; Table 2). The same principal
applies here as it does for resolution and accuracy of the device – the smaller the sampling rate,
the more accurate the data, but at the price of using up more memory on the device. It would
seem that using sampling intervals as large as 300 seconds would be inefficient as an entire dive
or surfacing interval could be missed between successive collected data points. Therefore, a
compromise somewhere at the smaller sampling rates (every 5-10 seconds) would be best to
ensure reliable data collection and to minimize memory use by the device. Six of the 29 studies
(~21%; Table 2) did not report the sampling rates of the devices they used.
The size and weight of the devices could also affect the dive patterns performed by the
turtles. Of the 29 studies being reviewed, only 14 (~48%) included information on the size and
weight of the devices they used (Table 2). Most of the devices are fairly small, and the authors
explain that they represent only 1-2% of the turtle’s body weight, making it unlikely that they
will affect their diving behavior. However, the larger the device, such as the Crittercam
(Heithaus et al. 2002; Seminoff et al. 2006; Hays et al. 2007) which weighs 2000 g, the more
likely it is to pose serious hydrodynamic problems for the turtles even if rendered neutrally
buoyant in the water.
Lastly, the electronic devices (particularly satellite-loggers) will bin the data they collect
into averages, thus minimizing the amount of data they must store and deliver. However, the
23
560
565
570
575
longer the period of time before a binning event takes place, the more details of the actual data
collected will be lost. Of the studies discussed here, binning times ranged from 0.05 hr (Brill et
al. 1995) to 12 hr (Hays et al. 2001b) intervals.
STUDYING, ORGANIZING, AND ANALYZING BEHAVIORAL DIVE DATA:
A number of different methods can be used to study and organize data turtle dive
behavior data once it has been collected. One of the most prominent methods, as discussed
above, is to display the data in a dive profile, showing depth vs. time. Dives are classified in a
variety of ways, for instance based on their maximum depth, duration, descent rate, ascent rate,
and bottom time (Fedak et al. 2001). Diving studies often use multiple metrics as evidenced by
the literature review of these 29 studies (Table 3).
The more methods used to study the dive data, the more thorough the analyses that can be
done, thereby leading to more certain results as the data collected by each different method
reinforces the others. The 29 studies discussed in this review use an average of 2.9 (±1.6 S.D.)
methods to organize the dive data. Five studies (Renaud et al. 1995; Hays et al. 2001b; 2002b;
Heithaus et al. 2002; Quaintance et al. 2002) use only one method, greatly limiting the reliability
of their results, while the studies by Hays et al. (2004a) and Yasuda and Arai (2009a) use seven
different methods, possibly making these two the most reliable of the 29 studies reviewed here.
Letter-Shaped Dives
Perhaps the most prominent way to characterize dive patterns is by classifying each dive
as a distinct type (name). In 13 of the 29 reviewed studies (~45%), this was accomplished by
organizing and naming the dives after letters in the alphabet which the dives resemble. In most
24
580
585
590
595
600
studies, dives are limited to U-dives (dives that look like the letter “U” in a dive profile) and V-
dives (dives that look like the letter “V” in a dive profile; Figure 2). The problem with
comparing the incidence of these letter-shaped dives across studies is that (different)
investigators use slightly different definitions for the dive shape, which are based not only on
other parameters (such as ascent/descent speed, bottom time) within and across dives, including
whether the dive pattern is repeated, and (most dangerously) by what behavior the turtle
performs during the dive.
The generally accepted definition of a U-dive is a dive straight to the seabed, with the
ascent and descent separated by a lengthy flat bottom profile (Glen et al. 2001). Some authors
have an even simpler definition – a dive with constant bottom depth on the seabed (I-Jiunn
2009). However, some authors define a U-dive in much greater depth. For example, Southwood
et al. (2003) make their definition of a U-dive very precise – the authors define it as a steady
descent to a maximum depth at a descent rate of 0.12 ± 0.01 m/sec, thereafter staying within 75%
of the maximum depth for a certain length of time (called bottom time) before steadily ascending
at a rate of 0.12 ± 0.01 m/sec back to the surface. Or, Yasuda and Arai (2009a) define a U-dive
as a dive where the turtle remains within 50 cm of the maximum dive depth for more than 80%
of the duration of the dive. U-dives are the most common type of dive recorded by adult female
green turtles at inter-nesting sites (Hochscheid et al. 1999). This is one of the main factors that
has led researchers to typically believe that U-dives are considered to be resting dives which help
to minimize energy expenditure and maximize reproductive output (e.g. Hays et al. 2000; I-Jiunn
2009), recent studies suggest this assumption may not be warranted since a great deal of
movement often occurs on the sea floor (e.g., Hazel et al. 2009). For example, in a study by
Hochscheid et al. (1999), U-dives were observed to include stationary and active foraging along
25
605
610
615
620
625
50
the bottom. However, in a study by Bell et al. (2009) at Raine Island in the northern Great
Barrier Reef, U-dives occurred mainly during nighttime, and were assumed to be resting dives.
Similar resting behavior on U-dives was noted by Makowski et al. (2006) and by Hays et al.
(2004a), which documented no flipper beats during the bottom portion of a U-dive, suggesting
resting behavior.
Another common letter-shaped dive is the V-dive, which has been described as an active
bounce dive (Makowski et al. 2006), in which the turtle descends at a constant rate, and once
reaching a maximum depth, immediately returns to the surface (e.g., Bell et al. 2009). V-dives
are classically shorter in depth and time than U-dives (e.g., Hochscheid et al. 1999), and are most
often associated with either foraging or searching the water column for food or a place to rest
(e.g., Southwood et al. 2003). Because multiple behaviors by turtles have been witnessed during
these dives, researchers must proceed with caution when inferring specific behaviors from
individual dive profiles.
As turtle diving is not limited to only these two shapes, other authors have used other
letters to define additional dive profile shapes. Hochscheid et al. (1999) defines an S-dive as a
dive of rapid descent to maximum depth, followed by ascent to a specific depth, a much slower
ascent over a specific time, and finally rising to the surface at a quicker ascent rate. The authors
have interpreted this type of dive as a way of saving energy by using buoyancy to float to the
surface rather than by actively swimming. In Salmon et al. (2004), W-dives were described as
two (or more) consecutive V-dives without a surfacing in the middle. This type of a dive was
demonstrated to be a foraging dive for turtles, but was only seen in leatherback (Dermochelys
coriacea) hatchlings. Furthermore, some dives do not appear to resemble a specific letter, and
26
630
635
640
645
are thus classified as “other” dive types (Southwood et al. 2003). The existence of other
unclassified dives highlights the need for other criteria beyond labeling dives by letter-shapes.
Number-Labeled Dives
Classifying dive types by assigning each dive shape an arbitrary number is another
method for studying and organizing turtle dive behaviors, but is much rarer than labeling dives
by letter. This method was utilized by 4 of the 29 studies (~14%) discussed here (Table 3).
However, just like the letter-based dive system, each study labeling dives by the number-based
system uses a slightly different definition for each dive type, and each study divides the dive
shapes into a different number of categories, further inhibiting comparisons across studies. For
example, Rice and Balazs (2008) divided dive profile shapes into four categories (Figure 3).
Type 1 dives are shallow dives less than five meters in depth. Type 2 dives are greater than five
meters deep, and longer than ten minutes, with a steep descent to depth followed by a gradual
ascent to the surface (possibly similar to a V-dive, described above). Type 3 dives are also
greater than five meters and longer than ten minutes, but the initial descent is to a depth greater
than in Type 2 dives, with a rapid ascent followed by a slow ascent (possibly similar to an S-
dive, described above). Finally, Type 4 dives are U-shaped, greater than five meters in depth,
with at least 90% of the dive spent at the maximum depth. Rice and Balazs (2008) assumed this
last type of dive was a resting dive, but this assertion is complicated by the lack of visual
confirmation. However, these dive types were associated with different habitats: Type 1, 2, and
3 dives occurred in the pelagic environment, while Type 4 dives occurred in shallow water after
their oceanic migration where the turtle could reach the bottom (Rice and Balazs 2008).
27
650
655
660
665
55
Hays et al. (2001a) used different definitions for dive Types 1 and 2. The former were
dives with steep descent to maximum depth, with a gradual ascent phase followed by a rapid
ascent phase. Type 2 dives involved diving to a deeper depth than in Type 1 dives, followed by
the same gradual and quicker ascent phases (Hays et al. 2001a).
In a study by Seminoff et al. (2006), the authors identified six different dive types (Figure
4), and showed that foraging occurred on dive Types 1, 3, and 5, both in the mid-water column
and on the bottom substrate. Resting only occurred during Type 1 dives and Type 2 dives were
used as exploratory dives to survey benthic habitat (Seminoff et al. 2006). Finally, some studies
used a combination of both letter-titled dives and number-labeled dives. Hays et al. (2004a)
describes U, V, Type 1, and Type 2 dives within their study.
Dive Angle
The six studies (out of the 29 discussed; ~21%) in which the dive angle was recorded for
green sea turtles all utilized other analysis methods (Table 3). Two studies demonstrated that
green turtle dive angle is initially quite steep (~60 degrees), followed by a much shallower angle
upon reaching the benthos (~15 degrees; Glen et al. 2001; Yasuda and Arai 2009a). This result
implies greater energy to overcome positive buoyancy at the surface, with smaller resistance at
depth. These studies suggest that dive angles of 90 degrees are very rare in marine animals,
since this would not allow to scan for profitable foraging or resting areas and to look out for
predators (Glen et al. 2001).
28
670
675
680
685
690
Flipper Beats
Counting the number of flipper beats is another great method for quantifying sea turtle
diving behavior. While this method does not require the use of a dive profile to determine dive
behaviors, it can augment the use of TDRs. Flipper beats can show if a dive is one of active
swimming, or inactive resting, and could even be a crude proxy for metabolic rate (Hays et al.
2004a). It also seems that flipper beat frequency changes with depth, similar to other diving
species such as mammals and birds (Yasuda and Arai 2009a). Of the 29 studies reviewed, only
four (~14%) used this method to analyze dive data (Table 3). All of these studies (Hays et al.
2004a; Salmon et al. 2004; Hays et al. 2007; Yasuda and Arai 2009a) used multiple methods to
study turtle dive behavior, greatly reinforcing any inferences made regarding the turtle’s
behavior.
Swimming Speed
Swimming speed, recorded in seven of the 29 reviewed articles (~24%; Table 3) is
directly related to flipper beat frequency (Yasuda and Arai 2009a), but both methods of
analyzing dive behavior are used in only three of those studies (Hays et al. 2004a; Salmon et al.
2004; Yasuda and Arai 2009a). Swimming speed could be used as an indicator of behavior –
non-movement or slow speeds likely represent resting or gliding, moderate speeds may represent
foraging or swimming, and fast speeds may represent predator avoidance. However, again, it is
unwise to infer behavior from swimming speed alone. For instance, water temperature (Frick
1976), dive depth (Yasuda and Arai 2009a), and time of day (Senko et al. 2010) may influence
swimming speed, and thus any inferences that would be made regarding behavior.
29
695
700
705
710
715
Coefficient of Variation
A relatively unused methodology to analyze dive behavior was by calculating the
coefficient of variation (CV) of the depth of the bottom phase of the dive. This was done in only
one of the 29 studies discussed here (Blumenthal et al. 2010; ~3%; Table 3), but was also used to
determine activity level of hawksbill turtles in two other studies (Blumenthal et al. 2009; Witt et
al. 2010). This method can show the variation in maximum diving depths – the larger the
variation, the more likely the turtle is to be active, possibly swimming or foraging. If the CV is a
relatively small value, the turtle is more likely to be resting or not moving while on the benthos
(Blumenthal et al. 2010). This methodology again requires inferences to be made, and would be
best to be followed up with visual confirmation of behavior.
Dive Length and Dive Depth
Classifying dives by their duration and depth was the most common method used for
analyzing turtle dive behavior in the 29 studies reviewed here (Table 3). Twenty-six of the
studies (~90%) discussed dive length, while 23 (~79%) discussed dive depth. It is likely that
some articles may have only discussed one analysis method and not the other because in a study
by Yasuda and Arai (2009a), dive length and dive depth were found to be linearly related,
meaning that only one type of analysis would be needed. Because dive length and depth are the
key components for describing a dive profile, they are critical to making inferences regarding the
behaviors associated with dives. Thus, studies that do not report one (or both) of these factors
but yet define dive behaviors should be read with caution since these metrics are essential for
objective analysis of diving behavior (e.g. Brill et al. 1995; van Dam and Diez 1996; Hays et al.
2000; Godley et al. 2002; Hays et al. 2002a).
30
720
725
730
735
60
Other Ways to Study, Organize, and Analyze Dive Behavior
Other than those methods mentioned in Table 3, there can be various other means of
studying, organizing, and analyzing dive behavior. For instance, the amount of surface activity
(number of breaths, number of surfacing events, time spent at surface, etc.) could be used to infer
dive behavior (Seminoff et al. 2001). Or, a change in water temperature could relate to changes
in dive behavior – it is likely that turtles would be more active with higher water temperatures
and less active in colder water temperatures (Blumenthal et al. 2010).
AUTHORS’ DEFINITIONS OF BEHAVIORS:
As evidenced when analyzing these articles, almost every single study uses different
definitions for foraging and resting behaviors, if discussed at all. In fact, foraging behavior was
defined in only 11 studies (~38%) and resting was defined in 17 studies (~59%; Table 4). In
summary, whereas dives of short duration with continuous depth fluctuations during the bottom
phase of the dive are considered to represent foraging behavior (e.g., Brill et al. 1995; van Dam
and Diez 1996; Makowski et al. 2006), longer dives of a continuous fixed-depth (for instance, U-
shaped dive profiles), are generally considered to be resting dives (e.g., Hochscheid et al. 1999;
Hays et al. 2000; Southwood et al. 2003).
For example, Hays et al. (2000) was confidently able to conclude that long U-dives to the
benthos were resting dives off of Ascension Island, as the adult female turtles were likely resting
between nesting attempts to maximize their reproductive output. Furthermore, because there is
little or no food available at the site, foraging is highly unlikely. Turtles are capable of storing
energy for long periods of time during these nesting events, with no need to forage (Hays et al.
31
740
745
750
755
760
2000). Conversely, short dives with heightened activity are likely associated with foraging, since
increased activity increases metabolic demands, requiring more energy to be ingested to offset
the metabolic loss (Hazel et al. 2009).
However, these definitions are not always absolute. For instance, Hays et al. (2001a)
defined a type of resting behavior in the water column, but while the turtle rose passively off the
bottom back up to the surface. Or, Schofield et al. (2006) also states that basking, where the
turtle is between the surface and one meter depth with its head and flippers lowered constitutes
as resting behavior. Thus, flexible dive behaviors cannot have absolute definitions, since they
can be influenced by a multitude of factors, discussed later in this review.
Two of the 29 studies describe two other types of behaviors – mating (Hays et al. 2001b)
and active (I-Jiunn 2009; Table 4). Schofield et al. (2006), which describes the diving behaviors
of loggerhead sea turtles, describes many behaviors (including foraging and resting) in great
length – swimming, self-cleaning, fish-cleaning symbiosis, contests between individuals, and
reproduction. To best understand how researchers are analyzing the dive data they have
collected, it helps to have a clearly stated definition of the behaviors they are describing.
STUDY SITE LOCATIONS:
Green turtle diving behavior studies have taken place in a wide variety of locations,
ranging from tropical to subtropical regions all over the world (Bjorndal 1980; Southwood et al.
2003). A comparison of the locations of the 29 studies reviewed can be found in Table 5.
Fourteen of the 29 studies (~48%) focused on inter-nesting sites, with the majority being
published in the early part of the 2000s. Many studies took place either off Cyprus (Hochscheid
et al. 1999; Glen et al. 2001; Godley et al. 2002; Hays et al. 2002a; 2002b) or Ascension Island
32
765
770
775
780
65
(Hays et al. 1999; 2000; 2001b; 2002a; 2002b; 2004a). It was not until the mid to late 2000s that
a greater number of studies were conducted at foraging sites (e.g., Makowski et al. 2006;
Seminoff et al. 2006; Hays et al. 2007; Hazel et al. 2009; Blumenthal et al. 2010). This pattern
follows the same trend of TDR application – the first study locations were nesting beaches,
where turtles were easily captured and tagged, with high certainty that the nesting mothers would
return to the beach before migrating away as female turtles lay multiple clutches in one nesting
season (Balazs et al. 1987; Åkesson et al. 2003). Later in the decade, with the advent of more
advanced TDRs, the devices were used at foraging sites, as well. Additionally, there had been a
general paucity in data regarding turtle diving behavior at foraging locations before the mid-
2000s, which prompted a large number of studies at this type of location with the advancement
of the TDR technology.
Only five of the 29 studies (~17%) focus solely, or in part, on the diving behavior during
migration (Hays et al. 1999; Hays et al. 2001a; Godley et al. 2002; Hatase et al. 2006; Rice and
Balazs 2008), likely because there is a great amount of published literature regarding marine
turtle migrations across ocean basins. Conversely, only one study took place in a nursery habitat
location (Salmon et al. 2004), due to the difficulties associated with tagging and tracking newly
hatched turtles. To accomplish this study, the authors raised the turtles in their own facility and
attached tracking devices which were nearly the size of the turtles themselves, which could have
greatly biased the results of their research.
STUDY SAMPLE SIZES:
The number of turtles tagged in behavioral studies is generally very small (Table 5). The
average number of turtles tagged (with usable data) in the 29 studies being discussed was 9.2 (±
33
785
790
795
800
805
8.1, S.D.) turtles. Such a small number of turtles could greatly bias any results, especially since
it is possible that each turtle could display unique behavior, greatly inhibiting the analysis. In
fact, of the 29 studies, 11 (~38%) studied five or less turtles, with two studies using only one
turtle for its entire study (Rice et al. 2000; Glen et al. 2001). The largest number of green turtles
studied was 33 by Salmon et al. (2004) and 34 by Seminoff et al. (2006). Studies conducted at
foraging sites used the most turtles per study, at an average of 10.5 (± 9.4, S.D.). Studies
regarding at sea migrating behavior used on average 8.8 turtles (± 5.7, S.D.), and inter-nesting
sites collected data from an average of 5.7 turtles (± 3.4, S.D.) per study. It is very likely that
most studies use a small number of turtles because the satellite-loggers and TDRs are quite
expensive – one device can cost $3000-5000, greatly limiting the number that can be used.
Additionally, research permits to attach these devices to turtles can be difficult to obtain and
expensive as well.
FACTORS INFLUENCING DIVE BEHAVIOR:
In the articles reviewed, a whole host of factors influenced turtle behavioral patterns
(Table 6). Of the ten different factors discussed here, seven articles (~24%) only addressed two
of these factors, while one article amazingly discussed none of them (Yasuda and Arai 2009b).
Two articles (~7%), however, discussed the maximum of seven of these ten factors (Hazel et al.
2009; Yasuda and Arai 2009a). It is very likely that there are many other factors not discussed in
these articles or in this literature review that could potentially be important in understanding and
analyzing green turtle dive behavior. For instance, tidal influence is not discussed by any of the
29 articles. The factors specifically mentioned in the reviewed articles are discussed below.
34
810
815
820
825
830
Turtle’s Activity at Site
The turtle activity at the dive location (nesting, foraging, migrating, etc.) influences the
dive behaviors of green sea turtles. In turn, these activities are influenced by habitat type and
quality (Hays et al. 2002a; Makowski et al. 2006). This pervasive factor affecting turtle behavior
was discussed in 22 of the 29 articles (~76%; Table 6).
Generally speaking, green turtles are more quiescent while at inter-nesting habitats, and
remain quite active during migration (Hays et al. 1999). Yet, the local habitat characteristics
influence their diving behavior. For example, green turtles off the coast of Ascension Island and
Japan dive to similar depths (20-25 m), but at Ascension Island, they engage in resting dives to
the sea floor (Hays et al. 2000), while off Japan they engage in foraging as well as resting dives
(Hatase et al. 2006). Therefore, the turtle’s activity at the site drives their behaviors – to feed in
an area of great forage (Japan), and to perform resting dives in an inter-nesting location
(Ascension Island, Hays et al. 2001b). Moreover, feeding habits of green turtles may also differ
based on the foraging location of the turtle, for instance if it is foraging while free-swimming in
the open ocean or while on a shallow coral reef habitat, or foraging on a shallow mud flat (Brill
et al. 1995; Hochscheid et al. 2005). When at foraging locations, it is likely that turtles may
actually avoid diving into deeper water due to a lack of forage available there (Senko et al.
2010), thereby avoiding their primary purpose for being in the area in the first place.
It is generally believed that turtles do not forage at nesting grounds because food is
usually sub-optimal (Godley et al. 2002). Instead, the inter-nesting behavior of marine turtles is
generally related to optimizing their energy reserves in a way most suited to the local conditions
associated with nesting (Houghton et al. 2002). Energy conserved during this time period can
greatly influence their reproductive output (Hays et al. 2000). Upon arriving at Ascension Island
35
835
840
845
850
70
after their oceanic migration, the duration of dives tends to be quite short (average of 7.3
minutes), but during the inter-nesting period, they are much longer (average of 22.1 minutes).
Additionally, turtles performed shallower dives immediately after nesting, with dives becoming
deeper gradually over the following days. Prior to the next nesting event, however, dives once
again became very shallow (I-Jiunn 2009). These results suggest inactivity during the inter-
nesting period, specifically around nesting events, with lower metabolic rates and aerobic dive
limits (Hays et al. 1999).
Even though these are inter-nesting sites, where resting dives tend to be more of the
norm, there is evidence that diving is shaped by the local environmental conditions (Hochscheid
et al. 1999; Hays et al. 2002a). Off the coast of Cyprus, another inter-nesting location, green
turtle dives are concentrated in shallow water seagrass areas, creating great variation in the dive
profiles (Hochscheid et al. 1999; Hays et al. 2002a). On the other hand, at Raine Island, off the
coast of Australia, turtles dive in shallow water habitat adjacent to the reef edge and return to the
shallow reef structure for refuge at night (Bell et al. 2009).
During oceanic migrations, turtles occasionally perform deep dives with steep descents
(which are not possible in shallow habitats), followed by a very gradual ascent back to the
surface (Hays et al. 2001a; Hatase et al. 2006). While green turtle dives tend to be short (three to
four minutes) with near surface traveling, lengthier dives of thirty minutes have been recorded,
suggesting that the turtles may actually be resting just below the water surface (Hays et al. 1999;
Godley et al. 2002). There is no need for green turtles to make deep dives while migrating, as
they do not need to search for prey in the deep water, as other species of sea turtles do.
Remaining close to the surface, therefore, minimizes the energetic cost of traveling, explaining
why the turtles stay close to, but not at, the surface (Godley et al. 2002). It has been
36
855
860
865
870
875
experimentally calculated that drag on the sea turtles is minimized at the depth of 2.5 to three
times the animal’s body thickness, and therefore turtles should spend the majority of their time
during migration at a depth of 0.9-1.5 m. During the migration from Ascension Island to Brazil,
TDRs confirmed that green turtles were performing short (two to four minutes), shallow (0.9-1.5
m) dives, consistent with near-surface traveling (Hays et al. 2001a).
Longer dives during open-water migration are generally associated with inactivity, since
herbivorous green turtles likely do not feed during migration (Hays et al. 1999). However,
Hatase et al. (2006) has shown that green turtles may actually forage on plankton and jellyfish
throughout their deep-water migrations, suggesting that the oceanic habitat turtles migrate
through may influence their diving behavior. Nevertheless, if long and deep dives do occur, they
are usually near the end of the migration along the coastline, possibly suggesting that turtles are
using shelf-break structures to rest or forage (Godley et al. 2002).
Water Temperature
Water temperature is another factor discussed in green turtle dive behavior studies (11
out of 29 studies, ~38%; Table 6). As green turtles cannot raise their body temperature more
than one to three degrees Celsius above the water temperature year-round (Sato et al. 1998;
Southwood et al. 2003), it is expected that a tight coupling between water temperature and turtle
behavior should exist (Godley et al. 2002). Turtles can use different behaviors to thermo-
regulate. In Kaneohe Bay, they make use of the mud bottoms to avoid overheating in warm
water (Brill et al. 1995). For instance, offshore movement of two turtles changed within a few
days of each other, which was attributed to the change in water temperature (Godley et al. 2002).
In a foraging ground off Australia, colder water temperatures influenced dive durations by green
37
880
885
890
895
75
turtles. Cold water dives were three to four times longer in mean duration and six times longer
in maximum duration than warm water dives (Hazel et al. 2009). In other situations, green
turtles are known to bask on shore, where they can raise their body temperatures by ten degrees
Celsius (Whittow and Balazs 1982), which may allow them to be more active in cooler water
temperatures. Thus, turtles likely are expected to change their behavior in different water
temperatures.
Because water temperature is expected to influence turtle physiology, such as metabolic
rate and energy input/output, eight of the 11 studies discussing water temperature also discuss
these factors. Turtles have been shown to have a lower metabolic rate in colder water (Sato et al.
1998; Hazel et al. 1999; Hays et al. 2002b; Southwood et al. 2003). This may help to explain
longer and deeper dives at inter-nesting sites such as Ascension Island (Godley et al. 2002).
Buoyancy was also another important factor, with eight of the 11 studies also discussing this
factor.
Season
Even though a large sample of these papers discusses factors relating to water
temperature, very few look at the larger scale of how seasons can affect turtle behavior (only five
out of 29, ~17%; Table 6). Seasonal change in behavior is likely the result of environmental and
physiological factors (Southwood et al. 2003). In particular, green turtles may alter their
behavior due to multiple cues from seasonal change: water temperature, photoperiod, and food
availability. Some studies have shown that during winter, turtles tend to dive deeper and longer
than in the spring and summer (e.g., Godley et al. 2002; Southwood et al. 2003). In a study of
the inter-nesting site of Cyprus, green turtles were recorded spending the warmer months at
38
900
905
910
915
920
shallower depths and diving deeper (>45 m) during the winter. Furthermore, turtles spent less
time at the surface in winter than during spring and summer (Godley et al. 2002). At Heron
Island, Australia, green turtles also showed great variability in their mean dive depths by season:
diving to 4.4 ± 0.6 m (S.E.) in winter and to 2.9 ± 0.4 m (S.E.) in summer. Accordingly, winter
dive durations nearly doubled those observed in summer (Southwood et al. 2003).
It is possible that during the cold winter months, turtles may enter a state of diapause
(hibernation) or may migrate to warmer waters. These behaviors are common in turtles, but
mainly in freshwater turtle species which are capable of remaining submerged for many months,
capable of surviving in frozen water (Godley et al. 2002). This phenomenon has very rarely
been recorded for any marine turtle species. Sea turtles may simply avoid cold water by
migrating seasonally, as has been recorded by sea turtles in the Atlantic Ocean (Mendonca 1983;
Musick and Limpus 1997). However, in sites and instances when adverse conditions cannot be
avoided, sea turtles may engage in hibernation (Godley et al. 2002).
Tide
None of the 29 articles reviewed here discussed how tidal movements may influence a
turtle’s dive behavior (Table 6). However, in a study by Brooks et al. (2009), tracking the
horizontal movement patterns (but not the diving patterns) of green turtles in the East Pacific, it
was shown that movement patterns were circa-tidal. Turtles floated along with the tide, allowing
them to exploit a patchy distribution of algae in the region. Because this behavior may help to
explain how green turtles forage, tidal movements may influence dive behavior. Also, by
traveling with tides, turtles can expend less energy to reach their habitats or destinations (Hazel
39
925
930
935
940
2009), and thus focus more energy to their diving behavior. However, further studies are needed
to determine this potential relationship.
Time of Day
As discussed in 19 of the 29 papers (~66%; Table 6), turtle diving behavior is greatly
influenced by time of day (e.g., Brill et al. 1995; Makowski et al. 2006; Bell et al. 2009). For
example, in studies by Mendonca (1983) and Brill et al. (1995), green turtles showed specific
diving depths during day and night times. And, at Ascension Island, more resting dives were
recorded during nighttime than during daytime (Hays et al. 2000).
As with season, the time of day may also influence the way in which dives are
categorized and studied. In research by Hays et al. (2001a), the authors documented a higher
incidence of Type 1 and 2 dives at night than during the day. At Raine Island in the northern
Great Barrier Reef, flat-bottomed U-dives were recorded extensively at night (Bell et al. 2009).
In some locations, turtles perform different diving behaviors during the day than at night.
In Kaneohe Bay, most turtles spent daytime hours in deep mud channels, while only a few would
remain in the shallower foraging grounds (Brill et al. 1995). While the peak foraging times for
green turtles are after dawn and in the late afternoon (Bjorndal 1980; Mendonca 1983), foraging
occurs throughout the day (Southwood et al. 2003).
Some studies report that turtle diving behavior at night is characterized by short, shallow
dives. For example, at Heron Island off Australia, there are visual observations of shallow
resting dives (Southwood et al. 2003). In Kaneohe Bay, Hawai’i, green turtles also perform
short, shallow dives at night, but these are foraging dives (Brill et al. 1995). During their inter-
nesting interval at Ascension Island, female green turtles perform short resting dives at night
40
945
950
955
960
965
80
leading up to their nesting events. However, some individuals perform long, deep dives at night,
especially at the beginning and end of the inter-nesting interval (Hays et al. 1999). Off the coast
of Japan, green turtles were recorded resting in water over 20 m depth at night, much deeper than
their traveling depths during the day (Hatase et al. 2006). Also at a foraging site off Florida,
longer, deeper dives were made at night than during the day. Additionally, night dives were
always to a constant depth while daytime dive depths were much more variable, suggesting
foraging during daylight hours and resting at night (Makowski et al. 2006). The same pattern of
short, shallow diurnal foraging dives and longer, deeper nocturnal dives was also recorded at
Heron Island, suggesting the turtles were more active during the day (Hazel et al. 2009). Many
studies show that green turtles prefer deeper water at night (e.g., Bjorndal 1980; Seminoff et al.
2001; Makowski et al. 2006; Taquet et al. 2006; Hazel et al. 2009), but other studies show that
turtles prefer shallower water at night (e.g., Brill et al. 1995; Seminoff et al. 2002; Southwood et
al. 2003; Yasuda and Arai 2009a). This result underscores that variability in dive behavior exists
even within individual turtles.
Green turtles also engage in day/night differences in diving during migrations. During
transit between O’ahu, Hawai’i and the Northwest Hawaiian Islands, turtles make short, shallow
dives during the day (1-18 min, 1-4 m), and long, deep dives in the evening and at night (35-44
min, 35-55 m). One turtle even dove down to 135 m at night, the deepest dive ever recorded for
a green turtle. The authors found this deep diving behavior unexpected as they would slow the
turtle’s migration toward its final destination (Rice and Balazs 2008). However, the same diving
behavior of long, deep dives at night and short, shallow dives during the day was recorded by
Hays et al. (1999) when studying turtles migrating between Brazil and Ascension Island. These
authors attributed the deeper dives to mid-water resting dives due to an innate diurnal cycle
41
970
975
980
985
990
driving the turtles to sleep during the night and travel during the day (Hays et al. 1999). The
reasons that some turtles dive deeper at night during some migrations, while in other locations
they dive deeper during the day remain unknown. However, this disparity may be related to diel
cycles in prey availability and predation risk, with additional individual variability (Hazel et al.
2009).
Current
While currents may affect green turtle dive behavior, they are seldom reported in the
literature, discussed in only two studies (~7%) of the 29 reviewed here (Hays et al. 1999; Yasuda
and Arai 2009a; Table 6). It is likely that this factor plays a key role in determining dive
behavior during long migrations (Brooks et al. 2009). In the study by Hays et al. (1999), green
turtles followed the west-southwest currents away from Ascension Island toward Brazil to begin
their migration. It was concluded that currents play a major role in navigation and orientation for
green turtles, and that they help to disperse newly hatched offspring leaving the island (Hays et
al. 1999). If currents assist in migration, leading to less energy output by the turtles, they may
allow them to stay at the surface rather than dive down to the depth of least resistance, as
discussed above.
Gender
Turtle gender was only discussed in one study (~3%) reviewed here (Hays et al. 2001b;
Table 6). Because the great majority of green turtle dive behavior studies take place at nesting
beaches and inter-nesting locations, female green turtles are tagged much more often as they are
the ones to come ashore to lay eggs for a few hours at a time, making it quite easy to attach either
42
995
1000
1005
1010
85
a TDR or satellite-logger to their carapace. However, this means that very little is known about
male green turtle dive behavior (Hays et al. 2001b). And, at foraging locations, if the majority of
turtles are sub-adult or immature in age, it is nearly impossible to tell female from male turtles.
In the study by Hays et al. (2001b), two male adult green turtles were captured in the water at
Ascension Island and tagged with satellite-loggers. During the mating season, it was shown that
males performed much shorter dives than females. This suggests that males maintained much
higher activity levels than females throughout the inter-nesting period, most likely because they
are trying to locate and mate with as many females as possible to maximize their reproductive
output. At the end of the inter-nesting period, male turtles would make much longer resting U-
dives to build up energy for their long migration back to South America. Thus, it was concluded
that green turtle resting behavior had very different implications for males and females during
the inter-breeding season at Ascension Island – it was good for females to rest as the energy
saved during these resting dives was used to maximize their egg-laying potential, while resting
dives were considered negative for male turtles as it would mean lost time to potentially mate
with female turtles (Hays et al. 2001b).
Buoyancy
Buoyancy is another important factor affecting green turtle dive behavior, which was
discussed in 15 of the 29 articles (~52%) reviewed in this paper (Table 6). Unlike other diving
animals such as penguins and seals, turtles take a breath before diving to adjust their lung
volume to attain neutral buoyancy at their maximum depth (Milsom 1975; Hays et al. 2000;
Houghton et al. 2002). At the start of a dive, turtles are positively buoyant with air in their lungs.
As the dive continues and depth increases, lungs collapse proportionately to the change in
43
1015
1020
1025
1030
1035
pressure according to Boyle’s Law, causing buoyancy to decrease (Glen et al. 2001; Hays et al.
2007; Yasuda and Arai 2009a). If the dives are deep enough, neutral, and potentially negative
buoyancy will be reached (Hays et al. 2007). Studies have estimated that the maximum neutral
buoyancy for a green turtle, based on fully inflated lungs, ranges between 15 and 20 meters in
depth (Hays et al. 2004b), most likely near 19 m (Hays et al. 2000). Quite often, however, turtles
will dive with only partially inflated lungs so that they reach neutral buoyancy at the desired
depth (Hays et al. 2004b). Upon ascent, the lungs of the turtles expand once again, allowing the
turtle to gain positive buoyancy as it rises, possibly assisting with the surfacing event (Hays et al.
2007). In a study by Glen et al. (2001), turtles started their dive at a large angle (60 degrees),
lessening the dive angle to 15 degrees upon reaching the bottom substrate. This allowed the
turtles to get through the most buoyantly resistive zone (near the surface) most efficiently (Glen
et al. 2001).
Buoyancy directly relates to energetics and metabolism. A steep initial descent, as shown
in the study by Glen et al. (2001) requires a greater energetic effort to overcome the positive
buoyancy at the surface. In a study by Hays et al. (2007), turtles worked hardest at the surface,
and would beat their flippers 60-80 times per minute to overcome positive buoyancy, while they
decreased their swimming effort to 25-40 beats per minute after the first 30 seconds of the dive.
To start their ascent, turtles would beat their flippers 30 times per minute, with the rate lessening
as the ascent continued, and would glide near the end of the dive up to the surface. This graded
effort during different phases of the dive optimizes energy potential for fighting buoyancy (Hays
et al. 2007), indicating that changing levels of buoyancy has important implications regarding
turtle diving behavior (Hays et al. 2004b). This same pattern of flipper beating was documented
in hatchling green turtles, aged 1-10 weeks old (Salmon et al. 2004). Additionally, it is rare for a
44
1040
1045
1050
1055
turtle to dive below 19-20 m, as this is their maximum neutral buoyancy depth. Diving deeper
than this depth would cause negative buoyancy, leading the turtles to sink deeper, needing to
expend more energy to overcome the negative buoyancy when returning to the surface (Hays et
al. 2001a).
Energetics / Metabolism
As shown in Table 6, energetics and metabolism may be one of the most important
factors influencing green turtle dive behavior, as it is discussed in 21 of the 29 articles (~72%).
Blood oxygen stores are important for animals which perform breath-held dives – these animals
typically have high blood hemoglobin levels (Brill et al. 1995). Berkson (1966) showed that the
oxygen content within the lungs of green turtles is 17.4%, while Lutz and Bentley (1985) showed
that blood and muscle tissue of green turtles can hold 6.7 mL of oxygen per kg, allowing them to
remain submerged for extended periods of time. During submergence, green turtles show a
reduced heart rate and cardiac output. With the turtle’s heart rate dropping by approximately
70% while diving (Southwood et al. 1999; Hochscheid et al. 2005), only the brain, heart, and
lungs are continually irrigated by blood during dives (Brill et al. 1995).
Submergence intervals undertaken by green turtles are strongly related to their activity
level (Brill et al. 1995). If the turtle performs vigorous activity throughout a dive, such as
foraging or swimming, turtles tend to surface sooner than if they perform resting dives
(Southwood et al. 2003). Because heightened activity leads to increased metabolic costs and
faster utilization of oxygen stores (Hays et al. 2004b), the turtle must return to the surface sooner
to replenish the oxygen lost during the active dive. Thus, aerobic dive limits would be reached
quicker by smaller sized green turtles as they have smaller volumes of tissue to store oxygen, and
45
1060
1065
1070
1075
1080
90
higher metabolic rates (Salmon et al. 2004); thus larger turtles are capable of performing longer
aerobic dives with a larger lung capacity (Blumenthal et al. 2009). After a long dive, turtles must
surface to replenish their oxygen stores. Thus, the longer a turtle spends submerged, the longer it
spends at the surface following the dive in order to replenish the oxygen lost during the previous
dive and to release built up carbon dioxide (Hays et al. 2000).
Turtles rarely, if ever, dive to their aerobic limits, meaning that they do not need to spend
long surface intervals restoring their oxygen supply. At Ascension Island, resting turtles would
surface after depleting approximately 50% of their oxygen stores (Hays et al. 2000). A study by
Berkson (1966) initially concluded that a turtle could survive oxygen depletion for up to five
hours underwater. However, this may have pushed the turtles into their anaerobic limits. More
recently, Lutcavage and Lutz (1991) determined that it would take over 60 minutes submerged
underwater for a green turtle to reach its aerobic limit. Since almost all dives recorded in the 29
reviewed studies were shorter than 60 minutes, green turtles seem to dive well below their
aerobic limit on any dive.
No matter what type of dive a turtle is performing, it is important for it to minimize its
energy loss or maximize its energy gain on every dive that it makes. Measuring a turtle’s
metabolic rate is a great way to assess their energetic loss/gain, as both go hand-in-hand (Hays et
al. 1999). One method for turtles to maximize energy savings during a resting dive is to dive as
deep as possible, while still maintaining neutral buoyancy, as the deeper the depth, the slower the
metabolic respiration rate (Hays et al. 2002a), and less energy needed to fight positive or
negative buoyancy to stay in place (Houghton et al. 2003). To minimize energy loss while
ascending at the end of a dive, a turtle might rise passively, engaging in what could be
considered to be a mid-water resting dive (Hays et al. 2001a). As stated previously, migrating
46
1085
1090
1095
1100
1105
turtles can maximize energy savings by traveling near the surface in the zone of least resistance,
at a depth approximately 2.5 times its diameter to swim (Godley et al. 2002). Another method to
minimize metabolic rate would be for the turtle to bask in the sunlight on the shore (Swimmer
and Balazs 2000). Additionally, basking on the shore (rather than the sea surface) saves energy
as the turtle does not need to swim to the surface to breathe (Quaintance et al. 2002). On
foraging dives, it may be more important to maximize energy gain rather than minimizing energy
expenditure (Hays et al. 2002a). For benthic foraging to be beneficial, the energy gained by
foraging must outweigh the energy used to descend, forage, and ascend back to the surface.
Therefore, foraging dives may be shorter than resting dives since they use more energy, and thus
deplete oxygen stores faster (Houghton et al. 2003).
However, not all turtle behaviors can be explained merely using these energetic
considerations. For instance, resting in shallow water suggests that metabolic rates would be
higher than resting in deeper depths, and thus the turtle would need to surface sooner to replenish
its oxygen store. During migrations between O’ahu and the Northwest Hawaiian Islands, green
turtles routinely dove deeper than 20 m during their resting dives. This behavior suggests that
they dove to depths in which they were negatively buoyant, implying that they would need to
actively swim to keep from sinking. Moreover, the turtle would need to use more energy to
overcome the negative buoyancy and to return to the surface (Rice and Balazs 2008). It is very
likely that other factors influence turtle behavior in these scenarios beyond mere energetics.
Predator Avoidance
Predator avoidance may be another factor which greatly influences dive behavior, as
discussed in eight of the 29 reviewed articles (~28%; Table 6). By diving to the sea floor and
47
1110
1115
1120
1125
95
resting near vertical structures, turtles minimize chances of being preyed upon while resting
(Seminoff et al. 2006). Furthermore, by diving to deep depths, turtles can reduce the silhouette
their body makes against the surface, reducing the chance of being detected by a shark. This
behavior has been used to explain the deep dives of migrating turtles between Ascension Island
and Brazil (Hays et al. 2001a), and provides a possible explanation for the deep dives conducted
by green turtles during their migration between O’ahu and the Northwest Hawaiian Islands (Rice
and Balazs 2008). Similarly, deeper dives in shallow water habitats during the night and
shallower dives to hide within reefs during the day have been explained as a means to avoid
shark predation (Makowski et al. 2006; Bell et al. 2009). And, hatchling green turtles at
Tortuguero, Costa Rica, would slow their swimming speed toward the open ocean to dive to
avoid predation by frigate birds (Frick 1976). Additionally, turtles generally have not been
witnessed to dive at completely vertical angles to the sea floor. A possible explanation for this
may be that 90 degree dives may limit their visibility to detect approaching predators, reducing
their amount of vigilance in the event they must evade a predator (Glen et al. 2001).
Very little attention has been given to predator avoidance – of the eight articles
mentioning this factor, it was normally only briefly mentioned. One in-depth study (Heithaus et
al. 2007) showed that skinny, unhealthy turtles take up habitat in foraging areas more at risk of
predation (high risk, high reward) while fatter, healthier turtles lived in less profitable foraging
habitats, but with less predation (low risk, low reward). However, no empirical studies (only
modeling studies) have tested the effects of predation on diving behavior of green turtles.
Further research in this area is greatly needed to best understand how turtles utilize their habitats,
possibly by tagging both predator and prey with TDRs or satellite-loggers to evaluate how both
organisms interact with their environment and each other.
48
1130
1135
1140
1145
1150
Other Factors
A few other factors affecting dive behavior were briefly mentioned throughout the 29
reviewed articles. The turtles’ food source may affect their dive behavior – off the coast of
Japan, green turtles foraging on zooplankton in deep water follow the diel vertical migrations of
their prey (Hatase et al. 2006). Additionally, the turtle’s proximity to reefs and forage (for food
and shelter) may affect their movements (Brill et al. 1995). Wave action could also influence
dive behavior (van Dam and Diez 1996), or the need to be cleaned, whether visiting a cleaning
station (Losey et al. 1994) or diving to rub its body against rocks (Heithaus et al. 2002) could
alter diving patterns.
Another factor which could greatly affect turtle diving behavior is that of human activity
(Seminoff et al. 2001; 2002). For instance, boat activity could also influence a turtle’s dive
behavior. While the capacity of turtles to avoid fast moving vehicles is still poorly understood, it
has been shown that as boats increase their speed, it is more difficult for turtles to avoid them
(Hazel et al. 2007).
CONCLUSIONS:
There appears to be no easy means for studying turtle dive behavior. The use of
electronic tags which can be attached to the carapace of a turtle have helped researchers make
great advances in dissecting how and why green sea turtles behave the way they do. However,
each type of device used, whether it be a satellite-logger or a TDR has its own drawbacks, and
careful consideration must be done to decide which type of device is best suited for the particular
hypothesis and study at hand. Also, researchers must take into account the large array of factors
49
1155
1160
1165
1170
which can affect an individual turtle’s dive behavior, and each must be given due process toward
a final conclusion regarding the reasons behind a turtle’s behavior.
In general, there is very little known about the habitat needs and movements of juvenile
green turtles (Hart and Fujisaki 2010). Few studies (e.g., Southwood et al. 2003; Makowski et
al. 2006; Hazel et al. 2009) were focused on the diving behavior of juvenile green sea turtles, as
most studies focus on the inter-nesting period of adult females (Rice and Balazs 2008). Studying
this age group is particularly more difficult because their movement patterns and residency times
within a foraging habitat are much less predictable, leading to a higher risk of not retrieving the
devices (and the dive data within). Therefore, most of our current knowledge regarding green
turtle diving behavior is limited to adult females during the breeding, inter-nesting, or post-
migration periods (Seminoff et al. 2001; Godley et al. 2008; Hazel 2009).
After their vast oceanic migrations, green turtles leave the pelagic stage and return to the
shallows to forage and grow to maturity in developmental habitats (Bjorndal 1980; Musick and
Limpus 1997). Knowledge of turtle behavior after they finish their oceanic migration is very
small (Godley et al. 2002). Currently, it is thought that turtles maintain distinct home ranges in
their foraging grounds, and some return to the same grounds during different breeding seasons
(Limpus et al. 1992). These shallow foraging grounds are more susceptible to the dangers posed
by human activity (Campbell and Lagueux 2005), and therefore are in great need of study.
In my proposed master’s thesis, I will study the vertical movements of juvenile green
turtles in the Kawai’nui Marsh Estuary, an area approximately 0.5 x 0.5 km2
at the northern end
of Kailua Bay, O’ahu, Hawai’i. This area is known to have a dense aggregation of juvenile
green turtles year-round, many of which are resident at the location at different times of the year,
or throughout the whole year (Asuncion 2010). This location is an area of high human use,
50
1175
1180
1185
1190
1195
100
including activities such as boating, kayaking, and fishing year-round (personal observation).
Understanding how the turtles utilize the site is important to determine if human activity impacts
these turtles in any way, and if regulations need to be put in place to protect this recovering
species in this location.
Therefore, a few of the studies discussed within this review will be of most use in the
study I have proposed. For instance, the study by Brill et al. (1995) is of direct relevance as the
study was conducted in Kaneohe Bay, a foraging ground for green turtles, which is directly next
to Kailua Bay, where my proposed study will take place. However, adult green turtles are
known to live in Kaneohe Bay, while juveniles take up residence in neighboring Kailua Bay. It
is very likely that I will used the same definitions used by Brill et al. (1995) to describe foraging
and resting behaviors: foraging dives will be composed of short and irregular submergence
intervals, while resting dives will be regular long submergence intervals (Table 4). Because the
Kawai’nui Marsh Estuary is a relatively shallow site, depth may not play a factor in the
foraging/resting behaviors by the turtles.
Another important study relating to my own is that of Southwood et al. (2003). Even
though this study took place in Heron Island, Australia, it was one of the first to investigate the
diving behaviors of juvenile green turtles within their foraging habitat. The sampling rates used
by the author (either every five or 10 seconds for depth, every 60 seconds for temperature; Table
2) provide a trade-off between collecting fine-scale data without using up memory capacity too
quickly. Makowski et al. (2006) performed a study regarding juvenile turtle diving behavior
within a foraging ground, off Palm Beach, Florida. The authors used a Lotek Wireless TDR
(Table 1), a very similar device to the ones which will be used in my proposed study, along with
acoustic tracking of the turtles, with conclusive results.
51
1200
1205
1210
1215
1220
Even though Blumenthal et al. (2009), Witt et al. (2010), and Schofield et al. (2006)
discuss the behaviors of sea turtle species other than green sea turtles, these articles are quite
pertinent to my own research. Blumenthal et al. (2009) discusses hawksbill diving behavior in
the Cayman Islands; the methods used by Blumenthal et al. (2009) are very pertinent to my own
study. Similar to Makowski et al. (2006), the authors used TDRs along with acoustic tracking to
measure both the horizontal and vertical movements of the turtles. However, Blumenthal et al.
(2009) also used focal observation to study hawksbill turtle diving behavior, marking the turtle’s
immediate behaviors when it was initially captured and then recaptured to retrieve the electronic
devices. However, this is just a basic form of visual observation of turtle behavior, and my study
will utilize a more in depth methodology regarding visual surveys. Additionally, Witt et al.
(2010) used Lotek TDRs along with acoustic transmitters on hawksbill turtles, which is also very
similar to my own methodology. And, Schofield et al. (2006) uses a variety of visual survey
methods to measure loggerhead diving behavior, like snorkel-swim surveys in which surveyors
followed transects parallel to shore at a depth of three meters. Even though this surveying
methodology is different than my own, it obtained thorough results and comparisons could be
drawn to my own research.
Lastly, however, the article that will likely be the most significant for my research is that
of Hazel et al. (2009). In this study, the diving behaviors of foraging juvenile green turtles
within a distinct home-range were quantified by the use of a TDR, with depth being recorded
every 15 seconds (Table 2), still an acceptable range for collecting data in fine detail. The
authors define foraging as short dives with consistent activity, and resting dives as dives of
longer submersion with fewer surfacing events (Table 4). This may be the same pattern for the
juvenile green turtles in my study site, since both foraging habitats are so similar in available
52
1225
1230
1235
1240
105
food and depth. The authors took time to discuss seven different factors which potentially affect
dive behavior (the turtle’s purpose at the site, water temperature, season, time of day, buoyancy,
energetics/metabolism, and predator avoidance; Table 6).
Research on turtles at small foraging sites remains scant, with the few existing studies
focusing on regions where human-induced turtle mortality is not a concern (Rice and Balazs
2008). My research will shed some light on turtle behavior in a human-impacted area, and will
help to lead the field toward devising ways to protect these juvenile turtles in their foraging home
ranges.
REFERENCES:
Åkesson, S., Broderick, A.C., Glen, F., Godley, B.J., Luschi, P., Papi, F., and Hays, G.C. 2003.
Navigation by green turtles: which strategy do displaced adults use to find Ascension
Island? OIKOS 103:363-372.
Asuncion, B. 2010. Characterizing juvenile green sea turtle (Chelonia mydas) habitat use in
Kawai’nui, O’ahu: a multi-disciplinary approach. Master’s thesis, Hawai’i Pacific
University, Kaneohe, HI. 89 pp.
Balazs, G.H., Forsyth, R.G., and Kam, A.K.H. 1987. Preliminary assessment of habitat
utilization by Hawaiian green turtles in their resident foraging pastures. U.S. Dep.
Commer., NOAA Tech. Memo. NOAA-TM-NMFS-SWFC-71, 107 p.
Bell, I.P., Seymour, J., Fitzpatrick, R., and Hogarth, J. 2009. Inter-nesting dive and surface
behaviour of green turtles, Chelonia mydas, at Raine Island, Northern Great Barrier Reef.
Marine Turtle Newsletter 125:5-7.
Berkson, H. 1966. Physiological adjustments to prolonged diving in the Pacific green turtle
(Chelonia mydas agassizii). Comparative Biochemistry and Physiology 18:101-119.
Bjorndal, K.A. 1980. Nutrition and grazing behavior of the green turtle Chelonia mydas. Marine
Biology 56:147-154.
Blumenthal, J.M., Austin, T.J., Bothwell, J.B., Broderick, A.C., Ebanks-Petrie, G., Olynik, J.R.,
Orr, M.F., Solomon, J.L., Witt, M.J., and Godley, B.J. 2009. Diving behavior and
movements of juvenile hawksbill turtles Eretmochelys imbricata on a Caribbean coral
reef. Coral Reefs 28:55-65.
53
1245
1250
1255
1260
1265
1270
1275
1280
Blumenthal, J.M., Austin, T.J., Bothwell, J.B., Broderick, A.C., Ebanks-Petrie, G., Olynik, J.R.,
Orr, M.F., Solomon, J.L., Witt, M.J., and Godley, B.J. 2010. Life in (and out of) the
lagoon: fine-scale movements of green turtles tracked using time-depth recorders.
Aquatic Biology 9:113-121.
Brill, R.W., Balazs, G.H., Holland, K.N., Chang, R.K.C., Sullivan, S., and George, J.C. 1995.
Daily movements, habitat use, and submergence intervals of normal and tumor-bearing
juvenile green turtles (Chelonia mydas) within a foraging area in the Hawaiian Islands.
Journal of Experimental Marine Biology and Ecology 185:203-218.
Brooks, L.B., Harvey, J.T., Nichols, W.J. 2009. The movements of East Pacific green turtle
Chelonia mydas at a foraging area in Baja California Sur, Mexico. Marine Ecology
Progress Series 386:263-274.
Campbell, C.L. and Lageuex, C.J. 2005. Survival probability estimates for large juvenile and
adult green turtles (Chelonia mydas) exposed to an artisanal marine turtle fishery in the
western Caribbean. Herpetologica 61:91-103.
Cooke, S.J., Hinch, S.G., Wikelski, M., Andrews, R.D., Kuchel, L.J., Wolcott, T.G., and Butler,
P.J. 2004. Biotelemetry: a mechanistic approach to ecology. Trends in Ecology and
Evolution 19:334-343.
Fedak, M.A., Lovell, P., and Grant, S.M. 2001. Two approaches to compressing and interpreting
time-depth information as collected by time-depth recorders and satellite-linked data
recorders. Marine Mammal Science 17(1):94-110.
Frick, J. 1976. Orientation and behaviour of hatchling green turtles (Chelonia mydas) in the sea.
Animal Behaviour 24:849-857.
Glen, F., Broderick, A.C., Godley, B.J., Metcalfe, J.D., and Hays, G.C. 2001. Dive angles for a
green turtle (Chelonia mydas). Journal of the Marine Biological Association of the
United Kingdom 81:683-686.
Godley, B.J., Richardson, S., Broderick, A.C., Coyne, M.S., Glen, F., and Hays, G.C. 2002.
Long-term satellite telemetry of the movements and habitat utilisation by green turtles in
the Mediterranean. Ecography 25:352-362.
Godley, B.J., Blumenthal, J.M., Broderick, A.C., Coyne, M.S., Godfrey, M.H., Hawkes, L.A.,
and Witt, M.J. 2008. Satellite tracking of sea turtles: Where have we been and where do
we go next? Endangered Species Research 4:3-22.
Hart, K.M., and Fujisaki, I. 2010. Satellite tracking reveals habitat use by juvenile green sea
turtles Chelonia mydas in the Everglades, Florida, USA. Endangered Species Research
11:221-232.
54
1285
1290
1295
1300
1305
1310
1315
1320
1325
Hatase, H., Sato, K., Yamaguchi, M., Takahasi, K., and Tsukamoto, K. 2006. Individual
variation in feeding habitat use by adult green sea turtles (Chelonia mydas): are they
obligately neritic herbivores? Oecologia 149:52-64.
Hays, G.C., Luschi, P., Papi, F., del Seppia, C., and Marsh, R. 1999. Changes in behaviour
during the inter-nesting period and post-nesting migration for Ascension Island green
turtles. Marine Ecology Progress Series 189:263-273.
Hays, G.C., Adams, C.R., Broderick, A.C., Godley, B.J., Lucas, D.J., Metcalfe, J.D., and Prior,
A.A. 2000. The diving behaviour of green turtles at Ascension Island. Animal Behaviour
59:577-586.
Hays, G.C., Åkesson, S., Broderick, A.C, Glen, F., Godley, B.J., Luschi, P., Martin, C.,
Metcalfe, J.D., and Papi, F. 2001a. The diving behaviour of green turtles undertaking
oceanic migration to and from Ascension Island: dive durations, dive profiles, and depth
distribution. The Journal of Experimental Biology 204:4093-4098.
Hays, G.C., Broderick, A.C., Glen, F., Godley, B.J., and Nichols, W.J. 2001b. The movements
and submergence behaviour of male green turtles at Ascension Island. Marine Biology
139:395-399.
Hays, G.C., Glen, F., Broderick, A.C., Godley, B.J., and Metcalfe, J.D. 2002a. Behavioural
plasticity in a large marine herbivore: contrasting patterns of depth utilisation between
two green turtle (Chelonia mydas) populations. Marine Biology 141:985-990.
Hays, G.C., Broderick, A.C., Glen, F., Godley, B.J., Houghton, J.D.R., and Metcalfe, J.D. 2002b.
Water temperature and inter-nesting intervals for loggerhead (Caretta caretta) and green
(Chelonia mydas) sea turtles. Journal of Thermal Biology 27:429-432.
Hays, G.C., Metcalfe, J.D., Walne, A.W., and Wilson, R.P. 2004a. First records of flipper beat
frequency during sea turtle diving. Journal of Experimental Marine Biology and Ecology
303:243-260.
Hays, G.C., Metcalfe, J.D., and Walne, A.W. 2004b. The implications of lung-regulated
buoyancy control for dive depth and duration. Ecology 85(4):1137-1145.
Hays, G.C., Marshall, G.J., and Seminoff, J.A. 2007. Flipper beat frequency and amplitude
changes in diving green turtles, Chelonia mydas. Marine Biology 150:1003-1009.
Hazel, J., Lawler, I.R., Marsh, H., and Robson, S. 2007. Vessel speed increases collision risk for
green turtle Chelonia mydas. Endangered Species Research 3:105-113.
Hazel, J. 2009. Evaluation of fast-acquisition GPS in stationary tests and fine-scale tracking of
green turtles. Journal of Experimental Marine Biology and Ecology 374:58-68.
Hazel, J., Lawler, I.R., and Hamann, M. 2009. Diving at the shallow end: Green turtle behaviour
55
1330
1335
1340
1345
1350
1355
1360
1365
1370
110
in near-shore foraging habitat. Journal of Experimental Marine Biology and Ecology
371(1):84-92.
Heithaus, M.R., Marshall, G.J., Buhleier, B.M., and Dill, L.M. 2001. Employing Crittercam to
study habitat use and behaviour of large sharks. Marine Ecology Progress Series
209:307-310.
Heithaus, M.R., McLash, J.J., Frid, A., Dill, L.M., and Marshall, G.J. 2002. Novel insights into
green sea turtle behaviour using animal-borne video cameras. Journal of the Marine
Biological Association of the United Kingdom 82:1049-1050.
Heithaus, M.R., Frid, A., Wirsing, A.J., Dill, L.M, Fourqurean, J.W., Burkholder, D., Thomas, J.,
and Bejdger, L. 2007. State-dependent risk-taking by green sea turtles mediates top-down
effects of tiger shark intimidation in a marine ecosystem. Journal of Animal Ecology
76:837-844.
Hochscheid, S., Godley, B.J., Broderick, A.C., and Wilson, R.P. 1999. Reptilian diving: highly
variable dive patterns in the green turtle Chelonia mydas. Marine Ecology Progress
Series 185:101-112.
Hochscheid, S., Maffucci, F., Bentivegna, F., and Wilson, R.P. 2005. Gulps, wheezes, and sniffs:
how measurement of beak movement in sea turtles can elucidate their behaviour and
ecology. Journal of Experimental Marine Biology and Ecology 316:45-53.
Hooker, S.K. and Baird, R.W. 2001. Driving and ranging behaviour of odontocetes: a
methodological review and critique. Mammal review 31:81-105.
Houghton, J.D.R., Broderick, A.C., Godley, B.J., Metcalfe, J.D., and Hays, G.C. 2002. Diving
behaviour during the inter-nesting interval for loggerhead turtles Caretta caretta nesting
in Cyprus. Marine Ecology Progress Series 227:63-70.
Houghton, J.D.R., Callow, M.J., and Hays, G.C. 2003. Habitat utilization by juvenile hawksbill
turtles (Eretmochelys imbricata, Linneaus, 1766) around a shallow water coral reef.
Journal of Natural History 37:1269-1280.
I-Jiunn, C. 2009. Changes in diving behaviour during the inter-nesting period by green turtles.
Journal of Experimental Marine Biology and Ecology 381:18-24.
Keinath, J.A. and Musick, J.A. 1993. Movements and diving behavior of a leatherback turtle,
Dermochelys coriacea. Copeia 1993(4):1010-1017.
Limpus, C.J., Miller, J.D., Paramenter, C.J., Reimer, D., McLachlan, N., and Webb, R. 1992.
Migration of green (Chelonia mydas) and loggerhead (Caretta caretta) turtles to and
from eastern Australian Rookeries. Wildlife Research 19:347–358.
Lohmann, K.J., Lohmann, C.F. 1994. Detection of magnetic inclination angle by sea turtles: a
56
1375
1380
1385
1390
1395
1400
1405
1410
1415
possible mechanism for determining latitude. Journal of Experimental Biology 194:23-
32.
Losey, G.S., Balazs, G.H., and Privitera, L.A. 1994. Cleaning symbiosis between the wrasse,
Thalassoma duperry, and the green turtle, Chelonia mydas. Copeia 1994:684-690.
Lutz, P.L and Bentley, T.B. 1985. Respiratory physiology of diving in the sea turtle. Copeia
1985: 671–679.
Makowski, C., Seminoff, J.A., and Salmon, M. 2006. Home range and habitat use of juvenile
Atlantic green turtles (Chelonia mydas L.) on shallow reef habitats in Palm Beach,
Florida, USA. Marine Biology 148:1167-1179.
Mendonca, M.T. 1983. Movement and feeding ecology of immature green turtles (Chelonia
mydas) in a Florida Lagoon. Copeia 1983:1013-1023.
Mills, D.J., Verdouw G., and Frusher, S.D. 2005. Remote multi-camera system for in situ
observations of behaviour and predator/prey interactions of marine benthic macrofauna.
New Zealand Journal of Marine and Freshwater Research 39:347-352.
Milsom, W.K. 1975. Development of buoyancy control in juvenile Atlantic loggerhead turtles,
Caretta caretta. Copeia 1975:758-762.
Moll, R.J., Millspaugh, J.J., Beringer, J., Sartwell, J., and He Z. 2007. A new ‘view’ of ecology
and conservation through animal-bourne video systems. Trends in Ecology and Evolution
22:660-668.
Musick, J.A. and Limpus, C.J. 1997. Habitat utilisation and migration in juvenile sea turtles. In
Lutz, P.L. and Musick, J.A. (eds). The biology of sea turtles. CRC Press, Boca Raton, pp.
137–165.
Myers, A.E., Lovell, P., and Hays, G.C. 2006. Tools for studying animal behaviour: validation of
dive profiles relayed via the Argos satellite system. Animal Behaviour 71:989-993.
Quaintance, J.K., Rice, M.R., and Balazs, G.H. 2002. Basking, foraging, and resting behavior of
two sub-adult green turtles in Kiholo Bay Lagoon, Hawaii. Proceedings of the
Twenty-Second Annual Symposium on Sea Turtle Biology and Conservation. NOAA
Technical Memorandum NMFS-SEFSC-503, pp. 225-226.
Renaud, M.L. and Carpenter, J.A. 1994. Movements and submergence patterns of loggerhead
turtles (Caretta caretta) in the Gulf of Mexico determined through satellite telemetry.
Bulletin of Marine Science 55(1):1-15.
Renaud, M.L., Carpenter, J.A., Williams, J.A., and Manzella-Tirpak, S.A. 1995. Activities of
juvenile green turtles, Chelonia mydas, at a jettied pass in South Texas. Fishery Bulletin
93:586-593.
57
1420
1425
1430
1435
1440
1445
1450
1455
1460
115
Rice, M.R., Balazs, G.H., Hallacher, L., Dudley, W., Watson, G., Krusell, K., and Larson, B.
Diving, basking, and foraging patterns of a sub-adult green turtle at Punalu’u, Hawai’i.
2000. Proceedings of the Eighteenth Annual Symposium on Sea Turtle Biology and
Conservation. NOAA Technical Memorandum NMFS-SEFSC-436, pp. 229-231.
Rice, M.R. and Balazs, G.H. 2008. Diving behavior of the Hawaiian green turtle (Chelonia
mydas) during oceanic migrations. Journal of Experimental Marine Biology and Ecology
356:121-127.
Salmon, M., Jones, T.T., and Horch, K.W. 2004. Ontogeny of diving and feeding in juvenile
seaturtles: leatherback seaturtles (Dermochelys coriacea L) and green seaturtles
(Chelonia mydas L) in the Florida current. Journal of Herpetology 38(1):36-43.
Sato, K., Matsuzawa, Y., Tanaka, H., Bando, T., Minamikawa, S., Sakamoto, W., and Naito, Y.
1998. Inter-nesting intervals for loggerhead turtles, Caretta caretta, and green turtles,
Chelonia mydas, are affected by temperature. Canadian Journal of Zoology 76:1651-
1662.
Schofield, G., Katselidis, K.A., Dimopolous, P., Pantis, J.D., and Hays, G.C. 2006. Behaviour
analysis of the loggerhead sea turtle Caretta caretta from direct in-water observation.
Endangered Species Research 2:71-79.
Seminoff, J. and Jones, T.T. 2006. Diel movements and activity ranges of green turtles
(Chelonia
mydas) at a temperate foraging area in the Gulf of California, Mexico. Herpetological
Conservation and Biology 1:81-86.
Seminoff, J., Resendiz, A., Smith, T.W., and Yarnell, L. 2001. Diving patterns of green turtles
(Chelonia mydas agassizii) in the Gulf of California. Proceedings of the Twenty-First
Annual Symposium on Sea Turtle Biology and Conservation. NOAA Technical
Memorandum NMFS-SEFSC-528, pp. 321-323.
Seminoff, J.A., Resendiz, A., and Nichols, W.J. 2002. Home range of green turtles Chelonia
mydas at a coastal foraging area in the Gulf of California, Mexico. Marine Ecology
Progress Series 242:253-265.
Seminoff, J.A., Jones, T.T., and Marshall, G.J. 2006. Underwater behaviour of green turtles
monitored with video-time-depth recorders: what’s missing from dive profiles? Marine
Ecology Progress Series 322:269-280.
Senko, J., Koch, V., Megill, W.M., Carthy, R.R., Templeton, R.P., and Nichols, W.J. 2010. Fine
scale daily movements and habitat use of East Pacific green turtles at a shallow coastal
lagoon in Baja California Sur, Mexico. Journal of Experimental Marine Biology and
Ecology 391:92-100.
58
1465
1470
1475
1480
1485
1490
1495
1500
1505
1510
Southwood, A.L., Andrews, R.D., Lutcavage, M.E., Paladino, F.V., West, N.H., George, R.H.,
and Jones, D.R. 1999. Heart rates and diving behaviour of leatherback sea turtles in the
Eastern Pacific Ocean. Journal of Experimental Biology 202:1115-1125.
Southwood, A.L., Reina, R.D., Jones, V.S., and Jones, D.R. 2003. Seasonal diving patterns and
body temperatures of juvenile green turtles at Heron Island, Australia. Canadian Journal
of Zoology 81:1014-1024.
Swimmer, J.Y. and Balazs, G.H. 2000. The biology of basking in the green turtle (Chelonia
mydas). Proceedings of the Eighteenth Annual Symposium on Sea Turtle
Biology and Conservation. NOAA Technical Memorandum NMFS-SEFSC-436, pp. 233-
234.
Taquet, C., Taquet, M., Dempster, T., Soria, M., Ciccione, S., Roos, D., and Dagorn, L. 2006.
Foraging on the green sea turtle Chelonia mydas on seagrass beds at Mayotte Island
(Indian Ocean), determined by acoustic transmitters. Marine Ecology Progress Series
306:295-302.
van Dam, R.P., and Diez, C.E. 1996. Diving behavior of immature hawksbills (Eretmochelys
imbricata) in a Caribbean cliffwall habitat. Marine Biology 127:171–178.
Watson, K.P. and Granger, R.A. 1998. Hydrodynamic effect of a satellite transmitter on a
juvenile green turtle (Chelonia mydas). Journal of Experimental Biology 201:2497-2505.
Whittow, G.C., and Balazs, G.H. 1982. Basking behavior of the Hawaiian green turtle (Chelonia
mydas). Pacific Science 36(2):129-139.
Witt, M.J., McGowan, A., Blumenthal, J.A., Broderick, A.C., Gore, S., Wheatley, D., White, J.,
and Godley, B.J. 2010. Inferring vertical and horizontal movements of juvenile marine
turtles from time-depth recorders. Aquatic Biology 8:169-177.
Yasuda, T. and Arai, N. 2009a. Changes in flipper beat frequency, body angle and swimming
speed of female green turtles Chelonia mydas. Marine Ecology Progress Series 386:275-
286.
Yasuda, T. and Arai, N. 2009b. Depth utilization and swimming speed of female green turtles at
Huyong Island, Thailand. Proceedings of the Fifth International Symposium on
SEASTAR2000 and Asian Bio-Logging Science 29-31.
59
1515
1520
1525
1530
1535
1540
1545
TABLES:
Table 1. A summary of the devices and methods used to record green turtle diving behavior in the 29 articles discussed in this review. Numbers
indicate the different number of types of devices used in the study.
Brand of Device Vemco Wildlife
Computers
CEFAS Star-
Oddi
Lotek
Wireless
Driesen
and
Kern
Own
Design
National
Geo-
graphic
Sea
Mammal
Research
Unit
Wildlife
Computers
Telonics Telonics Sonotronics Imasen Electrical
Industrial Co.,
Ltd.
Driesen
and Kern
Little
Leonard,
Ltd.
Type of
Device/Method
TDR TDR TDR TDR TDR TDR TDR VTDR
(Critter-
cam)
Satellite-
logger
Satellite-
logger
Satellite-
logger
Ultrasonic
Transmitter
Ultrasonic
transmitter
Beak Movement
Sensor
Movement
Sensory
Unit
(IMASU)
Acceler-
ometer
Visual
Survey
Total No.
Devices/
Methods Used
Article Authors
Brill et al. 1995 1 0 0 0 0 0 0 0 0 0 0 0 0 0 0 0 0 1
Renaud et al. 1995 0 0 0 0 0 0 0 0 0 0 0 1 1 0 0 0 0 2
Hays et al. 1999 0 0 0 0 0 0 0 0 0 0 1 0 0 0 0 0 0 1
Hochscheid et al. 1999 0 0 0 0 0 1 0 0 0 0 0 0 0 0 0 0 0 1
Hays et al. 2000 1 1 1 0 0 0 0 0 0 0 0 0 0 0 0 0 0 3
Rice et al. 2000 0 1 0 0 0 0 0 0 0 0 0 0 0 0 0 0 1 2
Glen et al. 2001 0 1 0 0 1 0 0 0 0 0 0 0 0 0 0 0 0 2
Hays et al. 2001a 0 0 0 0 1 0 0 0 0 0 2 0 0 0 0 0 0 3
Hays et al. 2001b 0 0 0 0 0 0 0 0 0 0 1 0 0 0 0 0 0 1
Seminoff et al. 2001 0 1 0 0 0 0 0 0 0 0 0 0 0 0 0 0 0 1
Godley et al. 2002 0 0 0 0 0 0 0 0 0 1 1 0 0 0 0 0 0 2
Hays et al. 2002a 1 1 1 0 1 0 0 0 0 0 0 0 0 0 0 0 0 4
Hays et al. 2002b 1 1 0 0 1 0 0 0 0 0 0 0 0 0 0 0 0 3
Heithaus et al. 2002 0 0 0 0 0 0 0 1 0 0 0 0 0 0 0 0 0 1
Quaintance et al. 2002 0 1 0 0 0 0 0 0 0 0 0 0 0 0 0 0 0 1
Southwood et al. 2003 0 1 0 0 0 0 1 0 0 0 0 0 0 0 0 0 0 2
Hays et al. 2004a 0 0 0 0 2 0 0 0 0 0 0 0 0 0 1 0 0 3
Salmon et al. 2004 0 0 0 0 1 0 0 0 0 0 0 0 0 0 0 0 1 2
Hatase et al. 2006 0 0 0 0 0 0 0 0 1 0 0 0 0 0 0 0 0 1
Makowski et al. 2006 0 0 0 0 1 0 0 0 0 0 0 0 1 0 0 0 0 2
Seminoff et al. 2006 0 0 0 0 0 0 0 1 0 0 0 0 0 0 0 0 0 1
Hays et al. 2007 0 0 0 0 0 0 0 1 0 0 0 0 0 0 0 0 0 1
Rice and Balazs 2008 0 2 0 0 0 0 0 0 0 0 0 0 0 0 0 0 0 2
Bell et al. 2009 1 0 0 0 0 0 0 0 0 0 0 0 0 0 0 0 0 1
Hazel et al. 2009 0 0 0 1 0 0 0 0 0 0 0 0 0 0 0 0 0 1
I-Jiunn 2009 0 1 0 0 0 0 0 0 0 0 0 0 0 0 0 0 0 1
Yasuda and Arai 2009a 0 0 0 0 0 0 0 0 0 0 0 0 0 0 0 2 0 2
Yasuda and Arai 2009b 0 0 0 0 0 0 0 0 0 0 0 0 0 0 0 4 0 4
Blumenthal et al. 2010 0 0 0 0 1 0 0 0 0 0 0 0 0 0 0 0 0 1
TOTAL: 5 11 2 1 9 1 1 3 1 1 5 1 2 0 1 6 2 --
60
120
1550
1555
Table 2. A discussion of the accuracies, resolutions, sampling rates, sizes, weights, and biases of electronic devices used within the 29 articles
reviewed.
Article Authors Minimum Depth/Time to be Considered a Dive Resolution/Accuracy of Device(s):
Depth and Temperature
Sampling Rate of Device(s) Size of Device(s) Weight of Device(s) Data
Binned?
Brill et al. 1995 Not Reported Vemco TDR: 1 m Vemco TDR: Not Reported
Vemco TDR: 0.016 m diam, 0.08-0.13 m
long
Vemco TDR: 28-40 g
0.05 hour
intervals
Renaud et al. 1995 Not Reported
Telonics: Not Reported; Sonotronics:
Not Reported
Telonics and Sonotronics: Not Reported Telonics and Sonotronics: Not Reported Telonics: 180 g; Sonotronics: 36 g N/A
Hays et al. 1999 either 10 or 60 seconds submerged Telonics sat tag: Not Reported Telonics sat tag: every 50 or 90 sec Telonics sat tag: Not Reported Telonics sat tag: Not Reported
6 hour
intervals
Hochscheid et al. 1999 2.5 m Driesen and Kern TDR: 0.1 m, 0.05 C Driesen and Kern TDR: every 15 sec
Driesen and Kern TDR: 0.147 x 0.065 x
0.03 m
Driesen and Kern TDR: 200 g N/A
Hays et al. 2000
below 3 m for 40 sec continuously, below 3 m for
at least 50 out of 60 sec, or reached 6 m depth.
Wildlife TDR: 2 m; Vemco TDR: 0.3 m;
CEFAS TDR: 0.1 m
Wildlife TDR: every 10 sec; Vemco TDR:
every 150 sec; CEFAS TDR: every 300 sec
Wildlife TDR, Vemco TDR, and CEFAS
TDR: Not Reported
Wildlife TDR: 125 g; Vemco TDR:
23 g; CEFAS TDR: 55 g
N/A
Rice et al. 2000 Not Reported Wildlife TDR: Not Reported Wildlife TDR: every 60 sec Wildlife TDR: Not Reported Wildlife TDR: Not Reported N/A
Glen et al. 2001 0.5 m Wildlife TDR: 2 m; Lotek TDR: 0.06 m Wildlife TDR and Lotek TDR: every 5 sec
Wildlife TDR and Lotek TDR: Not
Reported
Wildlife TDR and Lotek TDR: Not
Reported
N/A
Hays et al. 2001a
either 10 or 60 seconds submerged, rate of descent
> 0.3 m/sec, ending when rate of ascent > 0.3
m/sec and depth was <10% of max for that dive
Lotek TDR: 0.04 m; Telonics sat tag 1:
N/A; Telonics sat tag 2: N/A
Lotek TDR: every 12 sec; Telonics sat tag 1
and 2: Not Reported
Lotek TDR, Telonics sat tag 1 and 2: Not
Reported
Lotek TDR and Telonics sat tag 1
and 2: Not Reported
6 hour
intervals
Hays et al. 2001b >10 seconds Telonics sat tag: Not Reported Telonics sat tag: Not Reported Telonics sat tag: Not Reported Telonics sat tag: Not Reported
12 hour
intervals
Seminoff et al. 2001 2 m Wildlife TDR: 0.5 m Wildlife TDR: Not Reported Wildlife TDR: Not Reported Wildlife TDR: 500 g N/A
Godley et al. 2002 2 m
Wildlife sat tag: Not Reported; Telonics
sat tag: Not Reported
Wildlife sat tag: every 10 sec; Telonics sat
tag: Not Reported
Wildlife sat tag: 0.2 x 0.15 x 0.4 m;
Telonics sat tag: 0.14 x 0.048 x 0.033 m
Wildlife sat tag: 750 g; Telonics
sat tag: 275 g
6 hour
intervals
Hays et al. 2002a Not Reported
Lotek TDR: 0.06 m; Wildlife TDR: 2 m;
Vemco TDR: 0.3 m; CEFAS TDR: 0.1 m
Lotek TDR: every 5 sec; Wildlife TDR: every
10 sec; Vemco TDR: every 60 sec; CEFAS
TDR: every 120 sec
Lotek TDR, Wildlife TDR, Vemco TDR,
and CEFAS TDR: Not Reported
Lotek TDR, Wildlife TDR, Vemco
TDR, and CEFAS TDR: Not
Reported
N/A
Hays et al. 2002b Not Reported
Wildlife TDR: Not Reported; Vemco
TDR: Not Reported; Lotek TDR: Not
Reported
Wildlife TDR, Vemco TDR, and Lotek TDR:
temp every 150 sec to 1 hr (unspecified),
depth not reported
Wildlife TDR, Vemco TDR, and Lotek
TDR: Not Reported
Wildlife TDR: 125 g; Vemco TDR:
23 g: Lotek TDR: 16 g
N/A
Heithaus et al. 2002 Not Reported Crittercam: Not Reported Crittercam: Not Reported Crittercam: Not Reported Crittercam: Not Reported N/A
Quaintance et al. 2002 Not Reported Wildlife TDR: Not Reported
Wildlife TDR: depth every 60 sec, temp
every 180 sec
Wildlife TDR: Not Reported Wildlife TDR: Not Reported N/A
Southwood et al. 2003 1 m
Own Design TDR: 0.2-0.5 m, 0.4 C;
Wildlife TDR: 2 m, 0.2 C
Own Design TDR: every 5 sec; Wildlife
TDR: depth every 10 sec, temp every 60
sec
Own Design TDR: 0.12 x .16 x 0.014 m;
Wildlife TDR: 0.074 x 0.057 x 0.03 m
Own Design TDR: 180 g; Wildlife
TDR: 70 g
N/A
Hays et al. 2004a
≥ 5 m for types 1 and 2 dives and U-dives; ≥ 20 m
for V-dives; vertical ascent rate for all dives begins
and ends with 0.3 m/sec
Lotek TDR 1: 0.04 m; Lotek TDR 2: 0.3
m
Lotek TDR 1: every 5 sec; Lotek TDR 2:
every 14 or 52 sec; IMASU: N/A
Lotek TDR 1: 0.018 x 0.057 m; Lotek
TDR 2: 0.08 x 0.016 x 0.027 m; IMASU:
0.072 x 0.033 x 0.017 m
Lotek TDR 1: 16 g; Lotek TDR 2: 5
g; IMASU: 47 g
N/A
Salmon et al. 2004 Not Reported Lotek TDR: Not Reported Lotek TDR: every 2 sec Lotek TDR: 0.057 x 0.018 m Lotek TDR: 1 g (in water ) N/A
Hatase et al. 2006 2m for at least 30 seconds Sea Mammal sat tag: 0.33 - 1 m Sea Mammal sat tag: every 4 sec Sea Mammal sat tag: Not Reported
Sea Mammal sat tag: Not
Reported
N/A
Makowski et al. 2006 Not Reported
Sonotronics: N/A; Lotek TDR: 0.05 m,
0.5 C
Sonotronics: N/A; Lotek TDR: every 5 sec
Sonotronics: 0.018 x 0.086 cm sq.;
Lotek TDR: 0.011 x 0.032 cm sq.
Sonotronics: 190 g; Lotek TDR: 2 g
(in water)
N/A
Seminoff et al. 2006 1.5 m Crittercam: Not Reported Crittercam: every 2-7 sec
Crittercam: 0.101 m diameter, 0.317 m
length
Crittercam: 2000 g N/A
Hays et al. 2007 Not Reported Crittercam: Not Reported Crittercam: every 2-7 sec
Crittercam: 0.101 m diameter, 0.317 m
length
Crittercam: 2000 g N/A
Article Authors Minimum Depth/Time to be Considered a Dive Resolution/Accuracy of Device(s):
Depth and Temperature
Sampling Rate of Device(s) Size of Device(s) Weight of Device(s) Data
Binned?
61
Rice and Balazs 2008 Not Reported Wildlife TDR 1 and 2: 0.5 m, 0.5 C Wildlife TDR 1 and 2: every 60 sec Wildlife TDR 1 and 2: Not Reported
Wildlife TDR 1 and 2: Not
Reported
N/A
Bell et al. 2009 1 m Vemco TDR: Not Reported Vemco TDR: Not Reported Vemco TDR: Not Reported Vemco TDR: Not Reported N/A
Hazel et al. 2009 1-2 m, excluding first 12 hours after release Star-Oddi TDR: 0.08 m, 0.1 C
Star-Oddi TDR: depth every 15 sec, temp
every 225 sec
Star-Oddi TDR: Not Reported Star-Oddi TDR: Not Reported N/A
I-Jiunn 2009
depth below 2 m, vertical speed faster than 0.03
m/s, and dive lasted longer than 30 seconds
Wildlife TDR: 0.5 m, 0.5 C Wildlife TDR: every 1 sec Wildlife TDR: Not Reported Wildlife TDR: Not Reported N/A
Yasuda and Arai 2009a 3 m
Accelerometer 1: 0.093 m,
Accelerometer 2: 0.046 m
Accelerometer 1 and 2: Sampling intervals
- 1 Hz for depth and swimming speed, 0.1
Hz for temp, and 16 Hz for acceleration
Accelerometer 1: 0.015 m diameter,
0.053 m length; Accelerometer 2: 0.027
m diameter, 0.128 m length
Accelerometer 1: 16 g;
Accelerometer 2: 73 g
N/A
Yasuda and Arai 2009b Not Reported
Accelerometer 1: Not Reported;
Accelerometer 2: Not Reported;
Accelerometer 3: Not Reported;
Accelerometer 4: Not Reported
Accelerometer 1, 2, 3, and 4: every 1 sec
Accelerometer 1, 2, 3, and 4: Not
Reported
Accelerometer 1, 2, 3, and 4: Not
Reported
N/A
Blumenthal et al. 2010 Not Reported Lotek TDR: 0.5 m, 0.3 C Lotek TDR: every 10 sec Lotek TDR: Not Reported Lotek TDR: Not Reported N/A
Table 2 continued.
Table 3. The different ways the authors of the 29 studies studied, organized, and analyzed the data collected regarding green turtle dive behavior.
1 = analysis used/discussed within the article. 0 = analysis not used or discussed.
Article Authors Letter- Number- Dive Flipper Swimming Coefficient of Dive Dive Total
62
1560
1565
1570
1575
1580
125
Shaped Dives Labeled Dives Angle Beats Speed Variation Length Depth
Brill et al. 1995 0 0 0 0 0 0 1 1 2
Renaud et al. 1995 0 0 0 0 0 0 1 0 1
Hays et al. 1999 0 0 0 0 1 0 1 0 2
Hochscheid et al. 1999 1 0 1 0 0 0 1 1 4
Hays et al. 2000 0 0 0 0 0 0 1 1 2
Rice et al. 2000 0 0 0 0 0 0 1 1 2
Glen et al. 2001 1 0 1 0 0 0 0 0 2
Hays et al. 2001a 1 1 1 0 0 0 1 1 5
Hays et al. 2001b 0 0 0 0 0 0 1 0 1
Seminoff et al. 2001 0 0 0 0 0 0 1 1 2
Godley et al. 2002 0 0 0 0 1 0 1 1 3
Hays et al. 2002a 1 0 0 0 0 0 1 1 3
Hays et al. 2002b 0 0 0 0 0 0 0 1 1
Heithaus et al. 2002 0 0 0 0 0 0 1 0 1
Quaintance et al. 2002 0 0 0 0 0 0 1 0 1
Southwood et al. 2003 1 0 0 0 0 0 1 1 3
Hays et al. 2004a 1 1 1 1 1 0 1 1 7
Salmon et al. 2004 1 0 0 1 1 0 1 1 5
Hatase et al. 2006 1 0 0 0 0 0 1 1 3
Makowski et al. 2006 1 0 0 0 0 0 1 1 3
Seminoff et al. 2006 0 1 0 0 1 0 1 1 4
Hays et al. 2007 0 0 1 1 0 0 1 1 4
Rice and Balazs 2008 1 0 0 0 0 0 1 1 3
Bell et al. 2009 1 0 0 0 0 0 1 1 3
Hazel et al. 2009 0 0 0 0 0 0 1 1 2
I-Jiunn 2009 1 0 0 0 0 0 1 1 3
Yasuda and Arai 2009a 1 1 1 1 1 0 1 1 7
Yasuda and Arai 2009b 0 0 0 0 1 0 0 1 2
Blumenthal et al. 2010 0 0 0 0 0 1 1 1 3
TOTAL: 13 4 6 4 7 1 26 23 --
Table 4. Definitions of foraging and diving (and other) behaviors of green sea turtles provided by each of the 29 studies reviewed. 1 = definition
provided, 0 = no definition provided.
Article Authors Behaviors Defined? Definition of Behavior
Foraging Resting Other Foraging Resting Other
Brill et al. 1995 1 1 0 short and irregular submergence intervals regular long submergence intervals N/A
63
1585
Renaud et al. 1995 0 0 0 N/A N/A N/A
Hays et al. 1999 0 1 0 N/A a dive of long submergence time (pretty vague, huh?) N/A
Hochscheid et al. 1999 1 1 0
active movements along the bottom substrate, can
occur on many different dive types, including U dives.
periods of inactivity during U-dives. N/A
Hays et al. 2000 1 1 0
short, active dives that do not level off at one maximum
depth
repeated dives to a fixed depth for a long period, at least 6 m
in depth, be within 2 m of max depth for 90% of dive, no
linear change while at deepest depth, and there had to be at
least 2 of these dives in a row
N/A
Rice et al. 2000 1 1 0
numerous short dives in shallow water (< 3 m) with
short surface intervals (< 5 sec)
longer dives (> 20 min) in deeper water N/A
Glen et al. 2001 0 0 0 N/A N/A N/A
Hays et al. 2001a 0 1 0 N/A Type 1 and 2 dives - see article or notes for descriptions N/A
Hays et al. 2001b 0 0 1 (mating) N/A N/A
mating: short timed dives showing great activity, for
males only
Seminoff et al. 2001 1 0 0 shorter dive duration than resting dives N/A N/A
Godley et al. 2002 0 0 0 N/A N/A N/A
Hays et al. 2002 0 0 0 N/A N/A N/A
Hays et al. 2002b 0 0 0 N/A N/A N/A
Heithaus et al. 2002 0 0 0 N/A N/A N/A
Quaintance et al. 2002 1 1 0 relatively constant temp Small regular fluctuations in temp N/A
Southwood et al. 2003 1 1 0 dives of shorter depth and duration than resting dives
dives of deeper depth and longer duration than in foraging
dives
N/A
Hays et al. 2004a 0 1 0 N/A
U-dives to the bottom in which there was very little or no
flipper movement
N/A
Salmon et al. 2004 0 0 0 N/A N/A N/A
Hatase et al. 2006 0 0 0 N/A N/A N/A
Makowski et al. 2006 1 1 0 V-dive - short bounce dive U-dive - flat bottom resting dive N/A
Seminoff et al. 2006 1 1 0
specific food item seen being ingested, OR an item in
video went out of view, followed by chewing motions,
OR fragments of prey item seen expelled through
external nares of turtle, done on types 1, 3 and 5 dives
motionless with no head or flipper movement, only on type 1
dives
N/A
Hays et al. 2007 0 0 0 N/A N/A N/A
Rice and Balazs 2008 0 1 0 N/A U-Shaped dive N/A
Bell et al. 2009 1 1 0 V-dive and slowly ascending dives U-dive N/A
Hazel et al. 2009 1 1 0
Short dives are consistent with heightened activity
involved in seeking and consuming forage, since activity
increases metabolic demand
reduced metabolic demand while resting = longer submersion,
less surfacing events
N/A
I-Jiunn 2009 0 1 1 (active) N/A
U-dives: stationary at a fixed depth for extended time period,
and animals remained motionless or moved very little; long
dives with little SD in bottom depth
Active: move more and stay at specific depth for
short period of time, resulting in an erratic bottom
profile with high standard deviation of bottom
depth; short dives with high SD of bottom depth
Article Authors Behaviors Defined? Definition of Behavior
Foraging Resting Other Foraging Resting Other
Yasuda and Arai 2009a 0 1 0 N/A
dynamic acceleration (or lack thereof) showed that turtles
were indeed resting during the bottom phase of the U-dive
N/A
Yasuda and Arai 2009b 0 0 0 N/A N/A N/A
Blumenthal et al. 2010 0 1 0 N/A longer and less active dives N/A
TOTAL: 11 17 2 -- -- --
64
130
Table 4 continued.
Table 5. A comparison of the 29 studies discussed regarding green turtle diving behavior in this review: turtle size/age, study location, and number
of turtles studied.
Article Authors Green Turtle Size/Age Study Site Purpose of Study Site No. Green Turtle
Subjects
Brill et al. 1995 all >65 cm CL Kaneohe Bay, HI foraging area 12
Renaud et al. 1995 29.1-47.9 cm SCL, 2.6-14.8 kg weight South Padre Island, Texas foraging area 9
Hays et al. 1999 nesting females Ascension Island inter-nesting and post-nesting migration 11
Hochscheid et al. 1999 nesting females Cyprus inter-nesting area 2
Hays et al. 2000 109-127.75 cm CCL Ascension Island inter-nesting area 6
65
1590
1595
1600
1605
1610
1615
Rice et al. 2000 72.5 cm SCL, weighing 52.5 kg Punalu'u, Hawai’i foraging area 1
Glen et al. 2001 nesting female Cyprus inter-nesting area 1
Hays et al. 2001a nesting females migration between Ascension and Brazil pre- and post-nesting migration 17
Hays et al. 2001b male adults Ascension Island inter-nesting/breeding area 2
Seminoff et al. 2001 Not reported Bahia de Los Angeles foraging area 6
Godley et al. 2002 nesting females Cyprus inter-nesting area, post-nesting migration 9
Hays et al. 2002a nesting adults Cyprus and Ascension Island inter-nesting areas 8
Hays et al. 2002b nesting females Ascension Island and Cyprus inter-nesting area 12
Heithaus et al. 2002 76-103 cm CCL Shark Bay, Western Australia not defined - possibly foraging area (seagrass) 12
Quaintance et al. 2002 45 kg body weight (sub-adult) Kiholo Bay, Hawai’i foraging area 2
Southwood et al. 2003 10-23.6 kg (range of body weights of all turtles) Heron Island, Australia foraging area 12
Hays et al. 2004a nesting females Ascension Island inter-nesting area 6
Salmon et al. 2004 newly hatched - 1-10 weeks old, increased from 62 mm to 79.1 mm SCL Florida current nursery habitat for hatchling turtles 33
Hatase et al. 2006 post-nesting females Japan post-nesting migration 4
Makowski et al. 2006 27.9-48.1 cm SCL Palm Beach, FL foraging area 10
Seminoff et al. 2006 64.1-96.7 cm SCL Bahia de Los Angeles, Mexico foraging area 34
Hays et al. 2007 69.5-93.4 cm CCL Bahia de Los Angeles, Mexico foraging area 5
Rice and Balazs 2008 migrating adults Lanikea, O’ahu, HI inter-nesting/breeding area, post-breeding migration 3
Bell et al. 2009 nesting females Raine Island, N. GBR inter-nesting area 6
Hazel et al. 2009 49-118 cm CCL near Brisbane, Australia foraging area 19
I-Jiunn 2009 range: 89-107 cm SCL, or 95-113 cm CCL Wan-an Island, Penghu Archipelago, Taiwan inter-nesting area 5
Yasuda and Arai 2009a 90-130 cm CCL, nesting females Huyong Island, Thailand inter-nesting area 4
Yasuda and Arai 2009b 90-109 cm CCL, nesting females Huyong Island, Thailand inter-nesting area 10
Blumenthal et al. 2010 mean CCL was 52.9 +/- 6.8 cm (SD) with range of 40.6-59.0 cm Cayman Islands foraging area 5
AVERAGE: 9.2
Table 6. Some of the many factors which can affect green turtle dive behavior, and whether or not each factor is considered in each of the 29
articles reviewed here. 1 = factor discussed within the article. 0 = factor not discussed.
Article Authors Turtle's Activity
at Site
Water
Temperature
Season Tide Time of
Day
Current Turtle
Gender
Buoyancy Energetics/metabolism Predator
Avoidance
TOTAL:
Brill et al. 1995 1 0 0 0 1 0 0 0 1 1 4
Renaud et al. 1995 1 0 1 0 1 0 0 0 0 0 3
Hays et al. 1999 1 0 0 0 1 1 0 0 1 0 4
Hochscheid et al. 1999 1 1 0 0 1 0 0 1 1 0 5
Hays et al. 2000 1 0 0 0 1 0 0 1 1 0 4
Rice et al. 2000 1 0 0 0 1 0 0 0 0 0 2
Glen et al. 2001 0 0 0 0 0 0 0 1 1 0 2
66
1620
Hays et al. 2001a 1 0 0 0 1 0 0 1 1 1 5
Hays et al. 2001b 1 0 0 0 0 0 1 0 1 0 3
Seminoff et al. 2001 1 0 0 0 1 0 0 0 0 0 2
Godley et al. 2002 1 1 1 0 0 0 0 0 1 0 4
Hays et al. 2002a 1 0 0 0 1 0 0 1 1 0 4
Hays et al. 2002b 0 1 0 0 0 0 0 0 1 0 2
Heithaus et al. 2002 1 0 0 0 0 0 0 0 1 0 2
Quaintance et al. 2002 1 1 0 0 1 0 0 0 1 0 4
Southwood et al. 2003 0 1 1 0 1 0 0 1 1 0 5
Hays et al. 2004a 1 0 0 0 0 0 0 1 1 0 3
Salmon et al. 2004 1 0 0 0 0 0 0 1 1 0 3
Hatase et al. 2006 1 1 0 0 1 0 0 1 0 0 4
Makowski et al. 2006 1 0 0 0 1 0 0 0 1 1 4
Seminoff et al. 2006 0 0 0 0 0 0 0 1 1 1 3
Hays et al. 2007 0 1 0 0 0 0 0 1 0 0 2
Rice and Balazs 2008 1 1 0 0 1 0 0 1 0 1 5
Bell et al. 2009 1 0 0 0 1 0 0 0 1 0 3
Hazel et al. 2009 1 1 1 0 1 0 0 1 1 1 7
I-Jiunn 2009 1 1 1 0 1 0 0 1 1 0 6
Yasuda and Arai 2009a 1 1 0 0 1 1 0 1 1 1 7
Yasuda and Arai 2009b 0 0 0 0 0 0 0 0 0 0 0
Blumenthal et al. 2010 0 0 0 0 1 0 0 0 0 1 2
TOTAL: 22 11 5 0 19 2 1 15 21 8 --
67
1625
135
FIGURES:
Figure 1. Dive profiles of two green turtles, showing (a) different dive “shapes” assigned letters
resembling the dive shape; (b) multiple shallow traveling dives in a row; (c) a series of U-shaped dives in
a row; (d) dives categorized as “S-shaped” and “other” (not resembling any letter shape). The dotted line
represents the depth threshold used to identify discrete dives (2.5 m). Note: SSD represents shallow
surface dives (Hochscheid et al. 1999).
68
1630
Figure 2. Southwood et al. (2003). Figure showing different letter-shaped dives performed by green
turtles, and the threshold used to identify discrete dives (~1 m).
Figure 3. Figure of four categories of dives based on their shape. See text for explanation of each dive
type (Rice and Balazs 2008).
69
1635
1640
140
Figure 4. Figure of the six generic dive types observed in the study by Seminoff et al. (2006).
70
1645
1650
1655
1660
CHAPTER 2: Inferring the behavior of juvenile green sea turtles (Chelonia mydas) in a
shallow coastal habitat: augmenting time-depth-temperature records with visual
observations
ABSTRACT:
There are inherent limitations to inferring green sea turtle (Chelonia mydas) diving
behavior from time-depth recorders (TDRs) alone. Ground-truthing TDR data is imperative to
determine the actual behaviors of the turtles, and to learn the extent to which the TDR data can
be used to infer specific behaviors. Logistic regressions of video observational data, filmed
concurrently alongside TDR data on six juvenile green turtles at the Kawai’nui Marsh Estuary
(KME) in Kailua Bay, O’ahu, Hawai’i, were used to determine the extent to which the TDR data
could be used to describe six behaviors witnessed within the diving videos. Our results showed
that four behaviors (foraging, food searching, hovering, and breathing) could be reasonably
explained each by its own combination of specified TDR variables, while swimming and resting
behaviors could not be described by the TDR variables. Another set of logistic regressions, to
determine the effect of habitat on turtle behavior, determined that resting and breathing could be
detected in the ledge / channel habitat, and that hovering behavior could be detected across all
habitats, but no other behaviors could be described by TDR data alone. By comparing video-
recorded personal observations of juvenile green turtles to concurrent TDR data, this study
determined the true behavior performed at this shallow foraging site, and concluded that TDR
data alone can describe turtle behavior at KME to a great degree, but is insufficient on its own to
describe a turtle’s full behavioral repertoire. To best understand juvenile green turtle behaviors,
it is important that personal observations augment the deployment of TDRs to best ensure field
studies are capturing and describing the full behavioral repertoire of green turtles in
heterogeneous habitats.
71
1665
1670
1675
1680
1685
INTRODUCTION:
The advent of time-depth-recorders (TDRs) has provided insights into the diving
behavior of air-breathing marine vertebrates, including green sea turtles (Chelonia mydas).
Simple TDRs document patterns of depth utilization, surfacing behavior, dive durations, and
depth (Hays et al. 2007), from which researchers can infer behaviors (e.g., Glen et al. 2001;
Hazel et al. 2009; I-Jiunn 2009). More sophisticated units also collect data on ancillary
parameters, such as water temperature, swim speed, acceleration, flipper beat frequency, and
compass heading.
However, there are limitations associated with inferring behavior from TDR data. Short
dives with continuous depth fluctuations during the bottom phase are normally considered
foraging events (e.g., Brill et al. 1995; Makowski et al. 2006) while longer dives to a fixed depth
are considered resting events (e.g., Hays et al. 2000b; Southwood et al. 2003). In certain cases,
assigning individual behaviors to dive profiles can be misleading without independent visual
confirmation (Houghton et al. 2000; Heithaus et al. 2001), especially in instances when turtles
perform multiple activities during a single dive (Hochscheid et al. 1999). For instance, green
turtles have been known to perform both active (e.g., Hochscheid et al. 1999; Houghton et al.,
2002) and passive (e.g., Hays et al. 2000b; Southwood et al. 2003) behaviors on similar dive
profiles (Hays et al. 2004), making it often impossible to determine activities exclusively on the
basis of its dive profiles. Dives with extended periods spent along the sea floor can involve
resting (Hochscheid et al. 1999; Seminoff et al. 2006) as well as movement along the seabed,
suggesting the turtles are likely searching for prey (Hazel et al. 2009). Specific dive types may
also include other unsuspected behaviors. For instance, green turtles observed rubbing against
rocks and sponges to self-clean yielded dive profiles very similar to those from foraging turtles
72
1690
1695
1700
1705
1710
145
(Heithaus et al. 2002). To complicate matters further, dives to the sea floor can actually indicate
up to three different types of foraging behavior (Seminoff et al. 2006).
Another major problem with inferring behavior is that TDR data lack a spatial context to
discriminate the location of specific dives (Blumenthal et al. 2010; Witt et al. 2010). This is
problematic as green turtle diving behavior can vary within a single habitat, or can vary amongst
many sites, such as foraging sites and even inter-nesting sites, where turtles are believed to
primarily rest on the seabed in between nesting events. Despite what is commonly believed, at
inter-nesting sites the spatial context of, and proximity of food availability may determine
whether an adult female green turtle will predominantly forage or rest (e.g., Hochscheid et al.
1999; Hays et al. 2000a; Godley et al. 2002; Hays et al. 2002). Differing behavior by depth and
location has also been documented in loggerhead turtles (Caretta caretta) and in hawksbill
turtles (Eretmochelys imbricata; Houghton et al. 2002, 2003). Individual turtles may also vary
their diving behavior by season, time of day, and habitat (Southwood et al. 2003, Makowski et
al. 2006). While TDRs have revolutionized the study of turtle diving behavior, they cannot
describe the full range of behavioral patterns that can be documented using visual observations
(Houghton et al. 2002, 2003; Schofield et al. 2006). Visual behavioral observations are critical
for confirming inferences derived from electronic tags (Hochscheid et al. 1999; Houghton et al.
2003; Schofield et al. 2006).
Most visual observations of sea turtle behavior have relied on the Crittercam, a video-
TDR, which records video or still images of the turtle and its environment, concurrently with
standard diving and environmental data (time, depth, and water temperature) (e.g., Heithaus et al.
2002; Seminoff et al. 2006). A study by Heithaus et al. (2002) used Crittercam to document
green turtles rubbing their bodies on rocks and sponges to clean themselves, a previously
73
1715
1720
1725
1730
unknown behavior. Other studies of sea turtle behavior involve personal observation alongside
TDR deployments (e.g., Davis et al. 2000; Houghton et al. 2000; Hays et al. 2002; Blumenthal et
al. 2009); these studies often involve casual observations, which are not part of a carefully
designed sampling regime but occur opportunistically (e.g., before re-capture for TDR retrieval).
Traditionally, research of green sea turtle (Chelonia mydas) movements and diving
behavior has focused on adult females during the inter-nesting period (e.g., Hays et al. 1999;
Hochscheid et al. 1999; Hays et al. 2000b) or their subsequent migrations (e.g., Rice and Balazs
2008) in deep oceanic water, with more recent diving and tracking studies also focusing on
juvenile turtles. These young, immature turtles can spend 20 or more years in neritic foraging
and resting habitats, (Seminoff et al. 2002; Balazs and Chaloupka 2004; Makowski et al. 2006).
Juvenile turtle coastal habits make them susceptible to potential negative interactions with
humans during this prolonged life stage, including interactions with fishing gear and vessel
strikes (Hazel et al. 2007; Chaloupka et al. 2008a). Understanding juvenile green turtle behavior
in shallow coastal habitats is critical to determine their time allocation to feeding and resting, and
to ascertain where and when they are most susceptible to human impacts.
Yet, shallow-water studies are challenging for electronic tagging. Studying juvenile sea
turtle behavior has proven difficult because tagged individuals are often difficult to recapture.
Recent advances in technology have resulted in the miniaturization of electronic tags which
enables researchers to track smaller animals (Godley et al. 2008). Tracking has also traditionally
been inhibited by logistical constrains: most satellite tags are not capable of mapping small-scale
(few km) foraging sites (Hazel et al. 2009) and very high frequency (VHF) acoustic tags require
an intensive fieldwork effort, which render acoustic tracking studies prohibitive. Despite the
revolutionary advent of miniaturized TDRs for the study of juvenile sea turtle diving behavior
74
1735
1740
1745
1750
1755
150
and small-scale movements (Houghton et al. 2003; Myers et al. 2006; Witt et al. 2010),
fundamental data on green turtles in their foraging grounds remains scant (Hazel 2009).
This study seeks to determine to what extent juvenile green turtle behaviors (e.g., resting,
foraging, and breathing) can be inferred solely by the use of time-depth-temperature-recorders
(TDTRs). Through the comparison of TDTR data alongside visual observations made from
video recordings of juvenile green turtles in the Kawai’nui Marsh Estuary on O’ahu, Hawai’i, we
will determine for which behaviors TDR data inferences are valid and for which ones ground-
truthing using visual observation is required.
METHODS:
Study Area
The Kawai’nui Marsh Estuary (KME) study area is located at the northern end of Kailua
Bay on the island of O’ahu, Hawai’i (21° 25’ N, 157° 44’ W, Figure 1), encompassing six
different habitats (cove, channel, ledge, canal, rocky shore, and bay) spanning approximately 0.5
km2
. At the northern edge of KME is a shallow (0.5-1.5 m) cove with pavement-type coral reef
and carbonate rock, with macroalgae and invertebrates covering 50-90% of the substrate (NOAA
CCMA 2007). Bordering this cove is a dredged channel connecting to a man-made 2.75 km-
long canal, both of which have sandy to muddy substrate and are 3-4 m deep, leading to the
Kawai’nui Marsh. On either side of the channel is a vertical ledge, primarily composed of rock,
dead reef, macroalgae, and sessile invertebrates. Commonly, the channel and ledge will be
included as the same habitat. On the south side of the channel is another relatively shallow (0.5-
3.0 m) reef/rock flat habitat, known as Kailua Bay, which also supports abundant macroalgae
and sessile invertebrates (NOAA CCMA 2007). The shallowest portion (0-0.5 m) is hereafter
75
1760
1765
1770
1775
referred to as the rocky shore (Figure 2). The marsh is 336 hectares in size, and drains through
the canal into the ocean. Visibility was typically poor (approximately 2-10 m visibility),
especially at the mouth of the canal, with the highly eutrophic and silty fresh water input from
the marsh.
Turtle Capture and Marking
Juvenile green turtles were captured at KME by personnel from the National
Oceanographic and Atmospheric Administration’s Marine Turtle Research Program (NOAA-
MTRP), either by scoop net or hand capture, and were immediately brought to shore for
weighing, body measurements, and a general health assessment. NOAA-MTRP has been
studying green turtle population size, growth rate, and health at this site since 2000.
A unique identification number, approximately three cm tall by three cm wide and one
mm deep, was etched into the left and right sides of each turtle’s carapace. These numbers were
then painted white to aid identification of the turtle in the water while snorkeling. Additionally,
turtles were tagged with a passive integrated transponder (PIT) tag injected into each hind
flipper.
Time-Depth-Temperature Recorders (TDTRs)
In March, 2010, four individual turtles were equipped with time-depth-temperature
recorders (TDTRs; Lotek, model LAT 1500 – pressure accuracy of ± 1%, pressure resolution of
0.05%, temperature accuracy < 0.2 °C, temperature resolution of 0.05 °C) to monitor their diving
behavior. Two more turtles were equipped with TDTRs in June, 2010. Devices were attached to
the turtle’s carapace by an attachment method similar to the elastomer-fiberglass-resin protocol
76
1780
1785
1790
1795
1800
of Balazs et al. (1996). The temperature and depth sensors on the devices were left uncovered so
as not to interfere with data collection. After the fiberglass and resin hardened, each turtle was
returned to the water and released as quickly as possible to minimize stress.
Each of the six TDTR-tagged turtles (numbers T2, T15, T16, T17, T34, T37) were
equipped with one (T15, T34, and T37) or two (T2, T16, and T17) TDTRs. Each turtle received
one course-scale tag sampling water pressure and temperature every 15 seconds for
approximately 33 days (filling the device’s memory). Three turtles received a second fine-scale
tag sampling the same parameters every second for approximately two days. The collection of
two replicates of the dive data from the same individual, sampled at two different temporal
resolutions allowed us to test for potential inter-tag variability in the pressure and depth
measurements.
Field sampling occurred approximately once per month, between March and September
2010, with the goal of retrieving and re-deploying the TDTRs. Turtles were recaptured and
released after uploading their dive data in the field. Following Hazel et al. (2009), the minimum
depth value for each TDTR dataset was determined and added to all depth values to correct inter-
tag calibration differences. This correction assumes that the 15-second sampling captured a
turtle breathing at the surface at least once, during each 33-day deployment.
It is possible that data collection or measurement errors could have occurred with the
TDTR devices. The TDTRs have the inherent potential to collect false data, and negative depth
data created the need to subjectively tweak the data to remove these values. As the data
collected by the TDTR devices and behavioral observation videos did not begin on the same 15-
second intervals, it is possible that in shifting the TDTR data (by no more than eight seconds) to
match the video data, the TDTR data may not truly describe the behavior witnessed in the video.
77
1805
1810
1815
1820
1825
155
However, such a small time shift is unlikely to have created TDTR datasets which falsely
describe the true behavior witnessed within the videos.
Behavioral Survey Videos
To complement and validate the TDTR devices being used to characterize diving
behavior, focal-animal behavioral surveys were performed following Altmann (1974). During
the same six-month time period as the TDTR deployments, individual turtles were filmed in
KME by one snorkeler (DF) within three distinct habitat types: the cove, the adjacent channel
and ledge, and Kailua Bay (Figure 2). An Olympus Stylus 1010 digital camera with underwater
housing was used to video record the turtles, each video lasting for up to eight minutes. Videos
were shorter if sight of the turtle was lost due to poor visibility or if the turtle was continuously
resting in the same position for five minutes. A video length of eight minutes was chosen due to
camera battery and memory card capacity constraints, but if conditions allowed for it, longer
videos (up to ten minutes) were taken.
To randomize the surveys, the three habitats and three potential starting points within
each habitat were randomly chosen using a random number table. After arriving at the starting
position, the first turtle sighted within the targeted habitat would be selected, and filming would
start immediately upon approaching the turtle. All surveys occurred between 10:00 and 16:00
local time, when turtle abundance was highest (Asuncion 2010) and when the high sun angle
provided the best visibility. These surveys covered four tidal phases (flooding, ebbing, high,
low) spanning six consecutive 28-day lunar cycles, with each tidal phase being sampled twice
during each lunar cycle (once in each 14-day period).
78
1830
1835
1840
1845
During each video sampling day, the goal was to record two turtles within each of the
three habitats (cove, channel / ledge, and Kailua Bay) during the two-hour sampling period.
However, due to constraints such as varying turtle abundance and poor visibility, it was not
always possible to film two turtles within each habitat each day. In those cases, more turtles
were filmed in other habitats, if possible, to reach the goal of six videos per sampling session
(see Table 1 for a description of the location, tidal cycle, and lunar cycle associated with each
behavioral video).
During filming, the snorkeler remained at least two human body lengths (three meters)
away from the turtle at all times and moved with very slow and deliberate movements, to
minimize his influence on the turtles’ behaviors. Due to the great amount of human presence at
KME, turtles are habituated to snorkelers at this site, which allowed for observation without
disturbance. If a turtle appeared to be disturbed by my presence, video recording was
immediately ceased and the turtle was left alone.
Analysis of Behavioral Videos
Each video was analyzed to determine a set of behavioral parameters defined prior to data
collection (Table 2). Instantaneous behaviors were recorded on 15-second intervals (the same
sampling resolution as the TDTRs) beginning at the start and running through the end of each
video. These eight behaviors involved: foraging (searching for food and actively feeding), food
searching, resting, hovering, posing, swimming (with vertical and horizontal direction), face or
body “swiping,” and breathing. Three continuous behavioral variables were also quantified
beginning at the start and running through the end of each video: the number of flipper beats per
30 seconds, the number of bites per 15 seconds, and the timing of each breath (to the nearest
79
1850
1855
1860
1865
1870
160
second; whether or not it occurred on a 15-second interval). Additionally, the movement rate of
the turtle was deduced using a GPS device (Garmin, model eTrex Legend), attached to the
snorkeler and used to record position every 15 seconds.
Comparison of TDTR data to Behavioral Survey Video Data
A Matlab program was written to summarize 83 different depth and temperature
characteristics of the TDTR data for the length of each video, of which seven were chosen to
compare with video data. For depth, these characteristics included maximum, average, and
median depth of the turtle, total depth displacement, proportion of time spent between the surface
and 0.5 m depth, proportion of time spent below 0.5 m depth, and the coefficient of variation
(CV) of depth (as a means of determining activity level; e.g., Blumenthal et al. 2009). For
temperature, these summary parameters included average, median, maximum, and minimum
temperature, as well as the CV of the temperature.
We used two complementary approaches to synthesize the behavioral data: an ordination
of all the observed behaviors, followed by logistic regressions to characterize the common
individual behaviors. A non-metric multidimensional scaling (NMDS) analysis of the behavioral
variables was run to determine the relatedness of the occurrence of six individual behaviors
within the videos: foraging, food searching, resting, hovering, swimming, and breathing. Six
behaviors were chosen for this study on the basis of their occurrence in at least two of the 26
videos (see Table 3 for definitions): food searching, foraging, resting, general swimming,
hovering, and breathing (Table 4). Because many food searching events occurred without a
corresponding foraging behavior, food searching and foraging were considered separate
behaviors in these analyses, even though all foraging events occurred in videos with food
80
1875
1880
1885
1890
searching behavior. The behaviors of posing and body swiping were excluded in the analyses as
they each occurred only once in the 26 videos.
NMDS can be used to determine the relationship between objects or species (for instance,
presence/absence of turtle behavior) and environmental descriptors (for instance, TDTR
parameters) for non-metric, non-normal, and categorical data. This analysis looks for the best
ordination of n objects along k dimensions (axes) in order to minimize the amount of “stress” (an
indication of the model’s goodness of fit) within the final configuration. Using multiple
iterations, NMDS compares pair-wise distances of the objects in reduced space against the
dissimilarity of the objects in the real world (Clarke 1993). The NMDS was performed using the
PC-ORD software, with the Relative Sorensen distance metric, and statistical significance was
assessed with a randomization test (with 50 runs of real data and 999 runs of randomized data,
using the random starting point) (McCune and Grace 2002). The resulting ordination of
“samples” (turtle videos) and “species” (behaviors) is graphically represented in the context of
the TDTR parameters, plotted as environmental vectors relating to the ordination axes.
A second step involved using stepwise logistic regressions to determine if the length of
the behavioral survey video had an effect on the presence or absence of specific behaviors, when
the other TDTR variables were considered. Using the Systat 11.0 computer software, binary
stepwise (forward and backward) logistic regressions were used to determine if these TDTR
parameters could predict the presence or absence of these eight turtle behaviors (similar to the
methodology by Barnett-Johnson et al. 2007). The stepwise logistic regressions were followed
by complete logistic regressions for those behaviors where the TDTR parameters provided
significant results (alpha = 0.1 for marginal significance; this alpha value was selected for the
81
1895
1900
1905
1910
1915
logistic regressions only to be able to explain a higher percent of the occurrence of behaviors
through TDTR data alone). These logistic regressions provided a “logit” value defined as:
Li = log (pj / (1-pj)) = Σ(aij x bij) + c;
where
Li = logit value, or inverse of the logistic function, or linearly predicted value for the associated
behavior based on the combination of TDTR parameters with which the behavior is significantly
related;
i = the number of videos (ranging from 1-26);
j = the number of TDTR parameters (marginally) significantly related to the behavior;
pj = the probability (0-1) of the occurrence of a particular behavior;
aij = TDTR parameter value (marginally) significantly related to the behavior;
bij = the logistic regression estimated value, or “weight,” associated with each TDTR parameter;
c = a calculated constant, the line intercept.
Finally, to investigate finer-scale associations of the individual behaviors with specific
habitats, each of the videos was split into 2-minute segments. The GPS track of each 2-minute
segment was used to ascribe each 15-second location to a specific habitat. To address specific
habitat associations, only those 2-minute segments (tracks of 8 consecutive 15-second locations)
contained solely within one habitat (channel / ledge, Kailua Bay, cove, or rocky shore) were
considered in the subsequent analysis.
A G-test was used to analyze the potential association of the eight specific fine-scale
behaviors and the four habitats (Zar 1984). For the subset of behavior – habitat combinations
with a minimum of three occurrences – stepwise (forward and backward, alpha = 0.1) and
82
1920
1925
1930
1935
165
complete logistic regressions were used to relate the occurrence of the behavior to the TDTR
parameters.
RESULTS:
Dataset
Over the 6-month study period, 16 TDTR course-scale tags (15-second intervals) datasets
were uploaded from the six tagged turtles, 15 of which had usable, uncorrupted data (T2 =
2datasets, T15 = 3 datasets, T16 = 3 datasets, T17 = 1 dataset, T34 = 3 datasets, T37 = 3
datasets). Of the 277 total videos documenting turtle behavior, 26 recorded turtles also equipped
with TDTRs, yielding 26 individual videos of turtles with concurrent TDTR data (Table 1). The
videos with matching TDTR data were distributed throughout the 6-month study and cover all
four tidal cycle phases (low, rising, falling, high), all three of the habitats (cove, Kailua Bay, and
channel / ledge), and showcase four of the six TDTR-tagged turtles (turtles numbered 15 and 17
were not filmed while their TDTRs were active; Table 1). The videos range in length from two
to 10 minutes (average of 7.71 ± 1.53 (S.D.) minutes).
Seven TDTR parameters, calculated using the Matlab computer software (v. 7.4.0.287
(R2007a)) were chosen to compare the behavioral video observations: depth displacement, depth
coefficient of variation (CV), maximum depth, average depth, surface proportion (arcsine
transformed for normalization), average temperature, and temperature CV (Table 5). Even
though some of these parameters were highly cross-correlated (Table 6), they were all included
in the analyses to determine which parameters best predicted turtle behaviors. With highly
cross-correlated TDTR parameters, certain parameters may have been excluded from logistic
regression results; performing stepwise forward and backward logistic regressions avoided this
83
1940
1945
1950
1955
1960
potential problem. Dive duration, other than time within the top 0.5 m, was not used as a TDTR
parameter due to the shallow nature of the site, making it difficult to define dives based on shape
or duration. Dives were instead defined based on depth bins (0.5 m bins), similar to the methods
of Hazel et al. (2009). The 26 videos of varying durations were split into 99 different 2-minute
segments, 75 of which were contained solely within one habitat. Thirty-one (41.3%) occurred in
the channel / ledge, 11 (14.7%) in the cove, 23 (30.7%) in Kailua Bay, and 10 (13.3%) in the
rocky shore.
Comparison of Presence/Absence of Behaviors (NMDS Analysis)
A three-dimensional answer was identified as the best non-metric multidimensional
scaling analysis (NMDS) solution, when considering the reduction in stress (including axes until
the reduction in minimum observed stress < 5) and the p-values (p < 0.05) for each axis (Figure
3). Final stress was 5.34, indicating a minimal risk of drawing false conclusions from the NMDS
plot (McCune and Grace 2002). Three axes explained a total of 97.0% of the variation, with axis
1 explaining 54.4% (p = 0.001), axis 2 explaining 7.5% (p = 0.001), and axis 3 explaining 35.0%
(p = 0.001). As axes 1 and 3 explain the highest amount of variance (total of 89.4%), these axes
were used to describe the relationships between the occurrences of the six behaviors within each
of the 26 behavioral videos.
The NMDS revealed three widespread behaviors (hovering, breathing, and swimming),
two restricted behaviors (foraging and food searching) associated with specific TDTR
parameters, and one highly-restricted behavior (resting) associated with very specific TDTR
parameters. The three behaviors of hovering (16 presences / 10 absences), swimming (22
presences / 4 absences), and breathing (14 presences / 12 absences) were clustered together close
84
1965
1970
1975
1980
170
to the origin of the NMDS plot, indicating that these were frequent, generalized behaviors not
necessarily related to any specific TDTR parameter. Swimming was often interspersed with
hovering behavior, especially as the turtles would often swim very slowly, pausing in the mid-
water column before resuming their flipper beats. While all videos including foraging also
involved food searching behavior, turtles also quite frequently interspersed hovering between
consecutive foraging events, underscoring the close association of these behaviors. Yet, because
the hovering behavior was observed more frequently in the 26 videos than foraging (9
presences / 17 absences) and food searching (11 presences / 15 absences), it is the closest to the
origin and to other behaviors. Foraging and food searching were closely grouped together,
indicating that the occurrence of these behaviors was closely linked. Both were similarly
positioned along axis 1. Resting (8 presences / 18 absences) behavior was positioned at the
opposite end of axis 1 and appears distinct from all other behaviors, as its presence within a
video was least related to the presence of other behaviors.
The Kendall (non-parametric, tau) correlations revealed associations of the TDTR
parameters with the NMDS axes (Table 7). Foraging and food searching were positively related
with depth displacement, video length (axes 1 and 3), average depth, and maximum depth (axis
3). The behaviors of hovering, breathing, and swimming were related to depth displacement
(axis 1), surface proportion, temperature CV, depth CV, and average temperature (axes 1 and 3).
Resting was found at the opposite end of axis 1 from the two other clusters, indicating that the
occurrence of this distinct behavior was therefore negatively related to depth displacement (axis
1) and surface proportion (axes 1 and 3), but positively related to average depth and maximum
depth (axes 1 and 3).
85
1985
1990
1995
2000
2005
Few TDTR parameters were significantly related with any of the NMDS axes (Table 7).
Depth displacement was significantly positively related with axis 1, highlighting the association
of foraging, food searching, hovering, swimming, breathing, and swimming with a great deal of
vertical movement, as the turtle actively moves up and down in the water column. Conversely,
resting is negatively related to TDTR depth displacement – as depth displacement decreases, the
amount of resting increases. The turtles did perform other behaviors in five of the eight videos
involving resting, however, aligning resting behavior positively with depth displacement on axis
3, which explains a much smaller amount of the observed variance than axis 1.
Maximum and average depth were significantly aligned positively with foraging, food
searching, and resting along axis 3, suggesting that these behaviors occur at deeper depths.
Indeed, the majority of the foraging that was video-recorded occurred in Kailua Bay, which is
deeper (2-3 m) than the cove (0.5-1 m) where turtles commonly forage on algae. Maximum and
average depths were also negatively significantly related to axis 1, suggesting resting occurred in
deeper water than foraging activities. Resting was commonly witnessed under the ledge in the
channel habitat, at deeper (2-3 m) depths.
TDTR surface proportion is correlated positively with breathing and swimming (axes 1
and 3), indicating that these behaviors are associated with spending time within the top 0.5 m of
the water. Breathing must occur at the surface, and swimming behavior occurred at all depths.
The association between swimming and surface proportion may be coincidental as swimming
behavior is so close to the origin (indicating its close relationship will all other behaviors), or
may be a result of the disproportionate turtle use of shallow water (0-1 m) habitats.
Depth CV is negatively related to average depth and maximum depth (axes 1 and 3),
indicating that as turtles spent more time in deeper water, their depth did not fluctuate as much.
86
2010
2015
2020
2025
In other words, the turtles were diving to deeper depths and remaining there, whether for
foraging or resting, rather than transiting from the surface to the bottom repeatedly. Average
temperature, negatively significantly related to axis 3, and temperature CV were both associated
positively with axis 1 and negatively with axis 3. Because these parameters are correlated
negatively with foraging, food searching, and resting along axis 3, these behaviors are associated
with homogeneously colder water temperature. However, average temperature and temperature
CV are positively associated with all behaviors (except resting) along axis 1. This result
suggests that average temperatures are higher near the surface and that the turtles experience a
larger amount of temperature fluctuation as they swim up and down while foraging, swimming,
and breathing.
The one conditional parameter not related to TDTR values was video length. This
parameter is associated with both axes 1 and 3, and points in the direction of foraging and food
searching (Figure 3). Therefore, this result suggests that as the length of the behavioral survey
video increases, the likelihood of observing foraging or food searching increased.
Comparison of TDTR Parameters with Behavioral Observation Videos (Logistic Regressions)
Stepwise (forward and backward) binary logistic regressions revealed that four of the six
behaviors documented in the videos were significantly related with one or more TDTR
parameters when combined into a logistic or logit function (Table 8a-b). Complete logistic
regressions using these four behaviors and their associated significant TDTR parameters
revealed that none of these four behaviors could be predicted 100% of the time (“percent
correct” values, Table 8a), although percentages were fairly high, and that the probability of the
occurrence of each behavior was not a binary (0% or 100%) response based on the logit function
87
2030
2035
2040
2045
2050
175
relationship of the associated TDTR parameters (Figures 4-7). The lack of significance of the
survey video length as a predictor parameter suggests that the varying video lengths did not
introduce biases in the behavioral observations, since the ability to observe any given behavior
did not vary significantly with changes in the length of the observation period.
Following previous examples, three metrics were used to quantify the ability of the
TDTR parameters to predict the occurrence of a specific turtle behavior (Barnett-Johnson et al.
2007; Tinker et al. 2007). Sensitivity represents the proportion of actual positives, which are
identified as such (the number of data points in which both the video and TDTR data agreed a
behavior occurred), and specificity represents the proportion of negatives, which are correctly
identified (the number of data points in which both the video and TDTR data agreed a behavior
did not occur). By using these values, the percent correct value can be determined, giving an
overall assessment of the likelihood than any particular logit value will correctly predict the
occurrence of a particular behavior. If the presence and absence of a behavior was perfectly
predicted by its associated logit value, the sensitivity, specificity, and percent correct values
(Table 8a) for this behavior would all have a value of 1.00 or 100%.
A potential downfall with the analysis is that it utilized a relatively small sample size (26
videos), and therefore may not accurately depict the relationship of TDTR parameters to personal
observation. Additionally, specific behaviors were removed from the logistic regression analysis
(posing and body swiping) as their presence/absence data were not evenly distributed, each only
occurring in one of the 26 videos. Dive behaviors could not be assigned to typical dive profile
“shapes” as the shallow nature of the study site prevented this (Houghton et al. 2002), which is
one of the primary methods employed by researchers in describing turtle behavior. These factors
may make it difficult to apply the conclusions from this study to other relevant studies.
88
2055
2060
2065
2070
2075
Foraging: depth displacement, and depth CV (Figure 4)
Foraging behavior was related to the combination of increasing TDTR depth
displacement, and decreasing depth CV (Table 8a). Because foraging behavior was positively
correlated with depth displacement, turtles likely exhibit more vertical movement (greater depth
displacement) on foraging dives. With a positive estimate value, as the odds ratio for depth
displacement is greater than one, as a turtle increases its depth displacement, the likelihood of
foraging behavior increases. Therefore, the degree of a turtle's vertical movement can serve as a
proxy for foraging activity.
Foraging was also related to decreasing depth CV, suggesting that as a turtle’s bottom
depth becomes steadier, foraging behavior is more likely. This result contrasts with the
relationship between foraging and depth displacement. It may be possible that if turtles spent a
great amount of time foraging along the substrate, with minimal trips to the surface to breathe,
this could result in a small depth CV value. But, as the 95% confidence intervals for the odds
ratio of this parameter cross the value of one, and it has only marginal significance with this
behavior (p = 0.06), there may also be times where foraging behavior would occur when the
turtle exhibits a greater amount of variation in its depth throughout the video. It is important to
remember that in order to predict the presence/absence of foraging behavior, the logistic
combination of both TDTR parameters must be considered. A low sensitivity value (0.57) shows
that the logistic regression performed poorly in showing agreement between the TDTR logit
value and video evidence of the occurrence of foraging behavior. However, with a fairly high
specificity value (0.77), the overall percent correct value was 70.0%, indicating that foraging can
be inferred from TDTR data with fairly high confidence, but is not perfect in predicting the
behavior.
89
2080
2085
2090
2095
180
Food searching: depth displacement, depth CV, and surface proportion (Figure 5)
Food searching behavior was related to the combination of increasing TDTR depth
displacement, decreasing depth CV, and increasing surface proportion (Table 8a). The odds ratio
value above 1 confirms that as TDTR depth displacement increases, the probability of food
searching increases. As with foraging, food searching is negatively related to depth CV,
indicating that the occurrence of this behavior increases with smaller depth CV values. While
food searching, the turtles skimmed along the substrate, rarely changing their depths. However,
with an odds ratio 95% confidence limit crossing the value of one, and a marginally significant
p-value of 0.07, this negative relationship may not always hold – food searching did also occur
with increasing depth CV values, as the turtles would surface to breathe.
The occurrence of food searching increases with a larger proportion of time spent within
the top 0.5 m of the water column. This result may be due to the turtles tendency to search for
food in the shallow cove (where algal abundance is high), or from their tendency to take multiple
breaths interspersed with food searching. Although the odds ratio 95% confidence limit interval
crosses one, this relationship on its own did not always hold true. Therefore, the combination of
this TDTR parameter, along with depth displacement and depth CV are needed to predict the
occurrence of food searching behavior.
Even though food searching occurred in every video involving foraging, foraging did not
occur every time food searching was witnessed (Table 4), possibly because the turtles were not
able to locate algae for consuming, or the currents or surge were too strong to allow them to
graze. This may explain why food searching behavior is closer to the origin of the NMDS than
foraging behavior. Despite the more generalized nature of searching behavior, its predictability
increased above that of foraging: with sensitivity of 0.82, specificity of 0.87, and a higher correct
90
2100
2105
2110
2115
2120
percentage (84.4%). This greater explanatory power may be due to the inclusion of a third
TDTR parameter – surface proportion. The more variables to explain a behavior, the more likely
it is to be able to predict the presence or absence of that particular behavior. With such a high
confidence level for food searching, this behavior is well predicted by the TDTR parameters.
Hovering: depth displacement (Figure 6)
Hovering behavior was related to increasing TDTR depth displacement (Table 8a).
Because the presence/absence of hovering is also closely related to foraging and food searching
(Figure 3), it was also significantly related to TDTR depth displacement. This relationship is
intuitive, since turtles hover while approaching the substrate before taking a bite, and between
consecutive bites. An odds ratio value above 1 once again shows that as TDTR depth
displacement increases, the probability of hovering increases. However, even though the
sensitivity value is fairly high (0.71), the specificity value is rather low (0.53), indicating that the
logistic regression performed poorly because TDTR values consistently predicted the presence of
hovering behavior not confirmed by the videos. A lower overall percent correct value of 64.1%
suggests that the TDTR depth displacement parameter can predict the occurrence of hovering,
but was not ground-truthed as accurately as foraging or food searching behaviors.
Breathing: average temperature, depth displacement, and maximum depth (Figure 7)
Breathing behavior was related to the combination of increasing TDTR average
temperature, increasing depth displacement, and decreasing maximum depth (Table 8a). The
relationship of breathing behavior with average water temperature likely results from the shallow
nature of the site, which leads to warmer surface water. Therefore, as breathing occurs at the
91
2125
2130
2135
2140
surface, it is related to warmer water temperatures. However, the odds ratio 95% confidence
interval crossing the value of one suggests that the association of breathing in warm surface
waters did not always hold true. Buoyant fresher and cooler surface water from the Kawai’nui
Marsh may occasionally have replaced the warmer surface water, causing a negative relationship
of water temperature and the occurrence of breathing behavior.
Because turtles must swim to the surface to breathe, and often rest in deeper water, the
significant relationship of this behavior with depth displacement and maximum depth is justified.
However, resting turtles did occasionally swim to the surface for an extended breathing bout
followed by re-submergence, never to resurface again during the video. This behavioral pattern
may have resulted in a marginally significant relationship between breathing behavior and TDTR
maximum depth, with an odds ratio 95% confidence limit interval which crosses the value of
one. However, the logistic regression predicted this behavior with a fairly high sensitivity (0.80),
specificity (0.77), and overall percent correct (78.8%) values due to the combination of multiple
TDTR values.
Behavioral survey video length as a confounding parameter
The analysis of the logistic regressions using behavioral survey video length as a
potential parameter which could affect the ability to detect specific behaviors did not yield any
significant relationships (p < 0.1) with any behavior. It was hypothesized that certain behaviors,
such as breathing and swimming, may be positively related to video length as these are
generalized behaviors that all turtles perform at regular intervals, or that the frequency of more
specific behaviors, such as foraging and food searching behavior would increase with increasing
video length as the likelihood of those activities being captured on film would increase.
92
2145
2150
2155
2160
2165
185
Predicting Behaviors within Habitat Using 2-Minute Video Segments
The contingency tables (G-tests; Table 9) analysis of the occurrence of each behavior
within specific habitats revealed a lack of independence for four “specialized” behaviors:
foraging, food searching, resting, and breathing behaviors. It was expected that foraging, food
searching, and resting would occur within specific habitats as the majority of foraging and food
searching was witnessed within the cove, Kailua Bay, and rocky shore habitats, and resting was
primarily seen under the ledge habitat within the channel. However, breathing was also
dependent on habitat. This behavior never occurred in Kailua Bay (on 15-second interval data
points), even though it did occur in the channel / ledge, cove, and rocky shore habitats. While
breathing is expected to occur in the foraging habitats (Kailua Bay, cove, and rocky shore), it
also occurred in the channel / ledge when resting turtles surfaced to breathe. Conversely, two
generalized behaviors occurred widely, independent of habitat: hovering and swimming. These
generalized behaviors are often interspersed with foraging and breathing, or even follow resting
behavior.
Stepwise logistic regressions to determine which TDTR parameters were significantly
related to specific behaviors within particular habitats revealed three significant relationships.
Resting behavior was significantly related to increasing TDTR average depth and decreasing
maximum depth in the channel / ledge; breathing behavior was significantly related to increasing
TDTR temperature CV in the channel / ledge; and hovering behavior was significantly related to
decreasing TDTR average temperature, increasing depth displacement, and increasing surface
proportion across all habitats. Complete logistic regressions relating the occurrence of these
behaviors to their associated significant TDTR parameters within specific habitats revealed that
behaviors were predicted more accurately without partitioning behavior by habitat (Table 10a-b),
93
2170
2175
2180
2185
2190
as the logistic regressions of the 2-minute video segments yielded smaller sensitivity, specificity,
and percent correct values than the logistic regressions of the full videos. The ability to predict
hovering behavior decreased to 62.0% for all habitats (from 64.1%) and breathing behavior
(within the channel / ledge) decreased to 69.0% (from 78.8% from all habitats). However,
resting behavior was found to have a significant relationship with specific TDTR parameters
within the channel / ledge (whereas it had no significant relationship with the analysis from the
full videos), the model allowing the behavior to be predicted correctly 77.0% of the time.
Resting: TDTR average depth and decreasing maximum depth in the channel / ledge
Resting was significantly related to decreasing maximum depth and increasing average
depth within the channel / ledge, the only habitat where this behavior occurred (Table 10a). In
particular, the TDTR average depth parameter has a larger influence on the logit value for each
2-minute video segment, given its larger coefficient estimate. As stated above, the turtles did
rest under the ledge within the channel, at the deeper depths within the site. This behavior can be
predicted correctly within the channel / ledge 77% of the time (with a sensitivity of 0.71 and
specificity of 0.82) using these two TDTR parameters alone.
Breathing: TDTR temperature CV in the channel / ledge
Although breathing behavior occurred in three of the four habitats (channel / ledge, cove,
and rocky shore), it was only significantly related to the TDTR parameter of temperature CV
within the channel / ledge (Table 10a). The significance of the TDTR temperature CV may be
related to the turtles’ swimming from deep resting locations (approximately 2-3 m) to the surface
to take a breath. This behavior was predicted correctly 69.0% of the time, with a sensitivity of
94
2195
2200
2205
2210
190
0.40 and specificity of 0.79. As breathing behavior did occur in Kailua Bay (during 2-minute
segments that spanned multiple habitats), and with such a low sensitivity, this result must be
taken with caution.
Hovering: TDTR average temperature, depth displacement, and surface proportion across all
habitats
Hovering behavior, which was a widespread behavior independent of habitat, was found
significantly related to decreasing average temperature, increasing depth displacement, and
increasing surface proportion (Table 10a). Hovering turtles do not stay at one depth level, but
rather move up and down, leading to an increasing TDTR depth displacement. Hovering turtles
also experience cooler water temperatures in the deeper water when slightly negatively buoyant
(leading to a decreasing TDTR average temperature), and spend more time within the top 0.5 m
of the water column when slightly positively buoyant (leading to an increasing TDTR surface
proportion), leading to a sensitivity of 0.63, specificity of 0.60, and correct percentage value of
62.0%.
DISCUSSION:
Comparison of Presence/Absence of Behaviors (NMDS Analysis)
Behaviors were separated into three groups according to the NMDS, indicating that
specialized behaviors (foraging and food searching) and highly specialized behaviors (resting)
occur independently of each other, with generalized behaviors (swimming, breathing, and
hovering) occurring amongst all types of specialized behaviors. In three of the eight videos
involving resting behavior, the turtles performed no other behavior (including any generalized
95
2215
2220
2225
2230
2235
behaviors), resting for the entire duration of the video. This is not surprising, given evidence that
green turtles can rest in shallow foraging locations for up to 60 minutes (Hazel et al. 2009). In
the other five videos involving resting, the behavior was almost always followed by breathing
(whether or not it was recorded on the instantaneous 15-second interval), and subsequently
swimming behavior. The separation of active and inactive behaviors has been frequently
encountered in green turtles (e.g., Mendonca 1983; Hays et al. 1999; Hays et al 2000b; Seminoff
et al. 2001; Makowski et al. 2006; Rice and Balazs 2008; Hazel et al. 2009; I-Jiunn 2009;
Blumenthal et al. 2010). Hawksbill turtles also partition their resting and foraging behaviors into
different time periods of the day (van Dam and Diez 1996; Blumenthal et al. 2009; Witt et al.
2010). At some locations, turtles will perform resting and foraging behaviors in conjunction
with one another, such as in Cyprus (Hochscheid et al. 1999) and at Laguna San Ignacio, off the
Pacific coast of Baja California, Mexico, where green turtles are active at all times of the day
(Senko et al. 2010), indicating that they must interchange active dives with resting dives on a
regular basis. Juvenile hawksbill turtles have also shown an alternating pattern of short foraging
dives followed immediately by deeper, longer resting dives (Houghton et al. 2003).
Foraging and food searching behaviors were positively related with depth displacement,
and average and maximum depth, indicating that the turtles were swimming from the substrate,
where they would forage or search for algae, to the surface frequently while performing these
behaviors. Foraging and food searching dives involve a higher metabolic demand than inactive
dives (Hays et al. 1999), likely due to the extra vertical movement turtles must exhibit to
replenish their quickly depleted oxygen stores (Houghton et al. 2003). Resting behavior was
primarily negatively related to depth displacement and surface proportion, indicating less vertical
movement and less time at the surface on resting dives, despite performing other behaviors
96
2240
2245
2250
2255
alongside resting in five out of eight videos. Resting behavior was also positively correlated
with average and maximum depth. Green turtles have previously been documented to rest in
deeper water in Hawai’i (Brill et al. 1995) and in other locations (Bjorndal 1980; Mendonca
1983; Southwood et al. 2003; Makowski et al. 2006; Yasuda and Arai 2009). Generalized
behaviors were positively related with depth displacement, surface proportion, temperature CV,
average water temperature, and depth CV, showing that the turtles would greatly vary their depth
while performing these behaviors, with higher water temperatures nearer the surface.
Comparison of TDTR Parameters with Behavioral Observation Videos (Logistic Regressions)
The logistic regression analyses confirm certain inferences made regarding the
relationships of specific behaviors to specific TDTR parameters from the NMDS. The logistic
regressions indicate only four (marginally) significant relationships between the TDTR
parameters and the witnessed behaviors, these inferences must be considered with caution,
particularly as so many parameters have a p-value above the critical value of 0.05 suggesting
only marginal or non-significance.
Foraging: depth displacement, and depth CV; Food searching: depth displacement, depth CV,
and surface proportion (Figures 4-5)
The combination of increasing TDTR depth displacement and decreasing depth CV were
ground-truthed as a fairly reliable proxy for a turtle’s foraging and food searching activities.
Turtles must surface frequently while foraging or food searching to replenish quickly depleted
oxygen stores during heavily exertive activities, such as foraging (Houghton et al. 2003;
Southwood et al. 2003). For instance, I-Jiunn (2009) found that on active-type dives turtles stay
97
2260
2265
2270
2275
2280
195
at specific depths for very short time periods, consequently exhibiting a great amount of vertical
movement, resulting in an erratic bottom profile with a high standard deviation of bottom depth.
This is in direct contrast to the second component that was found in the current study to describe
foraging and food searching behaviors: along with increasing depth displacement, foraging
behavior also occurred as a turtle’s bottom depth became steadier (decreasing depth CV). It is
likely that a small sample size may have caused this contrast, causing a marginally significant
result that would have otherwise been insignificant. Food searching behavior was described by a
third TDTR variable as well – increasing time within the top 0.5 m of the water column. The
shallow cove, full of algae, was consistently used by the turtles for foraging. Green turtles are
known to forage at shallower depths than where they perform other behaviors (Seminoff et al.
2001; Salmon et al. 2004; Hart and Fujisaki 2010).
Hovering: depth displacement (Figure 6)
Hovering was positively related with TDTR depth displacement. The changing depths
associated with hovering may have been due to currents or slight flipper movements moving the
turtles vertically. Breath size may have also affected a turtle’s vertical movement while
hovering. The number and sizes of breaths sea turtles take regulates the balance of gasses within
their bodies (Hochscheid et al. 1999) and controls their underwater buoyancy, determining the
depth at which the turtle will reach neutral buoyancy as its lungs compress as the turtle dives
(Hays et al. 2000b). When returning to the surface, the lungs expand, assisting the turtle to reach
the surface, expending less energy to do so (Hays et al. 2007). As turtles would begin to move
slightly vertically, their lung volume would change, affecting their buoyancy, and likely further
augmenting their vertical movements.
98
2285
2290
2295
2300
2305
Breathing: average temperature, depth displacement, and maximum depth (Figure 7)
Breathing was significantly related to increasing depth displacement and decreasing
maximum depth. Turtle submergence intervals and diving depths are strongly related to activity
level (Brill et al. 1995; I-Jiunn 2009), with Hawaiian green turtles known to take a single breath
between subsequent shallow foraging bouts and only taking a few seconds before returning to
their foraging (Rice et al. 2000). A greater amount of activity (increased depth displacement)
will require that the turtles surface to regulate the oxygen gas balance (Hochsheid et al. 1999).
Long duration dives in shallow sites, such as in the current study, are often associated with
resting behavior on the sea floor (Hays et al. 1999), resulting in a lower overall activity level and
therefore fewer number of breaths when in slightly deeper waters. Brill et al. (1995) also found
that long and regular dives by green turtles were associated with minimal movement on the
substrate (defined as resting behavior), while dives with more activity were typically much
shallower and shorter in duration (defined as foraging behavior), and involved more surfacing
events. Colder water temperatures have also been linked to longer dives, and therefore fewer
breathing events (Hazel et al. 2009), making it more likely for breathing to occur in warmer
water, as was found in the current study.
Other behaviors not significantly related to TDTR parameters
It is quite impressive that no other significant logistic regression relationships occurred,
particularly for the behavior of resting, which is separated from all other behaviors within the
NMDS. Yet, because of the long duration of the videos, the signature of resting behavior in the
TDTR record was likely blurred. Five out of eight videos in which resting occurred also
involved other behaviors with substantial vertical displacement, like breathing and swimming.
99
2310
2315
2320
2325
200
And, as swimming behavior was performed in 22 of the 26 videos, its presence may have been
too pervasive for TDTR data to describe it.
It is also interesting that no individual behavior (other than breathing behavior being
marginally related to increasing average water temperature) was directly related to any
temperature parameters, possibly due to the shallow nature of the site with minimal temperature
changes from the surface to the bottom. In the current study, the TDTR temperature varied only
slightly during these 26 videos (maximum difference of 2.19°C, average of 0.56 ± 0.54°C S.D.)
A lack of a relationship between behavior and water temperature has been found in previous
studies. I-Jiunn (2009) found a non-significant relationship between water temperature and the
length of the inter-nesting interval at Wan-an Island, Penghu Archipelago, Taiwan, suggesting
minimal behavioral thermoregulation. Yasuda and Arai (2009) also found no noticeable effect of
water temperature on the diving behavior of green turtles at Huyong Island, Thailand, perhaps
because they inhabited a small temperature range (mean ambient water temperature during the
bottom phase of dives ranging from 28.23 ± 1.54 °C S.D. to 29.31 ± 0.69 °C S.D.). Due to the
small difference in water temperature found in the current study, it is very unlikely that it had an
effect on buoyancy (Rice and Balazs 2008). Therefore, temperature was very unlikely to affect
turtle behavior.
Behavioral survey video length as a confounding parameter
One major difference between the NMDS analysis and the logistic regressions is that the
logistic regressions suggest that video length is not related to any behavior, while it is related to
foraging and food searching behaviors in the NMDS, although the NMDS result was not
statistically significant. It is possible that the overall maximum video length (eight to ten
100
2330
2335
2340
2345
2350
minutes) was too short to significantly capture any behavioral events. Therefore, there was no
evidence of a confounding effect by the video length variable within the logistic regression
analyses, as it was not significantly related to the occurrence of any of the behaviors considered.
Predicting Behaviors within Habitats Using 2-Minute Video Segments
A smaller explanatory power than with the logistic regression results utilizing full video
lengths may be due to a smaller dataset, as the 2-minute video segments utilized only 8 data
points, possibly not a large enough sample size to obtain higher percentage correct values.
Tinker et al. (2007) found incredible variation between feeding bouts for sea otters, likely due to
their small TDR sample size when utilizing the logistic regression method. However, increasing
the time length of the video segments connected to specific habitats would have greatly
decreased the overall number of records of turtles within one habitat, making this analytical
method impractical. It is important to note that the logistic regression analysis using the 2-
minute video segments is a novel method to relate turtle behaviors to TDTR parameters within
specific habitats. The 2-minute snapshots were selected to separate the videos into four discrete
segments, each within a unique specific habitat. Because this fine-scale analysis used multiple
consecutive segments from the same videos, with different segments and videos per tagged
turtle, any estimates of turtle behavioral rates would be susceptible to pseudoreplication,
potentially inhibiting or biasing the results, describing differences amongst turtles and not
habitats (Hurlbert 1984).
101
2355
2360
2365
2370
Significant Results, 2-minute logistic regressions
Foraging, food searching, resting, and breathing behaviors were found to be habitat-
dependent behaviors, with resting and breathing each significantly described by TDTR
parameters. Hawaiian green turtles are known to perform habitat-specific behaviors. Typical
foraging grounds include reef flats and shallow rocky shelves, often not exceeding three meters
in depth (like the cove and rocky shore), and turtles often rest in vertical crevices or vertical-
walled channels within a reef flat, both of which are typically shallower than eight meters (like
the channel and ledge; Balazs et al. 1987; Rice et al. 2000). Breathing was also found to be a
site-specific behavior, but only did not occur in Kailua Bay when dividing videos into 2-minute
segments solely contained within a specific habitat. As turtles must surface to breathe frequently
while foraging (Balazs 1980; Rice et al. 2000), a common behavior in Kailua Bay, it is likely due
to chance that this behavior was not recorded there and was witnessed in the other habitats.
Hovering behavior was found to be a generalized behavior, just as in the full video logistic
regressions.
Non-significant results: other behaviors
Swimming may not have been significantly related to any TDTR parameters within the 2-
minute video segments because this behavior was so common within each habitat, with its
habitat-specific associations, that its overall occurrence may have been too difficult for the
logistic regressions to predict. Additionally, foraging and food searching behaviors were not
found to be significant with any TDTR parameters within either the cove or Kailua Bay, where
these behaviors predominantly occurred. A lack of a significant relationship with foraging and
102
2375
2380
2385
2390
2395
205
food searching behaviors may have been due to their dispersion with other generalized behaviors
such as swimming and hovering.
Benefits of Performing Personal Observation
While TDRs have revolutionized the study of turtle diving behavior, they cannot describe
the full range of behavioral patterns that can be documented using visual observations (Houghton
et al. 2002). Direct observations of animal behavior are useful for studying an organism within
its natural habitat, for understanding an animal’s function within its ecosystem, and for
confirming inferences using electronic or remote technology (Hochscheid et al. 1999; Houghton
et al. 2003; Schofield et al. 2006). Field observations of behavior are critical to the effective
conservation of animals in their natural habitat (Mills et al. 2005).
There are several benefits of using personal observations to augment time-depth-recorder
(TDR) data, by including information on the location, and the actual behavior of the turtles. For
example, an inherit problem of using TDRs is that the researcher must define specific
parameters, such as the sampling rate of the device. If the sampling rate is too course, dive
statistics such as the average number of dives each day, duration of the dives, and maximum
achieved depth can supply false results (Hagihara et al. 2011). Therefore, comparing different
studies of dive shapes and geographical locations presents data analysis problems that may
involve subjective judgments or arbitrary decisions (Fedak et al. 2001). One must be very
cautious when applying a dive type to a specific behavior as inferring turtle movement and
behavior from dive profiles alone is problematic and, at times, somewhat circular (Schofield et
al. 2006; Seminoff et al. 2006; Blumenthal et al. 2009).
103
2400
2405
2410
2415
Additionally, turtle behavior can vary across (Hazel 2009), and even within, habitats.
Resting green turtles off Ascension Island dive to similar depths (20-25 m) as do foraging green
turtles off the coast of Japan (Hays et al. 2000b; Hatase et al. 2006). Resting and foraging depths
are also dependent on the bathymetry of the site (Hatase et al. 2006; Seminoff et al. 2006). Even
habitat type and quality can affect the home range, and the behavioral repertoire, of a turtle
(Makowski et al. 2006). Yet, TDRs report only the depth of the dive, not the location. Green
turtles may also perform novel behaviors, which would not be quantifiable using TDR data
alone. For example, adult female green turtles actually feed in water deeper than 200 m, but this
rarely occurs (Troëng et al. 2005; Hatase et al. 2006). Even though green turtles are primarily
herbivorous, certain individuals may occasionally consume sponges, mollusk eggs, and jellyfish
(Bjorndal 1997), thus changing their foraging behavior. For instance, at some inter-nesting
locations, turtles may perform many types of behaviors dependent on the availability of prey –
they may forage if food is available or rest if there is none (Houghton et al. 2008). It would be
necessary to perform visual observations of the site in order to fully understand the behaviors
being performed by these turtles.
Brill et al. (1995) found that green turtle movement behavior in Kaneohe Bay (O’ahu)
varied greatly amongst individuals. While some turtles moved extensively, traversing between
channels separating shoreline reef flats, patch reefs, and the sandbar, others remained within
shallow water with significant coral cover and algae growth. Moreover, as the turtle population
recovers in Hawai’i (Chaloupka et al. 2008b), their behavioral patterns have changed, with a
switch from night-time to daytime foraging, being very tolerant to human presence, basking on
shore, and gathering in underwater cleaning stations (Balazs 1996). Such changes of existing
behavioral patterns and the onset of new behaviors would be very difficult to interpret solely
104
2420
2425
2430
2435
2440
210
using TDR data. Therefore, augmenting TDTR studies with visual observations can provide a
clear picture of the behavioral repertoire and even reveal behaviors not known to previously
exist.
Other Studies Utilizing Personal Observation for Green Turtle Behavior
To date, there is a paucity of studies which utilize a rigorous methodology of personal
observation to quantify green turtle diving behavior (Schofield et al. 2006), especially ones
which also include the use of electronic devices to collect diving data (Table 11 provides an
extensive list of publications on green turtle behavior which have implemented visual
observations). Personal observations of turtle diving behavior range from “casual” in which
researchers briefly mention a sporadically witnessed behavior, with no formal methodology, to
studies with “rigorous” pre-meditated personal observation methods to quantify the behavior of
the species. Casual personal observation papers will have only a sentence or two mentioning that
a sporadic or random observation confirmed their results. For example, Southwood et al. (2003)
inferred that green turtles at Heron Island in Australia most likely rest while performing shallow
dives at night, confirmed by a brief chance observation. As another example, Carr and Meylan
(1980) happened upon three green turtle hatchlings swimming in a sargassum mat and briefly
described their observations as a side note in their study of the movements of an adult female
green turtle. The authors made no further behavioral observations of these hatchlings.
Or, personal observations can be slightly more rigorous, but still not complete enough to
truly describe diving behavior. Although studying hawksbill sea turtles (Eretmochelys
imbricata) in the Cayman Islands, Blumenthal et al. (2009) used a combination of TDRs,
acoustic devices, and focal observations to study diving behavior. Their study focused primarily
105
2445
2450
2455
2460
on the TDR and acoustic results, with a quick discussion of their personal observation
methodology: 39 instantaneous recordings of hawksbill behavior were recorded as each turtle
was captured, broken into six categories (feeding, breathing, swimming, hovering, fleeing, or
resting/motionless). As more active behaviors were encountered during the day, the authors
concluded that diurnal dives must have involved searching, traveling, and feeding. The authors
made continuous observation (a more rigorous methodology, like in the current study) for only
one dive of one turtle. Although casual observations may sometimes be useful, they do not
necessarily quantify turtle diving behavior in an ecologically meaningful way.
More rigorous personal observations on turtle diving behavior have been performed in a
variety of ways. One prominent methodology is the use of a Crittercam, a video camera which is
attached to the carapace of a turtle to video record its behavior. This methodology allows first-
hand observation of animal behavior (Schofield et al. 2006) and has been used on green turtles
(e.g., Heithaus et al. 2002; Seminoff et al. 2006; Hays et al. 2007) and other turtle species (e.g.,
loggerheads, Caretta caretta – Heithaus et al. 2002; leatherbacks, Dermochelys coriacea – Reina
et al. 2005). Crittercams have shown the existence of previously unknown turtle behaviors, such
as swimming to the benthos to rub their bodies on rocks and sponges for cleaning purposes
(Heithaus et al. 2002). They also allow true documentation of the amount of time spent
performing each behavior, and the location in which it occurs, with more precise behavioral
detail. For example, Seminoff et al. (2006) was able to break green turtle foraging behavior into
three specific categories: active benthic foraging, active midwater foraging (may appear as
swimming behavior using only TDR data), and stationary benthic foraging (may appear to be
resting using only TDR data). The intensity and number of flipper beats can also be recorded, a
great metric for energy expenditure (Hays et al. 2007). Losey et al. (1994) filmed turtles in situ
106
2465
2470
2475
2480
2485
to record the association of the posing behavior at cleaning stations with the wrasse Thalassoma
duperry. Like Losey et al. (1994), we opted to film individual turtles for shorter durations over a
longer study period, but on a different temporal scale.
Video technology used for behavioral observation does have its drawbacks, however.
Crittercams (and other video cameras) are limited in the amount of memory they can store.
Night also creates great light limitations in capturing clear video footage. Therefore, other video
recording techniques may be applicable. Fuller et al. (2009) used a camera device called an
Underwater Timed Picture Recorder to record still images of green turtle behavior, with a flash,
over a much longer temporal scale than is capable with Crittercam technology. The authors also
suggest video technology that could be triggered on/off by jaw movement of the turtle, to only
record those behaviors, such as foraging, that are of most interest thereby saving the battery and
memory space of the device.
Personal observation methodologies can still be rigorous without the use of video
technology. Some studies recorded behavioral observations while working in the field, rather
than analyzing video data. Whittow and Balazs (1982) utilized a single observer to keep a
complete behavioral record of green turtles basking on shore in Hawai’i, recording the turtle’s
movements, behavior, orientation to the sun and wind and respiratory patterns. While a few
studies monitor turtle behavior from shore or a boat (e.g., Carr and Meylan 1980; Whittow and
Balazs 1982; Quaintance et al. 2002), most studies make use of in-water observation of green
turtle diving behavior (e.g., Booth and Peters 1972; Frick 1976; Witzell 1982; Losey et al. 1994;
Börjesson 2000; Rice et al. 2000; Houghton et al. 2003; Salmon et al. 2004; Schofield et al.
2006). For instance, Booth and Peters (1972) used direct underwater observations to document
green turtle mating behavior as well as posing behavior while being cleaned by cleaner fish.
107
2490
2495
2500
2505
2510
215
Some studies utilized transect lines to document turtle diving behavior, making note of
instantaneous behaviors and location (Rice et al. 2000; loggerhead sea turtles – Houghton et al.
2003), as well as environmental conditions (Börjesson 2000). Other studies, such as the current
study, are more focal-animal based rather than based on instantaneous observations of behavior.
Frick (1976) and Salmon et al. (2004) released and then monitored the diving behaviors of
individual green turtle hatchlings. Schofield et al. (2006) actually recorded a total of 286 hours
of loggerhead turtle observations with 1534 sightings of activity. Other observational methods
have been utilized as well: although studying loggerhead sea turtles, Frick et al. (2000) used a
low-flying aircraft running transects over SE Georgia and NE Florida to document courtship
behavior.
The number of studies comparing TDR data with visual behavioral observations remains
limited, and not just for green turtles, but for all air-breathing marine vertebrates. A few
examples do exist. Davis et al. (2003) used video/data recorders on 10 adult Weddell seals,
revealing four different dive types, determining that previous studies utilizing TDRs alone had
misclassified certain dive types. Tinker et al. (2007) compared TDR data on California sea otters
to observational data as an attempt to validate TDR data to detect differences in diet and foraging
behavior amongst dives. The authors used a multivariate clustering method to cluster 13 adult
female sea otters based on six defined dive parameters recorded by the TDRs. The final solution
described three clusters of dive types, each based on specific diet type and foraging strategy of
each individual. Only one (of 13) individuals was misclassified, as shown by personal
observation, showing that TDR data can be used > 90% of the time to identify specific diets and
foraging behavior. In another study, an Underwater Timed Picture Recorder (UTPR) camera
was placed on six lactating female fur seals to differentiate feeding dives from other dives with
108
2515
2520
2525
2530
similar TDR-based two-dimensional dive shapes. Lastly, even though Fuller et al. (2009)
described the lack of studies comparing TDR data with personal observations, they did not
include any TDR methodology in their study alongside personal observation.
There are a limited number of examples in which TDR data is directly compared with
personal observation data for green turtles. Ballorain (2010) used snorkel and scuba surveys to
visually record dive behaviors (feeding, travelling, and resting) of green turtles, later to be
compared to a principal component analysis using 10 dive parameters collected by the TDRs.
However, their personal observations were used merely to confirm inferences made using the
TDR data, rather than used in a statistical analysis to determine the extent to which the data
collected by the TDRs truly describes the turtles’ behaviors. Another study (Rice et al. 2000)
used only one green turtle as a subject, visually observing the turtle’s behaviors while on shore
and snorkeling. Visual observations were used solely to later associate specific TDR dive
profiles with certain behaviors. However, as individual turtles can show great variability in the
behaviors they perform and individuals within a sub-population can behave differently (Hays et
al. 1999), it is necessary to analyze multiple subjects to account for that inherent variability, as
done in the current study.
Difficulties Associated with Performing Personal Observations
There are a great number of difficulties associated with the use of visual observations to
study green turtle diving behavior. Direct observations are constrained by logistical limitations
and environmental conditions such as depth, sea state, visibility, availability of natural light, and
the risk to the researcher (Hooker and Baird 2001, Myers et al. 2006). Records are typically
brief or opportunistic, and the presence of the researcher may disrupt any natural behaviors,
109
2535
2540
2545
2550
2555
220
biasing the observations (Witt et al. 2010). Therefore, many studies rely on inferences from
animal-borne devices, such as TDRs, to collect behavioral data (Schofield et al. 2006). Video
equipment, such as Crittercams, can be used on larger individuals, but are not suitable for smaller
animals due to body size constraints. Additionally, these cameras are large, costly, and memory
constrained (Moll et al. 2007).
CONCLUSIONS:
The majority of studies which utilize time-depth recorders (TDRs) to study green turtle
diving behavior do not accompany this methodology with visual observations to ground-truth
any behavioral assumptions made using the TDR data with the true behavior being performed.
Ground-truthing TDR data is imperative to determine the actual behaviors of the turtles, and to
learn the extent to which the TDR data can be used to infer specific behaviors. By comparing
video-recorded personal observations of juvenile green turtles on 26 separate incidences to
concurrent time-depth-temperature recorder (TDTR) data, this study determined the true
behavior performed at this shallow foraging site, and concluded that TDTR data alone can
describe turtle behavior at the Kawai’nui Marsh Estuary to a great degree, even when divided
into discrete habitats where specific behaviors are known to occur, but is insufficient on its own
to describe a turtle’s full behavioral repertoire.
Using binary logistic regression models, only four (foraging, food searching, hovering,
and breathing) of the six behaviors considered were (marginally) significantly related to specific
TDTR parameters. When analyzing behaviors within 2-minute segments to associate specific
behaviors with specific habitats, the ability to predict behavior decreased. Therefore, analyzing
behavior by specific habitat within the study site does not increase the likelihood of correctly
110
2560
2565
2570
2575
identifying behaviors based on TDTR data alone. To best understand juvenile green turtle
behaviors, it is important that personal observations augment the deployment of TDRs to best
ensure field studies are capturing and describing the full behavioral repertoire of green turtles in
heterogeneous habitats.
REFERENCES:
Altmann, J. 1974. Observational study of behavior: sampling methods. Behaviour 49(3): 227-
267.
Asuncion, B. 2010. Characterizing juvenile green sea turtle (Chelonia mydas) habitat use in
Kawai’nui, O’ahu: a multi-disciplinary approach. Master’s thesis, Hawai’i Pacific
University, Kaneohe, HI. 89 pp.
Balazs, G.H. 1980. Synopsis of biological data on the green turtle in the Hawaiian Islands. U.S.
Department of Commerce, NOAATM-NMFS-SWFC-7, Honolulu, HI. 141 pp.
Balazs, G. H. 1996. Behavioral changes within the recovering Hawaiian green turtle population.
In Keinath, J.A., Barnard, D.E., Musick, J.A., and Bell, B.A., compilers. Proceedings of
the fifteenth annual symposium on sea turtle biology and conservation, February 20–25,
1995. NOAA Technical Memorandum NMFS–SEFSC-387:16–21.
Balazs, G.H., and Chaloupka, M. 2004. Spatial and temporal variability in somatic growth of
green sea turtles (Chelonia mydas) resident in the Hawaiian Archipelago. Marine Biology
145:1043-1059.
Balazs, G.H., Forsyth, R.G., and Kam, A.K.H. 1987. Preliminary assessment of habitat
utilization by Hawaiian green turtles in their resident foraging pastures. U.S. Dep.
Commer., NOAA Tech. Memo. NOAA-TM-NMFS-SWFC-71, 107 p.
Balazs, G.H., Miya, R.K., and Beavers, S.C. 1996. Procedures to attach a satellite transmitter to
the carapace of an adult green turtle, Chelonia mydas. Proceedings of the Fifteenth
Annual Symposium on Sea Turtle Biology and Conservation. NOAA Technical
Memorandum NMFS-SEFSC-387, pp. 21-26
Ballorain, K. 2010. Ecologie trophique de la tortue verte Chelonia mydas dans les herbiers
marins et algueraies du sud-ouest de l’océan Indien. Doctoral thesis, University of
Strausbourg, France. 286 pp.
Barnett-Johnson, R., Grimes, C.B., Royer, C.F., and Donohoe, C.J. 2007. Identifying the
contribution of wild and hatchery Chinook salmon (Oncorhynchus tshawytscha) to the
111
2580
2585
2590
2595
2600
2605
2610
2615
ocean fishery using otolith microstructure as natural tags. Canadian Journal of Fisheries
and Aquatic Sciences 64:1683-1692.
Bjormdal, K.A. 1980. Nutrition and grazing behavior of the green turtle Chelonia mydas. Marine
Biology 56:147-154.
Bjorndal, K. A. 1997. Foraging ecology and nutrition of sea turtles. In Lutz, P. L., and Musick,
J.A., editors. The biology of sea turtles. CRC Press, Boca Raton, Florida, USA. Pp 199–
231.
Blumenthal, J.M., Austin, T.J., Bothwell, J.B., Broderick, A.C., Ebanks-Petrie, G., Olynik, J.R.,
Orr, M.F., Solomon, J.L., Witt, M.J., and Godley, B.J. 2009. Diving behavior and
movements of juvenile hawksbill turtles Eretmochelys imbricata on a Caribbean coral
reef. Coral Reefs 28:55-65.
Blumenthal, J.M., Austin, T.J., Bothwell, J.B., Broderick, A.C., Ebanks-Petrie, G., Olynik, J.R.,
Orr, M.F., Solomon, J.L., Witt, M.J., and Godley, B.J. 2010. Life in (and out of) the
lagoon: fine-scale movements of green turtles tracked using time-depth recorders.
Aquatic Biology 9:113-121.
Booth, J., and Peters, J.A. 1972. Behavioural studies on the green turtle (Chelonia mydas) in the
sea. Animal Behaviour 20:808-812.
Börjesson, L. 2000. An ecological assessment of green turtles (Chelonia mydas) in coastal
foraging and resting habitats of Kailua Bay, Laniakea, and Papailoa, on O’ahu, Hawaiian
Islands. Master of Science Thesis, The Department of Marine Ecology, University of
Gothenburg, Sweden, 28 p.
Brill, R.W., Balazs, G.H., Holland, K.N., Chang, R.K.C., Sullivan, S., and George, J.C. 1995.
Daily movements, habitat use, and submergence intervals of normal and tumor-bearing
juvenile green turtles (Chelonia mydas) within a foraging area in the Hawaiian Islands.
Journal of Experimental Marine Biology and Ecology 185:203-218.
Carr, A., and Meylan, A.B. 1980. Evidence of passive migration of green turtle hatchlings in
sargassum. Copeia 1980(2):366-368.
Chaloupka, M., Work, T.M., Balazs, G.H., Murakawa, S.K.K., and Morris, R. 2008a. Cause-
specific temporal and spatial trends in green sea turtle strandings in the Hawaiian
Archipelago (1982-2003). Marine Biology 154:887-898.
Chaloupka, M., Bjorndal, K.A., Balazs, G.H., Bolten, A.B., Ehrhart, L.M., Limpus, C.J.,
Suganuma, H., Troëng, S., and Manami, Y. 2008b. Encouraging outlook for recovery of a
once severely exploited marine megaherbivore. Global Ecology and Biogeography
17:297-304.
Clarke, K. R. 1993. Non-parametric multivariate analyses of changes in community structure.
Australian Journal of Ecology 18:117-143.
112
2620
2625
2630
2635
2640
2645
2650
2655
2660
2665
225
Davis, E.E., Rice, M.R., Harrington, K.A., and Balazs, G.H. 2000. Green turtle diving and
foraging patterns at Puako, Hawai’i. Proceedings of the Nineteenth Annual Symposium
on Sea Turtle Conservation and Biology. NOAA Technical Memorandum NMFS-SEFSC-
443, pp. 153-154.
Davis, R.W., Fuiman, L.A., Williams, T.M., Horning, M., Hagey, W. 2003. Classification of
Weddell seal dives based on 3-dimensional movements and video-recorded observations.
Marine Ecology Progress Series 264:109-122.
Fedak, M.A., Lovell, P., and Grant, S.M. 2001. Two approaches to compressing and interpreting
time-depth information as collected by time-depth recorders and satellite-linked data
recorders. Marine Mammal Science 17(1):94-110.
Frick, J. 1976. Orientation and behaviour of hatchling green turtles (Chelonia mydas) in the sea.
Animal Behaviour 24:849-857.
Frick, M.G., Slay, C.K., Quinn, C.A., Windham-Reid, A., Duley, P.A., Ryder, C.M., and Morse,
L.J. 2000. Aerial observations of courtship behavior in loggerhead sea turtles (Caretta
caretta) from southeastern Georgia and northeastern Florida. Journal of Herpetology
34(1):153-158.
Fuller, W.J., Broderick, A.C., Hooker, S.K., Witt, M.J., and Godley, B.J. 2009. Insights into
habitat utilization by green turtles (Chelonia mydas) during the inter-nesting period using
animal-borne digital cameras. Marine Technology Society Journal 43(3):51-59.
Glen, F., Broderick, A.C., Godley, B.J., Metcalfe, J.D., and Hays, G.C. 2001. Dive angles for a
green turtle (Chelonia mydas). Journal of the Marine Biological Association of the
United Kingdom 81:683-686.
Godley, B.J., Richardson, S., Broderick, A.C., Coyne, M.S., Glen, F., and Hays, G.C. 2002.
Long-term satellite telemetry of the movements and habitat utilisation by green turtles in
the Mediterranean. Ecography 25:352-362.
Godley, B.J., Blumenthal, J.M., Broderick, A.C., Coyne, M.S., Godfrey, M.H., Hawkes, L.A.,
and Witt, M.J. 2008. Satellite tracking of sea turtles: Where have we been and where do
we go next? Endangered Species Research 4:3-22.
Hagihara, R., Jones, R.E., Sheppard, J.K., Hodgson, A.J., and Marsh, H. 2011. Minimizing errors
in the analysis of dive recordings from shallow-diving animals. Journal of Experimental
Marine Biology and Ecology 399:173-181.
Hart, K.M., and Fujisaki, I. 2010. Satellite tracking reveals habitat use by juvenile green sea
turtles Chelonia mydas in the Everglades, Florida, USA. Endangered Species Research
11:221-232.
113
2670
2675
2680
2685
2690
2695
2700
2705
2710
Hatase, H., Sato, K., Yamaguchi, M., Takahashi, K., and Tsukamoto, K. 2006. Individual
variation in feeding habitat use by adult female green turtles (Chelonia mydas): are they
obligately neritic herbivores? Oecologia 149:52-64.
Hays, G.C., Luschi, P., Papi, F., del Seppia, C., and Marsh, R. 1999. Changes in behaviour
during the internesting period and post-nesting migration for Ascension Island green
turtles. Marine Ecology Progress Series 189:263-273.
Hays, G.C., Hochscheid, S., Broderick, A.C., Godley, B.J., and Metcalfe, J.D. 2000a. Diving
behaviour of green turtles: dive depth, dive duration and activity levels. Marine Ecology
Progress Series 208:297-298.
Hays, G.C., Adams, C.R., Broderick, A.C., Godley, B.J., Lucas, D.J., Metcalfe, J.D., and Prior,
A.A. 2000b. The diving behaviour of green turtles at Ascension Island. Animal
Behaviour 59:577-586.
Hays, G.C., Broderick, A.C., Glen, F., Godley, B.J., Houghton, J.D.R., and Metcalfe, J.D. 2002.
Water temperature and internesting intervals for loggerhead (Caretta caretta) and green
(Chelonia mydas) sea turtles. Journal of Thermal Biology 27:429-432.
Hays, G.C., Metcalfe, J.D., Walne, A.W., and Wilson, R.P. 2004. First records of flipper beat
frequency during sea turtle diving. Journal of Experimental Marine Biology and Ecology
303:243-260.
Hays, G.C., Marshall, G.J., and Seminoff, J.A. 2007. Flipper beat frequency and amplitude
changes in diving green turtles, Chelonia mydas. Marine Biology 150:1003-1009.
Hazel, J. 2009. Evaluation of fast-acquisition GPS in stationary tests and fine-scale tracking of
green turtles. Journal of Experimental Marine Biology and Ecology 374:58-68.
Hazel, J., Lawler, I.R., Marsh, H., and Robson, S. 2007. Vessel speed increases collision risk for
green turtle Chelonia mydas. Endangered Species Research 3:105-113.
Hazel, J., Lawler, I.R., and Hamann, M. 2009. Diving at the shallow end: Green turtle behaviour
in near-shore foraging habitat. Journal of Experimental Marine Biology and Ecology
371(1):84-92.
Heithaus, M.R., Marshall, G.J., Buhleier, B.M., and Dill, L.M. 2001. Employing Crittercam to
study habitat use and behaviour of large sharks. Marine Ecology Progress Series
209:307-310.
Heithaus, M.R., McLash, J.J., Frid, A., Dill, L.M., and Marshall, G.J. 2002. Novel insights into
green sea turtle behaviour using animal-borne video cameras. Journal of the Marine
Biological Association of the United Kingdom 82:1049-1050.
Hochscheid, S., Godley, B.J., Broderick, A.C., and Wilson, R.P. 1999. Reptilian diving: highly
114
2715
2720
2725
2730
2735
2740
2745
2750
2755
230
variable dive patterns in the green turtle Chelonia mydas. Marine Ecology Progress
Series 185:101-112.
Hooker, S.K., and Baird, R.W. 2001. Diving and ranging behaviour of odontocetes: a
methodological review and critique. Mammal Review 31(1):81-105.
Houghton, J.D.R., Woolmer, A., and Hays, G.C. 2000. Sea turtle diving and foraging behaviour
around the Greek island of Kefalonia. Journal of the Marine Biological Association of
the United Kingdom 80:761-762.
Houghton, J.D.R., Broderick, A.C., Godley, B.J., Metcalfe, J.D., and Hays, G.C. 2002. Diving
behaviour during the internesting interval for loggerhead turtles Caretta caretta nesting
in Cyprus. Marine Ecology Progress Series 227:63-70.
Houghton, J.D.R., Callow, M.J., and Hays, G.C. 2003. Habitat utilization by juvenile hawksbill
turtles (Eretmochelys imbricata, Linneaus, 1766) around a shallow water coral reef.
Journal of Natural History 37:1269-1280.
Houghton, J.D.R., Cedras, A., Myers, A.E., Liebsch, N., Metcalfe, J.D., Mortimer, J.A., and
Hays, G.C. 2008. Measuring the state of consciousness in a free-living diving sea turtle.
Journal of Experimental Marine Biology and Ecology 356:115-120.
Hurlbert, S.H. 1984. Pseudoreplication and the design of ecological field experiments.
Ecological Monographs 54(2):187-211.
I-Jiunn, C. 2009. Changes in diving behaviour during the internesting period by green turtles.
Journal of Experimental Marine Biology and Ecology 381:18-24.
Losey, G.S., Balazs, G.H., and Privitera, L.A. 1994. Cleaning symbiosis between the wrasse,
Thalassoma duperry, and the green turtle, Chelonia mydas. Copeia 1994(3):684-690.
Makowski, C., Seminoff, J.A., and Salmon, M. 2006. Home range and habitat use of juvenile
Atlantic green turtles (Chelonia mydas L.) on shallow reef habitats in Palm Beach,
Florida, USA. Marine Biology 148:1167-1179.
McCune, B., and Grace, J.B. 2002. Analysis of Ecological Communities. MjM Software,
Gleneden Beach, Oregon, USA.
Mendonca, M.T. 1983. Movement and feeding ecology of immature green turtles (Chelonia
mydas) in a Florida Lagoon. Copeia 1983:1013-1023.
Mills, D.J., Verdouw G., and Frusher, S.D. 2005. Remote multi-camera system for in situ
observations of behaviour and predator/prey interactions of marine benthic macrofauna.
New Zealand Journal of Marine and Freshwater Research 39:347-352.
Moll, R.J., Millspaugh, J.J., Beringer, J., Sartwell, J., and He, Z. 2007. A new ‘view’ of ecology
115
2760
2765
2770
2775
2780
2785
2790
2795
2800
and conservation through animal-borne video systems. TRENDS in Ecology and
Evolution 22(12):660-668.
Myers, A.E., Lovell, P., and Hays, G.C. 2006. Tools for studying animal behaviour: validation of
dive profiles relayed via the Argos satellite system. Animal Behaviour 71:989-993.
NOAA CCMA. 2007. Shallow-water benthic habitats of the main Hawaiian Islands.
http://ccma.nos.noaa.gov/products/biogeography/hawaii_cd_07/htm/data.html
Quaintance, J.K., Rice, M.R., and Balazs, G.H. Basking, foraging, and resting behavior of two
sub-adult green turtles in Kiholo Bay Lagoon, Hawai’i. In Seminoff, J.A., compiler.
Proceedings of the twenty-second annual symposium on sea turtle biology and
conservation, April 4-7, 2002. NOAA Technical Memorandum NMFS-SEFSC-503:225-
226.
Reina, R.D., Abernathy, K.J., Marshall, G.J., and Spotila, J.R. 2005. Respiratory frequency, dive
behaviour and social interactions of leatherback turtles, Dermochelys coriacea during the
inter-nesting interval. Journal of Experimental Marine Biology and Ecology 316:1-16.
Rice, M.R., Balazs, G.H., Hallacher, L., Dudley, W., Watson, G., Krusell, K., and Larson, B.
2000. Diving, basking, and foraging patterns of a sub-adult green turtle at Punalu’u,
Hawai’i. In Abreu-Grobois, F.A., Briseño-Dueñas, R., Márquez, R., and Sarti, L.,
compilers. Proceedings of the eighteenth international sea turtle symposium. March 3-7,
1998. NOAA Technical Memorandum NMFS-SEFSC-436:229-231.
Rice, M.R. and Balazs, G.H. 2008. Diving behavior of the Hawaiian green turtle (Chelonia
mydas) during oceanic migrations. Journal of Experimental Marine Biology and Ecology
356:121-127.
Salmon, M., Jones, T.T., and Horch, K.W. 2004. Ontogeny of diving and feeding behavior in
juvenile seaturtles: leatherback seaturtles (Dermochelys coriacea L) and green seaturtles
(Chelonia mydas L) in the Florida current. Journal of Herpetology 38(1):36-43.
Schofield, G., Katselidis, K.A., Dimopolous, P., Pantis, J.D., and Hays, G.C. 2006. Behaviour
analysis of the loggerhead sea turtle Caretta caretta from direct in-water observation.
Endangered Species Research 2:71-79.
Seminoff, J., Resendiz, A., Smith, T.W., and Yarnell, L. 2001. Diving patterns of green turtles
(Chelonia mydas agassizii) in the Gulf of California. Proceedings of the Twenty-First
Annual Symposium on Sea Turtle Biology and Conservation. NOAA Technical
Memorandum NMFS-SEFSC-528, pp. 321-323.
Seminoff, J.A., Resendiz, A., and Nichols, W.J. 2002. Home range of green turtles Chelonia
mydas at a coastal foraging area in the Gulf of California, Mexico. Marine Ecology
Progress Series 242:253-265.
116
2805
2810
2815
2820
2825
2830
2835
2840
2845
Seminoff, J.A., Jones, T.T., and Marshall, G.J. 2006. Underwater behaviour of green turtles
monitored with video-time-depth recorders: what’s missing from dive profiles? Marine
Ecology Progress Series 322:269-280.
Senko, J., Koch, V., Megill, W.M., Carthy, R.R., Templeton, R.P., and Nichols, W.J. 2010. Fine
scale daily movements and habitat use of East Pacific green turtles at a shallow coastal
lagoon in Baja California Sur, Mexico. Journal of Experimental Marine Biology and
Ecology 391:92-100.
Southwood, A.L., Reina, R.D., Jones, V.S., and Jones, D.R. 2003. Seasonal diving patterns and
body temperatures of juvenile green turtles at Heron Island, Australia. Canadian Journal
of Zoology 81:1014-1024.
Tinker, M.T., Costa, D.P., Estes, J.A., and Wieringa, N. 2007. Individual dietary specialization
and dive behaviour in the California sea otter: using archival time-depth data to detect
alternative foraging strategies. Deep Sea Research Part II: Topical Studies in
Oceanography 54(3-4):330-342.
Troëng, S., Dutton, P.H., and Evans, D. 2005. Migration of hawksbill turtles Eretmochelys
imbricata from Tortuguero, Costa Rica. Ecography 28:394-402.
van Dam, R.P. and Diez, C.E. 1996. Diving behavior of immature hawksbills (Eretmochelys
imbricata) in a Caribbean cliffwall habitat. Marine Biology 127:171–178.
Whittow, G.C., and Balazs, G.H. 1982. Basking behavior of the Hawaiian green turtle (Chelonia
mydas). Pacific Science 36(2):129-140.
Witt, M.J., McGowan, A., Blumenthal, J.A., Broderick, A.C., Gore, S., Wheatley, D., White, J.,
and Godley, B.J. 2010. Inferring vertical and horizontal movements of juvenile marine
turtles from time-depth recorders. Aquatic Biology 8:169-177.
Witzell, W.N. Observations on the green sea turtle (Chelonia mydas) in Western Samoa. Copeia
1982(1):183-185.
Yasuda, T., and Arai, N. 2009. Changes in flipper beat frequency, body angle and swimming
speed of female green turtles Chelonia mydas. Marine Ecology Progress Series 386:275-
286.
Zar, J.H. 1984. Biostatistical analysis. 2nd edition. Englewood Cliffs, NJ: Prentice-Hall. 130 p.
TABLES:
Table 1. A description of the 26 juvenile green turtle behavioral videos used in this study with concurrent
TDTR data.
117
2850
2855
2860
2865
2870
2875
2880
2885
2890
2895
235
Video
Number
Turtle ID
Number
Month (Lunar
Cycle), Date
Tidal Cycle
Phase
Starting Habitat
of Video
1 2 1, 3/23/10 Low Cove
2 2 1, 3/24/10 Falling Kailua Bay
3 2 1, 3/25/10 High Cove
4 16 1, 3/25/10 High Kailua Bay
5 16 2, 4/17/10 Rising Kailua Bay
6 16 2, 4/17/10 Rising Channel / Ledge
7 16 3, 5/16/10 Rising Cove
8 34 3, 6/5/10 High Channel / Ledge
9 37 3, 6/6/10 Falling Channel / Ledge
10 34 3, 6/6/10 Falling Channel / Ledge
11 37 4, 6/30/10 Rising Channel / Ledge
12 16 4, 7/5/10 Falling Cove
13 37 4, 7/5/10 Falling Channel / Ledge
14 34 4, 7/6/10 High Cove
15 37 5, 7/14/10 Rising Channel / Ledge
16 34 5, 7/20/10 High Cove
17 37 5, 7/20/10 High Channel / Ledge
18 34 5, 7/30/10 Rising Cove
19 34 5, 7/31/10 Low Channel / Ledge
20 37 5, 8/3/10 Falling Channel / Ledge
21 37 6, 8/14/10 Low Channel / Ledge
22 34 6, 8/18/10 Falling Cove
23 2 6, 8/18/10 Falling Channel / Ledge
24 34 6, 8/19/10 Rising Channel / Ledge
25 2 6, 8/28/10 Rising Cove
26 34 6, 8/29/10 Low Channel / Ledge
118
2900
Table 2. The definitions of each behavior and environmental parameter recorded during behavioral surveys. “IB” = Instantaneous Behaviors,
recorded every 15 seconds. “CB” = Continuous Behaviors, counted continuously throughout the video. “PC” = Physical Conditions, or
environmental parameters recorded on 15 second intervals.
Behavioral
Category
Behavior Definition
IB
Foraging
Food Searching Actively moving along bottom substrate, head moving around looking down for food, using flippers to steady self
Foraging Turtle takes a bite of the vegetation on the substrate, or food is in its mouth and the jaw is moving up and down
Resting
On substrate Motionless, no flipper movement while in contact with bottom substrate, turtle's overall position does not change
Assisted Motionless, no flipper movement while in contact with bottom substrate, turtle's overall position does not change, using a structure to
maintain its position
Swimming
Hovering Motionless, or minimal amount of flipper movement while in water column, turtle's position relative to the substrate does not change
Posing Motionless, or minimal amount of flipper movement while in water column, turtle's position relative to the substrate does not change;
turtle’s flippers and neck are outstretched, likely in vicinity of cleaning station
General Swimming:
Direction
Turtle is actively using its flippers to change its position relative to the substrate. Classified as either movement up (nearer the surface),
down (further from the surface), or horizontal (distance from surface does not change)
Rel. Speed Distance traveled (m) / time (s), in km/hr - calculated by GPS (Garmin)
Breathing Turtle is at surface of water, its head clears water surface, bubbles and expulsion of water may or may not be seen
Flipper “Swipe” Turtle uses its front flipper(s) to deliberately wipe its face, plastron, or carapace
CB
Swimming
Beats/30 s Number of flipper beats per 30 seconds of video footage
Foraging
Bites/15 s Number of bites per 15 seconds of video footage
Breathing The time (s) of the video in which a breathing event begins, when the turtle's head breaks the surface
PC
Turtle Depth Relative depth of turtle from surface (in 0.5 m bins)
Water Depth Relative depth of substrate from surface, at turtle's location (in 0.5 m bins)
Substrate Type Substrate type at turtle's location: rocks, sand, algae, coral, rubble, urchins, and other invertebrates
119
2905
240
Table 3. The description of each of seven TDTR parameters compared with 26 behavioral observation
videos.
TDTR Parameter Description
Depth Displacement The total vertical distance (m; recorded by the TDTR) moved by the turtle
during the length of the video
Depth Coefficient of
Variation (CV)
The coefficient of variation (CV) of the turtle's depth (m; recorded by the
TDTR) during the length of the video
Maximum Depth The turtle's maximum reached depth (m; recorded by the TDTR) during the
length of the video
Average Depth The turtle's average depth (m; recorded by the TDTR) during the length of
the video
Surface Proportion
(arcsine transformed)
The proportion, or percent, of the video in which the turtle was within the
top 0.5 m (recorded by the TDTR) of the water column
Average Temperature The average water temperature (°C; recorded by the TDTR) during the length
of the video
Temperature CV The CV of the water temperature (°C; recorded by the TDTR) during the
length of the video
120
2910
2915
2920
2925
2930
2935
Table 4. Presence/absence of behaviors in each of the 26 behavioral observation videos. Behaviors were
included in the analyses only if they were present in at least 2 of the 26 videos (excluding posing and
body swiping behaviors). A “0” indicates the behavior was not present in the video, while a “1” indicates
the behavior was present.
Video Number,
Turtle ID
Number
Behavior Presence
Foraging Food
Searching
Resting Hovering Swimming Breathing Posing Body
Swiping
1, 2 0 0 0 1 1 1 0 0
2, 2 1 1 0 1 0 0 0 0
3, 2 0 1 0 0 1 1 0 1
4, 16 0 1 0 1 1 0 0 0
5, 16 1 1 0 1 1 0 0 0
6, 16 0 0 0 1 1 0 0 0
7, 16 1 1 0 1 1 0 0 0
8, 34 0 0 1 0 0 0 0 0
9, 37 1 1 0 1 1 1 0 0
10, 34 0 0 1 1 1 1 0 0
11, 37 1 1 1 1 1 1 0 0
12, 16 1 1 0 1 1 1 0 0
13, 37 0 0 1 1 1 1 0 0
14, 34 0 0 0 0 1 1 0 0
15, 37 0 0 1 0 0 0 0 0
16, 34 0 0 0 0 1 1 0 0
17, 37 0 0 1 1 1 1 0 0
18, 34 0 0 0 0 1 0 0 0
19, 34 0 0 0 1 1 1 0 0
20, 37 0 0 1 0 0 0 0 0
21, 37 1 1 1 1 1 1 0 0
22, 34 0 0 0 0 1 1 0 0
23, 2 1 1 0 1 1 1 0 0
24, 34 0 0 0 0 1 0 1 0
25, 2 1 1 0 1 1 0 0 0
26, 34 0 0 0 0 1 0 0 0
Total Presence (out of 26 videos):
9 11 8 16 22 14 1 1
Table 5. The depth and temperature TDTR parameters calculated by Matlab computer software for the
length of each of the 26 videos.
Video Depth Parameters Temperature Parameters
121
2940
2945
2950
Number Disp CV Max Avg Surface Proportion
(arcsine transformed)
Avg CV
1 7.87 54.27 1.73 0.77 0.18 27.68 1.85
2 5.74 12.33 2.30 1.81 0.00 26.10 0.40
3 9.87 59.29 1.80 0.79 0.16 26.95 2.74
4 7.36 18.53 1.98 1.48 0.00 24.49 0.44
5 10.58 23.43 2.68 2.08 0.02 23.40 0.00
6 5.76 19.50 1.63 1.16 0.00 23.59 0.07
7 3.59 32.25 0.80 0.54 0.22 26.73 0.47
8 1.20 5.970 2.21 1.75 0.00 24.99 0.34
9 7.69 27.24 1.71 1.02 0.00 26.88 1.37
10 6.06 35.34 1.71 1.04 0.00 27.42 1.64
11 6.45 30.53 2.13 1.50 0.02 27.22 0.18
12 3.22 19.42 0.50 0.41 0.57 27.36 0.18
13 7.48 48.01 1.94 1.21 0.12 26.69 0.89
14 5.91 33.01 1.42 0.84 0.06 27.60 1.13
15 0.72 2.00 1.50 1.45 0.09 28.06 0.07
16 3.83 19.88 0.92 0.71 0.08 28.63 0.42
17 4.54 62.50 1.92 1.26 0.18 26.89 0.90
18 1.24 56.51 1.45 0.93 0.25 28.41 0.81
19 6.24 26.21 1.57 1.10 0.04 27.27 0.33
20 1.47 2.54 1.82 1.70 0.00 26.37 0.08
21 12.53 55.28 2.35 1.20 0.10 26.53 0.34
22 7.26 54.38 1.50 0.67 0.22 27.91 0.57
23 8.48 23.41 2.28 1.87 0.00 27.91 0.26
24 4.12 45.57 2.07 1.28 0.00 27.61 1.12
25 8.68 30.32 2.03 1.46 0.00 28.00 0.53
26 6.04 53.57 2.25 1.04 0.02 26.86 0.25
Table 6. Pearson correlation coefficients for all seven TDTR parameters.
Depth
Disp
Depth
CV
Max
Depth
Avg
Depth
Surface
Proportion
Avg
Temp
Temp
CV
Depth Disp 1.00 - - - - - -
122
2955
2960
245
Depth CV 0.41 1.00 - - - - -
Max Depth 0.48 0.08 1.00 - - - -
Avg Depth 0.10 -0.45 0.80 1.00 - - -
Surface Proportion -0.14 0.33 -0.65 -0.67 1.00 - -
Avg Temp -0.20 0.30 -0.41 -0.47 0.27 1.00 -
Temp CV 0.26 0.56 -0.06 -0.41 0.11 0.28 1.00
Table 7. Kendall non-parametric rank correlations (tau) and p-values of the TDTR parameters with the
three axes of the NMDS analysis. Values in bold are significant (p < 0.05).
TDTR Variable
Axis 1 Axis 2 Axis 3
tau p-value tau p-value tau p-value
Depth Disp 0.39 p < 0.01 0.17 p > 0.1 0.19 p > 0.1
Depth CV 0.18 p > 0.1 -0.10 p > 0.1 -0.20 p > 0.1
Max Depth -0.20 p > 0.1 0.05 p > 0.1 0.33 0.05 < p < 0.01
Avg Depth -0.30 0.05 < p < 0.01 -0.00 p > 0.1 0.32 0.05 < p < 0.01
Surface Proportion 0.30 0.05 < p < 0.01 -0.00 p > 0.1 -0.20 p > 0.1
Avg Temp 0.21 p > 0.1 -0.10 p > 0.1 -0.30 0.05 < p < 0.01
Temp CV 0.26 0.05 < p < 0.1 -0.00 p > 0.1 -0.20 p > 0.1
Video Length 0.10 p > 0.1 0.01 p > 0.1 0.17 p > 0.1
123
2965
2970
2975
2980
Table 8a. Significant results from the complete logistic regression analyses (assuming marginal significance: alpha = 0.1). Behavior = turtle
behavior recorded from observational video; TDTR Parameter = parameter(s) collected by the TDTR, the linear combination (logit function) of
which are (marginally) significantly related to the listed behavior; Estimate = “weight” given to the TDTR parameter in the logit function; S.E. =
standard error of the estimate; t-ratio = t-statistic of the estimate; p-value = significance level of the estimate; Odds Ratio = description of the
strength of the binary association – the larger the value above one (below one), the stronger the positive (negative) correlation between the
behavior and TDTR parameter; Upper/Lower 95% = 95% ranges for the Odds Ratio; Sensitivity = the proportion of actual positives which are
correctly identified as such; Specificity = the proportion of negatives which are correctly identified; Percent Correct = the likelihood that any
specific logit function result of the listed TDTR parameter(s) will indicate the behavior with which it is significantly related.
Behavior TDTR Parameter (ai) Estimat
e (bi)
S.E. t-
ratio
p-
value
Odds
Ratio
Upper
95%
Lower
95%
Sensitivity Specificity Percent
Correct
Foraging
Depth Disp 0.61 0.26 2.34 0.02 1.84 3.07 1.10
0.57 0.77 0.700
Depth CV -0.08 0.04 -1.92 0.06 0.92 1.00 0.84
Food
Searching
Depth Disp 2.64 1.33 1.99 0.05 13.96 187.71 1.04
0.82 0.87 0.844Depth CV -0.48 0.24 -1.83 0.07 0.64 1.03 0.40
Surface Proportion 50.67 30.35 1.67 0.10 1.01x10²²
N/A 0.00
Hovering Depth Disp 0.42 0.19 2.18 0.03 1.53 2.23 1.04 0.71 0.53 0.641
Breathing
Avg Temp 1.20 0.65 1.86 0.06 3.32 11.81 0.93
0.80 0.77 0.788Depth Disp 0.85 0.35 2.45 0.01 2.34 4.63 1.19
Max Depth -2.38 1.39 -1.71 0.09 0.09 1.40 0.01
Table 8b. Significant results from the complete logistic regression analyses (assuming marginal significance: alpha = 0.1). Constant = linear
predictor or line intercept of the logistic regression. S.E. = standard error of the estimate; t-ratio = t-statistic of the estimate; p-value = significance
level of the estimate.
Behavior Constant (c) S.E. t-ratio p-value
Foraging -18.52 1.26 -1.47 0.14
Food Searching -6.62 3.66 -1.81 0.07
Hovering -1.89 1.14 -1.65 0.10
Breathing -32.39 18.55 -1.78 0.08
124
2985
2990
2995
250
Table 9. G-Tests for the occurrence of six behaviors across four habitats within 26 behavioral video
surveys broken into 2-minute segments. Behaviors are not independent of habitat if p > 0.05. Cells with
superscripts (* or †) show the behaviors and habitats further tested with stepwise logistic regressions to
determine if any TDTR parameters were significantly related to the specific behavior within the specific
habitat (only cells with occurrences in 3 or more 2-minute segments were tested).
Behavior Habitat G-score p-value
Channel / Ledge Cove Kailua Bay Rocky Shore
Foraging* 0 5* 10* 1 17.57 p < 0.001
Food Searching* 2 8* 13* 1 14.92 0.005 < p < 0.001
Resting* 12 0 0 0 18.89 p < 0.001
Hovering† 9†
7†
20†
3†
6.32 0.25 < p < 0.10
Swimming† 21†
11†
17†
10†
0.92 p > 0.25
Breathing* 8* 4* 0 3* 10.08 0.025 < p < 0.01
Total No. of 2-min
Segments
31 11 23 10 -- --
*specialized behaviors – not independent of habitat
†generalized behaviors – independent of habitat
125
3000
3005
3010
3015
3020
3025
3030
Table 10a. Significant results from the complete logistic regression analyses (assuming marginal significance: alpha = 0.1) of the 2-minute video
segments highlighted in Table 9. Behavior = turtle behavior recorded from observational video; TDTR Parameter = parameter(s) collected by the
TDTR, the linear combination (logit function) of which are (marginally) significantly related to the listed behavior; Estimate = “weight” given to
the TDTR parameter in the logit function; S.E. = standard error of the estimate; t-ratio = t-statistic of the estimate; p-value = significance level of
the estimate; Odds Ratio = description of the strength of the binary association – the larger the value above one (below one), the stronger the
positive (negative) correlation between the behavior and TDTR parameter; Upper/Lower 95% = 95% ranges for the Odds Ratio; Sensitivity = the
proportion of actual positives which are correctly identified as such; Specificity = the proportion of negatives which are correctly identified;
Percent Correct = the likelihood that any specific logit function result of the listed TDTR parameter(s) will indicate the behavior with which it is
significantly related.
Habitat Behavior TDTR Parameter
(ai)
Estimat
e (bi)
S.E. t-ratio p-
value
Odds
Ratio
Upper
95%
Lower
95%
Sensitivity Specificity Percent
Correct
Channel / Ledge Resting
Max Depth -6.41 3.26 -1.97 0.05 0.00 0.98 0.00
0.71 0.82 0.77
Avg Depth 9.90 3.52 2.82 0.01 19992.04 1.97x10⁷
20.32
Channel / Ledge Breathing Temp CV 4.30 1.97 2.18 0.03 73.62 3523.22 1.54 0.40 0.79 0.69
All Habitats Hovering
Avg Temp -0.83 0.27 -3.04 0.00 0.44 0.75 0.26
0.63 0.60 0.62Depth Disp 0.72 0.32 2.26 0.02 2.04 3.80 1.10
Surface Proportion 2.47 1.42 1.74 0.08 11.81 190.9 0.73
Table 10b. Significant results from the complete logistic regression analyses (assuming marginal significance: alpha = 0.1). Constant = linear
predictor or line intercept of the logistic regression. S.E. = standard error of the estimate; t-ratio = t-statistic of the estimate; p-value = significance
level of the estimate.
Habitat Behavior Constant (c) S.E. t-ratio p-value
Channel / Ledge Resting -4.13 4.07 -1.02 0.31
Channel / Ledge Breathing -2.04 0.67 -3.04 0.00
All Habitats Hovering 21.02 7.21 2.91 0.00
126
3035
3040
3045
3050
Table 11. A list of green turtle studies which have implemented visual observations as a method to study diving behavior. NR = not reported.
Author/Year Location Turtles
Observed
Visual
Observational
Method(s)
"Intensity" of
Observations
No. Visual
Observations
Time Spent
Performing Visual
Observations
Electronic
Devices Used
Booth and Peters 1972 Fairfax Island, Australia NR Underwater Rigorous NR NR None
Frick 1976 Tortuguero, Costa Rica;
Bermuda
45 Underwater Rigorous 45 > 22.5 hr None
Carr and Meylan 1980 Panama Coast 3 Boat Casual 1 NR None
Witzell 1982 Upolu Island, Western
Samoa
113 Boat, Underwater,
Aerial
Rigorous 113 NR None
Whittow and Balazs 1982 French Frigate Shoals,
HI, USA
8 Land Rigorous NR NR Thermistor
Losey et al. 1994 Kaneohe Bay, O’ahu, HI,
USA
NR Underwater Rigorous NR 9.75 hr Stationed video
camera
Börjesson 2000 O’ahu, HI, USA NR Land, Underwater Rigorous 379 NR None
Rice et al. 2000 Hawai’i, USA 1 Land, Underwater Rigorous NR 176 hr TDR
Heithaus et al. 2002 Shark Bay, Australia 12 green Underwater Rigorous NR > 36 hr TDR, Crittercam
Quaintance et al. 2002 Kiholo Bay, HI, USA 2 Land Rigorous NR 460 hr TDR, Stationed
video camera,
Acoustics
Southwood et al. 2003 Heron Island, Australia 12 Underwater Casual NR NR TDR
Salmon et al. 2004 Boynton Beach, Florida,
USA
33 green Underwater Rigorous 299 NR TDR
Seminoff et al. 2006 Gulf of California,
Mexico
34 Underwater Rigorous 36 89.5 hr TDR, Crittercam
Hays et al. 2007 Bahía de los Angeles,
Mexico
5 Underwater Rigorous 5 > 15 hr TDR, Crittercam
Fuller et al. 2009 Algadi Beach, Cyprus 2 Underwater Rigorous 2899 NR Underwater
Timed Picture
Recorder (UTPR)
Ballorain 2010 Mayotte Island,
Southwest Indian Ocean
8 Underwater Rigorous > 8 NR TDR, GPS
Francke et al. 2011
(current study)
Kailua Bay, HI, USA 26 Underwater Rigorous 26 3.36 hr TDR, video
camera
127255
FIGURES:
Figure 1. A) The main Hawaiian Islands. B) Kailua Bay on the windward side of the island of O’ahu. C)
The Kawai’nui Marsh Estuary study site.
128
3055
3060
Figure 2. Locations of five specific habitats with the Kawai’nui Marsh Estuary study site. Video
behavioral surveys occurred in the cove, channel, and Kailua Bay habitats, with randomized starting
positions labeled as A,B, and C within each habitat.
129
3065
260
Figure 3. The relationship of the presence/absence of six juvenile green turtle behaviors within 26
behavioral observation videos filmed at the Kawai’nui Marsh Estuary study site (non-metric
multidimensional scaling analysis; NMDS). Three-dimensional solution: total r2
= 0.97; Axis 1: r2
=
0.544, p = 0.001; Axis 2: r2
= 0.075, p = 0.001; Axis 3 r2
= 0.35, p = 0.001. Axes 1 and 3 explain the
highest amount of variance (r2
= 0.894). Black points and text correspond to the six behaviors. Vectors
(red lines) show non-parametric correlations (tau) of time-depth-temperature recorder (TDTR) parameters
from the 26 videos with each axis.
130
3070
3075
Figure 4. Predicting the likelihood of the occurrence of foraging behavior using TDTR data. A) The
observations from 26 behavioral videos, of whether or not foraging behavior occurred as a function of a
linear combination of depth displacement (m) and depth CV parameters (the combination of which is
marginally significant with foraging behavior) collected by the TDTR. The dashed red line indicates the
hypothetical line which the “yes” and “no” points should not cross if the logit function were to perfectly
explain the presence/absence of foraging behavior. B) Complete logistic regression showing the
probability of the occurrence of foraging behavior, as a function of the linear combination of depth
displacement and depth CV TDTR parameters.
131
3080
3085
Figure 5. Predicting the likelihood of the occurrence of food searching behavior using TDTR data. A)
The observations from 26 behavioral videos, of whether or not food searching behavior occurred as a
function of a linear combination of depth displacement (m), depth CV, and surface proportion parameters
(the combination of which is marginally significant with food searching behavior) collected by the TDTR.
The dashed red line indicates the hypothetical line which the “yes” and “no” points should not cross if the
logit function were to perfectly explain the presence/absence of food searching behavior. B) Complete
logistic regression showing the probability of the occurrence of food searching behavior, as a function of
the linear combination of depth displacement, depth CV, and surface proportion TDTR parameters.
132
3090
3095
265
Figure 6. Predicting the likelihood of the occurrence of hovering behavior using TDTR data. A) The
observations from 26 behavioral videos, of whether or not hovering behavior occurred as a function of the
depth displacement (m) parameter (marginally significant with hovering behavior) collected by the
TDTR. The dashed red line indicates the hypothetical line which the “yes” and “no” points should not
cross if the logit function were to perfectly explain the presence/absence of hovering behavior. B)
Complete logistic regression showing the probability of the occurrence of hovering behavior, as a
function of the depth displacement TDTR parameter.
133
3100
3105
Figure 7. Predicting the likelihood of the occurrence of breathing behavior using TDTR data. A) The
observations from 26 behavioral videos, of whether or not breathing behavior occurred as a function of a
linear combination of average water temperature (°C), depth displacement (m), and maximum depth (m)
parameters (the combination of which is marginally significant with breathing behavior) collected by the
TDTR. The dashed red line indicates the hypothetical line which the “yes” and “no” points should not
cross if the logit function were to perfectly explain the presence/absence of breathing behavior. B)
Complete logistic regression showing the probability of the occurrence of breathing behavior, as a
function of the linear combination of average water temperature, depth displacement, and maximum
depth TDTR parameters.
134
3110
3115
270
CHAPTER 3: Juvenile green sea turtle (Chelonia mydas) diving behavior in relation to
habitat heterogeneity and water temperature in Kawai’nui, O’ahu (Hawai’i)
ABSTRACT:
Few studies have focused on the diving behavior of juvenile green sea turtles (Chelonia
mydas) within their foraging habitats because their movements and residency patterns can be
unpredictable. The Kawai’nui Marsh Estuary (KME) in Kailua Bay, O’ahu, Hawai’i, supports a
large number (seasonal estimates: 40 – 100 turtles) of juvenile green turtles during spring –
summer. Studying the movements and behaviors of juvenile turtles within their foraging habitats
is critical for understanding their feeding ecology, habitat use, and conservation needs. To
characterize the behavioral patterns of turtles within KME, we used four approaches: (i)
underwater video was used to document turtle behavior; (ii) time-depth-temperature recorders
deployed on six turtles measured their diving patterns; (iii) water temperature data-loggers were
emplaced throughout the site; and (iv) seasonal changes in algal biomass were measured in those
areas most grazed by the turtles. These methodologies were integrated to (i) describe turtle
behavior within various habitats, and (ii) determine the effects of algal biomass, water
temperature, and tidal / diel cycles on turtle behavior. Our results highlighted site-specific
behavioral patterns: turtles primarily foraged over shallow, rocky shelves with higher algal
biomass, rested within the deeper, adjacent channel and canal, and visited a previously unknown
cleaning station within the channel. Tidal phase, tidal height, and Julian Day had no significant
effect on turtle behavior, allowing the inference that temporal changes in water temperature and
algal biomass also had no effects on turtle behavior. The combination of these distinct habitats
within a small area distinguishes KME as an important site for juvenile green turtles in Hawai’i.
INTRODUCTION:
135
3120
3125
3130
3135
3140
Green sea turtles are important megafaunal consumers of marine macroalgae and their
foraging activities are vital to maintaining the structure and function of many coastal ecosystems
(Bjorndal 1997, Jackson et al. 2001). Turtle foraging has a direct impact via the algae they
consume changing the structure of the foraging habitat, leading to an indirect effect changing the
behavior of other species (Jackson et al. 2001; Wabnitz et al. 2010). Thus, turtles play a critical
role in ecosystem balance (Pandolfi et al. 2003), acting as consumers, prey, competitors, parasitic
hosts, substrates for epibionts, engineers of the benthic substrate, and nutrient transporters
(Bjorndal and Jackson 2003). For instance, a larger green turtle population in the Caribbean
would result in more grazing on Thalassia testudinum seagrass, reducing the time for epibiont
colonization on the blades and shortening seagrass nutrient cycling times (Jackson 2001).
Studying the movements and behavior of individual turtles is essential to understanding
their feeding ecology, habitat use and conservation needs (Seminoff et al. 2002, 2006).
Enhanced understanding provides insights into time budgets (feeding / resting), and helps to
identify important habitats used for critical activities (Senko et al. 2010; Hart and Fujisaki 2010).
Electronic devices, including time-depth recorders (TDRs), activity loggers and tracking systems
via acoustic receivers, satellites, and global positioning system (GPS) have opened a window
into the ecology of sea turtles both in oceanic and coastal systems (Myers et al. 2006; Godley et
al. 2008). However, it can be very difficult to ascertain fine details of dive behavior by using
one of these devices on its own. Therefore, many studies have used a combination of these
different devices (e.g., acoustic receivers and TDRs: Makowski et al. 2006; Blumenthal et al.
2009; TDRs and satellite tags: Myers et al. 2006; acoustic receivers, capture/recapture, and
TDRs: Blumenthal et al. 2010; acoustic receivers and GPS: Senko et al. 2010), or have used
136
3145
3150
3155
3160
them in suite with other electronic devices, such as visual imaging systems or swim speed
sensors (e.g., Hays et al. 2004).
While animal-borne loggers and cameras have been widely used to study turtle behavior,
these observations can be difficult to interpret due to the large behavioral repertoire of the turtles
and the great extent of individual variability in movement and activity patterns (Hochscheid et al.
1999; 2005; Seminoff et al. 2006; Witt et al. 2010). Therefore, visual observations of dive
behavior have been used to help interpret dive data from TDRs and other animal-borne data
loggers (e.g., chapter 2; Houghton et al. 2002; 2003; Hays et al. 2007). Personal observations
provide a method for describing turtle movements or behavior, which effectively characterizes
the visitation and use of specific habitats (e.g., Asuncion 2010). This methodology has proven
effective for the fine-scale study of animal movements and has facilitated ecological inferences
about such behaviors and habitat associations (Schofield et al. 2006).
Green turtles undergo ontogenetic habitat shifts (Hatase et al. 2006); returning to the
neritic habitat and changing its diet to benthic algae and seagrass (Musick and Limpus 1997;
Bjorndal 1997) after spending three to six “lost” years in the epi-pelagic habitat foraging on
plankton and floating algal mats detached from shallow water (Frick 1976; Balazs and
Chaloupka 2004a; Makowski et al. 2006). Although green sea turtles switch to a primarily
herbivorous diet when entering their coastal habitat, they will occasionally consume animals
such as sponges, mollusk eggs, and jellyfish (Bjorndal 1997).
Most of our knowledge of green turtle diving behavior is limited to adult females during
the breeding, nesting, inter-nesting, or post-nesting migration periods. While recent tagging and
tracking studies have started focusing on juvenile turtles, their movements and home ranges
remain poorly understood, complicating the tasks of resource managers (Seminoff et al. 2001;
137
3165
3170
3175
3180
3185
275
2002; Godley et al. 2008; Hazel 2009; Hazel et al. 2009). Previous studies have shown some
juvenile green turtles spend between 20 (Seminoff et al. 2001) and 40 (Balazs and Chaloupka
2004a) years in a coastal habitat before reaching sexual maturity. Within these coastal foraging
habitats, turtles may maintain limited home ranges and exhibit high site fidelity (Limpus et al.
1992; Balazs and Chaloupka 2004b). Turtles will often establish core areas within their home
ranges which they primarily use for foraging and resting (Makowski et al. 2006). Larger home
ranges are maintained when the resources are more dispersed (Makowski et al. 2006).
Studies of immature or juvenile turtles at foraging grounds are inhibited by the inherent
difficulties involved in the ability to retrieve the time-depth recorders (TDRs) (e.g., Southwood
et al. 2003a). Despite the difficulties in obtaining juvenile turtle behavior in foraging habitats,
some conclusions can still be drawn from previous studies. Juvenile green turtle behavior is
highly variable and shaped by local environmental conditions, and varies both temporally (e.g.,
time of day) and in different habitats (Hays et al. 2002; Hochscheid et al. 2005; Makowski et al.
2006). For instance, the topography of a site can greatly influence a turtle’s particular habits
(Houghton et al. 2003). Typically as water temperature decreases, turtles dive for longer time
periods (Hazel et al. 2009). Daytime dives are typically shallower and shorter than night dives
(Bjorndal 1980; Mendonca 1983; Davis et al. 2000; Makowski et al. 2006; Taquet et al. 2006;
Hazel et al. 2009). This pattern of deep and long night-time dives in colder water suggests
resting behavior, while shallow and short day-time dives in warmer water are associated with a
great deal of activity (Hays et al. 1999; Hazel et al. 2009). However, this dichotomy does not
always hold true, and different patterns have been documented, including shallower nocturnal
dives (Brill et al. 1995; Southwood et al. 2003a), individual variability in diurnal and nocturnal
depth selection (Seminoff et al. 2001), and active turtles throughout all the day and night (Senko
138
3190
3195
3200
3205
et al. 2010). The reason for these differences in diving behavior are unknown, but theories
regarding predators (Heithaus et al. 2007), conspecifics, intertidal food availability, lack of
shelter in deeper water (Senko et al. 2010), and seasonal changes in temperature, photoperiod,
and food availability (Southwood et al. 2003a) have been suggested.
In Kaneohe Bay, O’ahu, HI, green turtle submergence intervals of 12 juvenile green
turtles were strongly related to activity level. Long and regular dives with minimal movement,
indicating resting behavior, occurred over muddy substrate or in the side of the coral reef, while
shorter dives were associated with swimming behavior. During daylight, turtles tended to prefer
the mud or side of the reef, with only a few turtles remaining in the shallower foraging grounds.
At night, all but one turtle moved up to the shallower patch reef where they foraged (Brill et al.
1995). In some locations, such as the Kau District on the island of Hawai’i, observations of
feeding behavior have shown considerable swimming and maneuvering to prevent hitting the
rocky bottom with heavy swells and waves. Turtles also swam to the surface for regular
breathing intervals. In Kiholo Bay, also on the island of Hawai’i, green turtle populations have
been increasing, preempting a change in foraging and resting behavior (Rice et al. 2002).
Foraging behavior, which previously occurred at night, now occurs during the day. Additionally,
turtles now rest and bask on shore more frequently, gather in underwater cleaning stations, and
are more tolerant of human presence (Balazs 1996). At French Frigate Shoals (in the Northwest
Hawaiian Islands), foraging areas are very shallow – only one meter deep – requiring the turtles
to wait for high tide to forage (Balazs 1980).
This research focuses on the Kawai’nui Marsh Estuary (KME) in Kailua Bay, O’ahu, HI.
This site is home to anywhere between 40 (winter) and 100 (spring) juvenile green turtles with
strong year-round fidelity to the site (Asuncion, 2010). A previous study of juvenile green turtle
139
3210
3215
3220
3225
3230
280
movement patterns at KME suggested that diurnal foraging occurred in the shallow cove and
rocky shelf habitat, with nocturnal resting within the adjacent channel and canal leading to the
marsh (Asuncion 2010). The high site fidelity of the juvenile turtles and the close proximity of
the foraging and resting locations, less than one kilometer apart, makes KME a unique site
within the Hawaiian Islands as most other foraging and resting locations are much further apart
(Balazs et al. 1987). We used a multi-disciplinary approach to study juvenile green turtle diving
behavior at KME, involving a combination of TDR deployments, underwater videos, water
temperature monitoring, and surveys of algal abundance. We hypothesized that turtles would
engage in distinct activities in different habitats within KME, and that these behaviors would
vary in response to changing water temperature and algal biomass. More specifically, we
expected that foraging would occur in warmer water where algae would likely grow more rapidly
and turtles would experience higher metabolic rates (Hays et al. 2002), and in shallower habitats
with higher algal biomass, while resting would occur in colder water and deeper habitats with
less algal biomass.
METHODS:
Study Area
The Kawai’nui Marsh Estuary (KME) study area (21° 25’ N, 157° 44’ W) is located at
the northern end of Kailua Bay on the island of O’ahu, Hawai’i (Figure 1). Despite its small area
(approximately 0.5 km2
), KME encompasses six distinct habitats: cove, channel, ledge, canal,
rocky shore, and bay. At the northern edge of KME is a shallow (0.5-1.5 m) cove with
pavement-type coral reef and carbonate rock, and high coverage (50-90%) primarily of
macroalgae and some sessile invertebrates (NOAA CCMA 2007). Offshore of the cove is a
140
3235
3240
3245
3250
3255
deeper (3 – 4 m) dredged channel with sandy to silty substrate and bordered on either side by a
vertical ledge. The ledge and channel habitats are often considered the same habitat within this
study. The channel connects to a man-made 2.75 km-long canal leading to the Kawai’nui Marsh,
which is 336 hectares in size and drains through the canal into the ocean. The Kailua Bay habitat
within KME lies on the south side of the channel, and is characterized by a relatively shallow
(0.5-3.0 m) reef/rock flat habitat, which also supports abundant macroalgae and sessile
invertebrates (NOAA CCMA 2007). The shallowest (0-0.5 m) portion of the KME, spanning
along the southwestern edge of the study area, is referred to as the rocky shore (Figure 2).
Salinity
To characterize the salinity range at the site, measurements were taken using a hand-held
refractometer at five locations at the study site (Figure 3): (1) canal bend, (2) boat mooring
located in the channel near the edge of the cove and the mouth of the canal, (3) cove, (4)
cleaning station, located in the channel between the cove and Kailua Bay, and (5) in the bay. A
total of 40 measurements were taken by sampling each site during four tidal phases (low, rising,
falling, high) twice within a two month time span (August 15 – October 15, 2010). Each
measurement consisted of three replicate samples, which were averaged, taken from both the
surface and the bottom, for a total of 240 salinity records.
Water Temperature
Temperature loggers (HOBO Pro v2 U22-001; accuracy of ± 0.2 °C, resolution of ± 0.02
°C), set to record water temperature continuously every 30 minutes, were used throughout the
study site from March 2010 through September 2010. These loggers were deployed at five
141
3260
3265
3270
3275
locations: 1) the canal bend, approximately 200 m from the mouth of the canal, 2) the boat
mooring, approximately 40 m past the mouth of the canal, 3) within the cove, approximately 50
m from shore and 20 m from the ledge, 4) offshore, approximately 375 m past the mouth of the
canal, and 5) within Kailua Bay (Figure 3). Unfortunately, two of the five time series were not
used due to human interference. The Kailua Bay logger was moved multiple times throughout
the study period, and the cove logger was moved once from its location for a two-day period.
Yet, when this time period was removed from the record, the temperature data from the cove was
highly correlated with the concurrent data from the boat mooring (Pearson correlation, r = 0.967,
n = 9608 observations).
The three remaining loggers were collected periodically to upload data and were
immediately replaced to avoid gaps in the time series. Because the three water temperature time
series were normally distributed (average skewness = -0.507, and average kurtosis = -0.357) and
had no “zero” data, a Principal Component Analysis (PCA; Euclidian distance measure, PC-
ORD software) was performed to determine the temporal and spatial patterns of water
temperature variability. PCAs summarize complex relationships among samples and objects by
developing a smaller number of synthetic variables explaining specific levels of shared variance,
whose significance can be assessed using randomization tests (with 999 iterations) (McCune and
Grace 2002). Lastly, a Fourier (spectral) analysis was performed on the principal component
values to quantify the “energy” of the dominant patterns of water temperature fluctuation over
the course of the study (e.g., Papastamatiou et al. 2009).
Algae Abundance
142
3280
3285
3290
3295
3300
285
Benthic algae biomass and percent cover were recorded in three separate time periods in
two different habitats (cove and rocky shore) within the KME study area on 1.5 month intervals
(early June, mid-July, early September) spanning a three month summer-fall transition. Using
Google Earth, 18 random points (three quadrats per habitat during three time periods) were
assigned within the two habitats for data collection (Figure 4). A 1600 cm2
quadrat was placed
at each location, and the substrate type (Battista et al. 2007) and algal cover functional group
(articulated, complex branching, filamentous, foliose, mass forming, simple branching, and turf
algae; Table 1; Arthur 2005) were recorded at 25 equally-spaced intersecting points to determine
percent cover using the quadrat-point-intersect method (Reed 1980). Following the quadrat-
weight method (Reed 1980), all algae of the same functional group within each quadrat was
scraped off the hard substrate and placed in separate plastic bags to prevent drying. Functional
group samples were weighed using an Acculab Sartorius Group scale (accuracy of 0.1 g) to
determine initial wet weight, and then placed in a drying oven (Thermo Scientific, model 3511)
for an initial 16 hours at 160 °F (71.1 °C; similar to the methods of Daday et al. (1977) and Cline
et al. (1982)). Samples were stored in a freezer at zero °C between drying sessions for
preservation. Individual samples were weighed and dried for additional three hour increments,
until two successive weight measurements did not vary (within the balance’s 0.1 g resolution).
This final constant weight was used to estimate the dry biomass weight of the sample per unit
area (g dry weight / m2
).
Classifying algae by taxonomic name can be difficult in algal-dominated communities
with a great number of plant fragments, which can often be missing diagnostic characteristics.
Therefore, classifying algae by functional group can provide insight into foraging ecology. Also,
grouping by morphology can be more temporally stable and predictable than comparing by
143
3305
3310
3315
3320
species level, as structural aspects of algae species are not necessarily related to its taxonomic
name (Arthur 2005). Species composition at a site can change, but morphological characteristics
rarely differ over time (Steneck and Dethier 1994). And, classifying algae by morphology
allows extrapolation of results and conclusions to other sites that may not necessarily have the
same species of algae, but still show the preferences of turtles’ diets (Arthur 2005).
A multivariate ANOVA was performed to determine the effects of habitat (cove, rocky
shore) and time (early June, late July, early September) on algal biomass functional group. The
algal biomass was log-transformed (Transformed Biomass = Log (Biomass + 1)) to achieve a
normal distribution. Two rare functional groups of algae (foliose and articulated calcareous
algae) were only recorded in trace amounts at three out of 18 quadrats sampled, and were thus
excluded from our statistical analysis due to their extremely non-normal distributions.
Turtle Capture and Marking
Juvenile green turtles were caught at KME by personnel from the National Oceanic and
Atmospheric Administration’s Marine Turtle Research Program (NOAA-MTRP), either by
scoop net or hand capture, and were immediately brought to shore for weighing, body
measurements, and a general health assessment. NOAA-MTRP has been studying green turtle
population size, growth rate, and health at this study site since 2000.
Following Balazs (1995), a Moto-Tool (Dremel MultiPro Cordless 9.6V Model 780) was
used to etch a unique identification number, approximately three cm tall by three cm wide and
one mm deep, into both the left and right sides of each turtle’s carapace. The numbers were
painted white to aid identification of individual turtles in the water while snorkeling to diminish
the need for re-capture. Additionally, turtles were injected with a passive integrated transponder
144
3325
3330
3335
3340
3345
290
(PIT) tag inserted into a hind flipper to facilitate future identification after the visual marks wore
off.
Time-Depth-Temperature Recorders (TDTRs)
In March, 2010, four individual turtles were equipped with time-depth-temperature
recorders (TDTRs; Lotek, model LAT 1500 – pressure accuracy of ± 1%, pressure resolution of
0.05%, temperature accuracy < 0.2 °C, temperature resolution of 0.05 °C) to monitor their diving
behavior. Two more turtles were equipped with TDTRs in June, 2010. Devices were attached to
the turtle’s carapace by an attachment method similar to the elastomer-fiberglass-resin protocol
of Balazs et al. (1996). The temperature and depth sensors on the devices were left uncovered so
as not to interfere with data collection. After the fiberglass and resin hardened, each turtle was
returned to the water and released by hand as quickly as possible to minimize stress.
Each of the six TDTR-tagged turtles (moto-tool numbers T2, T15, T16, T17, T34, T37)
were equipped with one (T15, T34, and T37) or two (T2, T16, and T17) TDTRs. Each turtle
received one course-scale tag sampling water pressure and temperature every 15 seconds for
approximately 33 days (filling the device’s memory). Three turtles received a second fine-scale
tag sampling the same parameters every second for approximately two days. The collection of
two replicates of the dive data from the same individual, sampled at two different temporal
resolutions allowed us to test for potential inter-tag variability in the pressure and depth
measurements.
Field sampling occurred approximately once per month, between March and September
2010, with the goal of retrieving and re-deploying the TDTRs. Turtles were recaptured and
released after uploading their dive data in the field. Following Hazel et al. (2009), the minimum
145
3350
3355
3360
3365
3370
depth value for each TDTR dataset was determined and added to all depth values to correct inter-
tag calibration differences. This correction assumes that the 15-second sampling captured a
turtle breathing at the surface at least once, during each 33-day deployment. On four TDTR data
uploading events (out of 23), depth data could not be used as depths were consistently deeper
than 60 m, or erratically jumped between negative values and 60 m (within the time frame of 1
or 15 seconds). It is possible that the pressure gauge on these four devices were broken by
nibbling cleaner fish, a turtle bumping into a hard object, or the device may have simply just
malfunctioned.
Behavioral Survey Videos
To complement and validate the TDTR measurements of turtle diving, focal-animal
behavioral surveys were performed following Altmann (1974). During the same six-month time
period as the TDTR deployments, individual turtles were filmed in KME by one snorkeler (DF)
within three distinct habitats: the cove, the adjacent channel / ledge, and Kailua Bay (Figure 2).
An Olympus Stylus 1010 digital camera with underwater housing was used to video record the
turtles for up to eight minutes, a maximum video length chosen due to camera battery and
memory card capacity constraints. Videos were shorter if sight of the turtle was lost due to poor
visibility or if the turtle was resting in the same position for five minutes.
To randomize the surveys, the three habitats and three potential starting points within
each habitat were randomly chosen using a random number table (Altmann 1974). After arriving
at the starting position, the first turtle sighted within the targeted habitat would be selected, and
filming would start immediately upon approaching the turtle. All surveys occurred between
10:00 and 16:00 local time, when turtle abundance was highest (Asuncion 2010) and when the
146
3375
3380
3385
3390
high sun angle provided the best visibility. These surveys covered four tidal phases (flooding,
ebbing, high, low) spanning six consecutive 28-day lunar cycles, with each tidal phase being
sampled twice during each lunar cycle (once in each 14-day period).
During filming, the snorkeler remained at least two human body lengths away from the
turtle at all times and moved with very slow and deliberate motions, to minimize observer
influence on the turtles’ behaviors. If a turtle swam out of sight within the first two minutes (11
instances), or engaged in obvious predator avoidance behavior (e.g., swimming in circles with its
carapace facing the snorkeler at all times; one instance), the video was not used for behavioral
analysis. During each video sampling day, the goal was to record two turtles within each of the
three habitats (cove, channel / ledge, and Kailua Bay) during the two-hour sampling period.
However, when it was not always possible to film two turtles within each habitat, more turtles
were filmed in other habitats to reach the goal of six videos per sampling session.
Each video was analyzed to determine a set of behavioral parameters defined prior to data
collection (Table 2). Eight instantaneous behaviors were recorded on 15-second intervals (the
same sampling resolution as the TDTRs) through the entire video: foraging (searching for food
and feeding), resting, hovering, posing, swimming (with vertical and horizontal direction), face
or body “swiping,” and breathing. Three continuous behavioral variables were also quantified
beginning at the start and running through the end of each video: the number of flipper beats per
30 seconds, the number of bites per 15 seconds, and the timing of each breath (to the nearest
second; whether or not it occurred on a 15-second interval). Additionally, the movement rate of
the turtle was estimated using a GPS device (Garmin, model eTrex Legend), attached to the
snorkeler and used to record position every 15 seconds. A number of ancillary variables were
recorded alongside the aforementioned behavioral variables: Julian Day, the lunar cycle during
147
3395
3400
3405
3410
3415
295
which the video was filmed (1-6), the habitats (cove, channel, Kailua Bay, rocky shore, canal)
and substrates (rock, rubble, sand, algae, bivalve, urchin, coral) used by the turtle during the
video, water depth parameters, video length, cloud cover (quantified using octas), wind speed
and precipitation (from measurements taken at the Kaneohe Marine Air Corps Station,
http://raws.wrh.noaa.gov/cgi-bin/roman/meso_base.cgi?stn=PHNG&time=GMT, from the 24
hours preceding filming), and tidal height (from the National Oceanic and Atmospheric
Administration buoy at Mokuoloe in Kaneohe Bay,
http://tidesandcurrents.noaa.gov/data_menu.shtml?stn=1612480%20Mokuoloe,
%20HI&type=Historic%20Tide%20Data).
Comparison of TDTR Data to Video Surveys
Cross-correlations of the TDTR data and the video behavioral survey data were used to
validate the potentially subjective visual observations using the parameters measured objectively
by the logger. The correlations of the diving parameters quantified concurrently for the length of
each video using both methodologies (instantaneous turtle depth, average turtle depth, median
turtle depth, maximum turtle depth, coefficient of variation (CV) of turtle depth, and vertical
depth displacement), are used to validate the visual behavioral observations.
Analysis of Behavioral Survey Videos
A non-metric multidimensional scaling (NMDS) analysis of the behavioral video surveys
was used to determine the associations amongst 20 different behavioral parameters recorded
within 277 videos, belonging to five distinct categories: 1) the percent of the video spent
performing a specific behavior, 2) various turtle depth parameters, 3) various flipper beat
148
3420
3425
3430
3435
parameters, 4) various foraging bite parameters, and 5) various breathing parameters (Table 3).
Additionally, the NMDS axes were correlated (non-parametrically) with a second set of 24
explanatory variables (22 quantitative and 2 categorical), belonging to five distinct categories: 1)
environmental parameters, 2) the percent of the video spent within specific habitats, 3) the
percent of the video spent over specific substrates, 4) various water depth parameters, and 5)
video length (Table 4). Each parameter (both behavioral and explanatory variables) was
summarized for each entire behavioral observation, and the length of each video was used as a
co-variate to test for potential biases associated with disparities in the duration of the visual
observations. Namely, longer videos were expected to record more behavioral states.
NMDS is a non-parametric ordination method, ideal for synthesizing large datasets of
cross-correlated non-normal and categorical variables, which quantifies the relationship between
objects (in this case, turtle behavioral parameters) and explanatory descriptors. This analysis
iteratively searches for the best ordination of these objects along k dimensions (axes) in order to
minimize the amount of “stress” within the final configuration (Clarke 1993). The NMDS was
performed using the PC-ORD software, with the relative Sorensen distance metric, and statistical
significance was assessed with a randomization test (with 50 runs of real data and 999 runs of
randomized data, using the random starting point) (McCune and Grace 2002). The resulting
ordination of “samples” (277 videos) and “objects” (20 behavioral parameters) is graphically
represented in the context of the explanatory parameters, plotted as environmental vectors
relating to the ordination axes.
We then analyzed these 277 videos by testing specific group comparisons using the
multivariate statistical technique of multi-replicate permutation procedures (MRPPs). These
series of MRPPs (relative Sorensen distance, PC-ORD computer software) were used to
149
3440
3445
3450
3455
3460
300
determine the influence of various categorical parameters on turtle behavior. More specifically,
MRPPs can test hypotheses of no differences between subjective groups of two or more entities
(McCune and Grace 2002). Because a multivariate analysis of variance (MANOVA) approach
was not feasible due to uneven replication in the number of videos across behaviors / habitats /
time periods, we only tested direct effects and did not address interactions between amongst the
categorical variables. Three different MRPPs were performed to test the effects of the following
variables on turtle behavior:
1) the amount of resting, foraging / food searching, and posing behaviors
performed by the turtle (groups defined in Table 5). Four groups were not
included in this analysis because there were no videos consisting of: (i) 100%
foraging / food searching, (ii) 100% posing, (iii) some resting, no foraging /
food searching, some posing, and (iv) some resting and some foraging / food
searching, some posing, these four groups were not included in the analysis);
2) a combination of tidal phase and month (groups defined in Table 5); and
3) the amount of time spent within specific habitats (groups defined in Table 5).
Four groups were not included in this analysis: (i) there were no videos spent
primarily within the canal, and there was only one incidence of observations
(ii) primarily in both cove and Kailua Bay habitats, (iii) being primarily in both
the channel / ledge and the rocky shore habitats, and (iv) being primarily in
both the channel / ledge and Kailua bay habitats).
If significant differences were found between the specific groups compared in each MRPP, an
indicator species analysis (ISA; relative Sorensen distance, PC-ORD software, 4999
randomizations to test for significance) was performed to determine which of the 20 behavioral
150
3465
3470
3475
3480
3485
parameters influenced the differences detected between the groups. ISA is used after MRPP to
determine the effects of individual objects amongst groups (McCune and Grace 2002). The
combination of these MRPPs and ISAs tests described the specific associations between turtle
behaviors, as well as the temporal and environmental factors influencing these behaviors.
Analysis of Behavior by Habitat
GPS locations were recorded continuously every 15 seconds throughout the duration of
the behavioral videos. Because GPS data were not recorded in twenty-six videos due to battery
and equipment failures, 251 complete records were obtained from the 277 behavioral videos.
One observer (DF) viewed the videos and assigned each of the recorded locations (7480 points;
Figure 5) to one of six possible behavioral states: foraging (n = 1000), resting (n = 672),
breathing (n = 176), swimming (n = 4334), hovering (n = 1034), and posing (n = 228). Using
ArcGIS 9.3 Geographic Information System software (Environmental Research Systems
Institute; www.esri.com/software/arcview), each of the six behaviors were mapped within KME.
RESULTS:
Salinity
Water salinity analyses were based on data collected over four tidal phases at two depths
(surface / bottom) and five habitats (canal bend, boat mooring, cove, cleaning station, Kailua
Bay). Salinities ranged from 31.0-37.0 ppt at the surface and 34.7-37.0 ppt at the bottom. A
multivariate ANOVA revealed a significant difference in salinity amongst three categorical
variables: habitats (F = 6.93, df = 4, p < 0.001), depths (F = 9.84, df = 1, p = 0.003), and tidal
phase (F = 5.10, df = 3, p = 0.005). Furthermore, there was a significant interaction of habitat
151
3490
3495
3500
3505
and depth (F = 4.70, df = 4, p = 0.003) and a significant trend, evident as a positive relationship
with the day of sampling (F = 77.37, df = 1, p < 0.001) (Table 6). Precipitation, in intervals of 1,
3, 6, 9, 12, and 24 hours prior to sampling did not have an effect on salinity.
Post-hoc tests revealed that salinity at the canal bend was significantly lower than the
cove (p = 0.04) and marginally lower than the cleaning station (p = 0.06) and Kailua Bay (p =
0.06). Salinity was lowest in the canal habitat and increased with further distance from the
mouth of the canal. Rising and low tides were marginally different (p = 0.09), with flooding
tides corresponding to higher salinity. Surface salinities were 1-2 ppt saltier than at depth,
except at the canal bend location, where water was saltier at depth due to the surface freshwater
input from Kawai’nui Marsh.
Water Temperature
Dataset
Water temperature analyses were based on data collected every 30 minutes from three
stations: boat mooring, canal bend, and offshore, each positioned just above the benthos
(approximately 2.0 m, 0.5 m, and 4.0 m depths, respectively). Each of these loggers collected
9701 data points over the time span of March 14 to October 2, 2010. Pair-wise Pearson
correlations of water temperature were highly positively correlated (r = 0.90 – 0.93), indicating
that temperature variability at the sampled locations was very similar (Figure 6A).
Principal component analysis (PCA)
Analysis of water temperature by PCA revealed that three principal components (PCs)
described 100% of the variation seen, with the first PC explaining 94.45% of the variance (Table
152
3510
3515
3520
3525
3530
305
7). Randomization tests revealed that only the first PC was significant (p = 0.001) as the
observed eigenvalue was larger than those arising from 1000 randomizations of the data (Table
7). To determine the number of PCs that best explained the results, two “rules” were followed:
1) comparing the eigenvalue of an axis to the eigenvalue produced by chance (broken-stick
eigenvalue; Table 7), using any PCs with an eigenvalue > broken-stick eigenvalue (PC 1 only),
and 2) comparing an observed eigenvalue for a given PC to the average eigenvalue obtained
through randomizations, and using any PC with a p-value < 0.05 (PC 1 only; Table 7). Even
though PC 2 was not significant, it did explain 3.53% of the variation, and was negatively loaded
with the canal bend location (loading of -0.788), indicating a stronger influence of cool fresh
water from the marsh at this location (Figure 7; Table 8). The value of PC 1 decreased over
time, indicating an increase in temperature, while the values of PC 2 and PC 3 remained
relatively stable across time (Figure 6B). Date (r = -0.780) strongly negatively correlated with
PC 1, while time of day (r = -0.228) was weakly correlated with PC 1, indicating weak diel
rhythms and a stronger warming trend. All three stations were strongly correlated with PC1:
boat mooring (r = -0.974), canal bend (r = -0.967), and offshore (r = -0.975) (Table 9).
Fourier (spectral) analysis
Fourier (spectral) analysis of the PC 1 values showed monthly effects on water
temperature change (Figure 8). Small energy peaks at approximately 15 and 30 days indicate
high-frequency water temperature fluctuations at the half and full lunar cycle, and a larger
energy peak at the 90-day cycle is indicative of low-frequency temperature changes on the 3-
month time scale.
153
3535
3540
3545
3550
Algae Abundance
A comparison of algal percent cover to algal percent biomass was performed to
determine if one parameter could be a good indicator of the other (Figure 9; Table 10). Pearson
correlations were performed for each of the seven algal functional groups comparing the percent
algal cover to the percent algal biomass in each quadrat, using each of the 18 total data points per
functional group. The simple branching algae had the highest correlation (0.961), and the
filamentous algae had the lowest (0.271). While complex branching, mass forming, and turf
algae have fairly similar percent cover and percent biomass across time and location, filamentous
algae contributes more to total biomass than percent cover across location and time. Because
foliose and articulated calcareous algae were never recorded on one of the 25 intersection points
of any quadrat, the Pearson correlation could not be performed for these functional groups.
Overall, algal percent cover and percent biomass provide different perspectives into algal
abundance and composition. Although, a few of the functional groups have high correlations,
others have low correlations. Thus, we opted for using the biomass measurements to assess
changes in algal abundance and composition across habitats and time periods.
Overall, turf algae was the dominant functional groups in terms of percent cover and
biomass across both habitats and three time periods. Complex branching (primarily
Acanthophora sp. and Turbinaria sp.) and mass forming (Dictyosphaeria cavernosa) were the
next most prevalent algal functional group types, with filamentous (encompassing a wide variety
of algal species) and simple branching (primarily Dictyota sp.) fairly rare, and foliose and
articulated calcareous algae (both encompassing a wide variety of algal species) only found in
trace amounts. Additionally, the cove habitat showed a larger amount of turf, filamentous, and
154
3555
3560
3565
3570
3575
310
complex branching algae biomass, while the rocky shore had more mass forming and simple
branching algae biomass (Figure 10; Table 11).
Total turf algae biomass increased from June to July then decreased again in September.
Total complex branching algae biomass showed the opposite trend, first decreasing, and then
increasing. Total filamentous and mass forming algal biomasses both showed a generally
decreasing trend over time, while simple branching algal biomass increased. Additionally, the
cove habitat showed a larger amount of turf, filamentous, and complex branching algae biomass,
while the rocky shore had more mass forming and simple branching algae biomass (Figure 10;
Table 11).
A multi-way ANOVA revealed a significant difference in biomass amongst the five
abundant algal functional groups (turf, filamentous, complex branching, mass forming, simple
branching) (F = 26.44, df = 4, p < 0.001), but no differences across habitats or time periods
(Table 12). There were also significant interactions between functional groups and time periods
(F = 2.30, df = 8, p < 0.05) and functional groups and habitats (F = 3.83, df = 4, p < 0.01). To
determine the pair-wise differences in the biomass of specific algal functional groups, a post-hoc
Tukey Test revealed that turf algae biomass was significantly different from every other
functional group (Table 11).
Comparison of TDTR Data to Video Surveys
Concurrent data were collected by both time-depth-temperature recorders (TDTRs) and
video behavioral surveys on 26 occasions, with a total of 801 shared data points collected every
15 seconds. These 26 samples, ranging in length from two to ten minutes (mean = 7.71, S.D. =
1.53) covered all four tidal cycle phases (low, rising, falling, high), all three habitats covered by
155
3580
3585
3590
3595
the behavioral surveys (cove, channel / ledge, Kailua Bay), and showcase four of the six TDTR-
tagged turtles. Pearson correlations show high similarities between five parameters measured
concurrently via TDTR and video (Table 13), indicating that behavioral observations using 0.5 m
depth bins approximate the more precise TDTR data.
Analysis of Video Behavioral Surveys
Dataset
A total of 277 video behavioral surveys occurred between March 18 and September 11,
2010. These videos were spread out through all four tidal cycle phases (Low: n = 64; Rising: n =
74; Falling: n = 67; High: n = 72), all three primary habitats of focus (cove: n = 80; channel /
ledge: n = 106; Kailua Bay: n = 91), and all six months (March 18 – April 16: n = 50; April 17 –
May 15: n = 44; May 16 – June 14: n = 44; June 15 – July 13: n = 45; July 14 – August 11: n =
48; August 12 – September 11: n = 46). The 277 videos ranged in length from 2 to 10.25
minutes (mean = 7.46, S.D. = 1.35). GPS data was collected for 251 of the 277 videos, resulting
in 7,480 individual locations each associated with a specific behavior (Figure 11-12).
Non-metric multidimensional scaling (NMDS) analysis
A one-dimensional ordination was identified as the best NMDS solution when
considering the reduction in stress (including axes until the reduction in minimum observed
stress < 5) and the p-values (p < 0.05) for each axis (Figure 13). Final stress was 8.857,
indicating a minimal risk of drawing false conclusions from the NMDS plot (McCune and Grace
2002). This axis, which explained a total of 79.9% of the variation in the data (p = 0.001), can
156
3600
3605
3610
3615
3620
be used to describe the relationships between the groups analyzed (8 different behavioral states
and 12 behavioral variables) and the 277 video samples.
The NMDS analysis revealed two groupings within the 8 behavioral states (Figure 13A),
indicating that resting would more often occur on its own, while the other “non-resting”
behaviors would occur together. In particular, the NMDS results highlight the separation of
resting and foraging / food searching, the two behaviors found on opposite ends of the axis.
Indeed, only six of the 277 videos contained both resting and foraging / food searching
behaviors, highlighting that these “site-specific” behaviors are spatially and temporally
segregated. Conversely, resting and foraging / food searching co-occurred with some of the
other generalized behaviors (breathing, hovering, and swimming).
Within the non-resting grouping, posing was the most distinct behavior, which would
often occur independently but was often related to the three generalized behaviors. On the more
positive end of this grouping were foraging and food searching behaviors, showing that these
were separate from resting and posing(the other site-specific behaviors), but were associated
with the three general behaviors (swimming, hovering, and breathing). Body swiping behavior
occurred in the middle of the non-resting group, showing that it co-occurred with all behaviors
within this grouping.
The behavioral variables along the ordination axis were broken into three groupings:
average/maximum turtle depth, average/maximum number of foraging bites, and all other
variables (Figure 13B). Average and maximum turtle depth were closest to the behavioral state
of resting, indicating that resting turtles rested in deeper water. Average and maximum turtle
depth were also close to the posing behavior (being slightly negative), indicating that posing
would often occur in deeper water. As expected, average and maximum number of bites were
157
3625
3630
3635
3640
315
closest to the foraging and food searching behavioral states. Within the third grouping of
behavioral variables involved the flipper beat parameters (a proxy for turtle speed; Yasuda and
Arai 2009), breathing parameters, coefficient of variation of number of foraging bites and turtle
depth, and number of depth bin changes per video. These parameters are not closely related with
any site-specific behavior (foraging, food searching, posing, resting), and instead represent the
general behaviors of swimming, hovering, breathing, and body swiping. These are all slightly
positive on the ordination axis.
The video samples along the ordination axis are broken into four groupings: primarily
resting, primarily posing, primarily foraging, and generalized behaviors (Figure 13C). On the
negative end of the axis is the primarily resting group – videos in which turtles rested for all or
nearly all of the video, closest to resting behavior and those behavioral variables associated with
resting. One lone point represents primarily posing within a video (near value of -2 on the
ordination axis). On the positive end of the axis is the grouping of videos in which turtles spent a
great amount of time foraging / food searching, closest to foraging and food searching behaviors,
and those behavioral variables most closely associated with those behaviors. Scattered around
the origin of the axis are the videos in which generalized behaviors occurred. The more negative
side of this grouping involved more resting and posing, and the more positive side of this
grouping involved more foraging behavior interspersed with swimming, hovering, breathing, and
body swiping.
The Kendall rank (tau) correlations revealed associations of 22 quantitative
environmental variables with the ordination axis of the NMDS (Table 14; Figure 14). The
proportion of time spent in the cove habitat (tau = 0.152) was positively related (tau > 0.079, p <
0.05) to the ordination axis. Additionally, algae (tau = 0.183), rubble (tau = 0.194), urchin (tau =
158
3645
3650
3655
3660
3665
0.097), and coral (tau = 0.087) substrates were positively correlated with the axis. Lastly, video
length (tau = 0.33) was significantly related with the axis. Being positively correlated with the
ordination axis, these environmental variables were associated with the foraging and food
searching behaviors.
Several other variables were negatively related (tau < -0.079, p < 0.05) with the
ordination axis and were thus not associated with foraging and food searching behaviors. The
proportion of time spent in the channel (tau = -0.137), ledge (tau = -0.115) and canal (tau =
-0.109) habitats, as well as average water depth (tau = -0.124) were significantly related to the
negative end of the axis. As turtles were witnessed resting almost exclusively under the ledge,
the amount of time spent within the channel and ledge habitats were greatly correlated with
resting behavior. Average water depth was also significantly related with the negative end of the
ordination axis, and thus resting behavior, as resting did primarily occur in the deepest part of the
site. Time spent within the canal habitat was also related to the negative end of the axis, but very
few turtles swam into the canal, often performing the behaviors of swimming and hovering.
Therefore, the canal habitat’s significance with the axis may be due just to chance. As in the
case of foraging and food searching behaviors, it once again cannot be assumed that if a turtle
was in either the channel or ledge habitat, or in deep water, that it was performing resting
behavior. But the associations between this behavior and these environmental variables are
strong.
The rest of the explanatory variables, including all general environmental parameters
(precipitation, tidal height, lunar cycle, Julian Day, cloud cover, wind speed), three substrate
types (bivalves, rock, sand), the proportion of time spent within the rocky shore habitat, and the
159
3670
3675
3680
3685
320
CV of water depth were not significantly correlated with the ordination axis, and were thus not
associated with any behavioral state or variables.
Multi-replicate permutation procedures (MRPPs) and indicator species analyses (ISAs)
The amount of resting, foraging / food searching, and posing behaviors on overall turtle
behavior showed a strong effect size (MRPP T-statistic = -89.880; δ = 0.26) and a strong
separation between defined groups and a within-group agreement value (A = 0.471) above zero,
indicating less heterogeneity within groups than expected by chance (overall p < 0.001, Table
15). The only groups not significantly different from each other were groups 3, 4, and 6 (Figure
15; Table 15), showing that if there was either no resting or posing, or only some of these two
behaviors, overall turtle behavior was unaffected. It is likely that when foraging / food searching
was occurring in conjunction with posing or resting, it was such a minimal amount that it could
not be differentiated from no resting or posing occurring. A follow-up ISA determined that 15 of
the 20 behavioral variables could be used to determine the amount of resting, foraging / food
searching, and posing behaviors that were occurring (p < 0.05; Table 16). To be considered
significant, a variable must have an indicator value of at least 25%, as this indicates this variable
occurs in at least 50% of one site group (this will always be 0% or 100% in this study) and that
its magnitude within the group is at least 25%. Thus, if one of the two values is 100%, the other
one will always be > 25% (as done in Dufrêne and Legendre 1997). Therefore, the amount of
resting (IV = 74.6) indicates when a turtle rests for the entire length of one video (group 1), the
CV of the number of flipper beats (IV = 28.4) can be used to describe when a turtle does some
resting, but no foraging / food searching or no posing (group 2), the amounts of foraging (IV =
37.0) and food searching (IV = 56.0), and the average number of bites (IV = 52.2) can be used to
160
3690
3695
3700
3705
3710
describe when a turtle does no resting or posing, but some foraging / food searching (group 3),
the amount of posing (IV = 71.3) can be used to indicate when a turtle does no resting or foraging
/ food searching, but some posing (group 4), the maximum (IV = 31.7) and CV (IV = 36.2) of the
number of bites can indicate when a turtle does some resting and some foraging / food searching,
but no posing (group 5), no behavioral parameters indicated no resting, but some foraging / food
searching and some posing behaviors (group 6), and the amount of swimming behavior (IV =
28.6) can indicate when no resting, posing, or foraging / food searching occurs (group 7). The
amount of time spent swimming within a video could be used to indicate when none of the three
behaviors occurred, likely because the turtle spent these videos primarily swimming, but also
hovering, breathing, and occasionally body swiping.
The effect of the combination of month and tidal phase on overall turtle behavior yielded
a small effect size (MRPP T-statistic = -1.154; δ = 0.49) indicating an overall weak separation
between the defined groups and a chance corrected within-group agreement value (A = 0.012)
very close to zero, suggesting that the heterogeneity within groups equals the expectation by
chance (overall p = 0.127, Table 17). The MRPP analysis of behavior by month and tidal phase
did not yield significant results and identified no behavioral variable indicators. Because these
temporal variables did not predict turtle behavior within KME, this result suggests that turtle
behavior did not change as a function of tidal cycles and months (March – October) throughout
the course of this study. Because there were no significant differences amongst the defined
groups, no ISA was conducted to identify the variables responsible for these pair-wise
differences.
The effect of habitat on overall turtle behavior yielded a strong effect size (MRPP T-
statistic = -18.706; δ = 0.47) indicating an overall strong separation between defined groups, but
161
3715
3720
3725
3730
3735
a chance corrected within-group agreement value (A = 0.069) very close to zero indicating
heterogeneity within groups equals expectation by chance (overall p < 0.001, Table 18). The
only groups not significantly different from each other were groups 3 and 4 (Figure 16; Table
18), showing that turtle behavior in Kailua bay and the rocky shore habitats could not be
distinguished, likely because the rocky shore is basically a shallow-water extension of Kailua
Bay. A follow-up ISA determined that 14 of the 20 behavioral species could be used to
distinguish habitats (p < 0.05; Table 19). With the additional criterion of the IV > 25%, the
amount of foraging (IV = 38.9) and food searching (IV = 28.4) behaviors, the average (IV = 43.0)
and maximum (IV = 34.2) number of bites, and the number of breaths per video length (IV =
39.5) could be used to determine when a turtle was primarily in the cove habitat (group 1). The
amount of resting (IV = 34.4), and the average (IV = 35.8) and maximum (IV = 32.8) turtle depth
could be used to determine when a turtle was primarily in the channel or ledge habitats (group 2).
The amount of swimming (IV = 32.7), the CV of turtle depth (IV = 29.5), the average number of
flipper beats (IV = 30.0), and the average time between breaths (IV = 30.5) could be used to
determine when a turtle was primarily in the rocky shore habitat (group 4).
DISCUSSION:
Juvenile green turtles at the Kawai’nui Marsh Estuary (KME) study site traverse amongst
various heterogeneous habitats, differing in physical and biological properties which show
temporal variability in water temperature and algal biomass. The goal of the study was to
characterize turtle behavior in response to various environmental changes and different habitat
characteristics. We hypothesized that behavior would vary by habitat, water temperature, and
algal biomass within KME, with foraging occurring in warmer, shallower water with higher algal
162
3740
3745
3750
3755
325
biomass, and resting occurring in colder, deeper water with less algal biomass. By studying how
these turtles utilize their surroundings across spatial and temporal scales, we can better
understand how turtles survive and grow to maturity in critical densely-populated juvenile
foraging / resting / cleaning habitats, allowing any necessary management actions to be enacted.
Water Temperature Variability
All three water temperature stations (canal bend, boat mooring, offshore) were highly
correlated suggesting that there was little systematic variability in water temperature across
KME. Thus it is unlikely that water temperature fluctuations would influence turtle distribution
and behavior within the study site. Water temperature fluctuations on daily and lunar cycles
ranged from 2 to 3 °C, with coolest water temperatures at night and warmest during the day,
corresponding with green turtle resting behavior at night and more activity during the day, as
suggested by the TDTR data (unpublished). While similar temperature cycles have been
witnessed at other sites, like Heron Island, Australia (Southwood et al. 2003a), larger
fluctuations would be expected at the shallow-water KME site with a seasonally variable strong
stream input (as suggested by the salinity data). Yet, with such minor fluctuations in temperature
on the daily and lunar scales, turtle behavior may have been more affected by other
environmental parameters, and only slightly by water temperature.
Over the course of the study, overall average water temperature increased by
approximately 4 °C across the site, suggesting a transition from early-spring to early-fall
conditions. However, there were no trends in turtle behavior over the scale of the entire study, as
indicated by the lack of significant relationships with two metrics of time (Julian Day, month),
despite the warming trends documented during the study. In summary, there is little evidence of
163
3760
3765
3770
3775
3780
water-induced changes in turtle behavior at this tropical site, where temperature fluctuated from
21.56 °C (boat mooring, 4/17/2010) to 28.84 °C (canal bend, 7/17/2010) over the span of seven
months (Figure 6A). In other subtropical study sites (e.g., Hazel et al. 2009, in Moreton Bay,
Australia) with more substantial water temperature fluctuations (13.8 to 30.3 °C), green turtles
did respond to the changing water temperature, performing longer dives during cooler water
conditions.
Varying water temperature has been shown to affect turtle behavior (e.g., Hays et al.
2002; Southwood et al. 2003a; Hatase et al. 2006) because they cannot raise their body
temperature more than 1-3 °C above that of the surrounding water (Sato et al. 1998; Southwood
et al. 2003a), and often rely on behavioral thermal regulation (e.g., basking) or decrease their
activity during cold-water conditions (Balazs 1980; Godley et al. 2002; Southwood et al. 2003a;
Hochscheid et al. 2005). Off the coast of Florida, green turtles avoid overheating by diving to
cooler water temperatures at depth, and diminishing their activity levels (Mendonca 1983).
While water temperature affects turtle buoyancy (Hatase et al. 2006), metabolic rate (Sato
et al. 1998; Hays et al. 2002; Southwood et al 2003a), and activity patterns (Hays et al. 2002) of
green turtles, these responses are not pervasive. For instance, green turtles inhabiting a shallow
foraging site off the coast of Australia did not change locations or swim to deeper waters with
lower water temperature even when surface temperature rose to 30.3°C. However, deeper cooler
water was not easily accessible to these turtles (Hazel et al. 2009). Similarly, varying water
temperatures (17-26 °C) had no effect on juvenile green turtle breathing rates within a lab setting
in Vancouver, Canada (Southwood et al. 2003b).
Due to the small differences in surface and bottom temperature at KME due to the
shallow nature of the site (average difference of 0.15 °C between the surface and at depth, made
164
3785
3790
3795
3800
330
at 24 locations within KME in October 2009, unpublished data), it was hypothesized that turtles
would not be able to mitigate changes in water temperature behaviorally, and would therefore
exhibit more resting behavior in the cooler, earlier part of the study (lower metabolic rates in
cooler water), and more foraging in the warmer, later part of the study. This was not found to be
the case, as behavior did not vary by Julian day or month. Because the turtle response to water
temperature is based on a correlational analysis, it may be confounded by other concurrent
environmental changes. For instance, it is possible that the same level of turtle activity was
maintained throughout the study, if turtles were attempting to create metabolic heat through
heightened activity (e.g., Mendonca 1983) in the early part of the study period, when forage was
plentiful. And turtles may have been forced to search for food harder in the later part of the
study period, when forage was depleted.
Algae Biomass
We quantified spatial variability in algae biomass between two habitats used by foraging
turtles (cove, rocky shore) and temporal changes spanning from late spring (June) through early
fall (September). Biomass of distinct algae functional groups varied as a function of time, likely
due to the seasonality of algal growth throughout the Hawaiian Islands. Frondose algae biomass
in the Hawaiian Islands is minimal during the summer (July – September) and reaches the
maximum values in spring (February – May), although these fluctuations do not relate with light
intensity, temperature, water movement or salinity (Santelices 1977). Certain species, however,
such as Dictyosphaeria cavernosa (mass forming) have highest algal abundance during the
summer. Other species, such as Acanthophora spicifera (complex branching) have an irregular
pattern of biomass change throughout the year (Santelices 1977). Alternatively, the observed
165
3805
3810
3815
3820
3825
variation in algal biomass may also be due to grazing by green turtles at the site rather than just
seasonality, perhaps explaining the decline in mass forming algae at a time when its abundance
should be high. Hawaiian green turtles feed on both seagrass and algae (Balazs 1980). As green
turtles are known to be opportunistic specific feeders that can adapt to forage on the most
nutritious algae available (Bjorndal 1980; Arthur and Balazs 2008), they are expected to forage
preferentially on the items of the highest quality, despite their broad diets (Balazs 1980, Bjorndal
1997). Namely, the decline in complex branching algae in the rocky shore habitat and mass
forming algae in both the cove and rocky shore habitats over time may be explained by turtle
preference for this forage. Algae biomass also differed by habitat, likely as a result of different
grazing pressures. However, as foraging behavior is not significantly related to Julian Day, any
associations drawn between this behavior and changes in algal biomass over time must be
considered with caution.
In Hawai’i, red algae are present in 99.5% of green turtle diet samples, with a single
species (e.g., Acanthophora sp., Dictyosphaeria sp., Gracilaria sp., Halophila sp., and others)
dominating an individual’s diet 78.9% of the time (Arthur 2005; Arthur and Balazs 2008).
Frequently, complex branching algae (Acanthophora spicifera and Hypnea musciformis) are the
primary diet items (Arthur 2005). Other major algae included in the diet of Hawaiian green
turtles are Codium sp. (mass forming), Ulva sp. (foliose), and Pterocladia sp. (turf) (Balazs
1980). Despite the consistently high biomass of turf algae across time, which could suggest that
this is not a targeted food item of green turtles in this location, the turf algae was heavily grazed
upon and cropped, either by turtles or other grazers (Wabnitz et al. 2010). Because foliose algae
was found in only trace amounts, turtles may have foraged opportunistically on this species,
keeping its overall abundance very low, competing with other algal grazers.
166
3830
3835
3840
3845
3850
Alternatively, turtle diets throughout the Hawaiian Islands vary by site driven by prey
availability. Therefore, differences in diet could reflect differences in food availability (Arthur
2005). For example, Hypnea musciformis (a complex branching alga) has now colonized around
the islands of Molokai and O’ahu, and has become major forage items of local turtles (Balazs
and Chaloupka 2004a). At Punalu’u on the island of Hawai’i, the primary food source of turtles
is the red alga Pterocladia capillacea (Balazs et al. 1994). Turtles also occasionally eat Dictyota
sp. (simple branching), but cannot digest it as well as other algal functional groups (Arthur
2005). Therefore, simple branching algae may increase over time if turtles are primarily grazing
on more digestible types of algae. Even though flexibility of the turtles’ diet and the presence of
other potential grazers inhibit the establishment of direct cause – effect interactions, these results
do not suggest a systematic decrease in algae biomass over the study period.
The results of this analysis are subject to the large degree of within-site variability in
algae biomass. These large variations in algal biomass within one habitat (e.g. turf in the rocky
shore habitat) are caused by the small sample sizes and the inherent heterogeneity in the algae
distributions within and between habitats.
Turtle Behavioral Observations
The video observations of turtle behavior provided valuable insights into their activity
patterns within different habitats (Hochscheid et al. 1999; Houghton et al. 2003; Schofield et al.
2006). In particular, because some of these observations occurred concurrently with the
deployment of TDRs, they facilitated calibrated comparisons of turtle depth in the water column.
Despite estimating turtle vertical position using coarse depth bins (0.5 m) in the video behavioral
surveys, Pearson correlations between the instantaneous turtle depths from video and TDR data
167
3855
3860
3865
3870
335
were relatively high (Table 5), suggesting a good agreement between these two concurrent
observations. This comparison strengthened the results of the subjective analysis of turtle diving
behavior from video observations.
General Description of Turtle Behaviors: Resting
Resting turtles would lie completely motionless, with no flipper movement, while in
contact with the substrate. This may involved the use of a natural or anthropogenic underwater
structure (e.g., rocky ledge, garbage can) to hold the turtle in place (Table 2). Upon reaching the
surface after resting, turtles would typically remain at the surface for a much longer breathing
bout than foraging turtles, often staying at the surface for up to two minutes, taking multiple
breaths, before resuming their diving activities. Resting was primarily concentrated along either
side of the channel habitat (the ledge; Figures 11a, 12a).
General Description of Turtle Behaviors: Foraging / Food Searching
Food searching occurs when a turtle moves horizontally along the substrate using
minimal flipper movements to steady itself in the current or surge while actively looking for
food, as evidenced by frequent head turning and eyes focused on the substrate (Table 2).
Typically, foraging turtles would dive from the surface at a shallow angle, apparently to allow
them to scan the substrate for suitable algae (Glen et al. 2001). Upon reaching the bottom,
foraging turtles would engage in slow horizontal movements, using their flippers to both steady
themselves and even crawl along the substrate, moving their heads back and forth in search of
preferred algae. Upon encountering suitable algae, the turtle would take one or multiple small
bites, pulling its head up from the substrate as its jaw continued to move up and down, possibly
168
3875
3880
3885
3890
3895
chewing the item in its mouth (Table 2). The turtle would then return its head to the substrate to
take another bite, or continue moving slowly along the substrate performing the food searching
behavior. This foraging behavior involved algae of various functional groups, primarily
including complex branching, mass forming, and turf algae,
Foraging / food searching dives were typically very active, with a great amount of
movement both horizontally along the substrate and vertically as the turtles would surface
frequently for quick breaths. Because these types of dives would result in an erratic bottom
profile, with a great amount of fluctuation in bottom depth, foraging turtles would be expected to
be characterized by high variability in depth (high depth CV). Foraging / food searching
behaviors were concentrated within the cove and Kailua Bay habitats, but fairly scattered within
each (Figures 11b, 12b).
General Description of Turtle Behaviors: Breathing
Breathing turtles were motionless with their head above the surface, with occasional
visible bubbles and/or expulsion of water (Table 2). Turtles spent a varying amount of time at
the surface breathing while taking anywhere from one to 9 breaths. Typically, breathing during
foraging would entail a single quick breath, with the turtle immediately returning to the bottom.
Breathing events after resting would typically entail a much longer surfacing interval, with a
greater number of breaths being taken. Number of breaths taken per 30 seconds was positively
significantly correlated with time spent within the cove habitat (r = 0.42, p < 0.01) and no other
habitat, indicating a greater amount of active behavior within this habitat. Average time between
breaths was positively significantly related with time spent in the Kailua Bay (r = 0.16, p < 0.01)
and the rocky shore habitat (r = 0.17, p < 0.01), and negatively significantly correlated with time
169
3900
3905
3910
3915
340
spent in the ledge habitat (r = -0.50, p < 0.01). This indicated longer time between breaths while
in the Kailua Bay and rocky shore habitats where turtles would primarily forage and spend a
great amount of time swimming horizontally, and spending much less time between breaths after
finishing a resting event on the ledge. Breathing behavior was widespread throughout the entire
site (Figures 11c, 12c).
General Description of Turtle Behaviors: Posing
While posing, a turtle would remain motionless in the water column or engage in
minimal flipper movements to maintain the horizontal position, while its vertical position
relative to the substrate would not change (as described by Losey et al. 1994). The turtle’s
flippers and neck would be completely outstretched and hung downward (Table 2). This
behavior occurred only at the cleaning station, a group of three large boulders in the middle of
the channel habitat. After assuming the posing position, cleaning fishes would pick at the skin
and carapaces of the turtles. Posing behavior occurred only within the channel at the cleaning
station (Figures 11d, 12d).
General Description of Turtle Behaviors: Swimming
Swimming turtles actively used their front flippers to propel themselves forward and to
ascend or descend (Table 2). Turtles utilized the entire water column (0-5 m) for swimming,
although drag resistance is known to be minimal at approximately 2.5-3 times an animal’s body
thickness (Hays et al. 2001). When diving from the surface, turtles would beat their flippers at a
high rate and begin at a steep angle, which would decrease as their depth increased, likely
allowing them to overcome the resistance from buoyancy (Glen et al. 2001; Hays et al. 2004).
170
3920
3925
3930
3935
3940
When rising to the surface from depth, turtles would use fewer flipper beats to fight negative or
neutral buoyancy, thereafter ascending passively. This pattern resembles the flipper beat
behavior described in Hays et al. (2001) and Yasuda and Arai (2009). However, average number
of flipper beats per 30 seconds is negatively correlated with average turtle depth (r = -0.45, p <
0.01) indicating more flipper beats in shallower water, possibly due to the inherently shallow
nature of the site. The CV of turtle depth was positively significantly correlated with both
average number of beats (r = 0.45, p < 0.01) and maximum number of flipper beats (r = 0.52, p <
0.01) per 30 seconds, indicating a strong correlation between diving intensity and number of
flipper beats. When swimming horizontally (presumably at neutral buoyancy), turtles would
employ a stroke-and-glide technique, likely to reduce energy output as drag increases with
increasing horizontal speed (Sato et al. 2003). Turtles would often travel at a constant low
speed, also minimizing metabolic loss (Hays et al. 1999). Swimming behavior was very
widespread across the entire site (Figures 11e, 12e).
General Description of Turtle Behaviors: Hovering (Figures 11f, 12f)
Hovering behavior occurred when a motionless or drifting turtle would engage in
minimal flipper beats, while retaining its horizontal position in relation to the substrate (Table 2).
Additionally, turtles would often rise vertically to the surface from a dive without engaging in
flipper beats, likely to be minimizing energy loss in this fashion (Hays et al. 2001). Turtles
engaged in hovering at depth and at the surface. They would often pause their flipper
movements and remain still in the water column, while drifting horizontally. Turtles would also
frequently rest at the surface in between breathing events, with their heads under the surface,
possibly basking in the sunlight for short periods of time to increase their body temperature
171
3945
3950
3955
3960
3965
(Balazs 1980). Hovering behavior was widespread across the site, but was also focused within
the cleaning station in the channel (Figures 11f, 12f).
General Description of Turtle Behaviors: Body Swiping
Body swiping behavior involved a turtle using its front flipper(s) to wipe or swipe its
face, plastron or carapace, while moving in the mid-water column (Table 2). This behavior has
been interpreted as a turtle demonstrating its annoyance with another turtle, fish, or human when
using its flippers to wipe its face (Bennett and Keuper-Bennett, unpublished data). Nevertheless,
particles would often be wiped off as the turtles swiped their bodies, suggesting this behavior
may also involve cutting food in the turtle’s mouth (Balazs 1980) or may represent self-cleaning
behavior.
Video Surveys: Behavioral and Environmental Relationships
Within the current study, resting and non-resting behaviors of juvenile green turtles
differed substantially, as these two groupings were placed in opposite ends of the non-metric
multidimensional scaling (NMDS) analysis main ordination axis. Many previous studies also
found a separation in these behaviors, with green turtles foraging during the day and resting at
night (e.g., Mendonca 1983; Hays et al. 1999; 2000; Seminoff et al. 2001; Makowski et al. 2006;
Rice and Balazs 2008; Hazel et al. 2009; I-Jiunn 2009; Blumenthal et al. 2010). Alternatively,
Mendonca (1983) found turtles to rest in mid-day (approximately 10:00 AM to 2:00 PM) and to
feed in the early morning and late afternoon. Yet, other studies have found that these behaviors
are performed in combination with each other. In Cyprus, green turtles both feed and rest when
performing U-shaped dives (Hochscheid et al. 1999). At Laguna San Ignacio, off the Pacific
172
3970
3975
3980
3985
345
coast of Baja California, Mexico, green turtles are active throughout 24-hour periods (Senko et
al. 2010), suggesting that they alternate foraging with resting dives. This pattern was rarely seen
within KME as only six of the 277 videos documented both resting and feeding behavior.
Perhaps with a longer video length, this combination of behaviors would have been witnessed
more often.
These surveys also documented another site-specific behavior, termed posing, described
above. The posing behavior was placed on the opposite end of the ordination axis, within the
“non-resting” grouping but apart from foraging / food searching, and more closely interspersed
with the three general behaviors (swimming, hovering, breathing). Thus, posing was more
closely related to foraging / food searching than resting behavior, which was segregated.
The hypothesis that resting would be associated with deeper water was verified by its
close association with the average and maximum turtle depth variables in the NMDS along the
negative end of the ordination axis. The placement of foraging / food searching on the positive
end of the axis confirms the hypothesis of foraging in shallow water. Indeed, turtles would
primarily rest under the ledge in the channel / ledge habitat, the deepest part of the site. Green
turtles are known to rest in deeper water and to forage in shallower water (e.g., Bjorndal 1980;
Mendonca 1983; Brill et al. 1995; Southwood et al. 2003a; Makowski et al. 2006; Yasuda and
Arai 2009). Foraging dives, in which turtles seek and consume forage, involve higher metabolic
demands, and therefore are likely to be shorter and shallower (Hays et al. 1999). In particular,
foraging dives are shorter than resting dives because they involve more energy expenditure, and
thus deplete a turtle’s oxygen stores more quickly (Houghton et al. 2003).
Yet, due to the shallow nature of the KME site, the resting depths of these turtles were
relatively shallow, compared to the resting depths of green turtles measured in other studies (e.g.,
173
3990
3995
4000
4005
4010
16-40 m, Davis et al. 2000; 18-20 m, Hays et al. 2000;15-20 m, Hatase et al. 2006; 7-26.5 m,
Seminoff et al. 2006). When deep-water is not available, turtles have been shown to rest in
shallow water, as suggested by Hazel et al. (2009), in a study of green turtles in a shallow near-
shore foraging area in Moreton Bay, Australia. All resting events (except for one) involved the
use of underwater structures to hold a turtle in place. These “assisted resting” events could have
helped a turtle to maintain its position while being positively buoyant after taking a large breath
to maximize resting time. Or, it is possible that resting in or near vertical structures could have
provided a refuge from predation (Seminoff et al. 2006). Furthermore, one turtle (ID #T37) was
known to exhibit territoriality – it would frequently be found resting in the same position under
the ledge in the channel / ledge habitat, and was witnessed excluding another resting turtle from
the location.
Average and maximum depth were also closely related with posing behavior, which
occurred exclusively at the cleaning station within the channel habitat, in one of the deepest parts
of the site. Cleaning stations in Hawai’i are known to be associated with some prominent
feature, such as a large coral head (Losey et al. 1994). Within the deep channel habitat, three
large boulders indicated the location of the cleaning station, thus explaining the correlation of
posing behavior with average and maximum turtle depth. However, as turtles were not always
along the substrate while performing this behavior, unlike resting behavior, the association
between these depth variables and posing behavior is not quite as strong. Although the specific
species of reef fishes cleaning the turtles were not documented in the current study, in Hawai’i,
three species of surgeon fishes are known to graze on green turtles – Acanthurus nigrofuscus,
Ctenochaetus strigosus, and Zebrasoma flavescens. Two species of wrasses and one damselfish
are known to graze on turtles’ bodies in Hawai’i as well – Thalassoma duperry (Losey et al.
174
4015
4020
4025
4030
350
1994) and Thalassoma lunare, and Abudefduf sexfasciatus (Booth and Peters 1972). These
fishes primarily feed on the algae and molting skin of the turtles (Losey et al. 1994). There were
typically anywhere from one to five turtles in the vicinity of the cleaning station whenever it was
approached by the primary snorkeler. The relationships and interactions between reef fish and
sea turtles remains poorly documented (Grossman et al. 2006). It is thus important that this
mutualistic cleaning relationship be explored further.
All other behavioral variables (flipper beat parameters, breathing parameters, coefficient
of variation (CV) of number of foraging bites and turtle depth, and number of depth bin changes
per video) were placed close to the generalized behaviors (swimming, hovering, breathing, body
swiping) near the origin of the NMDS axis. Therefore, these variables cannot be used as proxies
of site-specific behaviors (foraging, food searching, posing, resting). Yet, some of these
behavioral variables would have been expected to be strongly associated with specific behaviors.
For instance, flipper beat frequency, which responds to changes in buoyancy (Hays et al. 2004;
Yasuda and Arai 2009), should have been positively related to behaviors (like foraging)
involving increased vertical and horizontal movements and negatively related with resting.
Nevertheless, it is possible that due to the pervasiveness of the breathing and swimming
behaviors, the long duration of the video observations masked the flipper-beat patterns
associated with foraging (high beat frequency) and resting (low beat frequency). The placement
of the behavioral and environmental variables along the ordination axis provided additional
insights into turtle behavior and activity patterns. For instance, the association of the average
and maximum number of foraging bites with the foraging / food searching behaviors reinforces
the notion that food searching behaviors were correctly identified when viewing the behavioral
videos.
175
4035
4040
4045
4050
4055
When grouping the video observations according to the occurrence of site-specific
behaviors (resting, posing, foraging / food searching categories; MRPP), different variables
allowed us to discriminate amongst turtle behaviors. For instance, increased foraging / food
searching, evident as a higher rate of foraging bites, was associated with specific habitats with
high algae cover (cove and Kailua Bay). Therefore, because foraging focused in these shallow
habitats, and was interspersed with breathing and swimming, foraging / food searching behaviors
were not related to any depth parameters. On the other hand, the incidence of the resting
behavior, whether a turtle spent the entire video (group 1), or the majority of a video resting
(with no foraging / food searching or posing behaviors; group 2), this behavior was evident in the
large CV of the number of flipper beats. This large variability in the number of flipper beats was
due to a sudden increase in the number of flipper beats needed to increase acceleration (Yasuda
and Arai 2009), when a resting turtle had to overcome initial neutral or negative buoyancy to rise
from depth for a breath (Hays et al. 2007). Although resting occurred in the deepest part of the
site, none of the depth parameters were indicative of the resting behavioral groups. This result is
likely caused by the association of the posing behavior in deeper water. Thus, the MRPP and
ISA tests could not distinguish between the depth profiles of posing and resting turtles.
However, a large (23.40%) and significant (p < 0.05) indicator value (IV) for average turtle
depth (group 1), suggests there is a relationship, albeit weak, between resting and turtle depth.
In addition to these clear distinctions between the site-specific behaviors, the behavioral
videos also yielded cases in which these behaviors co-occurred during an observation period.
For instance, whenever resting and foraging / food searching occurred in the same video (group
5), the maximum and the CV of the number of bites predicted this behavioral combination. In
this case, the CV had a larger indicator value, suggesting that the turtle transitioned from a
176
4060
4065
4070
4075
4080
resting state to foraging within the time frame of the video. Nevertheless, because there were
very few (n = 6 / 277) instances in which foraging and resting co-occurred within the same
video, this result must be considered with caution. It became increasingly difficult to find
significant indicator variables in those rare cases where three behaviors co-occurred within an
observation video, because of the highly variable turtle behavior during these observations. For
instance, no behavioral variables could be used to indicate the behavioral combination of no
resting, some posing, and some foraging / food searching.
Many environmental variables were significantly correlated with foraging and food
searching behaviors, including four substrate types (algae, rubble, urchin, coral) and video
length. The strong correlation between foraging behavior and algal substrate is not surprising,
given the reliance of green turtles on this forage in the study site (Arthur and Balazs 2008), and
confirms our hypothesis that foraging behavior would primarily occur in habitats with a greater
amount of algal cover. The strong correlation with the other substrates is likely the result of the
turtle-habitat associations, with coral and urchin occurrence within Kailua Bay, and with the
widespread presence of rubble within Kailua Bay and the cove. However, turtles did perform
other behaviors than foraging and food searching within these habitats, so one must be cautious
about assuming behavioral occurrences based on the associations of substrates and habitats.
Conversely, because bivalve, rocky, and sandy substrates occurred throughout the site, no
correlations between these variables and turtle behaviors were observed.
The length of the behavioral videos was strongly related to foraging and food searching
behaviors, indicating that with a longer video, these site-specific behaviors were more likely to
be witnessed. The strong correlation of video length with foraging / food searching behaviors is
interesting because it contradicts the results of the logistic regressions in chapter 2, in which
177
4085
4090
4095
4100
355
video length was not significantly related to any behavior (Chapter 2 of this thesis). It is possible
that the small sample size of videos analyzed in chapter 2 (n = 26) was not large enough to show
significance, compared with the larger sample size analyzed in this chapter (n = 277).
On the negative end of the NMDS ordination axis were those environmental variables
most closely associated with resting behavior, which frequently occurred in deeper water and
was positively correlated with average water depth. This result agrees with other previous
studies of green turtles in Puako, Hawai’i, (Davis et al. 2000) and Kaneohe Bay, although some
turtles rest in the shallows at night in this location (Brill et al. 1995). In particular, turtles
frequently rest on the undersides of ledges (Balazs 1980; Brill et al. 1995), as was witnessed in
the current study. Similarly, because the ledge extended into the channel habitat, where the
posing behavior took place, a strong correlation emerged between the channel habitat and the
resting and posing behaviors.
The MRPP and ISA testing habitat effects on turtle behavior confirmed the predictions
that the cove was primarily used as a foraging location (as indicated by the amounts of foraging
and food searching, and by the average and maximum number of bites), and that the channel /
ledge habitat was used for resting (as indicated by the amount of resting, and by the average and
maximum turtle depths). Lastly, because the rocky shore was frequently very shallow, turtles
travelled quickly through this habitat to reach the deeper Kailua Bay habitat. Thus, this habitat
was characterized by higher amounts of swimming behavior, by higher average intervals
between consecutive breaths, and by higher flipper beats (which can be used as a proxy for
speed; Hays et al. 2004). The CV of turtle depth increased if they stopped within the rocky shore
to forage, moving vertically more frequently than if just passing through.
178
4105
4110
4115
4120
4125
All other environmental variables were not significantly related to behavior (NMDS).
For instance, the parameters describing 24-hour precipitation accumulation, cloud cover, tidal
height, and wind speed were not significantly related with the axis, and thus any site-specific
behaviors (foraging / food searching, resting, or posing). A lack of a relationship between
precipitation and behavior may be due to the small changes in salinity (1-2 ppt) measured in the
study site following significant rainfall, despite any significant sediment and nutrient input. A
lack of a relationship of tidal height with behavior is unexpected as turtles can only enter the
cove habitat, a primary foraging location, when the tidal height is high. Furthermore, Hazel
(2009) found that tidal height greatly influenced turtle behavior in another shallow-water habitat
(Moreton Bay, Australia) by facilitating access to shallow habitats only during the higher tides.
Month and tidal phase were found not to be significantly related to turtle behavior. We
hypothesized there would be a behavioral difference by tidal phase, as turtles were expected to
forage primarily during higher tides when they had access to the shallow cove habitat. For
instance, green turtles in French Frigate Shoals (Northwest Hawaiian Islands) perform more
foraging during high tide, when they have access to food sources closer to shore (Balazs 1980).
However, because the behavioral videos revealed substantial foraging in the deeper Kailua Bay
habitat, turtle foraging at KME is not limited by the tides. Furthermore, a previous study found
that turtle abundance at KME was not significantly related with tidal phase and amplitude
(Asuncion 2010). Similarly, other studies suggest that when turtles feed throughout the day, as
was the case in the current study, tidal feeding patterns are not discernible (Senko et al. 2010).
Julian Day and month had no significant relationship with turtle behavior (NMDS and
MRPP analyses), suggesting that our hypothesis that foraging and resting behaviors vary
seasonally is incorrect. Nevertheless, this result may be attributable to the short duration of this
179
4130
4135
4140
4145
360
study, during a period of high turtle abundance at the site and little environmental change.
Namely, if the study had spanned longer than six months, we would have expected to detect
seasonal changes in turtle behavior. However, this spring-summer study was inhibited by the
low turtle abundance at this site (Asuncion 2010) and the need to retrieve the TDTRs. At Heron
Island, Australia, green sea turtles are known to vary diving behavior by season, and changes in
behavior between seasons are due to changes in both environmental and physiological factors
(Southwood et al. 2003a). Thus, additional year-long studies at this site will require the
deployment of satellite-linked or phone-linked GPS transmitters.
CONCLUSIONS:
In Hawai’i, green turtles spend the majority of their lives in coastal areas where they
alternate between foraging and resting (Balazs 1980). Foraging grounds typically do not exceed
three meters in depth and include reef flats, channels and shallow rocky shelves. Frequent
resting sites include coral recesses, undersides of ledges, and sandy bottom areas, which typically
do not exceed 20 m in depth. Turtles have also been recorded resting in vertical crevices, as well
as vertical-walled channels within a reef flat, both of which are normally shallower than eight
meters (Balazs et al. 1987). Sometimes the turtles rest near feeding areas by basking at the
surface (Balazs 1980). Very shallow foraging dives have been recorded (less than three meters)
with brief surface intervals (less than five seconds; Balazs 1980). Resting dives are greater in
duration (more than 20 minutes) and occur in deeper water, averaging 12.9 m at Punalu’u,
Hawai’i, for example (Rice et al. 2000). Resting and foraging locations are typically located
within two kilometers of each other, as suggested by the short dives that turtles make between
these locations (Balazs et al. 2002). Some adult green turtles swim to the outer ledge of the
180
4150
4155
4160
4165
4170
Hawaiian Island Bank (18-27 m deep) to rest, then return to shallower water to forage (Balazs et
al. 1987). However, as each individual foraging / resting location within the Hawaiian Islands is
different, natural variations exist in feeding and resting behavior at each site (Balazs 1980), and
each must be studied independently.
Despite recent tracking and diving studies, fundamental behavioral data on juvenile green
turtles within their foraging grounds remains scant within the literature. In particular, very little
is known about the habitat needs and movements of juvenile green turtles (e.g., Hart and Fujisaki
2010). While broad-scale surveys or opportunistic observations of behavior can help identify
high-use habitats, rigorous observations are required to investigate the spatial and temporal
variability of potential foraging aggregations (e.g., Mills et al. 2005; Asuncion 2010). Fine-scale
behavioral observations and TDTR studies can help to interpret turtle behavioral within small-
scale foraging habitats (e.g., Hazel et al. 2009, this study). Understanding the habitat
requirements the turtles need to forage, rest, and perform other activities is crucial for their
conservation (Balazs et al. 1987; Seminoff et al. 2002). In particular, management measures to
protect juvenile green turtles are of utmost importance, as turtles can spend 20-50 years within
one foraging habitat while growing to maturity (Makowski et al. 2006).
Studying the movements of the species is critical to best implement any needed
management actions (Blumenthal et al. 2009), especially through an ecological-based approach
that involves an understanding of the species roles in the ecosystem (Wabnitz et al. 2010). Thus,
turtle conservation actions will need to target the specific circumstances of local populations
(Hochscheid et al. 1999). Namely, because Hawaiian green turtles have high site fidelity (Brill
et al. 1995; Keuper-Bennett and Bennett 2002), and many turtle foraging sites, such as KME, are
heavily used by human activities (ecotourism, aquaria collecting, commercial and recreational
181
4175
4180
4185
4190
fishing, recreational boating, surfing), management will entail monitoring site-specific human
impacts. For instance, turtles are susceptible to entanglement in fishing gear and vessel strikes
(Chaloupka et al. 2008, Hazel et al. 2009). This study characterized turtle behavior and activity
patterns within a small-scale heterogeneous study site. This information provides a baseline for
assessing human activities and overlap within this site, and serves as an example to stimulate
additional habitat use studies at other known turtle foraging sites throughout the Hawaiian
Islands.
REFERENCES:
Altmann, J. 1974. Observational study of behavior: sampling methods. Behaviour 49(3): 227-
267.
Arthur, K. 2005. Ecotoxicology of the cyanobacterium Lyngba majuscula and health
implications for green turtles (Chelonia mydas). PhD Thesis, Centre for Marine Studies,
University of Queensland, Brisbane, Australia. 222 pp.
Arthur, K.E., and Balazs, G.H. 2008. A comparison of immature green turtle (Chelonia mydas)
diets among seven sites in the Main Hawaiian Islands. Pacific Science 62(2):205-217.
Asuncion, B. 2010. Characterizing juvenile green sea turtle (Chelonia mydas) habitat use in
Kawai’nui, O’ahu: a multi-disciplinary approach. Master’s thesis, Hawai’i Pacific
University, Kaneohe, HI. 89 pp.
Balazs, G.H. 1980. Synopsis of biological data on the green turtle in the Hawaiian Islands. U.S.
Department of Commerce, NOAATM-NMFS-SWFC-7, Honolulu, HI. 141 pp.
Balazs, G.H. 1995. Innovative techniques to facilitate field studies of the green turtles, Chelonia
mydas. In Richardson, J.I., and Richardson, compilers. Proceedings of the twelfth annual
symposium on sea turtle biology and conservation. NOAA Technical Memorandum
NMFS-SEFSC-361:158-161.
Balazs, G. H. 1996. Behavioral changes within the recovering Hawaiian green turtle population.
In Keinath, J.A., Barnard, D.E., Musick, J.A., and Bell, B.A., compilers. Proceedings of
the fifteenth annual symposium on sea turtle biology and conservation, February 20–25,
1995. NOAA Technical Memorandum NMFS–SEFSC-387:16–21.
Balazs, G.H., and Chaloupka, M. 2004a. Spatial and temporal variability in somatic growth of
182
4195
4200
4205
4210
4215
4220
4225
4230
365
green sea turtles (Chelonia mydas) resident in the Hawaiian Archipelago. Marine Biology
145:1043-1059.
Balazs, G.H., and Chaloupka, M. 2004b. Thirty-year recovery trend in the once depleted
Hawaiian green sea turtle stock. Biological Conservation 117:491-498.
Balazs, G.H., Forsyth, R.G., and Kam, A.K.H. 1987. Preliminary assessment of habitat
utilization by Hawaiian green turtles in their resident foraging pastures. U.S. Dep.
Commer., NOAA Tech. Memo. NOAA-TM-NMFS-SWFC-71, 107 p.
Balazs, G.H., Dudley, W.C., Hallacher, L.E., Coney, J.P., and Koga, S. 1994. Ecology and
cultural significance of sea turtles at Punalu'u, Hawai’i. Proceedings of the Fourteenth
Annual Symposium on Sea Turtle Biology and Conservation. U.S. Dep. Commer., NOAA
Tech. Memo.NMFS-SEFSC-351:10-13.
Balazs, G.H., Miya, R.K., and Beavers, S.C. 1996. Procedures to attach a satellite transmitter to
the carapace of an adult green turtle, Chelonia mydas. Proceedings of the Fifteenth
Annual Symposium on Sea Turtle Biology and Conservation. NOAA Technical
Memorandum NMFS-SEFSC-387, pp. 21-26
Balazs, G.H., Keuper-Bennett, U., Bennett, P., Rice, R.R., and Russell, D.J. 2002. Evidence for
near shore nocturnal foraging by green turtles at Honokawai, Maui, Hawai’i Islands.
Proceedings of the Twenty-Second Annual Symposium on Sea Turtle Biology and
Conservation. NOAA Technical Memorandum NMFS-SEFSC-503, pp. 32-34
Battista, T.A., Costa, B.M., and Anderson, S.M. 2007. Shallow-water benthic habitats of the
main eight Hawaiian Islands (DVD). NOAA Technical Memorandum NOS NCCOS 61,
Biogeography Branch. Silver Spring, MD.
http://ccma.nos.noaa.gov/products/biogeography/Hawaii_cd_07/htm/overview.htm.
Bjorndal, K.A. 1980. Nutrition and grazing behavior of the green turtle Chelonia mydas. Marine
Biology 56:147-154.
Bjorndal, K. A. 1997. Foraging ecology and nutrition of sea turtles. In Lutz, P. L., and Musick,
J.A., editors. The biology of sea turtles. CRC Press, Boca Raton, Florida, USA. Pp 199–
231.
Bjorndal, K.A., and Jackson, J.B.C. 2003. Roles of sea turtles in marine ecosystems:
reconstructing the past. In: Lutz, P.L., Musick, J.A., Wyneken, J. (Eds.),The Biology of
Sea Turtles, vol. II. CRC Press, pp. 259–273.
Blumenthal, J.M., Austin, T.J., Bothwell, J.B., Broderick, A.C., Ebanks-Petrie, G., Olynik, J.R.,
Orr, M.F., Solomon, J.L., Witt, M.J., and Godley, B.J. 2009. Diving behavior and
movements of juvenile hawksbill turtles Eretmochelys imbricata on a Caribbean coral
reef. Coral Reefs 28:55-65.
183
4235
4240
4245
4250
4255
4260
4265
4270
4275
Blumenthal, J.M., Austin, T.J., Bothwell, J.B., Broderick, A.C., Ebanks-Petrie, G., Olynik, J.R.,
Orr, M.F., Solomon, J.L., Witt, M.J., and Godley, B.J. 2010. Life in (and out of) the
lagoon: fine-scale movements of green turtles tracked using time-depth recorders.
Aquatic Biology 9:113-121.
Booth, J., and Peters, J.A. 1972. Behavioural studies on the green turtle (Chelonia mydas) in the
sea. Animal Behaviour 20:808-812.
Brill, R.W., Balazs, G.H., Holland, K.N., Chang, R.K.C., Sullivan, S., and George, J.C. 1995.
Daily movements, habitat use, and submergence intervals of normal and tumor-bearing
juvenile green turtles (Chelonia mydas) within a foraging area in the Hawaiian Islands.
Journal of Experimental Marine Biology and Ecology 185:203-218.
Chaloupka, M., Bjorndal, K.A., Balazs, G.H., Bolten, A.B., Ehrhart, L.M., Limpus, C.J.,
Suganuma, H., Troëng, S., and Manami, Y. 2008. Encouraging outlook for recovery of a
once severely exploited marine megaherbivore. Global Ecology and Biogeography
17:297-304.
Clarke, K. R. 1993. Non-parametric multivariate analyses of changes in community structure.
Australian Journal of Ecology 18:117-143.
Cline, L.D., Short, R.A., and Ward, J.V. 1982. The influence of highway construction on the
macroinvertebrates and epilithic algae of a high mountain stream. Hydrobiologia 96:149-
159.
Daday, A., Platz, R.A., and Smith, G.D. 1977. Anaerobic and aerobic hydrogen gas formation by
the blue-green alga Anabaena cylindrica. Applied and Environmental Microbiology
34(5):478-483.
Davis, E.E., Rice, M.R., Harrington, K.A., and Balazs, G.H. 2000. Green turtle diving and
foraging patterns at Puako, Hawai’i. Proceedings of the Nineteenth Annual Symposium
on Sea Turtle Conservation and Biology. NOAA Technical Memorandum NMFS-SEFSC-
443, pp. 153-154.
Dufrêne, M. and Legendre, P. 1997. Species assemblages and indicator species: the need for a
flexible asymmetrical approach. Ecological Monographs 67(3):345-366.
Frick, J. 1976. Orientation and behaviour of hatchling green turtles (Chelonia mydas) in the sea.
Animal Behaviour 24:849-857.
Glen, F., Broderick, A.C., Godley, B.J., Metcalfe, J.D., and Hays, G.C. 2001. Dive angles for a
green turtle (Chelonia mydas). Journal of the Marine Biological Association of the
United Kingdom 81:683-686.
Godley, B.J., Richardson, S., Broderick, A.C., Coyne, M.S., Glen, F., and Hays, G.C. 2002.
184
4280
4285
4290
4295
4300
4305
4310
4315
4320
370
Long-term satellite telemetry of the movements and habitat utilisation by green turtles in
the Mediterranean. Ecography 25:352-362.
Godley, B.J., Blumenthal, J.M., Broderick, A.C., Coyne, M.S., Godfrey, M.H., Hawkes, L.A.,
and Witt, M.J. 2008. Satellite tracking of sea turtles: Where have we been and where do
we go next? Endangered Species Research 4:3-22.
Grossman, A., Sazima, C., Bellini, C., and Sazima, I. 2006. Cleaning symbioses between
hawksbill turtles and reef fishes at Fernando de Noronha Archipelago, off Northeast
Brazil. Chelonian Conservation and Biology 5(2):284-288.
Hart, K.M., and Fujisaki, I. 2010. Satellite tracking reveals habitat use by juvenile green sea
turtles Chelonia mydas in the Everglades, Florida, USA. Endangered Species Research
11:221-232.
Hatase, H., Sato, K., Yamaguchi, M., Takahashi, K., and Tsukamoto, K. 2006. Individual
variation in feeding habitat use by adult female green turtles (Chelonia mydas): are they
obligately neritic herbivores? Oecologia 149:52-64.
Hays, G.C., Luschi, P., Papi, F., del Seppia, C., and Marsh, R. 1999. Changes in behaviour
during the internesting period and post-nesting migration for Ascension Island green
turtles. Marine Ecology Progress Series 189:263-273.
Hays, G.C., Adams, C.R., Broderick, A.C., Godley, B.J., Lucas, D.J., Metcalfe, J.D., and Prior,
A.A. 2000. The diving behaviour of green turtles at Ascension Island. Animal Behaviour
59:577-586.
Hays, G.C., Åkesson, S., Broderick, A.C, Glen, F., Godley, B.J., Luschi, P., Martin, C.,
Metcalfe, J.D., and Papi, F. 2001. The diving behaviour of green turtles undertaking
oceanic migration to and from Ascension Island: dive durations, dive profiles, and depth
distribution. The Journal of Experimental Biology 204:4093-4098.
Hays, G.C., Broderick, A.C., Glen, F., Godley, B.J., Houghton, J.D.R., and Metcalfe, J.D. 2002.
Water temperature and internesting intervals for loggerhead (Caretta caretta) and green
(Chelonia mydas) sea turtles. Journal of Thermal Biology 27:429-432.
Hays, G.C., Metcalfe, J.D., Walne, A.W., and Wilson, R.P. 2004. First records of flipper beat
frequency during sea turtle diving. Journal of Experimental Marine Biology and Ecology
303:243-260.
Hays, G.C., Marshall, G.J., and Seminoff, J.A. 2007. Flipper beat frequency and amplitude
changes in diving green turtles, Chelonia mydas. Marine Biology 150:1003-1009.
Hazel, J. 2009. Evaluation of fast-acquisition GPS in stationary tests and fine-scale tracking of
green turtles. Journal of Experimental Marine Biology and Ecology 374:58-68.
185
4325
4330
4335
4340
4345
4350
4355
4360
4365
Hazel, J., Lawler, I.R., and Hamann, M. 2009. Diving at the shallow end: Green turtle behaviour
in near-shore foraging habitat. Journal of Experimental Marine Biology and Ecology
371(1):84-92.
Heithaus, M.R., Frid, A., Wirsing, A.J., Dill, L.M, Fourqurean, J.W., Burkholder, D., Thomas, J.,
and Bejdger, L. 2007. State-dependent risk-taking by green sea turtles mediates top-down
effects of tiger shark intimidation in a marine ecosystem. Journal of Animal Ecology
76:837-844.
Hochscheid, S., Godley, B.J., Broderick, A.C., and Wilson, R.P. 1999. Reptilian diving: highly
variable dive patterns in the green turtle Chelonia mydas. Marine Ecology Progress
Series 185:101-112.
Hochscheid, S., Maffucci, F., Bentivegna, F., and Wilson, R.P. 2005. Gulps, wheezes, and sniffs:
how measurement of beak movement in sea turtles can elucidate their behaviour and
ecology. Journal of Experimental Marine Biology and Ecology 316:45-53.
Houghton, J.D.R., Broderick, A.C., Godley, B.J., Metcalfe, J.D., and Hays, G.C. 2002. Diving
behaviour during the internesting interval for loggerhead turtles Caretta caretta nesting
in Cyprus. Marine Ecology Progress Series 227:63-70.
Houghton, J.D.R., Callow, M.J., and Hays, G.C. 2003. Habitat utilization by juvenile hawksbill
turtles (Eretmochelys imbricata, Linneaus, 1766) around a shallow water coral reef.
Journal of Natural History 37:1269-1280.
I-Jiunn, C. 2009. Changes in diving behaviour during the internesting period by green turtles.
Journal of Experimental Marine Biology and Ecology 381:18-24.
Jackson, J.B.C. 2001. What was natural in the coastal oceans? Proceedings of the National
Academy of Sciences of the United States of America 98:5411-5418.
Jackson, J.B.C., Kirby, M.X., Berger, W.H., Bjorndal, K.A., Botsford, L.W., Bourque B.J.,
Bradbury, R.H., Cooke, R., Erlandson, J., Estes, J.A., Hughes, T.P., Kidwell, S., Lange,
C.B., Lenihan, H.S., Pandolfi, J.M., Peterson, C.H., Steneck, R.S., Tegner, M.J., and
Warner, R.R. 2001. Historical overfishing and the recent collapse of coastal ecosystems.
Science 293:629-638.
Keuper-Bennett, U. and Bennett, P.A. 2002. Home sweet home: aspects of green turtle and
hawksbill presence in their feeding, resting and cleaning areas off Honokowai, West
Maui, Hawai’i (1989-1999). Proceedings of the Twentieth Annual Symposium on Sea
Turtle Biology and Conservation. NOAA Technical Memorandum NMFS-SEFSC-477,
pp. 57-59.
Limpus, C.J., Miller, J.D., Paramenter, C.J., Reimer, D., McLachlan, N., and Webb, R. 1992.
Migration of green (Chelonia mydas) and loggerhead (Caretta caretta) turtles to and
from eastern Australian Rookeries. Wildlife Research 19:347–358.
186
4370
4375
4380
4385
4390
4395
4400
4405
4410
Losey, G.S., Balazs, G.H., and Privitera, L.A. 1994. Cleaning symbiosis between the wrasse,
Thalassoma duperry, and the green turtle, Chelonia mydas. Copeia 1994(3):684-690.
Makowski, C., Seminoff, J.A., and Salmon, M. 2006. Home range and habitat use of juvenile
Atlantic green turtles (Chelonia mydas L.) on shallow reef habitats in Palm Beach,
Florida, USA. Marine Biology 148:1167-1179.
McCune, B. and Grace, J.B. 2002. Analysis of Ecological Communities. MjM Software,
Gleneden Beach, Oregon, USA.
Mendonca, M.T. 1983. Movement and feeding ecology of immature green turtles (Chelonia
mydas) in a Florida Lagoon. Copeia 1983:1013-1023.
Mills, D.J., Verdouw G., and Frusher, S.D. 2005. Remote multi-camera system for in situ
observations of behaviour and predator/prey interactions of marine benthic macrofauna.
New Zealand Journal of Marine and Freshwater Research 39:347-352.
Musick, J.A. and Limpus, C.J. 1997. Habitat utilisation and migration in juvenile sea turtles. In
Lutz, P.L. and Musick, J.A. (eds). The biology of sea turtles. CRC Press, Boca Raton, pp.
137–165.
Myers, A.E., Lovell, P., and Hays, G.C. 2006. Tools for studying animal behaviour: validation of
dive profiles relayed via the Argos satellite system. Animal Behaviour 71:989-993.
NOAA CCMA. 2007. Shallow-water benthic habitats of the main Hawaiian Islands.
http://ccma.nos.noaa.gov/products/biogeography/Hawaii_cd_07/htm/data.html
Pandolfi, J.M., Bradbury, R.H., Sala, E., Hughes, T.P., Bjorndal, K.A., Cooke, R.G., McArdle,
D., McClenachan, L., Newman, M.J., Paredes, G., Warner, R.R., and Jackson, J.B. 2003.
Global trajectories of the long-term decline of coral reef ecosystems. Science 301:955-
958.
Papastamatiou, Y.P., Lowe, C.G., Caselle, J.E., and Friedlander, A.M. 2009. Scale-dependent
effects of habitat on movements and path structure of reef sharks at a predator-dominated
atoll. Ecology 90(4):996-1008.
Reed, S.A. 1980. Sampling and transecting techniques on tropical reef substrates. In:
Environmental survey techniques for coastal water assessment. University of Hawai’i Sea
Grant College Program. Sea Grant Cooperative Report UNIHI-SEAGRANT-CR-80-
01:71-89.
Rice, M.R. and Balazs, G.H. 2008. Diving behavior of the Hawaiian green turtle (Chelonia
mydas) during oceanic migrations. Journal of Experimental Marine Biology and Ecology
356:121-127.
187
4415
4420
4425
4430
4435
4440
4445
4450
4455
4460
375
Rice, M.R., Balazs, G.H., Hallacher, L., Dudley, W., Watson, G., Krusell, K., and Larson, B.
2000. Diving, basking, and foraging patterns of a sub-adult green turtle at Punalu’u,
Hawai’i. In Abreu-Grobois, F.A., Briseño-Dueñas, R., Márquez, R., and Sarti, L.,
compilers. Proceedings of the eighteenth international sea turtle symposium. March 3-7,
1998. NOAA Technical Memorandum NMFS-SEFSC-436:229-231.
Rice, M.R., Balazs, G.H., Kopra, D., and Whittow, G.C. 2002. Ecology and behavior of green
turtles basking at Kiholo Bay, Hawai’i. Proceedings of the Twentieth Annual Symposium
on Sea Turtle Biology and Conservation. NOAA Technical Memorandum NMFS-SEFSC-
477, pp. 153-155.
Santelices, B. 1977. Water movement and seasonal algae growth in Hawai’i. Marine Biology
43:225-235.
Sato, K., Matsuzawa, Y., Tanaka, H., Bando, T., Minamikawa, S., Sakamoto, W., and Naito, Y.
1998. Internesting intervals for loggerhead turtles, Caretta caretta, and green turtles,
Chelonia mydas, are affected by temperature. Canadian Journal of Zoology 76:1651-
1662.
Sato, K., Mitani, Y., Cameron, M.F., Siniff, D.B., and Naito, Y. 2003. Factors affecting stroking
patterns and body angle in diving Weddell seals under natural conditions. The Journal of
Experimental Biology 206:1461-1470.
Schofield, G., Katselidis, K.A., Dimopolous, P., Pantis, J.D., and Hays, G.C. 2006. Behaviour
analysis of the loggerhead sea turtle Caretta caretta from direct in-water observation.
Endangered Species Research 2:71-79.
Seminoff, J., Resendiz, A., Smith, T.W., and Yarnell, L. 2001. Diving patterns of green turtles
(Chelonia mydas agassizii) in the Gulf of California. Proceedings of the Twenty-First
Annual Symposium on Sea Turtle Biology and Conservation. NOAA Technical
Memorandum NMFS-SEFSC-528, pp. 321-323.
Seminoff, J.A., Resendiz, A., and Nichols, W.J. 2002. Home range of green turtles Chelonia
mydas at a coastal foraging area in the Gulf of California, Mexico. Marine Ecology
Progress Series 242:253-265.
Seminoff, J.A., Jones, T.T., and Marshall, G.J. 2006. Underwater behaviour of green turtles
monitored with video-time-depth recorders: what’s missing from dive profiles? Marine
Ecology Progress Series 322:269-280.
Senko, J., Koch, V., Megill, W.M., Carthy, R.R., Templeton, R.P., and Nichols, W.J. 2010. Fine
scale daily movements and habitat use of East Pacific green turtles at a shallow coastal
lagoon in Baja California Sur, Mexico. Journal of Experimental Marine Biology and
Ecology 391:92-100.
Southwood, A.L., Reina, R.D., Jones, V.S., and Jones, D.R. 2003a. Seasonal diving patterns and
188
4465
4470
4475
4480
4485
4490
4495
4500
4505
body temperatures of juvenile green turtles at Heron Island, Australia. Canadian Journal
of Zoology 81:1014-1024.
Southwood, A.L., Darveau, C.A., and Jones, D.R. 2003b. Metabolic and cardiovascular
adjustments of juvenile green turtles to seasonal changes in temperature and photoperiod.
The Journal of Experimental Biology 206:4521-4531.
Steneck, R.S. and Dethier, M.N. 1994. A functional group approach to the structure of algal-
dominated communities. Oikos 69:476-498.
Steneck, R.S. and Watling, L. 1982. Feeding capabilities and limitations of herbivorous
mollusks: a functional group approach. Marine Biology 68:299-319.
Taquet, C., Taquet, M., Dempster, T., Soria, M., Ciccione, S., Roos, D., and Dagorn, L. 2006.
Foraging on the green sea turtle Chelonia mydas on seagrass beds at Mayotte Island
(Indian Ocean), determined by acoustic transmitters. Marine Ecology Progress Series
306:295-302.
Wabnitz, C.C.C., Balazs, G., Beavers, S., Bjorndal, K.A., Bolten, A.B., Christensen, V.,
Hargrove, S., Pauly, D. 2010. Ecosystem structure and processes at Kaloko Honokohau,
focusing on the role of herbivores, including the green sea turtle Chelonia mydas, in reef
resilience. Marine Ecology Progress Series 420:27-44.
Witt, M.J., McGowan, A., Blumenthal, J.A., Broderick, A.C., Gore, S., Wheatley, D., White, J.,
and Godley, B.J. 2010. Inferring vertical and horizontal movements of juvenile marine
turtles from time-depth recorders. Aquatic Biology 8:169-177.
Yasuda, T. and Arai, N. 2009. Changes in flipper beat frequency, body angle and swimming
speed of female green turtles Chelonia mydas. Marine Ecology Progress Series 386:275-
286.
189
4510
4515
4520
4525
4530
4535
380
TABLES:
Table 1. Common types of algae found within each functional group at the Kawai’nui Marsh Estuary
study site.
Functional Group Common Examples
Articulated Calcareous Halimeda spp.
Complex Branching Acanthophora spicifera; Turbinaria ornata
Filamentous Cladophora spp.
Foliose Padina sp.; Ulva sp.
Mass Forming Dictyosphaeria cavernosa
Simple Branching Dictyota spp.
Turf Pterocladia spp.
190
4540
4545
4550
4555
4560
4565
4570
4575
Table 2. Definitions of each parameter recorded during behavioral surveys. “IB” = Instantaneous Behaviors, recorded every 15 seconds. “CB” =
Continuous Behaviors, counted continuously throughout each video. “DS” = Turtle depth, water depth, and substrate type, recorded on 15 second
intervals.
Behavioral
Category
Behavior Definition
IB
Foraging
Food Searching Actively moving along bottom substrate, head moving around looking down for food, using flippers to steady self
Foraging Turtle takes a bite of the vegetation on the substrate, or food is in its mouth and the jaw is moving up and down
Resting
On substrate Motionless, no flipper movement while in contact with bottom substrate, turtle's overall position does not change
Assisted Motionless, no flipper movement while in contact with bottom substrate, turtle's overall position does not change, using a
structure to maintain its position
Swimming
Hovering Motionless, or minimal amount of flipper movement while in water column, turtle's position relative to the substrate does
not change
Posing Motionless, or minimal amount of flipper movement while in water column, turtle's position relative to the substrate does
not change; turtle’s flippers and neck are outstretched, likely in vicinity of cleaning station
General Swimming:
Direction
Turtle is actively using its flippers to change its position relative to the substrate. Classified as either movement up (nearer
the surface), down (further from the surface), or horizontal (distance from surface does not change)
Rel. Speed Distance traveled (m) / time (s), in km/hr - calculated by GPS (Garmin)
Breathing Turtle is at surface of water, its head clears water surface, bubbles and expulsion of water may or may not be seen
Flipper “Swipe” Turtle uses its front flipper(s) to deliberately wipe its face, plastron, or carapace
CB
Swimming
Beats/30 s Number of flipper beats per 30 seconds of video footage
Foraging
Bites/15 s Number of bites per 15 seconds of video footage
Breathing The time (s) of the video in which a breathing event begins, when the turtle's head breaks the surface
PC
Turtle Depth Relative depth of turtle from surface (in 0.5 m bins)
Water Depth Relative depth of substrate from surface, at turtle's location (in 0.5 m bins)
Substrate Type Substrate type at turtle's location: rocks, sand, algae, coral, rubble, urchins, and other invertebrates
191
4580
Table 3. Definitions of the 20 behavioral parameters, calculated for each of 277 video behavioral surveys,
used within the non-metric multidimensional scaling analysis (NMDS). To achieve normal distributions,
the proportions (percentages, parameters divided by video length) were arcsine transformed and the
average time between breaths was log transformed.
Behavioral Category Behavioral Parameters
1. Percent of Video Spent
Performing Specific
Behaviors
Foraging
Food Searching
Resting
Hovering
Posing
Swimming
Breathing
Body Swiping
2. Turtle Depth Parameters Average Turtle Depth
Number of Depth Bin Changes / Video Length
3. Flipper Beat Parameters Average Number of Flipper Beats / 30 Seconds
Maximum Number of Flipper Beats / 30 Seconds
Coefficient of Variation of Number of Flipper Beats / 30 Seconds
4. Foraging Bite Parameters Average Number of Bites / 15 Seconds
Maximum Number of Bites / 15 Seconds
Coefficient of Variation of Number of Bites / 15 Seconds
5. Breathing Parameters Number of Breaths / Video Length
Average Time Between Breaths
Table 4. Definitions of the 24 environmental parameters, calculated for each of 277 video behavioral
surveys, used within the non-metric multidimensional scaling analysis (NMDS), broken into 5 categories.
192
4585
4590
4595
4600
4605
4610
385
To achieve normal distributions the proportions (all percentages and cloud cover) were arcsine
transformed, and Julian Day and Video Length were log transformed.
Environmental Category Environmental Parameter
1. General Environmental
Parameters
Julian Day
Tidal Phase
Tidal Height
Lunar Cycle
Cloud Cover
Wind Speed
Wind Direction
Precipitation
2. Percent of Video Spent
Within Specific Habitats
Cove
Rocky Shore
Kailua Bay
Channel
Ledge
Canal
3. Percent of Video Spent
Over Specific Substrates
Rock
Rubble
Algae
Sand
Coral
Bivalves
Urchins
4. Water Depth Parameters Average Water Depth
Coefficient of Variation of Water Depth
5. Video Length Video Length
Table 5. Definition and sample sizes (N) of all groups within three multi-replicate permutation procedures
(MRPPs) testing the effects of site-specific behaviors, month-tide, and habitat on various turtle diving
behavioral variables.
193
4615
4620
4625
4630
MRPP Group No. Group Definition Sample Size (N)
Site-Specific
Behaviors
(Resting,
Foraging / Food
Searching,
Posing)
1 All resting 21
2 Some resting, no foraging / food searching, no posing 20
3 No resting, some foraging / food searching, no posing 94
4 No resting, no foraging / food searching, some posing 22
5 Some resting, some foraging / food searching, no
posing
6
6 No resting, some foraging / food searching, some
posing
11
7 No resting, no foraging / food searching, no posing 103
Month-Tide 1 March 18 - April 16, 2010; Low Tide 12
2 March 18 - April 16, 2010; Rising Tide 12
3 March 18 - April 16, 2010; Falling Tide 14
4 March 18 - April 16, 2010; High Tide 12
5 April 17 - May 15, 2010; Low Tide 8
6 April 17 - May 15, 2010; Rising Tide 13
7 April 17 - May 15, 2010; Falling Tide 10
8 April 17 - May 15, 2010; High Tide 13
9 May 16 - June 14, 2010; Low Tide 10
10 May 16 - June 14, 2010; Rising Tide 11
11 May 16 - June 14, 2010; Falling Tide 11
12 May 16 - June 14, 2010; High Tide 12
13 June 15 - July 13, 2010; Low Tide 12
14 June 15 - July 13, 2010; Rising Tide 13
15 June 15 - July 13, 2010; Falling Tide 9
16 June 15 - July 13, 2010; High Tide 11
17 July 14 - August 11, 2010; Low Tide 12
18 July 14 - August 11, 2010; Rising Tide 13
19 July 14 - August 11, 2010; Falling Tide 11
20 July 14 - August 11, 2010; High Tide 12
21 August 12 - September 10, 2010; Low Tide 10
22 August 12 - September 10, 2010; Rising Tide 12
23 August 12 - September 10, 2010; Falling Tide 12
24 August 12 - September 10, 2010; High Tide 12
Habitat 1 Primarily in cove habitat 45
2 Primarily in channel / ledge habitat 111
3 Primarily in Kailua Bay habitat 102
4 Primarily in rocky shore habitat 16
Table 6. Results of a multivariate ANOVA of salinity at five locations throughout the KME study site
(canal bend, boat mooring, cove, cleaning station, and Kailua Bay). Samples were collected at the surface
and at depth of each location, sampling each tidal phase (low, rising, falling, high) across two lunar cycles
194
390
(September-October, 2010). Interactions of these three categorical variables were considered and time
trends were tested using the co-variate “day”. Significant results (p < 0.05) are bolded.
Source Sum-of-Squares df Mean-Square F-ratio p
Habitat 8.64 4 2.16 6.93 < 0.001
Depth 3.07 1 3.07 9.84 0.003
Tide 4.77 3 1.59 5.10 0.005
Habitat*Depth 5.86 4 1.46 4.70 0.003
Habitat*Tide 2.07 12 0.17 0.55 0.870
Depth*Tide 1.33 3 0.44 1.42 0.250
Habitat*Depth*Tide 1.83 12 0.15 0.49 0.910
Day 24.12 1 24.12 77.37 < 0.001
Error 12.16 39 0.31 - -
Table 7. Results of a principal component analysis (PCA) of water temperature variability sampled every
30 minutes from March 14 - October 2, 2010 at three water temperature stations (boat mooring, canal
bend, and offshore locations), including the eigenvalues of the first three principal components (PC), the
amount of explained variance, and results of randomization tests (p-values) for the first three PCs. p-
value = (n + 1) / (N + 1), where n is the number of randomizations with an eigenvalue for that axis that is
> than the observed eigenvalue for that axis, and N is the total number of randomizations (N = 1000).
Significant results (p < 0.05) are bolded.
PC
(Axis)
Eigenvalue % of
Variance
Cum.% of
Var.
Broken-stick
Eigenvalue
p-value
1 40783.72 94.45 94.45 26389.15 0.001
2 1523.04 3.53 97.97 11995.07 1.000
3 875.50 2.02 100.00 4798.03 1.000
Table 8. Scaled PCA eigenvector loading values of the three sampling stations . First three principal
components (PC) are shown for water temperature values measured every 30 minutes from March 14 –
October 2, 2010.
Species Eigenvector Loading Values
PC 1 PC 2 PC 3
Boat Mooring -0.59 +0.57 +0.57
Canal Bend -0.58 -0.79 +0.17
Offshore -0.55 +0.23 -0.80
Table 9. Pearson (r) correlations with three PCA ordination axes of water temperature measured every 30
minutes from March 14 – October 2, 2010 in three locations: boat mooring, canal bend, and offshore.
Parameter PC 1 PC 2 PC 3
r r2
r r2
r r2
195
4635
4640
4645
4650
4655
4660
Date -0.78 0.61 0.04 0.00 -0.34 0.12
Time of Day -0.23 0.05 0.14 0.02 0.18 0.03
Boat Mooring -0.97 0.95 0.18 0.03 0.14 0.02
Canal Bend -0.97 0.94 -0.25 0.06 0.04 0.00
Offshore -0.98 0.95 0.08 0.01 -0.21 0.04
Table 10. Pearson Correlation Coefficient (and p-value) for each of the seven algal functional groups,
correlating the algal percent cover (per quadrat) to the algal percent biomass (per quadrat). Also listed are
the percent of quadrats in which both biomass and cover were present. As articulated calcareous and
foliose algae were never recorded for percent cover, no statistical analysis could be done for these two
algal functional groups. Significant results (p < 0.05) are bolded.
Algal Functional
Group
Pearson Correlation
Coefficient
p-value Percent Quadrats
Biomass Present
Percent Quadrats
Cover Present
Articulated Calcareous N/A N/A 5.56 0.00
Complex Branching 0.60 0.008 94.44 88.89
Filamentous 0.27 0.277 38.89 5.56
Foliose N/A N/A 11.11 0.00
Mass Forming 0.77 < 0.001 88.89 55.56
Simple Branching 0.96 < 0.001 50.00 33.33
Turf 0.70 0.001 100.00 100.00
Table 11. Biomass of each functional group (g/m2
± SD) for each time period and habitat. Subscripts
refer to the results of the post-hoc Tukey Test performed to determine pair-wise differences. Same
subscripts indicate that algal functional groups are not different. X= functional group excluded from the
statistical analysis due to small sample size causing a non-normal distribution.
Time Period Early June Late July Early September
Habitat Cove Rocky Shore Cove Rocky Shore Cove Rocky Shore
Algal Functional Group
Articulated Calcareousx 0.00 ± 0.00 2.29 ± 3.97 0.00 ± 0.00 0.00 ± 0.00 0.00 ± 0.00 0.00 ± 0.00
Complex Branchinga 26.25 ± 16.78 25.42 ± 13.20 24.17 ± 27.78 3.13 ± 3.90 60.00 ± 55.06 19.17 ± 4.02
Filamentousb 13.13 ± 11.58 0.00 ± 0.00 0.00 ± 0.00 3.96 ± 3.55 2.71 ± 3.66 0.00 ± 0.00
Foliosex 0.21 ± 0.36 0.00 ± 0.00 0.63 ± 1.08 0.00 ± 0.00 0.00 ± 0.00 0.00 ± 0.00
Mass Forminga,b 9.80 ± 8.63 12.92 ± 3.61 9.17 ± 4.52 9.38 ± 6.96 6.25 ± 10.29 5.83 ± 4.52
Simple Branchingb 0.21 ± 0.36 2.08 ± 2.60 0.00 ± 0.00 6.04 ± 8.89 0.21 ± 0.36 31.67 ± 21.67
Turfc 169.59 ± 137.50 35.00 ± 28.03 250.83 ± 211.83 539.17 ± 846.40 238.96 ± 245.48 17.29 ± 15.89
Table 12. Results of a multivariate ANOVA of biomass (log(biomass + 1)) of five algal functional group
biomass (complex branching, filamentous, mass forming, simple branching, and turf algae). Foliose and
articulated calcareous functional groups are not included as these two groups were not collected in all
three time periods (early June, late July, and early September). Significant results (p < 0.05) are bolded.
Source Sum-of-Squares df Mean-Square F-ratio p-value
Time 0.00 2.00 0.00 0.01 0.99
196
4665
4670
4675
4680
Location 0.18 1.00 0.18 1.59 0.21
Group 11.63 4.00 2.91 26.44 <0.01
Time*Location 0.05 2.00 0.02 0.21 0.81
Time*Group 2.02 8.00 0.25 2.30 0.03
Location*Group 1.69 4.00 0.42 3.83 0.01
Time*Location*Group 1.00 8.00 0.12 1.13 0.36
Error 6.60 60.00 0.11 - -
Table 13. Pearson (r) Correlations for various video behavioral survey and time-depth-temperature
recorder (TDTR) parameters, covering all times when data were collected concurrently with both
methodologies (N = 801 data points, on 15-second intervals, or 26 videos). All correlations are
significant (p < 0.05).
Video / TDTR Parameter Sample Size (N) Pearson Correlation (r) p-value
Instantaneous Turtle Depth 801 0.61 p < 0.01
Average Turtle Depth 26 0.81 p < 0.01
Maximum Turtle Depth 26 0.51 p < 0.01
Coefficient of Variation of Turtle Depth 26 0.66 p < 0.01
Vertical Turtle Depth Displacement 26 0.71 p < 0.01
Table 14. Non-parametric Kendall rank correlations (tau) of 22 quantitative environmental behavioral
variables with axis 1 of the NMDS. Bolded values indicate significant correlations (p < 0.05). Tidal
phase and wind direction were not included because they are categorical variables.
Environmental Behavioral Variables Axis 1
tau p
Julian Day +0.04 p > 0.1
Tidal Height +0.05 p > 0.1
197
4685
4690
4695
4700
4705
4710
395
Lunar Cycle +0.04 p > 0.1
Cloud Cover -0.02 p > 0.1
Wind Speed -0.08 0.05 < p < 0.1
Precipitation +0.06 p > 0.1
Cove Habitat +0.15 p < 0.001
Rocky Shore Habitat -0.08 0.05 < p < 0.1
Kailua Bay Habitat +0.08 0.05 < p < 0.1
Channel Habitat -0.14 p < 0.001
Ledge Habitat -0.12 0.002 < p < 0.005
Canal Habitat -0.11 0.005 < p < 0.01
Rocky Substrate +0.00 p > 0.1
Rubble Substrate +0.19 p < 0.001
Algae Substrate +0.18 p < 0.001
Sandy Substrate -0.02 p > 0.1
Coral Substrate +0.09 0.02 < p < 0.05
Bivalve Substrate +0.02 p > 0.1
Urchin Substrate +0.10 0.01 < p < 0.02
Average Water Depth -0.12 0.002 < p < 0.005
Coefficient of Variation of Water Depth -0.07 0.05 < p < 0.1
Video Length +0.33 p < 0.001
Table 15. Summary statistics for the multi-replicate permutation procedure (MRPP; relative Sorensen
distance), using resting, foraging / food searching, and posing behaviors as the grouping variable, with the
null hypothesis that there will be no differences when grouping turtle behavior by amount of resting.
Group 1 = all resting; Group 2 = some resting, foraging / food searching, no posing; Group 3 = no resting,
some foraging / food searching, no posing; Group 4 = no resting, no foraging / food searching, some
posing; Group 5 = some resting, some foraging / food searching, no posing; Group 6 = no resting, some
foraging / food searching, some posing; Group 7 = no resting, no foraging / food searching, no posing.
As there were no videos with 1) all foraging / food searching, 2) all posing, 3) some resting, no foraging /
food searching, some posing, and 4) some resting, some foraging / food searching, some posing, these
198
4715
4720
4725
4730
4735
four groups were not included in the analysis. The Test Statistic, T, measures effect size, the A Statistic
measures within-group agreement, and the p-value determines the probability of a δ as small or smaller
than the observed δ. The observed δ (0.26) is significantly different from the expected δ under the null
hypothesis (0.50) (T = -89.88, A = 0.47, p < 0.01). Only significant group pair-wise comparisons (p <
0.05) are shown.
Group Pair-wise
Comparisons
T p A
7 vs. 6 -107.91 0.00 0.36
7 vs. 1 -66.44 0.00 0.34
7 vs. 2 -16.43 0.00 0.07
7 vs. 4 -23.27 0.00 0.11
7 vs. 5 -12.77 0.00 0.05
7 vs. 3 -13.53 0.00 0.07
6 vs. 1 -63.93 0.00 0.38
6 vs. 2 -32.72 0.00 0.17
6 vs. 5 -35.83 0.00 0.19
1 vs. 2 -25.37 0.00 0.51
1 vs. 4 -19.40 0.00 0.43
1 vs. 5 -26.95 0.00 0.52
1 vs. 3 -13.52 0.00 0.31
2 vs. 4 -12.37 0.00 0.24
2 vs. 5 -2.50 0.03 0.02
2 vs. 3 -9.47 0.00 0.19
4 vs. 5 -13.40 0.00 0.22
5 vs. 3 -11.24 0.00 0.19
Table 16. Summary statistics (Monte Carlo test of significance of the observed maximum indicator value,
IV, based on 4999 randomizations) of the Indicator Species Analysis, using resting, foraging / food
searching, and posing behaviors as the grouping variable. Means and standard deviations of the IV from
the randomizations are reported along with p-values for the null hypothesis of no difference between
resting groups, where p = (1 + number of runs > observed IV) / (1 + number of randomized runs). Max
Group refers to the defined resting group with the maximum observed IV. Significant results (IV > 25.00,
p < 0.05) are bolded.
Species Max Observed Indicator IV from randomized groups
199
4740
4745
4750
4755
4760
400
Group Value (IV) Mean S. Dev. p
1) % Foraging 3 37.00 11.60 4.50 0.00
2) % Food Searching 3 56.00 12.30 4.44 0.00
3) % Resting 1 74.60 8.50 4.45 0.00
4) % Hovering 3 22.80 16.50 3.36 0.05
5) % Posing 4 71.30 7.60 4.45 0.00
6) % Swimming 7 28.60 16.80 1.73 0.00
7) % Breathing 6 13.40 12.70 3.85 0.32
8) % Body Swiping 4 6.30 6.50 4.28 0.35
9) Avg Turtle Depth 1 23.40 16.60 1.19 0.00
10) CV Turtle Depth 5 20.40 16.20 1.50 0.01
11) Max Turtle Depth 5 17.40 16.10 0.89 0.09
12) # Depth Bin Changes / Video Length 5 21.90 16.70 1.89 0.02
13) Avg Flipper Beats / 30 Sec 7 22.90 16.20 1.19 0.00
14) Max Flipper Beats / 30 Sec 7 18.70 15.80 0.93 0.01
15) CV Flipper Beats / 30 Sec 2 28.40 18.80 2.87 0.01
16) Avg # Bites / 15 Sec 3 52.20 13.20 4.66 0.00
17) Max # Bites / 15 Sec 5 31.70 12.30 3.98 0.00
18) CV # Bites / 15 Sec 5 36.20 12.40 3.99 0.00
19) # Breaths / Video Length 6 21.50 16.60 2.51 0.05
20) Avg Time Between Breaths 6 18.20 15.06 1.76 0.08
Table 17. Summary statistics for the multi-replicate permutation procedure (MRPP; Relative Sorensen
distance), using a combination of Month and Tide as the grouping variable, with the null hypothesis that
there will be no differences when grouping turtle behavior by Month and Tide. Group 1 = March 18-
April 16, 2010 (Month 1), Low Tide; Group 2 = Month 1, Rising Tide; Group 3 = Month 1, Falling Tide,
Group 4 = Month 1, High Tide; Group 5 = April 17-May15, 2010 (Month 2), Low Tide; Group 6 =
Month 2, Rising Tide; Group 7 = Month 2, Falling Tide; Group 8 = Month 2, High Tide; Group 9 = May
16-June 14, 2010 (Month 3), Low Tide; Group 10 = Month 3, Rising Tide; Group 11 = Month 3, Falling
Tide; Group 12 = Month 3, High Tide; Group 13 = June 15-July 13, 2010 (Month 4), Low Tide; Group 14
= Month 4, Rising Tide; Group 15 = Month 4, Falling Tide; Group 16 = Month 4, High Tide; Group 17 =
July 14-August 11, 2010 (Month 5); Low Tide; Group 18 = Month 5, Rising Tide; Group 19 = Month 5,
Falling Tide; Group 20 = Month 5, High Tide; Group 21 = August 12-September 10, 2010 (Month 6),
Low Tide; Group 22 = Month 6, Rising Tide; Group 23 = Month 6, Falling Tide; Group 24 = Month 6,
200
4765
4770
4775
4780
4785
High Tide. The Test Statistic, T, measures effect size, the A Statistic measures within-group agreement,
and the p-value determines the probability of a δ as small or smaller than the observed δ. The observed δ
(0.49) is not significantly different from the expected δ under the null hypothesis (0.50) (T = -1.15, A =
0.01, p = 0.13). Only significant group pair-wise comparisons (p < 0.05) are shown, although they are
only significant by chance.
Group Pair-wise
Comparisons
T p A
2 vs. 13 -3.05 0.02 0.08
1 vs. 13 -3.77 0.01 0.10
1 vs. 17 -2.74 0.02 0.06
1 vs. 21 -2.17 0.04 0.05
3 vs. 10 -2.70 0.02 0.05
4 vs. 8 -2.06 0.04 0.05
4 vs. 13 -3.22 0.01 0.08
8 vs. 9 -3.81 0.01 0.11
8 vs. 10 -4.43 0.00 0.11
8 vs. 18 -2.35 0.03 0.06
9 vs. 13 -3.86 0.01 0.12
9 vs. 20 -2.07 0.04 0.05
9 vs. 24 -2.48 0.03 0.06
12 vs. 10 -2.26 0.03 0.05
11 vs. 13 -2.20 0.04 0.06
10 vs. 13 -4.77 0.00 0.13
10 vs. 19 -2.04 0.04 0.05
10 vs. 20 -2.34 0.03 0.05
10 vs. 24 -3.74 0.01 0.08
13 vs. 16 -2.14 0.04 0.06
13 vs. 20 -2.49 0.03 0.06
13 vs. 18 -4.36 0.00 0.10
13 vs. 22 -2.15 0.04 0.05
Table 18. Summary statistics for the multi-replicate permutation procedure (MRPP; Relative Sorensen
distance), using Habitat as the grouping variable, with the null hypothesis that there will be no differences
when grouping turtle behavior by Habitat. Group 1 = primarily in cove habitat; Group 2 = primarily in
channel / ledge habitat; Group 3 = primarily in Kailua Bay habitat; Group 4 = primarily in rocky shore
habitat. As there were no videos spent primarily within the canal habitat, and only one incidence each of
1) being primarily in both cove and Kailua Bay habitats, 2) being primarily in both channel / ledge and
rocky shore habitats, and 3) being primarily in both channel / ledge and Kailua Bay habitats, these
groupings were not included in the analysis. The Test Statistic, T, measures effect size, the A Statistic
measures within-group agreement, and the p-value determines the probability of a δ as small or smaller
than the observed δ. The observed δ (0.47) is significantly different from the expected δ under the null
hypothesis (0.50) (T = -18.71, A = 0.07, p < 0.01). Only significant group pair-wise comparisons (p <
0.05) are shown.
201
4790
4795
4800
4805
Group Pair-wise
Comparisons
T p A
2 vs. 1 -19.04 0.00 0.07
2 vs. 3 -17.67 0.00 0.05
2 vs. 4 -5.32 0.00 0.03
1 vs. 3 -6.77 0.00 0.03
1 vs. 4 -3.75 0.01 0.04
Table 19. Summary statistics (Monte Carlo test of significance of the observed maximum indicator value,
IV, based on 4999 randomizations) of the Indicator Species Analysis, using Habitat as the grouping
variable. Means and standard deviations of the IV from the randomizations are reported along with p-
values for the null hypothesis of no difference between resting groups, where p = (1 + number of runs >
observed IV) / (1 + number of randomized runs). Max Group refers to the defined resting group with the
maximum observed IV. Significant results (IV > 25.00, p < 0.05) are bolded.
Species Max
Group
Observed Indicator
Value (IV)
IV from randomized groups
Mean S. Dev. p
1) % Foraging 1 38.90 13.20 3.46 0.00
2) % Food Searching 1 28.40 14.40 3.51 0.01
3) % Resting 2 34.40 8.50 3.07 0.00
202
4810
4815
4820
4825
4830
4835
4840
405
4) % Hovering 3 25.40 23.10 3.19 0.18
5) % Posing 2 14.90 6.90 3.11 0.03
6) % Swimming 4 32.70 25.80 1.84 0.00
7) % Breathing 1 23.50 15.80 3.24 0.03
8) % Body Swiping 3 4.00 5.40 2.58 0.70
9) Avg Turtle Depth 2 35.80 26.90 1.16 0.00
10) CV Turtle Depth 4 29.50 25.10 1.69 0.02
11) Max Turtle Depth 2 32.80 26.60 0.94 0.00
12) # Depth Bin Changes / Video Length 4 29.40 25.50 1.95 0.04
13) Avg Flipper Beats / 30 Sec 4 30.30 25.70 1.45 0.00
14) Max Flipper Beats / 30 Sec 4 27.60 25.40 1.29 0.07
15) CV Flipper Beats / 30 Sec 1 31.70 27.60 2.70 0.08
16) Avg # Bites / 15 Sec 1 43.00 15.50 3.66 0.00
17) Max # Bites / 15 Sec 1 34.20 15.00 3.30 0.00
18) CV # Bites / 15 Sec 1 21.00 15.10 3.30 0.06
19) # Breaths / Video Length 1 39.50 24.30 2.50 0.00
20) Avg Time Between Breaths 4 30.50 23.50 2.02 0.01
FIGURES:
203
4845
4850
4855
Figure 1. A) The main Hawaiian Islands. B) Kailua Bay on the windward
side of the island of O’ahu. C) The Kawai’nui Marsh Estuary study site.
204
4860
410
Figure 2. The five primary habitats of interest at the Kawai’nui Marsh Estuary study site. Video
behavioral surveys occurred in the cove, channel, and Kailua Bay habitats, with randomized
starting positions within each habitat, labeled A,B, and C.
205
4865
Figure 3. Sampling locations within the Kawai’nui Marsh Estuary study site: salinity water
samples (yellow pentagons), and temperature loggers (white circles = used in analysis, red
circles = not used in analysis due to missing data).
206
4870
Figure 4. Location of 18 algal biomass and percent cover sampling points within the rocky shore
and cove habitats at the Kawai’nui Marsh Estuary site. Each habitat was sampled three times
every 1.5 months from early June to early September, as shown by the dates.
207
4875
415
Figure 5. Distribution of 7480 GPS points recorded every 15 seconds during 251 individual turtle
behavior videos at the Kawai’nui Marsh Estuary study site, collected from March 23 through
September 5, 2010.
208
4880
Figure 6. A) Water temperature (°C) at three stations within the Kawai’nui Marsh estuary site
(boat mooring, canal bend, and offshore). B) The first three principal component (PC) values of
the principal component analysis (PCA) showing the relationship of water temperature amongst
three stations (boat mooring, canal bend, and offshore) within the Kawai’nui Marsh Estuary
study site. Water was sampled every 30 minutes from March 14 – October 2, 2010.
209
4885
4890
420
Figure 7. Results of a Principal Component Analysis (PCA) which compares water temperature
at three locations (boat mooring, canal bend, and offshore) in the Kawai’nui Marsh Estuary study
site. One principal component (PC) solution; PC 1 r2
= 0.945, p < 0.05. PC 2 is shown as well to
show a slight bit more variation (PC 2 r2
= 0.035), but PC 2 is not significant (p > 0.05). Water
temperature was recorded every 30 minutes from March 14 – October 2, 2010 at each station.
Black points represent each water temperature sample throughout the study period, while red
vectors represent the three species, or stations, and their relationship to the water samples along
the first two principal components.
210
4895
4900
Figure 8. Fourier (spectral) analysis showing patterns of water temperature change as a function
of number of days, as indicated by the first principal component (PC) of the principal component
analysis (PCA) which explains 98.5% of the variation in water temperature amongst the three
sampled locations (boat mooring, canal bend, offshore) within the Kawai’nui Marsh Estuary
study site.
211
4905
4910
Figure 9. Comparison of percent biomass vs. percent cover for seven algal functional groups:
A) complex branching, B) mass forming, C) filamentous, D) simple branching, and E) turf
algae. The data points on each graph represent the 18 quadrats sampled in the study, coded by
habitat: “C” refers to the cove, and “R” refers to the rocky shore. Numbers 1-3 refer to early
June sampling, numbers 4-6 refer to late July sampling, and number 7-9 refer to early September
sampling. Because the articulated calcareous and foliose functional groups were not recorded in
the percent cover survey, statistical analyses were not possible for thesefunctional groups.
212
4915
4920
425
Figure 10. Biomass of each functional group (mean ± SD) for each time period and habitat: A)
complex branching, B) mass forming, C) filamentous, D) simple branching, and E) turf. Each
value is an average of the functional group biomass collected from three quadrats sampled at
each location during each time period. White bars represent the cove habitat, while grey bars
represent the rocky shore habitat.
213
4925
4930
Figure 11. Distribution of six behaviors mapped at 7,480 GPS points recorded every 15 seconds
during 251 individual turtle behavior videos at the KME study site: A) Resting (n = 672); B)
Foraging (n = 1000); C) Breathing (n = 176); D) Posing (n = 228); E) Swimming (n = 4334); F)
Hovering (n = 1034).
214
4935
4940
430
Figure 12. Kernel densities (100%, 99%, 95%, and 50%) of six behaviors mapped at 7,480 GPS
points recorded every 15 seconds during 251 individual turtle behavior videos at the KME study
site: A) Resting (n = 672); B) Foraging (n = 1000); C) Breathing (n = 176); D) Posing (n = 228);
E) Swimming (n = 4334); F) Hovering (n = 1034).
215
4945
4950
Figure 13. The relationships of 8 behavioral states (solid black points; A), 20 behavioral
variables (solid grey points; B), and 277 video samples (hollow points; C) filmed at the KME
study site (non-metric multidimensional scaling analysis; NMDS, stress = 8.857). One-
dimensional solution: Axis 1 r2
= 0.797, p = 0.001.
216
4955
Figure 14. Kendall rank correlations of 22 environmental variables with axis 1 of the NMDS.
All parameters extending beyond vertical dashed lines (tau = ± 0.079, p < 0.05) are significantly
correlated with the axis1 of the NMDS.
217
4960
435
Figure 15. Pair-wise group comparisons for the MRPP, testing the null hypothesis of no
differences when grouping turtle behavior by the amount of resting, foraging / food searching,
and posing into seven groups: Group 1 = all resting; Group 2 = some resting, foraging / food
searching, no posing; Group 3 = no resting, some foraging / food searching, no posing; Group 4
= no resting, no foraging / food searching, some posing; Group 5 = some resting, some foraging /
food searching, no posing; Group 6 = no resting, some foraging / food searching, some posing;
Group 7 = no resting, no foraging / food searching, no posing. Bolded lines represent groups
which are significantly different from one another (p < 0.05), and dashed lines represent groups
which are not significantly different from one another (p > 0.05).
218
4965
4970
4975
Figure 16. Pair-wise comparisons for the MRPP testing the null hypothesis of no differences
when grouping turtle behavior by Habitat: Group 1 = primarily in cove habitat; Group 2 =
primarily in channel / ledge habitat; Group 3 = primarily in Kailua Bay habitat; Group 4=
primarily in rocky shore habitat. Bolded lines represent groups with are significantly different
from one another (p < 0.05), and dashed lines represent groups which are not significantly
different from one another (p > 0.05).
CHAPTER 4: Conclusions
219
4980
4985
4990
4995
5000
440
As the population of Hawaiian green turtles (Chelonia mydas) continues to rise and they
near pre-exploitation level carrying capacity (Chaloupka and Balazs 2007), their direct and
indirect ecological services as a macroherbivore is becoming ever more important. Hawaiian
green turtles are endemic and genotypically different from other stocks and are thus managed
regionally (Chaloupka et al. 2008a; Wallace et al. 2010). These turtles reside in many coral reefs
and coastal foraging grounds throughout the 132 Hawaiian Islands, primarily consume algae and
seagrass, and spend most of their time in the shallows where their food is present (Brill et al.
1995;Balazs and Chaloupka 2004; Arthur and Balazs 2008). Sea turtles are critically important
to the structure and function of ecosystems, by helping to maintain the balance between algae
and coral cover (Jackson et al. 2001). Studying the movements and behaviors of sea turtles is
critical in understanding their conservation needs, including their feeding ecology, habitat use
and potential human threats (Seminoff et al. 2002; Hazel et al. 2009; Wallace et al. 2010).
The worldwide population of green turtles is considered “endangered” under the
Endangered Species Act (ESA; NMFS and USFWS 1998). Although listed as “threatened” in
the Hawaiian islands, the endemic green turtle population has been growing at 5.7% per year
(Balazs and Chaloupka 2004; Chaloupka et al. 2008a). As their numbers continue to rise,
Bayesian state-space surplus-production models show that coastal populations have reached
approximately 83% of pre-exploitation carrying capacity, based on commercial landings and
nester abundance (Chaloupka and Balazs 2007). Evidence of this approach to carrying capacity
comes from both foraging and breeding sites. At Kaloko-Honokohau, Hawai’i, resident green
turtle populations are believed to have already reached 100% carrying capacity, on the basis of
biomass and consumption rate estimates from the Ecopath and Ecosim software. At the site,
urchins consume the same algal material as the turtles, limiting the algal biomass, and therefore
220
5005
5010
5015
5020
5025
limiting the turtle population (Wabnitz et al. 2010). Additionally, 200-700 female green turtles
are known to nest annually at the French Frigate Shoals, where 90% of the population nests
(Balazs et al. 1992), suggesting that the Hawaiian green turtle population may potentially be
large enough to remain stable into the foreseeable future (NMFS and USFWS 1998). Due to the
stabilization of the species, a discussion has begun for the potential delisting from the ESA and
even for the potential initiation of harvesting on a limited basis. Bayesian state-space surplus-
production models show that the harvest of 2.5 tonnes (approximately 50 immature turtles) per
year would still produce a rising population, as there are currently about this number of turtles
that are taken incidentally in shore-based fisheries each year (Chaloupka and Balazs 2007). As
their numbers continue to rise, the turtles are expected to become ever more important in limiting
the spread of invasive algae, and maintaining the health and resilience of seagrass and coral reef
ecosystems in the Hawaiian Islands (Jackson et al. 2001).
Despite increasing numbers, concerns have been raised about the ability of the green sea
turtle population to cope with anthropogenic disturbances and habitat degradation, as well as
global climate change impacts on nesting beaches and at-sea (Bjorndal and Jackson 2003,
Chaloupka et al. 2008a). Thus, understanding turtle population dynamics is critical for their
management, since fluctuations in their numbers can lead to cascading changes in the ecosystem
(Pandolfi et al. 2003), due to the key ecological roles this species plays as a grazer, engineer of
the benthic substrate, and nutrient transporter (Bjorndal and Jackson 2003). Therefore,
understanding the roles and services this species plays in the marine ecosystem is another critical
component, which will require population estimates and detailed studies of their seasonal and
habitat-specific distributions and activity patterns. The behavioral research presented herein
provides a model for juvenile green turtle activity and horizontal distributions at a critical
221
5030
5035
5040
5045
5050
foraging / resting location which will provide managers with the information they need to make
educated decisions regarding any conservation implementations.
Methodology: Expanding Beyond Personal Observation to Avoid Time-Depth Recorder (TDR)
Data-Based Biases
As described in the second chapter of this thesis, augmenting time-depth recorder (TDR)
data with personal observation ground-truths the inferences researchers make from electronic
tags regarding behavior. If personal observation is not possible, there are a number of other
techniques which could be employed to minimize the biases of inferring behavior from TDR data
alone. For instance, besides classifying diving data by dive “shape,” dives can be classified by
maximum depth, dive duration, descent rate, ascent rate, or bottom time. Or, rather than looking
at the shape of each individual dive, it may be easier to cluster the dives based on their shape
classification, or use other statistical techniques, as was done in the second and third chapters of
this thesis. Another option would be to implement a dimensionless index of dive shape (Time
Allocation at Depth Index, TAD), which is independent of depth and time, but depicts the depth
range at which the diver has concentrated its activity, or to use an algorithm to pick out and
analyze the points at which dive angle changes most drastically (Fedak et al. 2001).
It may also be possible to integrate TDR datasets with bathymetric data to determine the
locations in which dives have occurred. Blumenthal et al. (2010) inferred the location of dives
by comparing dive and substrate depths, and confirmed these inferences with ultrasonic tracking
and direct observation of the turtles. However, this technique still requires behavioral inferences,
since a turtle’s depth will only relate to the water depth in those instances of benthic feeding.
Therefore, other techniques would be advised.
222
5055
5060
5065
5070
445
Another method of determining a turtle’s location while diving relies on GPS
(Geographic Positioning System) technology (e.g., Senko et al. 2010), which is much more
accurate than satellite-linked telemetry and can upload data at a much quicker rate. Thus, the
new Fast-lock FGPS technology allows the fine-scale (resolution of a few meters) tracking of
marine animals, like green turtles, which surface briefly. Furthermore, unlike acoustic tracking,
FGPS has several logistical advantages: it does not require a boat for tracking, and is not
impacted by weather and wave conditions (Hazel 2009). Yet, FGPS tags either require data
delivery through cell-phone systems (needing larger batteries and an antenna) or rely on the
recapture of the tagged turtle (when using archival tags that store the data for manual download).
Many studies combine the use of multiple devices to obtain a better picture of turtle
diving behavior. The combination of TDRs alongside underwater hydrophones facilitates the
analysis of horizontal and vertical movements (location), allowing the discrimination between
resting and foraging behavior (Seminoff et al. 2002; Makowski et al. 2006; Blumenthal et al.
2009). The use of passive telemetry, such as acoustic monitoring, can determine rhythms of
activity, such as switching between traveling, resting, and foraging behaviors (Brill et al. 1995;
Taquet et al. 2006; Asuncion 2010). Yet, manual tracking with sonic tracking devices is labor
intensive (Seminoff et al. 2002), and requires great financial investment (Witt et al. 2010).
Therefore, some studies place acoustic receivers at specific locations within a site (e.g.,
Blumenthal et al. 2009) which may decrease labor and costs.
In addition to location, electronic devices can also collect ancillary data to interpret the
TDR dive data. For example, visual imaging systems, activity / swim speed sensors, and
instruments that quantify jaw movement can reveal if specific activities are occurring (Hays et al.
2004). A critical parameter for understanding turtle diving behavior is the quantification of
223
5075
5080
5085
5090
5095
flipper beat rate. A very small number of studies have explored this behavior using several
instruments (Hays et al. 2007). Crittercams, if positioned properly, may be able to record the
number of flipper beats a turtle takes on a specific dive or during a given time interval.
Additionally, a movement sensor can be used to count the number of flipper beats using
acceleration data. Hays et al. (2004) deployed a movement sensor in conjunction with a TDR on
one green turtle and was able to determine active vs. inactive dives.
In principle, the more data types an electronic device collects, the higher the ability to
infer turtle behavior. Newer data loggers have the capability to collect data on multiple different
parameters concurrently. For instance, Yasuda and Arai (2009) used accelerometers on green
turtles in Thailand which recorded flipper beat frequency, body angle, swimming speed, and
ambient water temperature.
In a study by Hochscheid et al. (2005), six loggerheads were equipped with an IMASEN
mandible / jaw sensor which detected beak movements while foraging, breathing, and moving
water through their mouths. Using this sensor alongside a TDR could show great detail
regarding turtle foraging behavior – whether they feed at the surface or benthic substrate, how
often they eat or take bites, and even suggest what they are eating. While newer electronic
devices may provide better options for describing diving behavior, the fact remains that without
visual behavioral observations, turtle activities must still be inferred (Seminoff et al. 2006).
Implications and Future Directions
224
5100
5105
5110
5115
450
A better understanding of green sea turtle behavior, especially in areas subject to
anthropogenic threats, is of utmost importance for the conservation of the species and its
habitats. While technological developments have facilitated studies of turtle diving and
movements in shallow coastal habitats, research of immature or juvenile turtles at foraging
grounds is limited (especially for green turtles; Hart and Fujisaki 2010) because it is generally
difficult to deploy and retrieve the time-depth recorders (TDRs) (e.g., Southwood et al. 2003).
Thus, conservation efforts for green turtles in shallow, neritic foraging habitats have been
hindered by a lack of understanding of how the turtles use these habitats (Seminoff et al. 2002).
Yet, this is critical information for conservation, since these juveniles can spend decades within a
small habitat (Makowski et al. 2006) and their survival is essential to the stability of their
population (Chaloupka 2002).
In particular, Hawaiian green turtles remain exposed to a number of anthropogenic
dangers within their foraging grounds, especially as they will spend between 11 and 59 years in
these habitats until they reach maturity (Balazs 1980). Green turtles swimming close to shore are
in danger of entanglement in floating debris (Gribble et al. 1998), entanglement in fishing gear,
and boat strikes. From 1982-2003, 75% of 3,372 Hawaiian green turtle strandings occurred on
the heavily populated island of O’ahu, 50% of which occurred in near vicinity to Kaneohe Bay
on the northeast side of the island, directly northwest of the Kawai’nui Marsh Estuary (KME)
study site. Overall, 24% of all strandings in Hawai’i were caused by fishing gear-induced
trauma (gillnets, hooking, or entanglement; Chaloupka et al. 2008b). While fishing gear
interactions do not always end in strandings, they can negatively affect turtles by causing limb
amputations. However, specific mortality for gillnet gear and for hook-and-line gear is 69% and
52%, respectively, with juvenile turtles being the most susceptible to this type of trauma
225
5120
5125
5130
5135
5140
(Chaloupka et al. 2008a). Hook-and-line gear trauma and boat strikes were most common on
O’ahu than on any other island (Chaloupka et al. 2008a).
This study focused on the resident green turtle population of KME in Kailua Bay, O’ahu,
Hawai’i, a site that is home to between 40 (winter) and 100 (spring) juvenile green turtles with
strong year-round fidelity to the site (Asuncion 2010). KME is located in a heavily populated
area, and recreational vessels such as kayaks, outrigger canoes, and motor boats often pass
through the site, with snorkeling, fishing, and surfing being popular activities suggesting a great
amount of human-turtle interaction occurs at KME. Furthermore, daily abundance of green
turtles peaks at midday, when human use of the site is highest (Asuncion 2010). These times
may overlap with the periods in which the turtles forage heavily in the shallow cove and Kailua
Bay habitats, both of which are utilized for human recreational activity. Particularly within the
cove habitat, turtles are subject to the fishing lines and hooks of the fishers who remain on shore.
During the study period, at least three turtles with amputated limbs were observed while another
four were seen with either fishing hooks or line, often creating open wounds. Additionally, a
great amount of fishing-related marine debris remains at the site presenting a threat to the turtles
which rely on the location for foraging, resting, and cleaning.
Ten months after the conclusion of data collection at KME, a buoy with a rattling chain
was placed approximately 15 m from cleaning station; turtles are no longer observed at the
cleaning station. This could be problematic as the cleaning station appears to be a feature
drawing the turtles to the KME location, and could be critical in their health maintenance.
Management Recommendations
226
5145
5150
5155
5160
Most of the studies on juvenile green turtle behavior in foraging locations have focused
on reef habitats, deeper than most shallow foraging sites, where human mortality is of little
concern (e.g. Seminoff et al. 2001; Southwood et al. 2003; Makowski et al. 2006). Because
turtle behavior does change from foraging location to foraging location, the results of these
studies are not necessarily applicable to other shallower sites (Hays et al. 2002). Therefore,
prioritizing small areas for protection requires detailed location-specific information on turtle
behavior and small scale movement patterns, and human activities (e.g., Hazel et al. 2009).
Identifying important areas for management at KME requires considering the distribution
of turtle behaviors and threats across habitats, using three criteria (scaled from 0 to 3) to
determine the priority for protection (Table 1):
(i) the prevalence of each behavior, calculated by dividing the number of GPS points
collected within the study corresponding to a certain behavior by the total number
of GPS points, and subsequently multiplying this calculated percentage by the
highest possible score of three;
(ii) the magnitude of human-induced risk, with one point awarded for the presence of
each of three potential risks: boats (motorized and un-motorized), hook / line
fishing, and gillnet fishing; and
(iii) the degree to which these distributions can be mapped (Figure 1), with scores
based on the spatial concentration of the different behaviors.
The addition of the scores for these three criteria resulted in overall prioritization scores ranging
from 0 to 9: 0.00-3.00 being considered low priority, 3.01-6.00 being considered medium
priority, and 6.01-9.00 being considered high priority.
227
5165
5170
5175
5180
5185
455
In this study, we primarily considered six behaviors, three of which were considered site-
specific (resting, foraging / food searching, posing) and three which were generalized
(swimming, hovering, and breathing). All six behaviors resulted in overall scores in the medium
conservation priority range (3.01-6.00). Swimming behavior received the highest score (5.74),
as it is very prevalent at the site and poses a greater risk of boat strikes, hook/line fishing, and
gillnets. Foraging (5.40) and posing (5.09) behaviors had the next highest scores, because they
occur where the turtles face many risks, and foraging is fairly condensed within the cove and
Kailua Bay habitats while posing is highly condensed within the channel habitat, making them
easier to map. Hovering (4.41) and breathing (4.07) had similar scores, primarily due to the
spatial generality of the behaviors leading to more imposed risks. Resting resulted in the lowest
score (3.27) as turtles were tucked away from dangers under the ledge, but as the behavior is
fairly spatially condensed, it is easier to map. Resting turtles are primarily in danger of being
struck by boats as they frequently surface to breathe after a resting event, and remain at the
surface for an extended time period. Therefore, if attempting to enact conservation measures on
behavioral characteristics alone, any management decisions should be based on the distributions
of the swimming, foraging, and posing behaviors.
Despite the scores awarded to each behavior, it may be important to consider the
ecological importance of each behavior as its own criteria. While all behaviors are important
ecologically for the turtles, it appears as though the turtles are drawn to KME due to the close
proximity of resting habitat, foraging habitat, and a cleaning station (where the turtles pose).
While all turtles are at risk from a variety of human activities at KME, shore-based fishing-
induced trauma remains the largest threat, which mostly impacts the cove and rocky shore
habitats, where foraging occurs, but also impacts the channel to a smaller degree, where resting
228
5190
5195
5200
5205
and posing occur. Therefore, it may be best to focus conservation measures on these three
specific behaviors, especially as they are the easiest to map and thereby predict.
If planning conservation management strategies by habitat (Figure 2), four criteria must
be considered, each of which is once again given a score of zero to three (Table 2):
(i) the number of turtles utilizing the site, calculated by dividing the number of GPS
points collected within the study corresponding to a certain habitat by the total
number of GPS points, and subsequently multiplying this calculated percentage
by the highest possible score of three;
(ii) the magnitude of human-induced risk, scored the same as above;
(iii) the presence / absence of each of the six specific behaviors within each habitat,
with a presence given a score of 0.5; and
(iv) the degree to which these habitats can be mapped, with scores arbitrarily given
based on the topographical features used to define a habitat.
As above, the addition of the scores for these four criteria resulted in overall scores, with an
overall score of 0.00-4.00being considered low priority, 4.01-8.00 being considered medium
priority, and 8.01-12.00 being considered high priority for conservation.
The channel / ledge (9.21) and Kailua Bay (8.41) habitats each received scores in the
high conservation priority category, as both of these habitats had the largest number of turtle
GPS points, both are at high risk, contain the most variety of behavior, and are fairly easy to
map. The cove habitat fell into the medium category, receiving a score of 7.48. This habitat had
the lowest amount of turtle presence and the smallest amounts of behavioral variety, but the
score was increased by high human-induced risks and the easiest degree of mapping. Therefore,
229
5210
5215
5220
5225
5230
460
if focusing conservation management strategies by habitat, the channel / ledge and Kailua Bay
habitats would be highest priorities for protection, followed closely by the cove.
It is important to note that the rocky shore and canal habitats were not the focus of the
video behavioral surveys performed in this study, and therefore their overall conservation scores
cannot be considered in this analysis. Previous research suggests that turtles rest in the canal and
move in and out of this habitat in the morning and evening (Asuncion 2010), and turtles were
often seen foraging or swimming within the rocky shore although it was often too shallow to
enter safely. Thus, if the number of turtles in the canal and rocky shore habitats are considered
to be the average of all other habitats combined, and human-induced risks, behavioral
occurrence, and ease of mapping each habitat are considered, the canal and rocky shore would
receive scores of 8.87 and 6.87 (respectively), putting the canal into the high conservation
priority category, and the rocky shore in the medium priority category.
It may also be important to consider each of the habitats from an ecological perspective
for the turtles. The cove, channel / ledge, and canal are most important for the turtles as these are
the habitats in which the turtles forage, rest, and get cleaned. While foraging behavior also
occurs in the rocky shore and Kailua Bay habitats, it is not as prevalent there, and these habitats
primarily appear to be used for traversing between habitats or sites. Therefore, as the cove,
channel / ledge, and canal habitats appear to be the main features drawing the turtles to the site,
these habitats may require the highest protection.
Once resource managers have made the decision to enact a management strategy for
KME, the first step for conservation management, outlined by the Green Turtle Recovery Plan,
would be to protect and manage green turtles within their marine habitats through increasing
public education and increasing / maintaining law enforcement (NMFS and USFW 1998). The
230
5235
5240
5245
5250
fishers which utilize KME should be educated regarding the use of circle hooks to minimize
negative turtle interactions and the harmful impacts that fishing-related debris, such as fishing
line, hooks, and weights, can have on the turtles and their ecosystems. Periodic beach / site
clean-ups should be scheduled which involve fishers, the general public, and youth groups, to get
the community involved and make them feel responsible for the health and well-being of the
turtles. If the number of injured turtles does not decrease, further regulations should be imposed
minimizing the amount of fishing and boat activity in KME, particularly during the spring and
summer months when turtle abundance is highest at the site. The next priorities in Hawaiian
green turtle conservation are determining the distribution, status, and abundance of green turtle
populations (all of which were objectives in both the current study and that of Asuncion 2010),
followed by identifying current threats and reducing their impacts, and protecting and managing
marine (foraging) habitats (NMFS and USFW 1998). It is my hope that the data collected as part
of this thesis will contribute to enacting these critical conservation steps.
REFERENCES:
Arthur, K.E., and Balazs, G.H. 2008. A comparison of immature green turtle (Chelonia mydas)
diets among seven sites in the Main Hawaiian Islands. Pacific Science 62(2):205-217.
Asuncion, B. 2010. Characterizing juvenile green sea turtle (Chelonia mydas) habitat use in
Kawai’nui, O’ahu: a multi-disciplinary approach. Master’s thesis, Hawai’i Pacific
University, Kaneohe, HI. 89 pp.
Balazs, G.H. 1980. Synopsis of biological data on the green turtle in the Hawaiian Islands. U.S.
Department of Commerce, NOAATM-NMFS-SWFC-7, Honolulu, HI. 141 pp.
Balazs, G.H., and Chaloupka, M. 2004. Thirty-year recovery trend in the once depleted
Hawaiian green sea turtle stock. Biological Conservation 117:491-498.
Balazs, G.H., Hirth, H., Kawamoto, P., Nitta, E., Ogren, L., Wass, R., and Wetherall, J. 1992.
231
5255
5260
5265
5270
5275
5280
Interim Recovery Plan for Hawaiian Sea Turtles. Honolulu Lab., Southwest Fish. Sci.
Cent., Natl. Mar. Fish. Serv., NOAA, Honolulu, HI 96822-2396. Southwest Fish. Sci.
Cent. Admin. Rep. H-92-01. 76 pp.
Bjorndal, K.A., and Jackson, J.B.C. 2003. Roles of sea turtles in marine ecosystems:
reconstructing the past. In: Lutz, P.L., Musick, J.A., Wyneken, J. (Eds.),The Biology of
Sea Turtles, vol. II. CRC Press, pp. 259–273.
Blumenthal, J.M., Austin, T.J., Bothwell, J.B., Broderick, A.C., Ebanks-Petrie, G., Olynik, J.R.,
Orr, M.F., Solomon, J.L., Witt, M.J., and Godley, B.J. 2009. Diving behavior and
movements of juvenile hawksbill turtles Eretmochelys imbricata on a Caribbean coral
reef. Coral Reefs 28:55-65.
Blumenthal, J.M., Austin, T.J., Bothwell, J.B., Broderick, A.C., Ebanks-Petrie, G., Olynik, J.R.,
Orr, M.F., Solomon, J.L., Witt, M.J., and Godley, B.J. 2010. Life in (and out of) the
lagoon: fine-scale movements of green turtles tracked using time-depth recorders.
Aquatic Biology 9:113-121.
Brill, R.W., Balazs, G.H., Holland, K.N., Chang, R.K.C., Sullivan, S., and George, J.C. 1995.
Daily movements, habitat use, and submergence intervals of normal and tumor-bearing
juvenile green turtles (Chelonia mydas) within a foraging area in the Hawaiian Islands.
Journal of Experimental Marine Biology and Ecology 185:203-218.
Chaloupka, M. 2002. Stochastic simulation modelling of southern Great Barrier Reef green turtle
population dynamics. Ecological Modelling 148:79-109.
Chaloupka, M., and Balazs, G. 2007. Using Bayesian state-space modelling to assess the
recovery and harvest potential of the Hawaiian green sea turtle stock. Ecological
Modelling 205:93-109.
Chaloupka, M., Work, T.M., Balazs, G.H., Murakawa, S.K.K., and Morris, R. 2008a. Cause-
specific temporal and spatial trends in green sea turtle strandings in the Hawaiian
Archipelago (1982-2003). Marine Biology 154:887-898.
Chaloupka, M., Bjorndal, K.A., Balazs, G.H., Bolten, A.B., Ehrhart, L.M., Limpus, C.J.,
Suganuma, H., Troëng, S., and Manami, Y. 2008b. Encouraging outlook for recovery of a
once severely exploited marine megaherbivore. Global Ecology and Biogeography
17:297-304.
Fedak, M.A., Lovell, P., and Grant, S.M. 2001. Two approaches to compressing and interpreting
time-depth information as collected by time-depth recorders and satellite-linked data
recorders. Marine Mammal Science 17(1):94-110.
Gribble, N.A., McPherson G., and Lane, B. 1998. Effect of the Queensland shark control
232
5285
5290
5295
5300
5305
5310
5315
5320
5325
465
program on non-target species: whale, dugong, turtle, and dolphin: a review. Australian
Journal of Marine and Freshwater Research 49:645-651.
Hart, K.M., and Fujisaki, I. 2010. Satellite tracking reveals habitat use by juvenile green sea
turtles Chelonia mydas in the Everglades, Florida, USA. Endangered Species Research
11:221-232.
Hays, G.C., Glen, F., Broderick, A.C., Godley, B.J., and Metcalfe, J.D. 2002. Behavioural
plasticity in a large marine herbivore: contrasting patterns of depth utilisation between
two green turtle (Chelonia mydas) populations. Marine Biology 141:985-990.
Hays, G.C., Metcalfe, J.D., Walne, A.W., and Wilson, R.P. 2004. First records of flipper beat
frequency during sea turtle diving. Journal of Experimental Marine Biology and Ecology
303:243-260.
Hays, G.C., Marshall, G.J., and Seminoff, J.A. 2007. Flipper beat frequency and amplitude
changes in diving green turtles, Chelonia mydas. Marine Biology 150:1003-1009.
Hazel, J. 2009. Evaluation of fast-acquisition GPS in stationary tests and fine-scale tracking of
green turtles. Journal of Experimental Marine Biology and Ecology 374:58-68.
Hazel, J., Lawler, I.R., and Hamann, M. 2009. Diving at the shallow end: Green turtle behaviour
in near-shore foraging habitat. Journal of Experimental Marine Biology and Ecology
371(1):84-92.
Hochscheid, S., Maffucci, F., Bentivegna, F., and Wilson, R.P. 2005. Gulps, wheezes, and sniffs:
how measurement of beak movement in sea turtles can elucidate their behaviour and
ecology. Journal of Experimental Marine Biology and Ecology 316:45-53.
Jackson, J.B.C., Kirby, M.X., Berger, W.H., Bjorndal, K.A., Botsford, L.W., Bourque B.J.,
Bradbury, R.H., Cooke, R., Erlandson, J., Estes, J.A., Hughes, T.P., Kidwell, S., Lange,
C.B., Lenihan, H.S., Pandolfi, J.M., Peterson, C.H., Steneck, R.S., Tegner, M.J., and
Warner, R.R. 2001. Historical overfishing and the recent collapse of coastal ecosystems.
Science 293:629-638.
Makowski, C., Seminoff, J.A., and Salmon, M. 2006. Home range and habitat use of juvenile
Atlantic green turtles (Chelonia mydas L.) on shallow reef habitats in Palm Beach,
Florida, USA. Marine Biology 148:1167-1179.
National Marine Fisheries Service and U.S. Fish and Wildlife Service. 1998. Recovery Plan for
U.S. Pacific Populations of the Green Turtle (Chelonia mydas). National Marine
Fisheries Service, Silver Spring, MD.
Pandolfi, J.M., Bradbury, R.H., Sala, E., Hughes, T.P., Bjorndal, K.A., Cooke, R.G., McArdle,
233
5330
5335
5340
5345
5350
5355
5360
5365
5370
D., McClenachan, L., Newman, M.J., Paredes, G., Warner, R.R., and Jackson, J.B. 2003.
Global trajectories of the long-term decline of coral reef ecosystems. Science 301:955-
958.
Seminoff, J., Resendiz, A., Smith, T.W., and Yarnell, L. 2001. Diving patterns of green turtles
(Chelonia mydas agassizii) in the Gulf of California. Proceedings of the Twenty-First
Annual Symposium on Sea Turtle Biology and Conservation. NOAA Technical
Memorandum NMFS-SEFSC-528, pp. 321-323.
Seminoff, J.A., Resendiz, A., and Nichols, W.J. 2002. Home range of green turtles Chelonia
mydas at a coastal foraging area in the Gulf of California, Mexico. Marine Ecology
Progress Series 242:253-265.
Seminoff, J.A., Jones, T.T., and Marshall, G.J. 2006. Underwater behaviour of green turtles
monitored with video-time-depth recorders: what’s missing from dive profiles? Marine
Ecology Progress Series 322:269-280.
Senko, J., Koch, V., Megill, W.M., Carthy, R.R., Templeton, R.P., and Nichols, W.J. 2010. Fine
scale daily movements and habitat use of East Pacific green turtles at a shallow coastal
lagoon in Baja California Sur, Mexico. Journal of Experimental Marine Biology and
Ecology 391:92-100.
Southwood, A.L., Reina, R.D., Jones, V.S., and Jones, D.R. 2003. Seasonal diving patterns and
body temperatures of juvenile green turtles at Heron Island, Australia. Canadian Journal
of Zoology 81:1014-1024.
Taquet, C., Taquet, M., Dempster, T., Soria, M., Ciccione, S., Roos, D., and Dagorn, L. 2006.
Foraging on the green sea turtle Chelonia mydas on seagrass beds at Mayotte Island
(Indian Ocean), determined by acoustic transmitters. Marine Ecology Progress Series
306:295-302.
Wabnitz, C.C.C., Balazs, G., Beavers, S., Bjorndal, K.A., Bolten, A.B., Christensen, V.,
Hargrove, S., Pauly, D. 2010. Ecosystem structure and processes at Kaloko Honokohau,
focusing on the role of herbivores, including the green sea turtle Chelonia mydas, in reef
resilience. Marine Ecology Progress Series 420:27-44.
Wallace B.P., DiMatteo A.D., Hurley B.J., Finkbeiner E.M., Bolten A.B., et al. 2010. Regional
Management Units for Marine Turtles: A Novel Framework for Prioritizing Conservation
and Research across Multiple Scales. PLoS ONE 5(12): e15465.
doi:10.1371/journal.pone.0015465
Witt, M.J., McGowan, A., Blumenthal, J.A., Broderick, A.C., Gore, S., Wheatley, D., White, J.,
and Godley, B.J. 2010. Inferring vertical and horizontal movements of juvenile marine
turtles from time-depth recorders. Aquatic Biology 8:169-177.
Yasuda, T. and Arai, N. 2009. Changes in flipper beat frequency, body angle and swimming
234
5375
5380
5385
5390
5395
5400
5405
5410
5415
470
speed of female green turtles Chelonia mydas. Marine Ecology Progress Series 386:275-
286.
TABLES:
235
5420
5425
5430
5435
5440
5445
5450
5455
5460
5465
Table 1. Feasibility for the spatial management of juvenile green sea turtle activities performed
by the resident turtles at the Kawai’nui Marsh Estuary study site, based on three criteria: (i) the
prevalence of the behavior, (ii) the magnitude of human-induced risk, and (iii) the degree to
which these distributions can be mapped. Metrics are scores as: High (3), Medium (2) and Low
(1).
Risk
BEHAVIOR Prevalence Boat Hook/Line
Gillne
t
Risk Score Mapability Overall Score
Foraging 0.40 1 1 1 3 2 5.40
Resting 0.27 1 0 0 1 2 3.27
Posing 0.09 1 1 0 2 3 5.09
Swimming 1.74 1 1 1 3 1 5.74
Hovering 0.41 1 1 1 3 1 4.41
Breathing 0.07 1 1 1 3 1 4.07
236
5470
5475
5480
5485
Table 2. Feasibility for the spatial management of resident juvenile green sea turtle at the Kawai’nui Marsh Estuary study site by
habitat, based on four criteria: (i) the number of turtles utilizing the habitat, (ii) the magnitude of human-induced risk, (iii) the number
of behaviors which occur within each habitat, and (iv) the degree to which these habitats can be mapped. Metrics are scores as: High
(3), Medium (2) and Low (1).
Risk Behavioral Occurrence
HABITAT # Turtles Boat
Hook
/ Line Gillnet
Risk
Score Foraging Resting Posing Swimming Hovering Breathing
Behavior
Score Mapability
Overall
Score
Cove 0.48 0 1 1 2 0.5 0 0 0.5 0.5 0.5 2 3 7.48
Channel / Ledge 1.21 1 1 0 2 0.5 0.5 0.5 0.5 0.5 0.5 3 3 9.21
Kailua Bay 0.91 1 1 1 3 0.5 0.5 0 0.5 0.5 0.5 2.5 2 8.41
237
5490
475
FIGURES:
Figure 1. Kernel densities (100%, 99%, 95%, and 50%) of six behaviors mapped at 7,480 GPS
points recorded every 15 seconds during 251 individual turtle behavior videos at the KME study
site: A) Resting (n = 672); B) Foraging (n = 1000); C) Breathing (n = 176); D) Posing (n = 228);
E) Swimming (n = 4334); F) Hovering (n = 1034).
238
5495
5500
Figure 2. The five primary habitats of interest at the Kawai’nui Marsh Estuary study site. Video
behavioral surveys occurred in the cove, channel, and Kailua Bay habitats.
239
5505
480

Master's Thesis_Francke_toprint

  • 1.
  • 2.
    © 2011 DevonL. Francke TABLE OF CONTENTS 2 5 10 15 20 25 30 35 40 5
  • 3.
    Page ACKNOWLEDGMENTS 4 CHAPTERS 1. Intothe depths: a literature review of green turtle (Chelonia mydas) diving behavior Abstract 5 Introduction 5 History of Sea Turtle Behavior Studies 7 Comparison of Satellite-Loggers to TDRs 10 Creating Dive Profiles Using Satellite-Loggers and TDRs 12 Methods and Devices Used to Collect Behavioral Dive Data 18 Studying, Organizing, and Analyzing Behavioral Dive Data 24 Authors’ Definitions of Behaviors 31 Study Site Locations 32 Study Sample Sizes 33 Factors Influencing Dive Behavior 34 Conclusions 49 References 53 Tables 60 Figures 68 2. Inferring the behavior of juvenile green sea turtles (Chelonia mydas) in a shallow coastal habitat: augmenting time-depth-temperature records with visual observations Abstract 71 Introduction 72 Methods 75 Results 83 Discussion 95 Conclusions 110 References 111 Tables 119 Figures 129 3. Juvenile green sea turtle (Chelonia mydas) diving behavior in relation to habitat heterogeneity and water temperature in Kawai’nui, O’ahu (Hawai’i) Abstract 135 Introduction 136 Methods 140 Results 151 Discussion 162 Conclusions 180 References 182 Tables 190 Figures 204 4. Conclusions 220 References 232 Tables 236 Figures 238 ACKNOWLEDGMENTS 3 45 50 55 60 65 70 75 80 85 90 95 100
  • 4.
    I have agreat many people and organizations that I would like to thank for their contributions to my thesis. First, my committee members have been inspirational in supporting my love and desire to pursue marine science and conservation as a career. David Hyrenbach shared his vast knowledge, experience, and dedication with me nearly every single day over the last two years; I could not be more grateful for the positive influence he has had on my life. Eric Vetter provided valuable insight regarding methodological design, statistical, and thesis writing techniques. Chris Winn provided expertise on oceanographic topics and assisted with thesis writing. Stacy Hargrove, of the Marine Turtle Research Program (MTRP) of the National Oceanographic and Atmospheric Administration Pacific Islands Fisheries Science Center (NOAA-PIFSC) assisted with thesis writing and shared her sea turtle ecology knowledge. The project could not have been completed without the support of George Balazs and his team at MTRP NOAA-PIFSC. They directly worked with me in the field on a monthly basis over the course of my study and allowed me to utilize their turtle research permits. They provided great knowledge of green sea turtle ecology and field techniques, including proper sea turtle catching, handling, and tagging techniques. In particular, George went out of his way on multiple occasions to help me spot and catch tagged turtles, and I cannot thank him enough for sharing his vast Hawaiian green turtle knowledge and being a great mentor. My Pelagicos labmates Jessie Lopez, Shannon Lyday, Pamela Michael, Andrew Titmus and David’s wife, Michelle, provided extensive support assisting me with field work, sharing thoughtful commentary on my work and creative solutions to problems I encountered. Karen Arthur provided detailed knowledge of Hawaiian algae, occasionally assisting with field work. Brenda Asuncion trained me in multiple aspects of my research, including teaching me how to use equipment and computer software, shared her great knowledge of the study site with me, and assisted me with field work. I would also like to thank Jillian Bennett, Stephanie Bovia, and Monica Mocaer for the countless number of hours each of them put in to be my kayaking, snorkel, and algae-collection buddies over the course of my study. This research was supported by in-kind contributions of time, equipment, and supplies from a number of people and organizations. Hawai’i Pacific University furnished funding through a Trustee’s Scholarship Endeavors Program grant, and the World Turtle Trust provided a grant, both allowing me to purchase research supplies and analyze data for my thesis. Alan Friedlander provided Vemco acoustic receivers and tags, the Yarborough family provided me with a 2-person kayak to use for field work, and the Churchill family was essential in my daily field work by allowing me to store my gear and set up in their backyard. The Perry and Scherman families made their homes available to us during our turtle catching and tagging days. I am extremely grateful for the generosity provided by these people and organizations. Lastly, I would like to thank those people who provided me with extensive emotional, moral, and financial (thanks, mom and dad!) support. Specifically, I would like to thank my advisor, David Hyrenbach; my fellow Badgers Joel and Tiffany Bessire, Kristin Mocadlo, Megan and Ross Moore, Nathan and Sarah Seegert, and Matt Ziehr; my Minnesota friends Eric and Alexis Simonson, and Steven Torres; and an extremely special thank you to my family: Elliot and Cheryl Francke, Tara and Russell Nadel, and Jordan Francke. Without these people, my motivation and desire to continue working, even when the going got tough, would not have existed. Thank you all for being such wonderful, amazing, inspirational influences in my life. CHAPTER 1: Into the Depths: A Literature Review of Green Turtle (Chelonia mydas) Diving Behavior 4 105 110 115 120 125 130 135 140 145
  • 5.
    ABSTRACT: A large numberof articles have been written on marine animal diving behavior, but only a fraction of these discuss turtles, with even a smaller number specifically addressing green sea turtles (Chelonia mydas). In this literature review, 29 articles using electronic equipment in their methodology to quantify and describe green turtle dive behavior are discussed in depth, comparing how these devices are used to collect dive data, the methods by which these data can be analyzed, and the dangers involved with making subjective decisions and comparisons of dive data and dive behavior. The definitions used to describe distinct behaviors, such as foraging and resting, are discussed. In addition, other ancillary data including the location of each study and the sample size are considered. Finally, a wide range of additional ecological factors which can affect a turtle’s dive behavior are also discussed. All of these factors must be taken into consideration when researching the dive behavior of green sea turtles, as each can affect the conclusions drawn from these studies. INTRODUCTION: There is a great lack of information regarding the at sea behavior of marine animals (Godley et al. 2002). It is much harder to study the behaviors of marine animals that remain out of view while submerged and occur far from shore (Hays et al. 2000; Hays et al. 2002b; Myers et al. 2006). More specifically, data on sea turtle behavior are more limited than for other species, such as seals, penguins, and diving birds. It is very important that turtle behavior be studied as these creatures spend a much greater portion of their life underwater than other air-breathing marine vertebrates, and are therefore likely to have different behavioral patterns than other diving species (Hochscheid et al. 1999). Most importantly, studying turtle diving behavior can 5 150 155 160 165 170 10
  • 6.
    give an insightto their energy expenditure and grazing habits, as well as provide useful information to protect these animals through marine protected areas (Cooke et al. 2004). Until recent technological developments within the last few decades, studies of sea turtles while at sea have been limited to sporadic observations of behavior and fragmentary records of long distance migrations from mark-recapture studies (Hays et al. 2000). The majority of the published studies that focus on sea turtle behavior are limited to areas in which turtles can easily be tagged, such as on beaches when females emerge to nest. Conversely, it is much more difficult to catch and tag turtles when they are not on shore, for instance while they are migrating or foraging (Rice and Balazs 2008), even though this has been done before, and is now becoming a more common methodology. Expanding these behavioral studies to incorporate all habitats utilized by turtles will assist conservation managers in their global effort to specifically protect the green sea turtle (Chelonia mydas), a globally endangered species (Makowski et al. 2006). This is because studying the three-dimensional movement of sea turtles, such as foraging behavior, will help to determine how they allocate time to feeding and other activities (Blumenthal et al. 2009), and will contribute to developing accurate budgets of energetic needs and grazing (Hochscheid et al. 2005). A better understanding of green turtle behavior will help conservation managers to protect critical areas for this species (Schofield et al. 2006). Choosing small areas to protect will require detailed location-specific information on green turtle behavior and small-scale movements within areas affected by human-caused mortality (Hochscheid et al. 1999; Hazel et al. 2009). HISTORY OF SEA TURTLE BEHAVIOR STUDIES: 6 175 180 185 190
  • 7.
    Even though relativelyfew manuscripts discuss green sea turtle dive behavior, the first studies date back to the 1950s. Initially to study turtle movement behavior, mark/recapture techniques were used to study long distance migration (Hays et al. 2001a). This was the prominent method for studying turtle distribution and movement for decades (Keinath and Musick 1993), but this method poorly described the daily movement of sea turtles (Blumenthal et al. 2010). Instead, some researchers would study turtle movement by filling balloons with helium and attaching them via a nonfilament line to the carapace of the turtles. Beginning in the 1970s, satellite telemetry was used to track terrestrial animals such as elk and deer, and shortly thereafter it was used on marine animals such as fish, polar bears, birds, seals, manatees, and dolphins (Renaud and Carpenter 1994). Satellite tracking of turtles did not begin until the 1980s, and was quite limited at the time (Godley et al. 2008). These early instruments could only measure location of the turtle (Renaud and Carpenter 1994). Into the 1990s, laboratory experiments tested the mechanisms which turtles use to navigate during migration (e.g., Lohmann and Lohmann 1994), and organ analyses of dead specimens were conducted to realize any changes in the body due to migration (Hays et al. 2001a). In the early 1990s, more electronic equipment, such as radio and sonic telemetry, was used to track turtles over a short range for the first time to obtain fine-scale movement data (e.g., Brill et al. 1995), but this method was very expensive and dependent on the weather, making it unreliable and difficult to track turtles in this fashion (Keinath and Musick 1993; Hazel 2009). The amount of data collected by any of these techniques was quite limited and descriptive without much quantifiable data on turtle behavior. Additionally, these devices required extensive hands-on effort for tracking the turtles while at sea, creating a large amount of funding needed to compensate for 7 195 200 205 210 15
  • 8.
    both the expensivedevices as well as people-hours working in the field (Seminoff and Jones 2006). The onset of electronic tags in the mid-1990s greatly advanced the study of turtle behavior. Over the last 15-20 years, satellite-loggers have technologically advanced to the point that they can now incorporate complex dive logging capabilities (Godley et al. 2008), such as being able to measure heart rate, body temperature, speed of travel, diving depth, submergence time, and water temperature (Renaud and Carpenter 1994). Quantifying these variables gives researchers insight into the behavioral ecology of turtles while they migrate and forage (Hays et al. 2001a). Satellite data can show dive profiles which could help to explain turtle behavior such as resting, foraging, exploring, or a multitude of other behaviors, and can help to determine if other factors, such as water temperature, could affect the turtle’s movement or diving patterns (Myers et al. 2006). In the late 1990s, a new emerging technology provided even more detailed results than satellite-linked loggers, which are constrained to the rate of data they can deliver and thus often provide only summaries of the data (Hays et al. 2001a). This new technology, a data logger, commonly referred to as a TDR (time-depth recorder), is capable of storing all data within the device itself, rather than delivering them to the satellite, therefore having the ability to record more data points and thus achieve more detailed (fine-scale) results on turtle diving behavior (Hays et al. 2001a). At first, these devices did not have much more memory capacity than satellite-loggers (Fedak et al. 2001), but over time, the resolution of these devices has become much finer, allowing for a much more in-depth analysis of data collected from tracked turtles. Currently, the most advanced TDRs have the capability of recording ancillary data on flipper beat frequency, acceleration, compass heading (Myers et al. 2006), biaxial motion, and 8 215 220 225 230 235
  • 9.
    swimming speed (Yasudaand Arai 2009a). Many devices even log still images and video to show the behavior that a turtle is performing within its environment (Seminoff et al. 2006). As satellite and data logging technologies continue to expand, so will our knowledge of sea turtle behavior at sea (Hays et al. 2002b). Additionally, a new technology is emerging just within the last few years which can measure fine-scale horizontal movement of diving animals. Previously, global positioning system (GPS) units have not been used with marine animals, like green turtles, as they surface too briefly for the device to communicate with the satellites. However, new fast-logging GPS devices, such as Fastloc GPS (FGPS) can be used on marine animals which periodically surface to breathe, allowing much better location accuracy and resolution than traditional satellite- logging devices (Hazel et al. 2009). For instance, in a study by Hazel (2009) comparing the efficacy of both regular satellite-loggers and FGPS units, the horizontal distance error was between 150 to 1000 m for the satellite-loggers, while the FGPS units had an error of only 32 ± 36.9 m. The FGPS device also collected 50 times more data points than the satellite-logger. And, even though acoustic tracking can be more exact than FGPS, this newer method is not reliant on boat tracking, weather conditions, and is not labor intensive, while radio and sonic tags are reliant on these things. Acoustic signals can also be disrupted by silty or vegetated substrates, as well as wave action, vessel traffic, and even other animals, while FGPS is not (Hazel 2009). However, this new technology still is in need of improvement – as the number of satellites with which it communicates decreases, so does its accuracy. To ensure that it communicates with the maximum number of satellites, its sampling rate must be set at a maximum, which greatly decreases its battery life. And, there is a time delay of at least 24 hours before the data from these devices is processed, therefore making real-time tracking of the 9 240 245 250 255 260
  • 10.
    animal impossible (Hazel2009). Until these potential problems are addressed, and these devices also have the ability of recording depth, these devices will unlikely be used mainstream. COMPARISON OF SATELLITE-LOGGERS TO TDRS: Satellite and TDR logging devices have revolutionized the study of turtle diving behavior (Houghton et al. 2003). However, there are specific advantages and disadvantages to both types of devices. For instance, satellite-loggers can transmit the data collected back to the researchers without needing to retrieve the device (unlike a TDR), which allows studies of animals that cannot be recaptured (Fedak et al. 2001). Satellite tags are more expensive than TDRs (Blumenthal et al. 2010), but they can be serviced for multiple deployments (Keinath and Musick 1993). Additionally, satellite-loggers reduce research costs by not requiring the additional field work to recapture the animal (Renaud and Carpenter 1994). It may be more beneficial to use a satellite-logger when studying the behaviors of turtles over a longer time period or longer distance, as TDRs are better suited for shorter, smaller studies (Hays et al. 1999, 2000). Finally, data collected via satellite can easily be uploaded and shared with the public (Godley et al. 2008). TDRs, on the other hand, may be better suited for studies in small areas as satellites have difficulty collecting data in such small areas due to potentially large location errors with those devices (Godley et al. 2002; Hazel 2009; Blumenthal et al. 2010; Hart and Fujisaki 2010), especially where depth decreases with distance from shore (Hazel et al. 2009). Therefore, satellite-loggers are better for studies involving larger individuals due to their large size, high cost, low positional accuracy and dive resolution (Blumenthal et al. 2009), while TDRs are used more often on smaller individuals which reside in confined areas because they can provide much 10 265 270 275 280 20
  • 11.
    more detailed informationregarding depth utilization, surfacing behavior, and dive durations (Hays et al. 2007; Rice and Balazs 2008; Witt et al. 2010). However, there are negative aspects to using both types of devices. One pervasive limitation is that instrument and attachment failures can lead to the loss of the data (Renaud and Carpenter 1994). Satellite devices have a smaller band width for data transmission than TDRs, meaning that the typical data collection interval must be spaced out, typically somewhere between every 40 to 200 seconds (Myers et al. 2006). Because data collected by satellite tags usually build up on the device much faster than they can be relayed to the Argos satellite system, the device must bin or average the data before uplinking to the satellite, possibly eliminating variability in the data (Fedak et al. 2001; Myers et al. 2006). Furthermore, satellite-based devices can only uplink to the satellite once the device is at the surface of the water, which may not be enough time for the data to upload (Fedak et al. 2001). This is a problem for turtles which spend the majority of their time underwater (Hochscheid et al. 1999; Myers et al. 2006). For instance, in a study at Ascension Island, dives by green turtles were longer than those recorded in other studies, meaning that the satellite-loggers were rarely at the surface to upload the data they had collected, leading to data more prone to errors (Hays et al. 1999). Also, the data relayed by satellite-loggers could have location errors in the order of one kilometer, but can reach as high as tens of kilometers (Renaud and Carpenter 1994). In a study by Hart and Fujisaki (2010), the authors removed many satellite data points due to possible location errors – many points appeared as though the turtles were crossing land, or were just general outliers. Lastly, the large size of the satellite-logging device can actually increase the swimming drag on a sea turtle by up to 27-30%, reducing its swimming speed by 11% (Watson and Granger 1998). 11 285 290 295 300
  • 12.
    There appears tobe two major drawbacks in regards to the use of TDRs. The first is that it can be very difficult to retrieve these devices, particularly if they are deployed on turtles with unknown residency patterns (Hazel et al. 2009), or on turtles which are very fearful of humans due to decades of negative interactions with people – catching these turtles a second time to retrieve the devices can be nearly impossible (Seminoff et al. 2001). Because this limitation constraints the species and locations in which these devices can be used, satellite tags are a more suitable option for migrating and non-resident organisms (Myers et al. 2006). Nevertheless, occasionally both instruments can be used. In a study by Hays et al. (2001a), TDRs confirmed the results from satellite tags – both devices reported short and shallow dives during the migration of green turtles between Brazil and Ascension Island. The second drawback is that TDRs lack a spatial context, unlike satellite-loggers (Blumenthal et al. 2010). These devices make it difficult to determine habitat use (Witt et al. 2010). A possible solution to these two drawbacks is to use a tandem of remotely collected TDR technology along with video cameras attached to the carapace of a turtle (Seminoff et al. 2001). However, this type of technology is only suitable for larger individuals as this methodology involves very large units, is costly, and is memory constrained (Moll et al. 2007). CREATING DIVE PROFILES USING SATELLITE-LOGGERS AND TDRS: The analysis of data collected by satellite-loggers and TDRs can still be difficult to interpret because they provide a limited record of the behavior being performed by the tagged turtle (Fedak et al. 2001), even if the fine-scale data collected by these devices can recreate the three-dimensional movements of the animal into two dimensions – depth and time. Generally, these data are represented in a dive profile, showing the turtle’s depth over time (Figure 1). 12 305 310 315 320 325 25
  • 13.
    Remote-sensing technology, suchas satellite-loggers and TDRs, can only determine if an animal is active or inactive – they do not explicitly state the behavior being performed (Heithaus et al. 2001). So, using some basic assumptions, researchers can make predictions about the behaviors the turtles perform at specific times and locations, using these basic time-depth profiles. Until the mid-1990s, dive profiling had been applied to marine mammals and birds but had rarely been done for turtles (Hochscheid et al. 1999). By developing these standardized time-depth profiles for turtles, it is now possible to identify, quantify, and analyze sea turtle diving behaviors. When a turtle’s dive depth is plotted as a function of time, the time-depth profile can describe multiple “shapes,” which can be related to behavioral or ecological factors, and can be compared between conspecifics, across locations, and even across species (Fedak et al. 2001). Researchers have therefore been able to assign specific dive shapes to particular behaviors, such as feeding, looking for prey, traveling, and resting. However, because comparing dive shapes involves a great deal of subjective judgments and arbitrary decisions (Fedak et al. 2001), there are a multitude of potential problems associated with inferring behaviors or movements from dive profiles (Seminoff et al. 2006). This simplistic approach may not be accurate as turtles are known to perform multiple different types of behaviors on one single dive, meaning that their dive behavior is more complex than a shape dive profile may suggest. For example, in a study by Hochscheid et al. (1999), turtles performed a specific type of a dive (U-dive, described later in this review) to the benthos multiple times, but three different behaviors were observed with this type of dive – resting, grazing while moving short distances along the bottom between patches of food, and foraging while swimming at a slow constant speed to search for more food and resting places. Activity indexes showed that 25.3% of the U-dives were used for resting with largely inactive turtles, 44.3% of the U-dives 13 330 335 340 345 350
  • 14.
    showed a limitedamount of turtle movement and activity, 30.3% showed green turtles were active for >80% of the dive, and 12% of the dives showed constantly active turtles. In another study, Seminoff et al. (2006) cautioned that applying a dive type to a specific behavior may not be prudent as green turtles were observed to forage in both the mid-water column and the bottom, and did not always rest when it was assumed they would while using the dive profile. After classifying the individual dive profiles into six distinct shapes, this study showed that turtles could either be resting or foraging during the same dive shape, suggesting that it may be impossible to determine merely by using a dive profile if a turtle is foraging, resting, or performing any other behavior on the bottom (Hochscheid et al. 1999; Hays et al. 2002a; Seminoff et al. 2006). Furthermore, because the histograms created by these dive profiles fail to describe the order in which certain dives occurred, researchers cannot investigate the particular activity of the animal during a particular dive (Fedak et al. 2001). Another problem associated with assigning behaviors to a dive profile is that the logging devices themselves (satellite-loggers or TDRs) can show a bias. Along with the fact that the volume of data stored on a logging device can overload the memory capacity of the device, jumbling the analysis (Fedak et al. 2001), the device could also easily show a turtle rising from depth very clearly but does not show whether or not the animal had been actively swimming to the surface (exploring, foraging, etc.) or if the turtle had just been floating upwards (possibly resting mid-water). Another problem relates to the location at which a turtle is performing a specific dive type. If behavior does change amongst all foraging sites and even between different inter- nesting sites (Houghton et al. 2002), one cannot assume similar behavior by different turtles at all different locations on the planet (Hays et al. 2002a; Hazel et al. 2009). For example, as green 14 355 360 365 370
  • 15.
    turtles tend toshow sudden increases in depth and length of dives upon reaching a coast during migration, it is likely the individual is using the area for foraging during migrating (Godley et al. 2002). Another example is related to a behavior specific to deep water migrations, as well as to the Hawaiian Islands – basking. Sea turtles may actually rest at the surface of the water during migration, which had not been documented until a study by Hays et al. (1999). However, it is unlikely that turtles would rest for extended periods of time while migrating, unless it happens before deep dives or during digestion (Hays et al. 1999). Whittow and Balazs (1982) also showed that this basking behavior is common in the shallow waters of Hawai’i, and that green turtles may climb onto the shore for an extended period of time to warm in the sun. A third example is illustrated in a study by Hays et al. (2004a), in which U-shaped dives to the sea floor at Ascension Island were interpreted as resting dives because there is no food available at this inter-nesting site, while U-shaped dives to the seafloor off Cyprus have been observed to be foraging dives, to feed on the plentiful food at that location. The opposite can be true as well – two locations which appear very different may actually involve a similar behavior. In a study by Hatase et al. (2006), adult female green turtles were recorded feeding in both shallow, neritic waters and in the surface waters of deeper water (>200 m), although they would only feed at the surface. It had been generally unknown that green turtles would feed on plankton while in the open ocean during migrations before this study. It may be deceptive to infer behaviors from dive profiles, as individual turtles at one specific location can show great variability in dive behavior. For example, in a study by Hays et al. (1999), all turtles showed individual variability in the lengths of dive submergence, velocities traveled while migrating, and percent of time submerged. In this study, the authors did not create dive profiles for their turtles, but rather interpreted the behaviors being performed by the 15 375 380 385 390 395 30
  • 16.
    turtles on thebasis of the dive data. Most studies compare and contrast turtle behavior by individuals tagged at the same time and location. Even though each turtle tends to show their own unique dive behavior patterns, the overall conclusions are drawn by comparing the dive profiles of all the individuals tagged (Rice and Balazs 2008). However, researchers must be cautious when comparing turtles which seem to be portraying very different dive profiles, and thus possibly very different behaviors. In areas with complex or unknown bathymetry, it can be very difficult to use TDRs to determine horizontal movements. In a study by Blumenthal et al. (2010), the authors integrated TDR data with bathymetric maps to determine the location of tagged turtles by inferring that the dive depths corresponded with the bathymetry of the area. Witt et al. (2010) took the inference of dive behavior to even another level – using those inferences to predict the habitat in which hawksbill turtles (Eretmochelys imbricata) were performing those behaviors. When maximum depth was repeatedly relatively shallow, it was assumed the turtles were on the shallow reef, and when their maximum depth was relatively deep, they were assumed to have traveled quite a far distance away from the reef. However, as TDRs do not record the location of the turtles, it is very difficult to determine if the shallow dives performed by turtles are in shallow or deep water (Blumenthal et al. 2010). One must be very careful when using TDR data to infer habitat type, as this is taking the inference of turtle behavior to an even further level. Another prejudice against the use of dive profiles is their inability to show whether a behavior is being performed at multiple depths. In the study by Seminoff et al. (2006), foraging was observed while stationary on the bottom, while actively moving on the bottom, and while moving in mid-water. Thus, it may be impossible to determine from a dive profile if a turtle is 16 400 405 410 415
  • 17.
    foraging or restingwhile on the bottom (Hochscheid et al. 1999, Hays et al. 2002a, Seminoff et al. 2006). Despite all of these potential limitations, there are ways to minimize these biases to study diving behavior. Because it is impossible to determine the details of dive behavior from the analysis of satellite-logger or TDR derived dive profiles alone (Hays et al. 2004a), these data should be augmented with behavioral observation (Houghton et al. 2003). However, of the 29 articles reviewed on green turtle diving behavior, only five (~17%) augmented their study by including behavioral observation (visual surveys and/or Crittercam video camera), implying that 24 of the studies (~83%) based their conclusions exclusively on data collected from the electronic devices attached to the turtles (Table 1; see section 5 in this review). Additional data, beyond mere dive depth and/or duration must be analyzed (these were the only one or two variables measured in 11 out of 29 studies, or ~38% of the articles reviewed) to better understand dive behavior. For example, visual imaging systems, activity and swim speed sensors, or instruments that show jaw activity can show if specific activities occur during dives (Hays et al. 2004a). Or perhaps, instead of creating a dive profile, a dimensionless index of dive shape (Time Allocation of Depth Index, TAD), which is independent of dive depth and time, could be created instead, which shows the range at which the turtle has concentrated its dive activity. This method uses the concept of “time-depth area,” defined as the area enclosed by the dive profile trajectory and the line of zero depth (or, in other words, the integral of the dive depth over duration of the dive). Or, instead of using a dive profile, an algorithm could be used to select the points where the dive angle changes the most drastically (Fedak et al. 2001). Yet, if analyzing dive profiles appears to be the best method to study diving activity, it would be best to use either a satellite-logger or TDR in conjunction with a flipper beat sensor, beak movement 17 420 425 430 435 440 35
  • 18.
    sensor, visual confirmation,and a Crittercam video camera. However, all of these devices would most likely greatly reduce the turtle’s hydrodynamic properties, and potentially alter its behaviors. Thus, researchers must continue to use their best judgment and assumptions based on environmental as well as physiological characteristics of the turtles to define dive behaviors based on a dive profile. METHODS AND DEVICES USED TO COLLECT BEHAVIORAL DIVE DATA: A great number of different data logging devices and methods including traditional TDRs, a VTDR (Video TDR), satellite-loggers, radio/sonic telemetry, movement sensors, accelerometers, and visual surveys were used to collect data on green turtle dive behavior in the 29 reviewed articles (Table 1). While radio and sonic telemetry, as well as TDRs and satellite- loggers can provide a great amount of data on sea turtle behavior, they cannot describe the full range of behavioral patterns as well as when studied by the use of visual observation (Houghton et al. 2002). This is because the use of electronic equipment requires that inferences be made about behavior, as described above. However, visual observation allows the study of a species in its natural habitat and provides an understanding of its function within the ecosystem (Schofield et al. 2006). Field observations of behavior are critical for effective conservation of an organism (Mills et al. 2005). It may also be possible that visual observations may uncover behaviors previously unrecorded. For example, Schofield et al. (2006) discovered a more diverse behavioral repertoire for breeding loggerhead turtles (Caretta caretta) than was previously known. It is therefore possible that previous studies using inferences made from TDRs or satellite-loggers may have incorrectly assigned behaviors to dive profiles. 18 445 450 455 460
  • 19.
    In general, thereare very few studies which use this method to measure sea turtle behavior, especially once the use of TDRs and satellite-loggers became more feasible. However, to verify any results or conclusions, it is important to follow up electronic data with personal observation. Of the 29 articles using electronic equipment reviewed here, only two (~7%) used personal observation as part of their methodology (Rice et al. 2000; Salmon et al. 2004). In Rice et al. (2000), two students conducted visual surveys on 23 days, recording each turtle’s location, behavior, and activity along with the time and date. Later, this data was compared with the TDR data collected from the same turtles over the same time periods. However, visual observations are not always feasible to attempt. It can be very difficult to make direct observations in the ocean due to the sea depth, sea state, visibility, availability of natural light, possibility of physical danger, and adequate access to the animal being studied (Hooker and Baird 2001). Additionally, the presence of the researcher could influence the natural behavior of the subject, and the study site may not always be accessible for use by people (Witt et al. 2010). So, due to these difficulties, most studies end up relying upon inferences from animal-borne devices (Schofield et al. 2006). Another option besides personal observation to obtain first-hand observation of sea turtle behavior may be to attach a video camera or VTDR (commonly National Geographic’s Crittercam) to the sea turtle (Heithaus et al. 2002; Seminoff et al. 2006; Hays et al. 2007). The use of VTDRs attached to a turtle (or filming their behavior in a secluded setting, such as an aquarium; Hochscheid et al. 2005) is a great method for studying their dive behavior. VTDRs are capable of recording video and still imagery, as well as environmental data such as time, water depth, and water temperature (Heithaus et al. 2002). Such visual surveys can be used to confirm the behavior of a turtle at a specific time and location. This information can also be 19 465 470 475 480 485
  • 20.
    used to validatedive data. Three studies (Heithaus et al. 2002; Seminoff et al. 2006; Hays et al. 2007) of the 29 reviewed here (~10%) used Crittercams or VTDRs attached to the carapaces of turtles to monitor their behavior, and analyzed these visual observations in conjunction with other dive analyses (Table 1). Just like personal visual surveys, VTDRs may reveal behavioral information which would be counterintuitive to data collected by other electronic loggers. For example, a study using VTDRs showed that herbivorous green turtles occasionally forage on jellies and ctenophores while swimming in the water column (Heithaus et al. 2002). Previously, this was a largely unknown behavior (Hochscheid et al. 2005). Also, Heithaus et al. (2002) found that while green turtles spent a great amount of time in seagrass habitat where they could forage as frequently as they pleased, only two individuals were recorded grazing on the seagrass, and both for under two minute durations. This same study also recorded green turtles swimming to the benthos to rub themselves on rocks and sponges to clean themselves, which may have been inferred to be foraging dives in previous studies (Heithaus et al. 2002). This shows why personal visual surveys or the use of VTDRs are so important in any sea turtle behavioral study. Attaching cameras to diving turtles provides an innovative method to augment diving studies. However, these devices have their limitations. For one, these devices can be very large and expensive. Because they are quite large, they can alter the behavior of the turtle due to their size and bulkiness. In particular, attached devices can impair the hydrodynamics of swimming turtles by increasing drag. Another method used to study turtle dive behavior is to attach an electronic movement sensor to the turtle. For instance, a beak movement sensor can determine when an animal opens and closes its mouth (a proxy for foraging). While none of the 29 examined studies on green turtles used this method, it was applied to loggerhead turtles (Hochscheid et al. 2005). In this 20 490 495 500 505 510 40
  • 21.
    study, the authorsplaced magnets on the upper and lower jaws of the turtles, along with an IMASEN sensor that could determine the magnetic strength between the two magnets. The closer together the two magnets, the stronger the signal picked up by the IMASEN sensor. Thus, the authors recorded bite frequencies and were able to determine when the turtles were foraging, the type of prey they were ingesting, and it could even be determined when the turtles lunged at and missed their food. And, differences in beak movement could show whether the turtle was breathing, or just allowing regular water movement through its mouth. Beak movement, along with a dive profile, could provide great detail regarding diving behavior and foraging strategies. However, one must be careful as even jaw activity patterns can be misinterpreted, as inferences made using this device may likely only refer to foraging or breathing, while the jaws can also be used to spar, bite at cleaner fish, and are also used during self cleaning (Schofield et al. 2006). Hays et al. (2004a) used a different type of movement sensory unit to measure green turtle diving behavior. The authors made use of an IMASU (Integrated Movement Assessing Sensory Unit) to measure the flipper strokes of the turtle. Similarly to the beak movement sensor, a magnet was placed on the flipper as well as on the carapace, and the IMASU would measure the local magnetic field, which would fluctuate as the magnets moved closer and farther apart. Using this type of device can augment the use of TDRs or other electronic equipment to indicate the activity level of a turtle – great activity could indicate swimming or foraging, while little activity could indicate gliding or resting. Radio and sonic telemetry (used in two of the 29 studies, ~7%; Renaud et al. 1995; Makowski et al. 2006) can be used to determine the location of an animal, and thus infer its depth, but this usually requires the scientist(s) to follow the animal with a tracking device (Witt et al. 2010). Another option may be to place acoustic receivers at strategic locations to record 21 515 520 525 530
  • 22.
    horizontal movements, suchas done by Blumenthal et al. (2009) in the study of hawksbill diving behavior in the Cayman Islands, but it is necessary to complement this technique with other methods of determining the depths obtained by the turtles. Using radio and sonic telemetry can be very costly in terms of both time and money, and the depth data may not be as precise as if it were collected by a TDR or satellite-logger, which may explain why it is used so sparingly to study diving behavior of sea turtles. It is important to note that many of the 29 studies shown in Table 1 did actually use radio or sonic telemetry, but only in the use of retrieving the other electronic devices once they became detached from the study animal. The two studies listed using radio and/or sonic telemetry are ones which used the methodology to obtain diving data. Another type of device used in two of the 29 studies (~7%; Yasuda and Arai 2009a; 2009b) was an accelerometer. This device is capable of recording depth, ambient water temperature, biaxial (flipper beat) acceleration, and swimming speed. Using the combination of all of these variables provides a clearer picture of the turtle’s behavior than just collecting depth data alone. It is likely that the use of this type of device may increase in popularity for sea turtle diving studies in the future. It is important to note that 15 of the 29 studies (~52%) used more than one electronic device to record data on turtle diving behavior. Because each device has its own resolution/accuracy and uses different sampling rates to collect depth and temperature data (Table 2), integrating the data and comparing results between two different devices may be difficult even if all of the devices were used in the same location and time. The resolution and error of electronic devices used in these studies varied greatly, from 0.04 m (Hays et al. 2001a; 2004a) to 2.0 m (Hays et al. 2000; Glen et al. 2001), and from 0.05 degrees Celsius (Hochscheid et al. 1999; Rice and Balazs 2008; I-Jiunn 2009) to 0.5 degrees 22 535 540 545 550 555 45
  • 23.
    Celsius (Southwood etal. 2003; Makowski et al. 2006; Rice and Balazs 2008; Table 2). The smaller the resolution and the error, the more precise the data. Surprisingly, 13 of the 29 studies (~45%) did not report the resolution or the accuracy of their devices, making it very difficult to infer the reliability of their results. The data sampling rates also varied greatly, ranging from every second (I-Jiunn 2009; Yasuda and Arai 2009b) to every 300 seconds (Hays et al. 2000; Table 2). The same principal applies here as it does for resolution and accuracy of the device – the smaller the sampling rate, the more accurate the data, but at the price of using up more memory on the device. It would seem that using sampling intervals as large as 300 seconds would be inefficient as an entire dive or surfacing interval could be missed between successive collected data points. Therefore, a compromise somewhere at the smaller sampling rates (every 5-10 seconds) would be best to ensure reliable data collection and to minimize memory use by the device. Six of the 29 studies (~21%; Table 2) did not report the sampling rates of the devices they used. The size and weight of the devices could also affect the dive patterns performed by the turtles. Of the 29 studies being reviewed, only 14 (~48%) included information on the size and weight of the devices they used (Table 2). Most of the devices are fairly small, and the authors explain that they represent only 1-2% of the turtle’s body weight, making it unlikely that they will affect their diving behavior. However, the larger the device, such as the Crittercam (Heithaus et al. 2002; Seminoff et al. 2006; Hays et al. 2007) which weighs 2000 g, the more likely it is to pose serious hydrodynamic problems for the turtles even if rendered neutrally buoyant in the water. Lastly, the electronic devices (particularly satellite-loggers) will bin the data they collect into averages, thus minimizing the amount of data they must store and deliver. However, the 23 560 565 570 575
  • 24.
    longer the periodof time before a binning event takes place, the more details of the actual data collected will be lost. Of the studies discussed here, binning times ranged from 0.05 hr (Brill et al. 1995) to 12 hr (Hays et al. 2001b) intervals. STUDYING, ORGANIZING, AND ANALYZING BEHAVIORAL DIVE DATA: A number of different methods can be used to study and organize data turtle dive behavior data once it has been collected. One of the most prominent methods, as discussed above, is to display the data in a dive profile, showing depth vs. time. Dives are classified in a variety of ways, for instance based on their maximum depth, duration, descent rate, ascent rate, and bottom time (Fedak et al. 2001). Diving studies often use multiple metrics as evidenced by the literature review of these 29 studies (Table 3). The more methods used to study the dive data, the more thorough the analyses that can be done, thereby leading to more certain results as the data collected by each different method reinforces the others. The 29 studies discussed in this review use an average of 2.9 (±1.6 S.D.) methods to organize the dive data. Five studies (Renaud et al. 1995; Hays et al. 2001b; 2002b; Heithaus et al. 2002; Quaintance et al. 2002) use only one method, greatly limiting the reliability of their results, while the studies by Hays et al. (2004a) and Yasuda and Arai (2009a) use seven different methods, possibly making these two the most reliable of the 29 studies reviewed here. Letter-Shaped Dives Perhaps the most prominent way to characterize dive patterns is by classifying each dive as a distinct type (name). In 13 of the 29 reviewed studies (~45%), this was accomplished by organizing and naming the dives after letters in the alphabet which the dives resemble. In most 24 580 585 590 595 600
  • 25.
    studies, dives arelimited to U-dives (dives that look like the letter “U” in a dive profile) and V- dives (dives that look like the letter “V” in a dive profile; Figure 2). The problem with comparing the incidence of these letter-shaped dives across studies is that (different) investigators use slightly different definitions for the dive shape, which are based not only on other parameters (such as ascent/descent speed, bottom time) within and across dives, including whether the dive pattern is repeated, and (most dangerously) by what behavior the turtle performs during the dive. The generally accepted definition of a U-dive is a dive straight to the seabed, with the ascent and descent separated by a lengthy flat bottom profile (Glen et al. 2001). Some authors have an even simpler definition – a dive with constant bottom depth on the seabed (I-Jiunn 2009). However, some authors define a U-dive in much greater depth. For example, Southwood et al. (2003) make their definition of a U-dive very precise – the authors define it as a steady descent to a maximum depth at a descent rate of 0.12 ± 0.01 m/sec, thereafter staying within 75% of the maximum depth for a certain length of time (called bottom time) before steadily ascending at a rate of 0.12 ± 0.01 m/sec back to the surface. Or, Yasuda and Arai (2009a) define a U-dive as a dive where the turtle remains within 50 cm of the maximum dive depth for more than 80% of the duration of the dive. U-dives are the most common type of dive recorded by adult female green turtles at inter-nesting sites (Hochscheid et al. 1999). This is one of the main factors that has led researchers to typically believe that U-dives are considered to be resting dives which help to minimize energy expenditure and maximize reproductive output (e.g. Hays et al. 2000; I-Jiunn 2009), recent studies suggest this assumption may not be warranted since a great deal of movement often occurs on the sea floor (e.g., Hazel et al. 2009). For example, in a study by Hochscheid et al. (1999), U-dives were observed to include stationary and active foraging along 25 605 610 615 620 625 50
  • 26.
    the bottom. However,in a study by Bell et al. (2009) at Raine Island in the northern Great Barrier Reef, U-dives occurred mainly during nighttime, and were assumed to be resting dives. Similar resting behavior on U-dives was noted by Makowski et al. (2006) and by Hays et al. (2004a), which documented no flipper beats during the bottom portion of a U-dive, suggesting resting behavior. Another common letter-shaped dive is the V-dive, which has been described as an active bounce dive (Makowski et al. 2006), in which the turtle descends at a constant rate, and once reaching a maximum depth, immediately returns to the surface (e.g., Bell et al. 2009). V-dives are classically shorter in depth and time than U-dives (e.g., Hochscheid et al. 1999), and are most often associated with either foraging or searching the water column for food or a place to rest (e.g., Southwood et al. 2003). Because multiple behaviors by turtles have been witnessed during these dives, researchers must proceed with caution when inferring specific behaviors from individual dive profiles. As turtle diving is not limited to only these two shapes, other authors have used other letters to define additional dive profile shapes. Hochscheid et al. (1999) defines an S-dive as a dive of rapid descent to maximum depth, followed by ascent to a specific depth, a much slower ascent over a specific time, and finally rising to the surface at a quicker ascent rate. The authors have interpreted this type of dive as a way of saving energy by using buoyancy to float to the surface rather than by actively swimming. In Salmon et al. (2004), W-dives were described as two (or more) consecutive V-dives without a surfacing in the middle. This type of a dive was demonstrated to be a foraging dive for turtles, but was only seen in leatherback (Dermochelys coriacea) hatchlings. Furthermore, some dives do not appear to resemble a specific letter, and 26 630 635 640 645
  • 27.
    are thus classifiedas “other” dive types (Southwood et al. 2003). The existence of other unclassified dives highlights the need for other criteria beyond labeling dives by letter-shapes. Number-Labeled Dives Classifying dive types by assigning each dive shape an arbitrary number is another method for studying and organizing turtle dive behaviors, but is much rarer than labeling dives by letter. This method was utilized by 4 of the 29 studies (~14%) discussed here (Table 3). However, just like the letter-based dive system, each study labeling dives by the number-based system uses a slightly different definition for each dive type, and each study divides the dive shapes into a different number of categories, further inhibiting comparisons across studies. For example, Rice and Balazs (2008) divided dive profile shapes into four categories (Figure 3). Type 1 dives are shallow dives less than five meters in depth. Type 2 dives are greater than five meters deep, and longer than ten minutes, with a steep descent to depth followed by a gradual ascent to the surface (possibly similar to a V-dive, described above). Type 3 dives are also greater than five meters and longer than ten minutes, but the initial descent is to a depth greater than in Type 2 dives, with a rapid ascent followed by a slow ascent (possibly similar to an S- dive, described above). Finally, Type 4 dives are U-shaped, greater than five meters in depth, with at least 90% of the dive spent at the maximum depth. Rice and Balazs (2008) assumed this last type of dive was a resting dive, but this assertion is complicated by the lack of visual confirmation. However, these dive types were associated with different habitats: Type 1, 2, and 3 dives occurred in the pelagic environment, while Type 4 dives occurred in shallow water after their oceanic migration where the turtle could reach the bottom (Rice and Balazs 2008). 27 650 655 660 665 55
  • 28.
    Hays et al.(2001a) used different definitions for dive Types 1 and 2. The former were dives with steep descent to maximum depth, with a gradual ascent phase followed by a rapid ascent phase. Type 2 dives involved diving to a deeper depth than in Type 1 dives, followed by the same gradual and quicker ascent phases (Hays et al. 2001a). In a study by Seminoff et al. (2006), the authors identified six different dive types (Figure 4), and showed that foraging occurred on dive Types 1, 3, and 5, both in the mid-water column and on the bottom substrate. Resting only occurred during Type 1 dives and Type 2 dives were used as exploratory dives to survey benthic habitat (Seminoff et al. 2006). Finally, some studies used a combination of both letter-titled dives and number-labeled dives. Hays et al. (2004a) describes U, V, Type 1, and Type 2 dives within their study. Dive Angle The six studies (out of the 29 discussed; ~21%) in which the dive angle was recorded for green sea turtles all utilized other analysis methods (Table 3). Two studies demonstrated that green turtle dive angle is initially quite steep (~60 degrees), followed by a much shallower angle upon reaching the benthos (~15 degrees; Glen et al. 2001; Yasuda and Arai 2009a). This result implies greater energy to overcome positive buoyancy at the surface, with smaller resistance at depth. These studies suggest that dive angles of 90 degrees are very rare in marine animals, since this would not allow to scan for profitable foraging or resting areas and to look out for predators (Glen et al. 2001). 28 670 675 680 685 690
  • 29.
    Flipper Beats Counting thenumber of flipper beats is another great method for quantifying sea turtle diving behavior. While this method does not require the use of a dive profile to determine dive behaviors, it can augment the use of TDRs. Flipper beats can show if a dive is one of active swimming, or inactive resting, and could even be a crude proxy for metabolic rate (Hays et al. 2004a). It also seems that flipper beat frequency changes with depth, similar to other diving species such as mammals and birds (Yasuda and Arai 2009a). Of the 29 studies reviewed, only four (~14%) used this method to analyze dive data (Table 3). All of these studies (Hays et al. 2004a; Salmon et al. 2004; Hays et al. 2007; Yasuda and Arai 2009a) used multiple methods to study turtle dive behavior, greatly reinforcing any inferences made regarding the turtle’s behavior. Swimming Speed Swimming speed, recorded in seven of the 29 reviewed articles (~24%; Table 3) is directly related to flipper beat frequency (Yasuda and Arai 2009a), but both methods of analyzing dive behavior are used in only three of those studies (Hays et al. 2004a; Salmon et al. 2004; Yasuda and Arai 2009a). Swimming speed could be used as an indicator of behavior – non-movement or slow speeds likely represent resting or gliding, moderate speeds may represent foraging or swimming, and fast speeds may represent predator avoidance. However, again, it is unwise to infer behavior from swimming speed alone. For instance, water temperature (Frick 1976), dive depth (Yasuda and Arai 2009a), and time of day (Senko et al. 2010) may influence swimming speed, and thus any inferences that would be made regarding behavior. 29 695 700 705 710 715
  • 30.
    Coefficient of Variation Arelatively unused methodology to analyze dive behavior was by calculating the coefficient of variation (CV) of the depth of the bottom phase of the dive. This was done in only one of the 29 studies discussed here (Blumenthal et al. 2010; ~3%; Table 3), but was also used to determine activity level of hawksbill turtles in two other studies (Blumenthal et al. 2009; Witt et al. 2010). This method can show the variation in maximum diving depths – the larger the variation, the more likely the turtle is to be active, possibly swimming or foraging. If the CV is a relatively small value, the turtle is more likely to be resting or not moving while on the benthos (Blumenthal et al. 2010). This methodology again requires inferences to be made, and would be best to be followed up with visual confirmation of behavior. Dive Length and Dive Depth Classifying dives by their duration and depth was the most common method used for analyzing turtle dive behavior in the 29 studies reviewed here (Table 3). Twenty-six of the studies (~90%) discussed dive length, while 23 (~79%) discussed dive depth. It is likely that some articles may have only discussed one analysis method and not the other because in a study by Yasuda and Arai (2009a), dive length and dive depth were found to be linearly related, meaning that only one type of analysis would be needed. Because dive length and depth are the key components for describing a dive profile, they are critical to making inferences regarding the behaviors associated with dives. Thus, studies that do not report one (or both) of these factors but yet define dive behaviors should be read with caution since these metrics are essential for objective analysis of diving behavior (e.g. Brill et al. 1995; van Dam and Diez 1996; Hays et al. 2000; Godley et al. 2002; Hays et al. 2002a). 30 720 725 730 735 60
  • 31.
    Other Ways toStudy, Organize, and Analyze Dive Behavior Other than those methods mentioned in Table 3, there can be various other means of studying, organizing, and analyzing dive behavior. For instance, the amount of surface activity (number of breaths, number of surfacing events, time spent at surface, etc.) could be used to infer dive behavior (Seminoff et al. 2001). Or, a change in water temperature could relate to changes in dive behavior – it is likely that turtles would be more active with higher water temperatures and less active in colder water temperatures (Blumenthal et al. 2010). AUTHORS’ DEFINITIONS OF BEHAVIORS: As evidenced when analyzing these articles, almost every single study uses different definitions for foraging and resting behaviors, if discussed at all. In fact, foraging behavior was defined in only 11 studies (~38%) and resting was defined in 17 studies (~59%; Table 4). In summary, whereas dives of short duration with continuous depth fluctuations during the bottom phase of the dive are considered to represent foraging behavior (e.g., Brill et al. 1995; van Dam and Diez 1996; Makowski et al. 2006), longer dives of a continuous fixed-depth (for instance, U- shaped dive profiles), are generally considered to be resting dives (e.g., Hochscheid et al. 1999; Hays et al. 2000; Southwood et al. 2003). For example, Hays et al. (2000) was confidently able to conclude that long U-dives to the benthos were resting dives off of Ascension Island, as the adult female turtles were likely resting between nesting attempts to maximize their reproductive output. Furthermore, because there is little or no food available at the site, foraging is highly unlikely. Turtles are capable of storing energy for long periods of time during these nesting events, with no need to forage (Hays et al. 31 740 745 750 755 760
  • 32.
    2000). Conversely, shortdives with heightened activity are likely associated with foraging, since increased activity increases metabolic demands, requiring more energy to be ingested to offset the metabolic loss (Hazel et al. 2009). However, these definitions are not always absolute. For instance, Hays et al. (2001a) defined a type of resting behavior in the water column, but while the turtle rose passively off the bottom back up to the surface. Or, Schofield et al. (2006) also states that basking, where the turtle is between the surface and one meter depth with its head and flippers lowered constitutes as resting behavior. Thus, flexible dive behaviors cannot have absolute definitions, since they can be influenced by a multitude of factors, discussed later in this review. Two of the 29 studies describe two other types of behaviors – mating (Hays et al. 2001b) and active (I-Jiunn 2009; Table 4). Schofield et al. (2006), which describes the diving behaviors of loggerhead sea turtles, describes many behaviors (including foraging and resting) in great length – swimming, self-cleaning, fish-cleaning symbiosis, contests between individuals, and reproduction. To best understand how researchers are analyzing the dive data they have collected, it helps to have a clearly stated definition of the behaviors they are describing. STUDY SITE LOCATIONS: Green turtle diving behavior studies have taken place in a wide variety of locations, ranging from tropical to subtropical regions all over the world (Bjorndal 1980; Southwood et al. 2003). A comparison of the locations of the 29 studies reviewed can be found in Table 5. Fourteen of the 29 studies (~48%) focused on inter-nesting sites, with the majority being published in the early part of the 2000s. Many studies took place either off Cyprus (Hochscheid et al. 1999; Glen et al. 2001; Godley et al. 2002; Hays et al. 2002a; 2002b) or Ascension Island 32 765 770 775 780 65
  • 33.
    (Hays et al.1999; 2000; 2001b; 2002a; 2002b; 2004a). It was not until the mid to late 2000s that a greater number of studies were conducted at foraging sites (e.g., Makowski et al. 2006; Seminoff et al. 2006; Hays et al. 2007; Hazel et al. 2009; Blumenthal et al. 2010). This pattern follows the same trend of TDR application – the first study locations were nesting beaches, where turtles were easily captured and tagged, with high certainty that the nesting mothers would return to the beach before migrating away as female turtles lay multiple clutches in one nesting season (Balazs et al. 1987; Åkesson et al. 2003). Later in the decade, with the advent of more advanced TDRs, the devices were used at foraging sites, as well. Additionally, there had been a general paucity in data regarding turtle diving behavior at foraging locations before the mid- 2000s, which prompted a large number of studies at this type of location with the advancement of the TDR technology. Only five of the 29 studies (~17%) focus solely, or in part, on the diving behavior during migration (Hays et al. 1999; Hays et al. 2001a; Godley et al. 2002; Hatase et al. 2006; Rice and Balazs 2008), likely because there is a great amount of published literature regarding marine turtle migrations across ocean basins. Conversely, only one study took place in a nursery habitat location (Salmon et al. 2004), due to the difficulties associated with tagging and tracking newly hatched turtles. To accomplish this study, the authors raised the turtles in their own facility and attached tracking devices which were nearly the size of the turtles themselves, which could have greatly biased the results of their research. STUDY SAMPLE SIZES: The number of turtles tagged in behavioral studies is generally very small (Table 5). The average number of turtles tagged (with usable data) in the 29 studies being discussed was 9.2 (± 33 785 790 795 800 805
  • 34.
    8.1, S.D.) turtles.Such a small number of turtles could greatly bias any results, especially since it is possible that each turtle could display unique behavior, greatly inhibiting the analysis. In fact, of the 29 studies, 11 (~38%) studied five or less turtles, with two studies using only one turtle for its entire study (Rice et al. 2000; Glen et al. 2001). The largest number of green turtles studied was 33 by Salmon et al. (2004) and 34 by Seminoff et al. (2006). Studies conducted at foraging sites used the most turtles per study, at an average of 10.5 (± 9.4, S.D.). Studies regarding at sea migrating behavior used on average 8.8 turtles (± 5.7, S.D.), and inter-nesting sites collected data from an average of 5.7 turtles (± 3.4, S.D.) per study. It is very likely that most studies use a small number of turtles because the satellite-loggers and TDRs are quite expensive – one device can cost $3000-5000, greatly limiting the number that can be used. Additionally, research permits to attach these devices to turtles can be difficult to obtain and expensive as well. FACTORS INFLUENCING DIVE BEHAVIOR: In the articles reviewed, a whole host of factors influenced turtle behavioral patterns (Table 6). Of the ten different factors discussed here, seven articles (~24%) only addressed two of these factors, while one article amazingly discussed none of them (Yasuda and Arai 2009b). Two articles (~7%), however, discussed the maximum of seven of these ten factors (Hazel et al. 2009; Yasuda and Arai 2009a). It is very likely that there are many other factors not discussed in these articles or in this literature review that could potentially be important in understanding and analyzing green turtle dive behavior. For instance, tidal influence is not discussed by any of the 29 articles. The factors specifically mentioned in the reviewed articles are discussed below. 34 810 815 820 825 830
  • 35.
    Turtle’s Activity atSite The turtle activity at the dive location (nesting, foraging, migrating, etc.) influences the dive behaviors of green sea turtles. In turn, these activities are influenced by habitat type and quality (Hays et al. 2002a; Makowski et al. 2006). This pervasive factor affecting turtle behavior was discussed in 22 of the 29 articles (~76%; Table 6). Generally speaking, green turtles are more quiescent while at inter-nesting habitats, and remain quite active during migration (Hays et al. 1999). Yet, the local habitat characteristics influence their diving behavior. For example, green turtles off the coast of Ascension Island and Japan dive to similar depths (20-25 m), but at Ascension Island, they engage in resting dives to the sea floor (Hays et al. 2000), while off Japan they engage in foraging as well as resting dives (Hatase et al. 2006). Therefore, the turtle’s activity at the site drives their behaviors – to feed in an area of great forage (Japan), and to perform resting dives in an inter-nesting location (Ascension Island, Hays et al. 2001b). Moreover, feeding habits of green turtles may also differ based on the foraging location of the turtle, for instance if it is foraging while free-swimming in the open ocean or while on a shallow coral reef habitat, or foraging on a shallow mud flat (Brill et al. 1995; Hochscheid et al. 2005). When at foraging locations, it is likely that turtles may actually avoid diving into deeper water due to a lack of forage available there (Senko et al. 2010), thereby avoiding their primary purpose for being in the area in the first place. It is generally believed that turtles do not forage at nesting grounds because food is usually sub-optimal (Godley et al. 2002). Instead, the inter-nesting behavior of marine turtles is generally related to optimizing their energy reserves in a way most suited to the local conditions associated with nesting (Houghton et al. 2002). Energy conserved during this time period can greatly influence their reproductive output (Hays et al. 2000). Upon arriving at Ascension Island 35 835 840 845 850 70
  • 36.
    after their oceanicmigration, the duration of dives tends to be quite short (average of 7.3 minutes), but during the inter-nesting period, they are much longer (average of 22.1 minutes). Additionally, turtles performed shallower dives immediately after nesting, with dives becoming deeper gradually over the following days. Prior to the next nesting event, however, dives once again became very shallow (I-Jiunn 2009). These results suggest inactivity during the inter- nesting period, specifically around nesting events, with lower metabolic rates and aerobic dive limits (Hays et al. 1999). Even though these are inter-nesting sites, where resting dives tend to be more of the norm, there is evidence that diving is shaped by the local environmental conditions (Hochscheid et al. 1999; Hays et al. 2002a). Off the coast of Cyprus, another inter-nesting location, green turtle dives are concentrated in shallow water seagrass areas, creating great variation in the dive profiles (Hochscheid et al. 1999; Hays et al. 2002a). On the other hand, at Raine Island, off the coast of Australia, turtles dive in shallow water habitat adjacent to the reef edge and return to the shallow reef structure for refuge at night (Bell et al. 2009). During oceanic migrations, turtles occasionally perform deep dives with steep descents (which are not possible in shallow habitats), followed by a very gradual ascent back to the surface (Hays et al. 2001a; Hatase et al. 2006). While green turtle dives tend to be short (three to four minutes) with near surface traveling, lengthier dives of thirty minutes have been recorded, suggesting that the turtles may actually be resting just below the water surface (Hays et al. 1999; Godley et al. 2002). There is no need for green turtles to make deep dives while migrating, as they do not need to search for prey in the deep water, as other species of sea turtles do. Remaining close to the surface, therefore, minimizes the energetic cost of traveling, explaining why the turtles stay close to, but not at, the surface (Godley et al. 2002). It has been 36 855 860 865 870 875
  • 37.
    experimentally calculated thatdrag on the sea turtles is minimized at the depth of 2.5 to three times the animal’s body thickness, and therefore turtles should spend the majority of their time during migration at a depth of 0.9-1.5 m. During the migration from Ascension Island to Brazil, TDRs confirmed that green turtles were performing short (two to four minutes), shallow (0.9-1.5 m) dives, consistent with near-surface traveling (Hays et al. 2001a). Longer dives during open-water migration are generally associated with inactivity, since herbivorous green turtles likely do not feed during migration (Hays et al. 1999). However, Hatase et al. (2006) has shown that green turtles may actually forage on plankton and jellyfish throughout their deep-water migrations, suggesting that the oceanic habitat turtles migrate through may influence their diving behavior. Nevertheless, if long and deep dives do occur, they are usually near the end of the migration along the coastline, possibly suggesting that turtles are using shelf-break structures to rest or forage (Godley et al. 2002). Water Temperature Water temperature is another factor discussed in green turtle dive behavior studies (11 out of 29 studies, ~38%; Table 6). As green turtles cannot raise their body temperature more than one to three degrees Celsius above the water temperature year-round (Sato et al. 1998; Southwood et al. 2003), it is expected that a tight coupling between water temperature and turtle behavior should exist (Godley et al. 2002). Turtles can use different behaviors to thermo- regulate. In Kaneohe Bay, they make use of the mud bottoms to avoid overheating in warm water (Brill et al. 1995). For instance, offshore movement of two turtles changed within a few days of each other, which was attributed to the change in water temperature (Godley et al. 2002). In a foraging ground off Australia, colder water temperatures influenced dive durations by green 37 880 885 890 895 75
  • 38.
    turtles. Cold waterdives were three to four times longer in mean duration and six times longer in maximum duration than warm water dives (Hazel et al. 2009). In other situations, green turtles are known to bask on shore, where they can raise their body temperatures by ten degrees Celsius (Whittow and Balazs 1982), which may allow them to be more active in cooler water temperatures. Thus, turtles likely are expected to change their behavior in different water temperatures. Because water temperature is expected to influence turtle physiology, such as metabolic rate and energy input/output, eight of the 11 studies discussing water temperature also discuss these factors. Turtles have been shown to have a lower metabolic rate in colder water (Sato et al. 1998; Hazel et al. 1999; Hays et al. 2002b; Southwood et al. 2003). This may help to explain longer and deeper dives at inter-nesting sites such as Ascension Island (Godley et al. 2002). Buoyancy was also another important factor, with eight of the 11 studies also discussing this factor. Season Even though a large sample of these papers discusses factors relating to water temperature, very few look at the larger scale of how seasons can affect turtle behavior (only five out of 29, ~17%; Table 6). Seasonal change in behavior is likely the result of environmental and physiological factors (Southwood et al. 2003). In particular, green turtles may alter their behavior due to multiple cues from seasonal change: water temperature, photoperiod, and food availability. Some studies have shown that during winter, turtles tend to dive deeper and longer than in the spring and summer (e.g., Godley et al. 2002; Southwood et al. 2003). In a study of the inter-nesting site of Cyprus, green turtles were recorded spending the warmer months at 38 900 905 910 915 920
  • 39.
    shallower depths anddiving deeper (>45 m) during the winter. Furthermore, turtles spent less time at the surface in winter than during spring and summer (Godley et al. 2002). At Heron Island, Australia, green turtles also showed great variability in their mean dive depths by season: diving to 4.4 ± 0.6 m (S.E.) in winter and to 2.9 ± 0.4 m (S.E.) in summer. Accordingly, winter dive durations nearly doubled those observed in summer (Southwood et al. 2003). It is possible that during the cold winter months, turtles may enter a state of diapause (hibernation) or may migrate to warmer waters. These behaviors are common in turtles, but mainly in freshwater turtle species which are capable of remaining submerged for many months, capable of surviving in frozen water (Godley et al. 2002). This phenomenon has very rarely been recorded for any marine turtle species. Sea turtles may simply avoid cold water by migrating seasonally, as has been recorded by sea turtles in the Atlantic Ocean (Mendonca 1983; Musick and Limpus 1997). However, in sites and instances when adverse conditions cannot be avoided, sea turtles may engage in hibernation (Godley et al. 2002). Tide None of the 29 articles reviewed here discussed how tidal movements may influence a turtle’s dive behavior (Table 6). However, in a study by Brooks et al. (2009), tracking the horizontal movement patterns (but not the diving patterns) of green turtles in the East Pacific, it was shown that movement patterns were circa-tidal. Turtles floated along with the tide, allowing them to exploit a patchy distribution of algae in the region. Because this behavior may help to explain how green turtles forage, tidal movements may influence dive behavior. Also, by traveling with tides, turtles can expend less energy to reach their habitats or destinations (Hazel 39 925 930 935 940
  • 40.
    2009), and thusfocus more energy to their diving behavior. However, further studies are needed to determine this potential relationship. Time of Day As discussed in 19 of the 29 papers (~66%; Table 6), turtle diving behavior is greatly influenced by time of day (e.g., Brill et al. 1995; Makowski et al. 2006; Bell et al. 2009). For example, in studies by Mendonca (1983) and Brill et al. (1995), green turtles showed specific diving depths during day and night times. And, at Ascension Island, more resting dives were recorded during nighttime than during daytime (Hays et al. 2000). As with season, the time of day may also influence the way in which dives are categorized and studied. In research by Hays et al. (2001a), the authors documented a higher incidence of Type 1 and 2 dives at night than during the day. At Raine Island in the northern Great Barrier Reef, flat-bottomed U-dives were recorded extensively at night (Bell et al. 2009). In some locations, turtles perform different diving behaviors during the day than at night. In Kaneohe Bay, most turtles spent daytime hours in deep mud channels, while only a few would remain in the shallower foraging grounds (Brill et al. 1995). While the peak foraging times for green turtles are after dawn and in the late afternoon (Bjorndal 1980; Mendonca 1983), foraging occurs throughout the day (Southwood et al. 2003). Some studies report that turtle diving behavior at night is characterized by short, shallow dives. For example, at Heron Island off Australia, there are visual observations of shallow resting dives (Southwood et al. 2003). In Kaneohe Bay, Hawai’i, green turtles also perform short, shallow dives at night, but these are foraging dives (Brill et al. 1995). During their inter- nesting interval at Ascension Island, female green turtles perform short resting dives at night 40 945 950 955 960 965 80
  • 41.
    leading up totheir nesting events. However, some individuals perform long, deep dives at night, especially at the beginning and end of the inter-nesting interval (Hays et al. 1999). Off the coast of Japan, green turtles were recorded resting in water over 20 m depth at night, much deeper than their traveling depths during the day (Hatase et al. 2006). Also at a foraging site off Florida, longer, deeper dives were made at night than during the day. Additionally, night dives were always to a constant depth while daytime dive depths were much more variable, suggesting foraging during daylight hours and resting at night (Makowski et al. 2006). The same pattern of short, shallow diurnal foraging dives and longer, deeper nocturnal dives was also recorded at Heron Island, suggesting the turtles were more active during the day (Hazel et al. 2009). Many studies show that green turtles prefer deeper water at night (e.g., Bjorndal 1980; Seminoff et al. 2001; Makowski et al. 2006; Taquet et al. 2006; Hazel et al. 2009), but other studies show that turtles prefer shallower water at night (e.g., Brill et al. 1995; Seminoff et al. 2002; Southwood et al. 2003; Yasuda and Arai 2009a). This result underscores that variability in dive behavior exists even within individual turtles. Green turtles also engage in day/night differences in diving during migrations. During transit between O’ahu, Hawai’i and the Northwest Hawaiian Islands, turtles make short, shallow dives during the day (1-18 min, 1-4 m), and long, deep dives in the evening and at night (35-44 min, 35-55 m). One turtle even dove down to 135 m at night, the deepest dive ever recorded for a green turtle. The authors found this deep diving behavior unexpected as they would slow the turtle’s migration toward its final destination (Rice and Balazs 2008). However, the same diving behavior of long, deep dives at night and short, shallow dives during the day was recorded by Hays et al. (1999) when studying turtles migrating between Brazil and Ascension Island. These authors attributed the deeper dives to mid-water resting dives due to an innate diurnal cycle 41 970 975 980 985 990
  • 42.
    driving the turtlesto sleep during the night and travel during the day (Hays et al. 1999). The reasons that some turtles dive deeper at night during some migrations, while in other locations they dive deeper during the day remain unknown. However, this disparity may be related to diel cycles in prey availability and predation risk, with additional individual variability (Hazel et al. 2009). Current While currents may affect green turtle dive behavior, they are seldom reported in the literature, discussed in only two studies (~7%) of the 29 reviewed here (Hays et al. 1999; Yasuda and Arai 2009a; Table 6). It is likely that this factor plays a key role in determining dive behavior during long migrations (Brooks et al. 2009). In the study by Hays et al. (1999), green turtles followed the west-southwest currents away from Ascension Island toward Brazil to begin their migration. It was concluded that currents play a major role in navigation and orientation for green turtles, and that they help to disperse newly hatched offspring leaving the island (Hays et al. 1999). If currents assist in migration, leading to less energy output by the turtles, they may allow them to stay at the surface rather than dive down to the depth of least resistance, as discussed above. Gender Turtle gender was only discussed in one study (~3%) reviewed here (Hays et al. 2001b; Table 6). Because the great majority of green turtle dive behavior studies take place at nesting beaches and inter-nesting locations, female green turtles are tagged much more often as they are the ones to come ashore to lay eggs for a few hours at a time, making it quite easy to attach either 42 995 1000 1005 1010 85
  • 43.
    a TDR orsatellite-logger to their carapace. However, this means that very little is known about male green turtle dive behavior (Hays et al. 2001b). And, at foraging locations, if the majority of turtles are sub-adult or immature in age, it is nearly impossible to tell female from male turtles. In the study by Hays et al. (2001b), two male adult green turtles were captured in the water at Ascension Island and tagged with satellite-loggers. During the mating season, it was shown that males performed much shorter dives than females. This suggests that males maintained much higher activity levels than females throughout the inter-nesting period, most likely because they are trying to locate and mate with as many females as possible to maximize their reproductive output. At the end of the inter-nesting period, male turtles would make much longer resting U- dives to build up energy for their long migration back to South America. Thus, it was concluded that green turtle resting behavior had very different implications for males and females during the inter-breeding season at Ascension Island – it was good for females to rest as the energy saved during these resting dives was used to maximize their egg-laying potential, while resting dives were considered negative for male turtles as it would mean lost time to potentially mate with female turtles (Hays et al. 2001b). Buoyancy Buoyancy is another important factor affecting green turtle dive behavior, which was discussed in 15 of the 29 articles (~52%) reviewed in this paper (Table 6). Unlike other diving animals such as penguins and seals, turtles take a breath before diving to adjust their lung volume to attain neutral buoyancy at their maximum depth (Milsom 1975; Hays et al. 2000; Houghton et al. 2002). At the start of a dive, turtles are positively buoyant with air in their lungs. As the dive continues and depth increases, lungs collapse proportionately to the change in 43 1015 1020 1025 1030 1035
  • 44.
    pressure according toBoyle’s Law, causing buoyancy to decrease (Glen et al. 2001; Hays et al. 2007; Yasuda and Arai 2009a). If the dives are deep enough, neutral, and potentially negative buoyancy will be reached (Hays et al. 2007). Studies have estimated that the maximum neutral buoyancy for a green turtle, based on fully inflated lungs, ranges between 15 and 20 meters in depth (Hays et al. 2004b), most likely near 19 m (Hays et al. 2000). Quite often, however, turtles will dive with only partially inflated lungs so that they reach neutral buoyancy at the desired depth (Hays et al. 2004b). Upon ascent, the lungs of the turtles expand once again, allowing the turtle to gain positive buoyancy as it rises, possibly assisting with the surfacing event (Hays et al. 2007). In a study by Glen et al. (2001), turtles started their dive at a large angle (60 degrees), lessening the dive angle to 15 degrees upon reaching the bottom substrate. This allowed the turtles to get through the most buoyantly resistive zone (near the surface) most efficiently (Glen et al. 2001). Buoyancy directly relates to energetics and metabolism. A steep initial descent, as shown in the study by Glen et al. (2001) requires a greater energetic effort to overcome the positive buoyancy at the surface. In a study by Hays et al. (2007), turtles worked hardest at the surface, and would beat their flippers 60-80 times per minute to overcome positive buoyancy, while they decreased their swimming effort to 25-40 beats per minute after the first 30 seconds of the dive. To start their ascent, turtles would beat their flippers 30 times per minute, with the rate lessening as the ascent continued, and would glide near the end of the dive up to the surface. This graded effort during different phases of the dive optimizes energy potential for fighting buoyancy (Hays et al. 2007), indicating that changing levels of buoyancy has important implications regarding turtle diving behavior (Hays et al. 2004b). This same pattern of flipper beating was documented in hatchling green turtles, aged 1-10 weeks old (Salmon et al. 2004). Additionally, it is rare for a 44 1040 1045 1050 1055
  • 45.
    turtle to divebelow 19-20 m, as this is their maximum neutral buoyancy depth. Diving deeper than this depth would cause negative buoyancy, leading the turtles to sink deeper, needing to expend more energy to overcome the negative buoyancy when returning to the surface (Hays et al. 2001a). Energetics / Metabolism As shown in Table 6, energetics and metabolism may be one of the most important factors influencing green turtle dive behavior, as it is discussed in 21 of the 29 articles (~72%). Blood oxygen stores are important for animals which perform breath-held dives – these animals typically have high blood hemoglobin levels (Brill et al. 1995). Berkson (1966) showed that the oxygen content within the lungs of green turtles is 17.4%, while Lutz and Bentley (1985) showed that blood and muscle tissue of green turtles can hold 6.7 mL of oxygen per kg, allowing them to remain submerged for extended periods of time. During submergence, green turtles show a reduced heart rate and cardiac output. With the turtle’s heart rate dropping by approximately 70% while diving (Southwood et al. 1999; Hochscheid et al. 2005), only the brain, heart, and lungs are continually irrigated by blood during dives (Brill et al. 1995). Submergence intervals undertaken by green turtles are strongly related to their activity level (Brill et al. 1995). If the turtle performs vigorous activity throughout a dive, such as foraging or swimming, turtles tend to surface sooner than if they perform resting dives (Southwood et al. 2003). Because heightened activity leads to increased metabolic costs and faster utilization of oxygen stores (Hays et al. 2004b), the turtle must return to the surface sooner to replenish the oxygen lost during the active dive. Thus, aerobic dive limits would be reached quicker by smaller sized green turtles as they have smaller volumes of tissue to store oxygen, and 45 1060 1065 1070 1075 1080 90
  • 46.
    higher metabolic rates(Salmon et al. 2004); thus larger turtles are capable of performing longer aerobic dives with a larger lung capacity (Blumenthal et al. 2009). After a long dive, turtles must surface to replenish their oxygen stores. Thus, the longer a turtle spends submerged, the longer it spends at the surface following the dive in order to replenish the oxygen lost during the previous dive and to release built up carbon dioxide (Hays et al. 2000). Turtles rarely, if ever, dive to their aerobic limits, meaning that they do not need to spend long surface intervals restoring their oxygen supply. At Ascension Island, resting turtles would surface after depleting approximately 50% of their oxygen stores (Hays et al. 2000). A study by Berkson (1966) initially concluded that a turtle could survive oxygen depletion for up to five hours underwater. However, this may have pushed the turtles into their anaerobic limits. More recently, Lutcavage and Lutz (1991) determined that it would take over 60 minutes submerged underwater for a green turtle to reach its aerobic limit. Since almost all dives recorded in the 29 reviewed studies were shorter than 60 minutes, green turtles seem to dive well below their aerobic limit on any dive. No matter what type of dive a turtle is performing, it is important for it to minimize its energy loss or maximize its energy gain on every dive that it makes. Measuring a turtle’s metabolic rate is a great way to assess their energetic loss/gain, as both go hand-in-hand (Hays et al. 1999). One method for turtles to maximize energy savings during a resting dive is to dive as deep as possible, while still maintaining neutral buoyancy, as the deeper the depth, the slower the metabolic respiration rate (Hays et al. 2002a), and less energy needed to fight positive or negative buoyancy to stay in place (Houghton et al. 2003). To minimize energy loss while ascending at the end of a dive, a turtle might rise passively, engaging in what could be considered to be a mid-water resting dive (Hays et al. 2001a). As stated previously, migrating 46 1085 1090 1095 1100 1105
  • 47.
    turtles can maximizeenergy savings by traveling near the surface in the zone of least resistance, at a depth approximately 2.5 times its diameter to swim (Godley et al. 2002). Another method to minimize metabolic rate would be for the turtle to bask in the sunlight on the shore (Swimmer and Balazs 2000). Additionally, basking on the shore (rather than the sea surface) saves energy as the turtle does not need to swim to the surface to breathe (Quaintance et al. 2002). On foraging dives, it may be more important to maximize energy gain rather than minimizing energy expenditure (Hays et al. 2002a). For benthic foraging to be beneficial, the energy gained by foraging must outweigh the energy used to descend, forage, and ascend back to the surface. Therefore, foraging dives may be shorter than resting dives since they use more energy, and thus deplete oxygen stores faster (Houghton et al. 2003). However, not all turtle behaviors can be explained merely using these energetic considerations. For instance, resting in shallow water suggests that metabolic rates would be higher than resting in deeper depths, and thus the turtle would need to surface sooner to replenish its oxygen store. During migrations between O’ahu and the Northwest Hawaiian Islands, green turtles routinely dove deeper than 20 m during their resting dives. This behavior suggests that they dove to depths in which they were negatively buoyant, implying that they would need to actively swim to keep from sinking. Moreover, the turtle would need to use more energy to overcome the negative buoyancy and to return to the surface (Rice and Balazs 2008). It is very likely that other factors influence turtle behavior in these scenarios beyond mere energetics. Predator Avoidance Predator avoidance may be another factor which greatly influences dive behavior, as discussed in eight of the 29 reviewed articles (~28%; Table 6). By diving to the sea floor and 47 1110 1115 1120 1125 95
  • 48.
    resting near verticalstructures, turtles minimize chances of being preyed upon while resting (Seminoff et al. 2006). Furthermore, by diving to deep depths, turtles can reduce the silhouette their body makes against the surface, reducing the chance of being detected by a shark. This behavior has been used to explain the deep dives of migrating turtles between Ascension Island and Brazil (Hays et al. 2001a), and provides a possible explanation for the deep dives conducted by green turtles during their migration between O’ahu and the Northwest Hawaiian Islands (Rice and Balazs 2008). Similarly, deeper dives in shallow water habitats during the night and shallower dives to hide within reefs during the day have been explained as a means to avoid shark predation (Makowski et al. 2006; Bell et al. 2009). And, hatchling green turtles at Tortuguero, Costa Rica, would slow their swimming speed toward the open ocean to dive to avoid predation by frigate birds (Frick 1976). Additionally, turtles generally have not been witnessed to dive at completely vertical angles to the sea floor. A possible explanation for this may be that 90 degree dives may limit their visibility to detect approaching predators, reducing their amount of vigilance in the event they must evade a predator (Glen et al. 2001). Very little attention has been given to predator avoidance – of the eight articles mentioning this factor, it was normally only briefly mentioned. One in-depth study (Heithaus et al. 2007) showed that skinny, unhealthy turtles take up habitat in foraging areas more at risk of predation (high risk, high reward) while fatter, healthier turtles lived in less profitable foraging habitats, but with less predation (low risk, low reward). However, no empirical studies (only modeling studies) have tested the effects of predation on diving behavior of green turtles. Further research in this area is greatly needed to best understand how turtles utilize their habitats, possibly by tagging both predator and prey with TDRs or satellite-loggers to evaluate how both organisms interact with their environment and each other. 48 1130 1135 1140 1145 1150
  • 49.
    Other Factors A fewother factors affecting dive behavior were briefly mentioned throughout the 29 reviewed articles. The turtles’ food source may affect their dive behavior – off the coast of Japan, green turtles foraging on zooplankton in deep water follow the diel vertical migrations of their prey (Hatase et al. 2006). Additionally, the turtle’s proximity to reefs and forage (for food and shelter) may affect their movements (Brill et al. 1995). Wave action could also influence dive behavior (van Dam and Diez 1996), or the need to be cleaned, whether visiting a cleaning station (Losey et al. 1994) or diving to rub its body against rocks (Heithaus et al. 2002) could alter diving patterns. Another factor which could greatly affect turtle diving behavior is that of human activity (Seminoff et al. 2001; 2002). For instance, boat activity could also influence a turtle’s dive behavior. While the capacity of turtles to avoid fast moving vehicles is still poorly understood, it has been shown that as boats increase their speed, it is more difficult for turtles to avoid them (Hazel et al. 2007). CONCLUSIONS: There appears to be no easy means for studying turtle dive behavior. The use of electronic tags which can be attached to the carapace of a turtle have helped researchers make great advances in dissecting how and why green sea turtles behave the way they do. However, each type of device used, whether it be a satellite-logger or a TDR has its own drawbacks, and careful consideration must be done to decide which type of device is best suited for the particular hypothesis and study at hand. Also, researchers must take into account the large array of factors 49 1155 1160 1165 1170
  • 50.
    which can affectan individual turtle’s dive behavior, and each must be given due process toward a final conclusion regarding the reasons behind a turtle’s behavior. In general, there is very little known about the habitat needs and movements of juvenile green turtles (Hart and Fujisaki 2010). Few studies (e.g., Southwood et al. 2003; Makowski et al. 2006; Hazel et al. 2009) were focused on the diving behavior of juvenile green sea turtles, as most studies focus on the inter-nesting period of adult females (Rice and Balazs 2008). Studying this age group is particularly more difficult because their movement patterns and residency times within a foraging habitat are much less predictable, leading to a higher risk of not retrieving the devices (and the dive data within). Therefore, most of our current knowledge regarding green turtle diving behavior is limited to adult females during the breeding, inter-nesting, or post- migration periods (Seminoff et al. 2001; Godley et al. 2008; Hazel 2009). After their vast oceanic migrations, green turtles leave the pelagic stage and return to the shallows to forage and grow to maturity in developmental habitats (Bjorndal 1980; Musick and Limpus 1997). Knowledge of turtle behavior after they finish their oceanic migration is very small (Godley et al. 2002). Currently, it is thought that turtles maintain distinct home ranges in their foraging grounds, and some return to the same grounds during different breeding seasons (Limpus et al. 1992). These shallow foraging grounds are more susceptible to the dangers posed by human activity (Campbell and Lagueux 2005), and therefore are in great need of study. In my proposed master’s thesis, I will study the vertical movements of juvenile green turtles in the Kawai’nui Marsh Estuary, an area approximately 0.5 x 0.5 km2 at the northern end of Kailua Bay, O’ahu, Hawai’i. This area is known to have a dense aggregation of juvenile green turtles year-round, many of which are resident at the location at different times of the year, or throughout the whole year (Asuncion 2010). This location is an area of high human use, 50 1175 1180 1185 1190 1195 100
  • 51.
    including activities suchas boating, kayaking, and fishing year-round (personal observation). Understanding how the turtles utilize the site is important to determine if human activity impacts these turtles in any way, and if regulations need to be put in place to protect this recovering species in this location. Therefore, a few of the studies discussed within this review will be of most use in the study I have proposed. For instance, the study by Brill et al. (1995) is of direct relevance as the study was conducted in Kaneohe Bay, a foraging ground for green turtles, which is directly next to Kailua Bay, where my proposed study will take place. However, adult green turtles are known to live in Kaneohe Bay, while juveniles take up residence in neighboring Kailua Bay. It is very likely that I will used the same definitions used by Brill et al. (1995) to describe foraging and resting behaviors: foraging dives will be composed of short and irregular submergence intervals, while resting dives will be regular long submergence intervals (Table 4). Because the Kawai’nui Marsh Estuary is a relatively shallow site, depth may not play a factor in the foraging/resting behaviors by the turtles. Another important study relating to my own is that of Southwood et al. (2003). Even though this study took place in Heron Island, Australia, it was one of the first to investigate the diving behaviors of juvenile green turtles within their foraging habitat. The sampling rates used by the author (either every five or 10 seconds for depth, every 60 seconds for temperature; Table 2) provide a trade-off between collecting fine-scale data without using up memory capacity too quickly. Makowski et al. (2006) performed a study regarding juvenile turtle diving behavior within a foraging ground, off Palm Beach, Florida. The authors used a Lotek Wireless TDR (Table 1), a very similar device to the ones which will be used in my proposed study, along with acoustic tracking of the turtles, with conclusive results. 51 1200 1205 1210 1215 1220
  • 52.
    Even though Blumenthalet al. (2009), Witt et al. (2010), and Schofield et al. (2006) discuss the behaviors of sea turtle species other than green sea turtles, these articles are quite pertinent to my own research. Blumenthal et al. (2009) discusses hawksbill diving behavior in the Cayman Islands; the methods used by Blumenthal et al. (2009) are very pertinent to my own study. Similar to Makowski et al. (2006), the authors used TDRs along with acoustic tracking to measure both the horizontal and vertical movements of the turtles. However, Blumenthal et al. (2009) also used focal observation to study hawksbill turtle diving behavior, marking the turtle’s immediate behaviors when it was initially captured and then recaptured to retrieve the electronic devices. However, this is just a basic form of visual observation of turtle behavior, and my study will utilize a more in depth methodology regarding visual surveys. Additionally, Witt et al. (2010) used Lotek TDRs along with acoustic transmitters on hawksbill turtles, which is also very similar to my own methodology. And, Schofield et al. (2006) uses a variety of visual survey methods to measure loggerhead diving behavior, like snorkel-swim surveys in which surveyors followed transects parallel to shore at a depth of three meters. Even though this surveying methodology is different than my own, it obtained thorough results and comparisons could be drawn to my own research. Lastly, however, the article that will likely be the most significant for my research is that of Hazel et al. (2009). In this study, the diving behaviors of foraging juvenile green turtles within a distinct home-range were quantified by the use of a TDR, with depth being recorded every 15 seconds (Table 2), still an acceptable range for collecting data in fine detail. The authors define foraging as short dives with consistent activity, and resting dives as dives of longer submersion with fewer surfacing events (Table 4). This may be the same pattern for the juvenile green turtles in my study site, since both foraging habitats are so similar in available 52 1225 1230 1235 1240 105
  • 53.
    food and depth.The authors took time to discuss seven different factors which potentially affect dive behavior (the turtle’s purpose at the site, water temperature, season, time of day, buoyancy, energetics/metabolism, and predator avoidance; Table 6). Research on turtles at small foraging sites remains scant, with the few existing studies focusing on regions where human-induced turtle mortality is not a concern (Rice and Balazs 2008). My research will shed some light on turtle behavior in a human-impacted area, and will help to lead the field toward devising ways to protect these juvenile turtles in their foraging home ranges. REFERENCES: Åkesson, S., Broderick, A.C., Glen, F., Godley, B.J., Luschi, P., Papi, F., and Hays, G.C. 2003. Navigation by green turtles: which strategy do displaced adults use to find Ascension Island? OIKOS 103:363-372. Asuncion, B. 2010. Characterizing juvenile green sea turtle (Chelonia mydas) habitat use in Kawai’nui, O’ahu: a multi-disciplinary approach. Master’s thesis, Hawai’i Pacific University, Kaneohe, HI. 89 pp. Balazs, G.H., Forsyth, R.G., and Kam, A.K.H. 1987. Preliminary assessment of habitat utilization by Hawaiian green turtles in their resident foraging pastures. U.S. Dep. Commer., NOAA Tech. Memo. NOAA-TM-NMFS-SWFC-71, 107 p. Bell, I.P., Seymour, J., Fitzpatrick, R., and Hogarth, J. 2009. Inter-nesting dive and surface behaviour of green turtles, Chelonia mydas, at Raine Island, Northern Great Barrier Reef. Marine Turtle Newsletter 125:5-7. Berkson, H. 1966. Physiological adjustments to prolonged diving in the Pacific green turtle (Chelonia mydas agassizii). Comparative Biochemistry and Physiology 18:101-119. Bjorndal, K.A. 1980. Nutrition and grazing behavior of the green turtle Chelonia mydas. Marine Biology 56:147-154. Blumenthal, J.M., Austin, T.J., Bothwell, J.B., Broderick, A.C., Ebanks-Petrie, G., Olynik, J.R., Orr, M.F., Solomon, J.L., Witt, M.J., and Godley, B.J. 2009. Diving behavior and movements of juvenile hawksbill turtles Eretmochelys imbricata on a Caribbean coral reef. Coral Reefs 28:55-65. 53 1245 1250 1255 1260 1265 1270 1275 1280
  • 54.
    Blumenthal, J.M., Austin,T.J., Bothwell, J.B., Broderick, A.C., Ebanks-Petrie, G., Olynik, J.R., Orr, M.F., Solomon, J.L., Witt, M.J., and Godley, B.J. 2010. Life in (and out of) the lagoon: fine-scale movements of green turtles tracked using time-depth recorders. Aquatic Biology 9:113-121. Brill, R.W., Balazs, G.H., Holland, K.N., Chang, R.K.C., Sullivan, S., and George, J.C. 1995. Daily movements, habitat use, and submergence intervals of normal and tumor-bearing juvenile green turtles (Chelonia mydas) within a foraging area in the Hawaiian Islands. Journal of Experimental Marine Biology and Ecology 185:203-218. Brooks, L.B., Harvey, J.T., Nichols, W.J. 2009. The movements of East Pacific green turtle Chelonia mydas at a foraging area in Baja California Sur, Mexico. Marine Ecology Progress Series 386:263-274. Campbell, C.L. and Lageuex, C.J. 2005. Survival probability estimates for large juvenile and adult green turtles (Chelonia mydas) exposed to an artisanal marine turtle fishery in the western Caribbean. Herpetologica 61:91-103. Cooke, S.J., Hinch, S.G., Wikelski, M., Andrews, R.D., Kuchel, L.J., Wolcott, T.G., and Butler, P.J. 2004. Biotelemetry: a mechanistic approach to ecology. Trends in Ecology and Evolution 19:334-343. Fedak, M.A., Lovell, P., and Grant, S.M. 2001. Two approaches to compressing and interpreting time-depth information as collected by time-depth recorders and satellite-linked data recorders. Marine Mammal Science 17(1):94-110. Frick, J. 1976. Orientation and behaviour of hatchling green turtles (Chelonia mydas) in the sea. Animal Behaviour 24:849-857. Glen, F., Broderick, A.C., Godley, B.J., Metcalfe, J.D., and Hays, G.C. 2001. Dive angles for a green turtle (Chelonia mydas). Journal of the Marine Biological Association of the United Kingdom 81:683-686. Godley, B.J., Richardson, S., Broderick, A.C., Coyne, M.S., Glen, F., and Hays, G.C. 2002. Long-term satellite telemetry of the movements and habitat utilisation by green turtles in the Mediterranean. Ecography 25:352-362. Godley, B.J., Blumenthal, J.M., Broderick, A.C., Coyne, M.S., Godfrey, M.H., Hawkes, L.A., and Witt, M.J. 2008. Satellite tracking of sea turtles: Where have we been and where do we go next? Endangered Species Research 4:3-22. Hart, K.M., and Fujisaki, I. 2010. Satellite tracking reveals habitat use by juvenile green sea turtles Chelonia mydas in the Everglades, Florida, USA. Endangered Species Research 11:221-232. 54 1285 1290 1295 1300 1305 1310 1315 1320 1325
  • 55.
    Hatase, H., Sato,K., Yamaguchi, M., Takahasi, K., and Tsukamoto, K. 2006. Individual variation in feeding habitat use by adult green sea turtles (Chelonia mydas): are they obligately neritic herbivores? Oecologia 149:52-64. Hays, G.C., Luschi, P., Papi, F., del Seppia, C., and Marsh, R. 1999. Changes in behaviour during the inter-nesting period and post-nesting migration for Ascension Island green turtles. Marine Ecology Progress Series 189:263-273. Hays, G.C., Adams, C.R., Broderick, A.C., Godley, B.J., Lucas, D.J., Metcalfe, J.D., and Prior, A.A. 2000. The diving behaviour of green turtles at Ascension Island. Animal Behaviour 59:577-586. Hays, G.C., Åkesson, S., Broderick, A.C, Glen, F., Godley, B.J., Luschi, P., Martin, C., Metcalfe, J.D., and Papi, F. 2001a. The diving behaviour of green turtles undertaking oceanic migration to and from Ascension Island: dive durations, dive profiles, and depth distribution. The Journal of Experimental Biology 204:4093-4098. Hays, G.C., Broderick, A.C., Glen, F., Godley, B.J., and Nichols, W.J. 2001b. The movements and submergence behaviour of male green turtles at Ascension Island. Marine Biology 139:395-399. Hays, G.C., Glen, F., Broderick, A.C., Godley, B.J., and Metcalfe, J.D. 2002a. Behavioural plasticity in a large marine herbivore: contrasting patterns of depth utilisation between two green turtle (Chelonia mydas) populations. Marine Biology 141:985-990. Hays, G.C., Broderick, A.C., Glen, F., Godley, B.J., Houghton, J.D.R., and Metcalfe, J.D. 2002b. Water temperature and inter-nesting intervals for loggerhead (Caretta caretta) and green (Chelonia mydas) sea turtles. Journal of Thermal Biology 27:429-432. Hays, G.C., Metcalfe, J.D., Walne, A.W., and Wilson, R.P. 2004a. First records of flipper beat frequency during sea turtle diving. Journal of Experimental Marine Biology and Ecology 303:243-260. Hays, G.C., Metcalfe, J.D., and Walne, A.W. 2004b. The implications of lung-regulated buoyancy control for dive depth and duration. Ecology 85(4):1137-1145. Hays, G.C., Marshall, G.J., and Seminoff, J.A. 2007. Flipper beat frequency and amplitude changes in diving green turtles, Chelonia mydas. Marine Biology 150:1003-1009. Hazel, J., Lawler, I.R., Marsh, H., and Robson, S. 2007. Vessel speed increases collision risk for green turtle Chelonia mydas. Endangered Species Research 3:105-113. Hazel, J. 2009. Evaluation of fast-acquisition GPS in stationary tests and fine-scale tracking of green turtles. Journal of Experimental Marine Biology and Ecology 374:58-68. Hazel, J., Lawler, I.R., and Hamann, M. 2009. Diving at the shallow end: Green turtle behaviour 55 1330 1335 1340 1345 1350 1355 1360 1365 1370 110
  • 56.
    in near-shore foraginghabitat. Journal of Experimental Marine Biology and Ecology 371(1):84-92. Heithaus, M.R., Marshall, G.J., Buhleier, B.M., and Dill, L.M. 2001. Employing Crittercam to study habitat use and behaviour of large sharks. Marine Ecology Progress Series 209:307-310. Heithaus, M.R., McLash, J.J., Frid, A., Dill, L.M., and Marshall, G.J. 2002. Novel insights into green sea turtle behaviour using animal-borne video cameras. Journal of the Marine Biological Association of the United Kingdom 82:1049-1050. Heithaus, M.R., Frid, A., Wirsing, A.J., Dill, L.M, Fourqurean, J.W., Burkholder, D., Thomas, J., and Bejdger, L. 2007. State-dependent risk-taking by green sea turtles mediates top-down effects of tiger shark intimidation in a marine ecosystem. Journal of Animal Ecology 76:837-844. Hochscheid, S., Godley, B.J., Broderick, A.C., and Wilson, R.P. 1999. Reptilian diving: highly variable dive patterns in the green turtle Chelonia mydas. Marine Ecology Progress Series 185:101-112. Hochscheid, S., Maffucci, F., Bentivegna, F., and Wilson, R.P. 2005. Gulps, wheezes, and sniffs: how measurement of beak movement in sea turtles can elucidate their behaviour and ecology. Journal of Experimental Marine Biology and Ecology 316:45-53. Hooker, S.K. and Baird, R.W. 2001. Driving and ranging behaviour of odontocetes: a methodological review and critique. Mammal review 31:81-105. Houghton, J.D.R., Broderick, A.C., Godley, B.J., Metcalfe, J.D., and Hays, G.C. 2002. Diving behaviour during the inter-nesting interval for loggerhead turtles Caretta caretta nesting in Cyprus. Marine Ecology Progress Series 227:63-70. Houghton, J.D.R., Callow, M.J., and Hays, G.C. 2003. Habitat utilization by juvenile hawksbill turtles (Eretmochelys imbricata, Linneaus, 1766) around a shallow water coral reef. Journal of Natural History 37:1269-1280. I-Jiunn, C. 2009. Changes in diving behaviour during the inter-nesting period by green turtles. Journal of Experimental Marine Biology and Ecology 381:18-24. Keinath, J.A. and Musick, J.A. 1993. Movements and diving behavior of a leatherback turtle, Dermochelys coriacea. Copeia 1993(4):1010-1017. Limpus, C.J., Miller, J.D., Paramenter, C.J., Reimer, D., McLachlan, N., and Webb, R. 1992. Migration of green (Chelonia mydas) and loggerhead (Caretta caretta) turtles to and from eastern Australian Rookeries. Wildlife Research 19:347–358. Lohmann, K.J., Lohmann, C.F. 1994. Detection of magnetic inclination angle by sea turtles: a 56 1375 1380 1385 1390 1395 1400 1405 1410 1415
  • 57.
    possible mechanism fordetermining latitude. Journal of Experimental Biology 194:23- 32. Losey, G.S., Balazs, G.H., and Privitera, L.A. 1994. Cleaning symbiosis between the wrasse, Thalassoma duperry, and the green turtle, Chelonia mydas. Copeia 1994:684-690. Lutz, P.L and Bentley, T.B. 1985. Respiratory physiology of diving in the sea turtle. Copeia 1985: 671–679. Makowski, C., Seminoff, J.A., and Salmon, M. 2006. Home range and habitat use of juvenile Atlantic green turtles (Chelonia mydas L.) on shallow reef habitats in Palm Beach, Florida, USA. Marine Biology 148:1167-1179. Mendonca, M.T. 1983. Movement and feeding ecology of immature green turtles (Chelonia mydas) in a Florida Lagoon. Copeia 1983:1013-1023. Mills, D.J., Verdouw G., and Frusher, S.D. 2005. Remote multi-camera system for in situ observations of behaviour and predator/prey interactions of marine benthic macrofauna. New Zealand Journal of Marine and Freshwater Research 39:347-352. Milsom, W.K. 1975. Development of buoyancy control in juvenile Atlantic loggerhead turtles, Caretta caretta. Copeia 1975:758-762. Moll, R.J., Millspaugh, J.J., Beringer, J., Sartwell, J., and He Z. 2007. A new ‘view’ of ecology and conservation through animal-bourne video systems. Trends in Ecology and Evolution 22:660-668. Musick, J.A. and Limpus, C.J. 1997. Habitat utilisation and migration in juvenile sea turtles. In Lutz, P.L. and Musick, J.A. (eds). The biology of sea turtles. CRC Press, Boca Raton, pp. 137–165. Myers, A.E., Lovell, P., and Hays, G.C. 2006. Tools for studying animal behaviour: validation of dive profiles relayed via the Argos satellite system. Animal Behaviour 71:989-993. Quaintance, J.K., Rice, M.R., and Balazs, G.H. 2002. Basking, foraging, and resting behavior of two sub-adult green turtles in Kiholo Bay Lagoon, Hawaii. Proceedings of the Twenty-Second Annual Symposium on Sea Turtle Biology and Conservation. NOAA Technical Memorandum NMFS-SEFSC-503, pp. 225-226. Renaud, M.L. and Carpenter, J.A. 1994. Movements and submergence patterns of loggerhead turtles (Caretta caretta) in the Gulf of Mexico determined through satellite telemetry. Bulletin of Marine Science 55(1):1-15. Renaud, M.L., Carpenter, J.A., Williams, J.A., and Manzella-Tirpak, S.A. 1995. Activities of juvenile green turtles, Chelonia mydas, at a jettied pass in South Texas. Fishery Bulletin 93:586-593. 57 1420 1425 1430 1435 1440 1445 1450 1455 1460 115
  • 58.
    Rice, M.R., Balazs,G.H., Hallacher, L., Dudley, W., Watson, G., Krusell, K., and Larson, B. Diving, basking, and foraging patterns of a sub-adult green turtle at Punalu’u, Hawai’i. 2000. Proceedings of the Eighteenth Annual Symposium on Sea Turtle Biology and Conservation. NOAA Technical Memorandum NMFS-SEFSC-436, pp. 229-231. Rice, M.R. and Balazs, G.H. 2008. Diving behavior of the Hawaiian green turtle (Chelonia mydas) during oceanic migrations. Journal of Experimental Marine Biology and Ecology 356:121-127. Salmon, M., Jones, T.T., and Horch, K.W. 2004. Ontogeny of diving and feeding in juvenile seaturtles: leatherback seaturtles (Dermochelys coriacea L) and green seaturtles (Chelonia mydas L) in the Florida current. Journal of Herpetology 38(1):36-43. Sato, K., Matsuzawa, Y., Tanaka, H., Bando, T., Minamikawa, S., Sakamoto, W., and Naito, Y. 1998. Inter-nesting intervals for loggerhead turtles, Caretta caretta, and green turtles, Chelonia mydas, are affected by temperature. Canadian Journal of Zoology 76:1651- 1662. Schofield, G., Katselidis, K.A., Dimopolous, P., Pantis, J.D., and Hays, G.C. 2006. Behaviour analysis of the loggerhead sea turtle Caretta caretta from direct in-water observation. Endangered Species Research 2:71-79. Seminoff, J. and Jones, T.T. 2006. Diel movements and activity ranges of green turtles (Chelonia mydas) at a temperate foraging area in the Gulf of California, Mexico. Herpetological Conservation and Biology 1:81-86. Seminoff, J., Resendiz, A., Smith, T.W., and Yarnell, L. 2001. Diving patterns of green turtles (Chelonia mydas agassizii) in the Gulf of California. Proceedings of the Twenty-First Annual Symposium on Sea Turtle Biology and Conservation. NOAA Technical Memorandum NMFS-SEFSC-528, pp. 321-323. Seminoff, J.A., Resendiz, A., and Nichols, W.J. 2002. Home range of green turtles Chelonia mydas at a coastal foraging area in the Gulf of California, Mexico. Marine Ecology Progress Series 242:253-265. Seminoff, J.A., Jones, T.T., and Marshall, G.J. 2006. Underwater behaviour of green turtles monitored with video-time-depth recorders: what’s missing from dive profiles? Marine Ecology Progress Series 322:269-280. Senko, J., Koch, V., Megill, W.M., Carthy, R.R., Templeton, R.P., and Nichols, W.J. 2010. Fine scale daily movements and habitat use of East Pacific green turtles at a shallow coastal lagoon in Baja California Sur, Mexico. Journal of Experimental Marine Biology and Ecology 391:92-100. 58 1465 1470 1475 1480 1485 1490 1495 1500 1505 1510
  • 59.
    Southwood, A.L., Andrews,R.D., Lutcavage, M.E., Paladino, F.V., West, N.H., George, R.H., and Jones, D.R. 1999. Heart rates and diving behaviour of leatherback sea turtles in the Eastern Pacific Ocean. Journal of Experimental Biology 202:1115-1125. Southwood, A.L., Reina, R.D., Jones, V.S., and Jones, D.R. 2003. Seasonal diving patterns and body temperatures of juvenile green turtles at Heron Island, Australia. Canadian Journal of Zoology 81:1014-1024. Swimmer, J.Y. and Balazs, G.H. 2000. The biology of basking in the green turtle (Chelonia mydas). Proceedings of the Eighteenth Annual Symposium on Sea Turtle Biology and Conservation. NOAA Technical Memorandum NMFS-SEFSC-436, pp. 233- 234. Taquet, C., Taquet, M., Dempster, T., Soria, M., Ciccione, S., Roos, D., and Dagorn, L. 2006. Foraging on the green sea turtle Chelonia mydas on seagrass beds at Mayotte Island (Indian Ocean), determined by acoustic transmitters. Marine Ecology Progress Series 306:295-302. van Dam, R.P., and Diez, C.E. 1996. Diving behavior of immature hawksbills (Eretmochelys imbricata) in a Caribbean cliffwall habitat. Marine Biology 127:171–178. Watson, K.P. and Granger, R.A. 1998. Hydrodynamic effect of a satellite transmitter on a juvenile green turtle (Chelonia mydas). Journal of Experimental Biology 201:2497-2505. Whittow, G.C., and Balazs, G.H. 1982. Basking behavior of the Hawaiian green turtle (Chelonia mydas). Pacific Science 36(2):129-139. Witt, M.J., McGowan, A., Blumenthal, J.A., Broderick, A.C., Gore, S., Wheatley, D., White, J., and Godley, B.J. 2010. Inferring vertical and horizontal movements of juvenile marine turtles from time-depth recorders. Aquatic Biology 8:169-177. Yasuda, T. and Arai, N. 2009a. Changes in flipper beat frequency, body angle and swimming speed of female green turtles Chelonia mydas. Marine Ecology Progress Series 386:275- 286. Yasuda, T. and Arai, N. 2009b. Depth utilization and swimming speed of female green turtles at Huyong Island, Thailand. Proceedings of the Fifth International Symposium on SEASTAR2000 and Asian Bio-Logging Science 29-31. 59 1515 1520 1525 1530 1535 1540 1545
  • 60.
    TABLES: Table 1. Asummary of the devices and methods used to record green turtle diving behavior in the 29 articles discussed in this review. Numbers indicate the different number of types of devices used in the study. Brand of Device Vemco Wildlife Computers CEFAS Star- Oddi Lotek Wireless Driesen and Kern Own Design National Geo- graphic Sea Mammal Research Unit Wildlife Computers Telonics Telonics Sonotronics Imasen Electrical Industrial Co., Ltd. Driesen and Kern Little Leonard, Ltd. Type of Device/Method TDR TDR TDR TDR TDR TDR TDR VTDR (Critter- cam) Satellite- logger Satellite- logger Satellite- logger Ultrasonic Transmitter Ultrasonic transmitter Beak Movement Sensor Movement Sensory Unit (IMASU) Acceler- ometer Visual Survey Total No. Devices/ Methods Used Article Authors Brill et al. 1995 1 0 0 0 0 0 0 0 0 0 0 0 0 0 0 0 0 1 Renaud et al. 1995 0 0 0 0 0 0 0 0 0 0 0 1 1 0 0 0 0 2 Hays et al. 1999 0 0 0 0 0 0 0 0 0 0 1 0 0 0 0 0 0 1 Hochscheid et al. 1999 0 0 0 0 0 1 0 0 0 0 0 0 0 0 0 0 0 1 Hays et al. 2000 1 1 1 0 0 0 0 0 0 0 0 0 0 0 0 0 0 3 Rice et al. 2000 0 1 0 0 0 0 0 0 0 0 0 0 0 0 0 0 1 2 Glen et al. 2001 0 1 0 0 1 0 0 0 0 0 0 0 0 0 0 0 0 2 Hays et al. 2001a 0 0 0 0 1 0 0 0 0 0 2 0 0 0 0 0 0 3 Hays et al. 2001b 0 0 0 0 0 0 0 0 0 0 1 0 0 0 0 0 0 1 Seminoff et al. 2001 0 1 0 0 0 0 0 0 0 0 0 0 0 0 0 0 0 1 Godley et al. 2002 0 0 0 0 0 0 0 0 0 1 1 0 0 0 0 0 0 2 Hays et al. 2002a 1 1 1 0 1 0 0 0 0 0 0 0 0 0 0 0 0 4 Hays et al. 2002b 1 1 0 0 1 0 0 0 0 0 0 0 0 0 0 0 0 3 Heithaus et al. 2002 0 0 0 0 0 0 0 1 0 0 0 0 0 0 0 0 0 1 Quaintance et al. 2002 0 1 0 0 0 0 0 0 0 0 0 0 0 0 0 0 0 1 Southwood et al. 2003 0 1 0 0 0 0 1 0 0 0 0 0 0 0 0 0 0 2 Hays et al. 2004a 0 0 0 0 2 0 0 0 0 0 0 0 0 0 1 0 0 3 Salmon et al. 2004 0 0 0 0 1 0 0 0 0 0 0 0 0 0 0 0 1 2 Hatase et al. 2006 0 0 0 0 0 0 0 0 1 0 0 0 0 0 0 0 0 1 Makowski et al. 2006 0 0 0 0 1 0 0 0 0 0 0 0 1 0 0 0 0 2 Seminoff et al. 2006 0 0 0 0 0 0 0 1 0 0 0 0 0 0 0 0 0 1 Hays et al. 2007 0 0 0 0 0 0 0 1 0 0 0 0 0 0 0 0 0 1 Rice and Balazs 2008 0 2 0 0 0 0 0 0 0 0 0 0 0 0 0 0 0 2 Bell et al. 2009 1 0 0 0 0 0 0 0 0 0 0 0 0 0 0 0 0 1 Hazel et al. 2009 0 0 0 1 0 0 0 0 0 0 0 0 0 0 0 0 0 1 I-Jiunn 2009 0 1 0 0 0 0 0 0 0 0 0 0 0 0 0 0 0 1 Yasuda and Arai 2009a 0 0 0 0 0 0 0 0 0 0 0 0 0 0 0 2 0 2 Yasuda and Arai 2009b 0 0 0 0 0 0 0 0 0 0 0 0 0 0 0 4 0 4 Blumenthal et al. 2010 0 0 0 0 1 0 0 0 0 0 0 0 0 0 0 0 0 1 TOTAL: 5 11 2 1 9 1 1 3 1 1 5 1 2 0 1 6 2 -- 60 120 1550 1555
  • 61.
    Table 2. Adiscussion of the accuracies, resolutions, sampling rates, sizes, weights, and biases of electronic devices used within the 29 articles reviewed. Article Authors Minimum Depth/Time to be Considered a Dive Resolution/Accuracy of Device(s): Depth and Temperature Sampling Rate of Device(s) Size of Device(s) Weight of Device(s) Data Binned? Brill et al. 1995 Not Reported Vemco TDR: 1 m Vemco TDR: Not Reported Vemco TDR: 0.016 m diam, 0.08-0.13 m long Vemco TDR: 28-40 g 0.05 hour intervals Renaud et al. 1995 Not Reported Telonics: Not Reported; Sonotronics: Not Reported Telonics and Sonotronics: Not Reported Telonics and Sonotronics: Not Reported Telonics: 180 g; Sonotronics: 36 g N/A Hays et al. 1999 either 10 or 60 seconds submerged Telonics sat tag: Not Reported Telonics sat tag: every 50 or 90 sec Telonics sat tag: Not Reported Telonics sat tag: Not Reported 6 hour intervals Hochscheid et al. 1999 2.5 m Driesen and Kern TDR: 0.1 m, 0.05 C Driesen and Kern TDR: every 15 sec Driesen and Kern TDR: 0.147 x 0.065 x 0.03 m Driesen and Kern TDR: 200 g N/A Hays et al. 2000 below 3 m for 40 sec continuously, below 3 m for at least 50 out of 60 sec, or reached 6 m depth. Wildlife TDR: 2 m; Vemco TDR: 0.3 m; CEFAS TDR: 0.1 m Wildlife TDR: every 10 sec; Vemco TDR: every 150 sec; CEFAS TDR: every 300 sec Wildlife TDR, Vemco TDR, and CEFAS TDR: Not Reported Wildlife TDR: 125 g; Vemco TDR: 23 g; CEFAS TDR: 55 g N/A Rice et al. 2000 Not Reported Wildlife TDR: Not Reported Wildlife TDR: every 60 sec Wildlife TDR: Not Reported Wildlife TDR: Not Reported N/A Glen et al. 2001 0.5 m Wildlife TDR: 2 m; Lotek TDR: 0.06 m Wildlife TDR and Lotek TDR: every 5 sec Wildlife TDR and Lotek TDR: Not Reported Wildlife TDR and Lotek TDR: Not Reported N/A Hays et al. 2001a either 10 or 60 seconds submerged, rate of descent > 0.3 m/sec, ending when rate of ascent > 0.3 m/sec and depth was <10% of max for that dive Lotek TDR: 0.04 m; Telonics sat tag 1: N/A; Telonics sat tag 2: N/A Lotek TDR: every 12 sec; Telonics sat tag 1 and 2: Not Reported Lotek TDR, Telonics sat tag 1 and 2: Not Reported Lotek TDR and Telonics sat tag 1 and 2: Not Reported 6 hour intervals Hays et al. 2001b >10 seconds Telonics sat tag: Not Reported Telonics sat tag: Not Reported Telonics sat tag: Not Reported Telonics sat tag: Not Reported 12 hour intervals Seminoff et al. 2001 2 m Wildlife TDR: 0.5 m Wildlife TDR: Not Reported Wildlife TDR: Not Reported Wildlife TDR: 500 g N/A Godley et al. 2002 2 m Wildlife sat tag: Not Reported; Telonics sat tag: Not Reported Wildlife sat tag: every 10 sec; Telonics sat tag: Not Reported Wildlife sat tag: 0.2 x 0.15 x 0.4 m; Telonics sat tag: 0.14 x 0.048 x 0.033 m Wildlife sat tag: 750 g; Telonics sat tag: 275 g 6 hour intervals Hays et al. 2002a Not Reported Lotek TDR: 0.06 m; Wildlife TDR: 2 m; Vemco TDR: 0.3 m; CEFAS TDR: 0.1 m Lotek TDR: every 5 sec; Wildlife TDR: every 10 sec; Vemco TDR: every 60 sec; CEFAS TDR: every 120 sec Lotek TDR, Wildlife TDR, Vemco TDR, and CEFAS TDR: Not Reported Lotek TDR, Wildlife TDR, Vemco TDR, and CEFAS TDR: Not Reported N/A Hays et al. 2002b Not Reported Wildlife TDR: Not Reported; Vemco TDR: Not Reported; Lotek TDR: Not Reported Wildlife TDR, Vemco TDR, and Lotek TDR: temp every 150 sec to 1 hr (unspecified), depth not reported Wildlife TDR, Vemco TDR, and Lotek TDR: Not Reported Wildlife TDR: 125 g; Vemco TDR: 23 g: Lotek TDR: 16 g N/A Heithaus et al. 2002 Not Reported Crittercam: Not Reported Crittercam: Not Reported Crittercam: Not Reported Crittercam: Not Reported N/A Quaintance et al. 2002 Not Reported Wildlife TDR: Not Reported Wildlife TDR: depth every 60 sec, temp every 180 sec Wildlife TDR: Not Reported Wildlife TDR: Not Reported N/A Southwood et al. 2003 1 m Own Design TDR: 0.2-0.5 m, 0.4 C; Wildlife TDR: 2 m, 0.2 C Own Design TDR: every 5 sec; Wildlife TDR: depth every 10 sec, temp every 60 sec Own Design TDR: 0.12 x .16 x 0.014 m; Wildlife TDR: 0.074 x 0.057 x 0.03 m Own Design TDR: 180 g; Wildlife TDR: 70 g N/A Hays et al. 2004a ≥ 5 m for types 1 and 2 dives and U-dives; ≥ 20 m for V-dives; vertical ascent rate for all dives begins and ends with 0.3 m/sec Lotek TDR 1: 0.04 m; Lotek TDR 2: 0.3 m Lotek TDR 1: every 5 sec; Lotek TDR 2: every 14 or 52 sec; IMASU: N/A Lotek TDR 1: 0.018 x 0.057 m; Lotek TDR 2: 0.08 x 0.016 x 0.027 m; IMASU: 0.072 x 0.033 x 0.017 m Lotek TDR 1: 16 g; Lotek TDR 2: 5 g; IMASU: 47 g N/A Salmon et al. 2004 Not Reported Lotek TDR: Not Reported Lotek TDR: every 2 sec Lotek TDR: 0.057 x 0.018 m Lotek TDR: 1 g (in water ) N/A Hatase et al. 2006 2m for at least 30 seconds Sea Mammal sat tag: 0.33 - 1 m Sea Mammal sat tag: every 4 sec Sea Mammal sat tag: Not Reported Sea Mammal sat tag: Not Reported N/A Makowski et al. 2006 Not Reported Sonotronics: N/A; Lotek TDR: 0.05 m, 0.5 C Sonotronics: N/A; Lotek TDR: every 5 sec Sonotronics: 0.018 x 0.086 cm sq.; Lotek TDR: 0.011 x 0.032 cm sq. Sonotronics: 190 g; Lotek TDR: 2 g (in water) N/A Seminoff et al. 2006 1.5 m Crittercam: Not Reported Crittercam: every 2-7 sec Crittercam: 0.101 m diameter, 0.317 m length Crittercam: 2000 g N/A Hays et al. 2007 Not Reported Crittercam: Not Reported Crittercam: every 2-7 sec Crittercam: 0.101 m diameter, 0.317 m length Crittercam: 2000 g N/A Article Authors Minimum Depth/Time to be Considered a Dive Resolution/Accuracy of Device(s): Depth and Temperature Sampling Rate of Device(s) Size of Device(s) Weight of Device(s) Data Binned? 61
  • 62.
    Rice and Balazs2008 Not Reported Wildlife TDR 1 and 2: 0.5 m, 0.5 C Wildlife TDR 1 and 2: every 60 sec Wildlife TDR 1 and 2: Not Reported Wildlife TDR 1 and 2: Not Reported N/A Bell et al. 2009 1 m Vemco TDR: Not Reported Vemco TDR: Not Reported Vemco TDR: Not Reported Vemco TDR: Not Reported N/A Hazel et al. 2009 1-2 m, excluding first 12 hours after release Star-Oddi TDR: 0.08 m, 0.1 C Star-Oddi TDR: depth every 15 sec, temp every 225 sec Star-Oddi TDR: Not Reported Star-Oddi TDR: Not Reported N/A I-Jiunn 2009 depth below 2 m, vertical speed faster than 0.03 m/s, and dive lasted longer than 30 seconds Wildlife TDR: 0.5 m, 0.5 C Wildlife TDR: every 1 sec Wildlife TDR: Not Reported Wildlife TDR: Not Reported N/A Yasuda and Arai 2009a 3 m Accelerometer 1: 0.093 m, Accelerometer 2: 0.046 m Accelerometer 1 and 2: Sampling intervals - 1 Hz for depth and swimming speed, 0.1 Hz for temp, and 16 Hz for acceleration Accelerometer 1: 0.015 m diameter, 0.053 m length; Accelerometer 2: 0.027 m diameter, 0.128 m length Accelerometer 1: 16 g; Accelerometer 2: 73 g N/A Yasuda and Arai 2009b Not Reported Accelerometer 1: Not Reported; Accelerometer 2: Not Reported; Accelerometer 3: Not Reported; Accelerometer 4: Not Reported Accelerometer 1, 2, 3, and 4: every 1 sec Accelerometer 1, 2, 3, and 4: Not Reported Accelerometer 1, 2, 3, and 4: Not Reported N/A Blumenthal et al. 2010 Not Reported Lotek TDR: 0.5 m, 0.3 C Lotek TDR: every 10 sec Lotek TDR: Not Reported Lotek TDR: Not Reported N/A Table 2 continued. Table 3. The different ways the authors of the 29 studies studied, organized, and analyzed the data collected regarding green turtle dive behavior. 1 = analysis used/discussed within the article. 0 = analysis not used or discussed. Article Authors Letter- Number- Dive Flipper Swimming Coefficient of Dive Dive Total 62 1560 1565 1570 1575 1580 125
  • 63.
    Shaped Dives LabeledDives Angle Beats Speed Variation Length Depth Brill et al. 1995 0 0 0 0 0 0 1 1 2 Renaud et al. 1995 0 0 0 0 0 0 1 0 1 Hays et al. 1999 0 0 0 0 1 0 1 0 2 Hochscheid et al. 1999 1 0 1 0 0 0 1 1 4 Hays et al. 2000 0 0 0 0 0 0 1 1 2 Rice et al. 2000 0 0 0 0 0 0 1 1 2 Glen et al. 2001 1 0 1 0 0 0 0 0 2 Hays et al. 2001a 1 1 1 0 0 0 1 1 5 Hays et al. 2001b 0 0 0 0 0 0 1 0 1 Seminoff et al. 2001 0 0 0 0 0 0 1 1 2 Godley et al. 2002 0 0 0 0 1 0 1 1 3 Hays et al. 2002a 1 0 0 0 0 0 1 1 3 Hays et al. 2002b 0 0 0 0 0 0 0 1 1 Heithaus et al. 2002 0 0 0 0 0 0 1 0 1 Quaintance et al. 2002 0 0 0 0 0 0 1 0 1 Southwood et al. 2003 1 0 0 0 0 0 1 1 3 Hays et al. 2004a 1 1 1 1 1 0 1 1 7 Salmon et al. 2004 1 0 0 1 1 0 1 1 5 Hatase et al. 2006 1 0 0 0 0 0 1 1 3 Makowski et al. 2006 1 0 0 0 0 0 1 1 3 Seminoff et al. 2006 0 1 0 0 1 0 1 1 4 Hays et al. 2007 0 0 1 1 0 0 1 1 4 Rice and Balazs 2008 1 0 0 0 0 0 1 1 3 Bell et al. 2009 1 0 0 0 0 0 1 1 3 Hazel et al. 2009 0 0 0 0 0 0 1 1 2 I-Jiunn 2009 1 0 0 0 0 0 1 1 3 Yasuda and Arai 2009a 1 1 1 1 1 0 1 1 7 Yasuda and Arai 2009b 0 0 0 0 1 0 0 1 2 Blumenthal et al. 2010 0 0 0 0 0 1 1 1 3 TOTAL: 13 4 6 4 7 1 26 23 -- Table 4. Definitions of foraging and diving (and other) behaviors of green sea turtles provided by each of the 29 studies reviewed. 1 = definition provided, 0 = no definition provided. Article Authors Behaviors Defined? Definition of Behavior Foraging Resting Other Foraging Resting Other Brill et al. 1995 1 1 0 short and irregular submergence intervals regular long submergence intervals N/A 63 1585
  • 64.
    Renaud et al.1995 0 0 0 N/A N/A N/A Hays et al. 1999 0 1 0 N/A a dive of long submergence time (pretty vague, huh?) N/A Hochscheid et al. 1999 1 1 0 active movements along the bottom substrate, can occur on many different dive types, including U dives. periods of inactivity during U-dives. N/A Hays et al. 2000 1 1 0 short, active dives that do not level off at one maximum depth repeated dives to a fixed depth for a long period, at least 6 m in depth, be within 2 m of max depth for 90% of dive, no linear change while at deepest depth, and there had to be at least 2 of these dives in a row N/A Rice et al. 2000 1 1 0 numerous short dives in shallow water (< 3 m) with short surface intervals (< 5 sec) longer dives (> 20 min) in deeper water N/A Glen et al. 2001 0 0 0 N/A N/A N/A Hays et al. 2001a 0 1 0 N/A Type 1 and 2 dives - see article or notes for descriptions N/A Hays et al. 2001b 0 0 1 (mating) N/A N/A mating: short timed dives showing great activity, for males only Seminoff et al. 2001 1 0 0 shorter dive duration than resting dives N/A N/A Godley et al. 2002 0 0 0 N/A N/A N/A Hays et al. 2002 0 0 0 N/A N/A N/A Hays et al. 2002b 0 0 0 N/A N/A N/A Heithaus et al. 2002 0 0 0 N/A N/A N/A Quaintance et al. 2002 1 1 0 relatively constant temp Small regular fluctuations in temp N/A Southwood et al. 2003 1 1 0 dives of shorter depth and duration than resting dives dives of deeper depth and longer duration than in foraging dives N/A Hays et al. 2004a 0 1 0 N/A U-dives to the bottom in which there was very little or no flipper movement N/A Salmon et al. 2004 0 0 0 N/A N/A N/A Hatase et al. 2006 0 0 0 N/A N/A N/A Makowski et al. 2006 1 1 0 V-dive - short bounce dive U-dive - flat bottom resting dive N/A Seminoff et al. 2006 1 1 0 specific food item seen being ingested, OR an item in video went out of view, followed by chewing motions, OR fragments of prey item seen expelled through external nares of turtle, done on types 1, 3 and 5 dives motionless with no head or flipper movement, only on type 1 dives N/A Hays et al. 2007 0 0 0 N/A N/A N/A Rice and Balazs 2008 0 1 0 N/A U-Shaped dive N/A Bell et al. 2009 1 1 0 V-dive and slowly ascending dives U-dive N/A Hazel et al. 2009 1 1 0 Short dives are consistent with heightened activity involved in seeking and consuming forage, since activity increases metabolic demand reduced metabolic demand while resting = longer submersion, less surfacing events N/A I-Jiunn 2009 0 1 1 (active) N/A U-dives: stationary at a fixed depth for extended time period, and animals remained motionless or moved very little; long dives with little SD in bottom depth Active: move more and stay at specific depth for short period of time, resulting in an erratic bottom profile with high standard deviation of bottom depth; short dives with high SD of bottom depth Article Authors Behaviors Defined? Definition of Behavior Foraging Resting Other Foraging Resting Other Yasuda and Arai 2009a 0 1 0 N/A dynamic acceleration (or lack thereof) showed that turtles were indeed resting during the bottom phase of the U-dive N/A Yasuda and Arai 2009b 0 0 0 N/A N/A N/A Blumenthal et al. 2010 0 1 0 N/A longer and less active dives N/A TOTAL: 11 17 2 -- -- -- 64 130
  • 65.
    Table 4 continued. Table5. A comparison of the 29 studies discussed regarding green turtle diving behavior in this review: turtle size/age, study location, and number of turtles studied. Article Authors Green Turtle Size/Age Study Site Purpose of Study Site No. Green Turtle Subjects Brill et al. 1995 all >65 cm CL Kaneohe Bay, HI foraging area 12 Renaud et al. 1995 29.1-47.9 cm SCL, 2.6-14.8 kg weight South Padre Island, Texas foraging area 9 Hays et al. 1999 nesting females Ascension Island inter-nesting and post-nesting migration 11 Hochscheid et al. 1999 nesting females Cyprus inter-nesting area 2 Hays et al. 2000 109-127.75 cm CCL Ascension Island inter-nesting area 6 65 1590 1595 1600 1605 1610 1615
  • 66.
    Rice et al.2000 72.5 cm SCL, weighing 52.5 kg Punalu'u, Hawai’i foraging area 1 Glen et al. 2001 nesting female Cyprus inter-nesting area 1 Hays et al. 2001a nesting females migration between Ascension and Brazil pre- and post-nesting migration 17 Hays et al. 2001b male adults Ascension Island inter-nesting/breeding area 2 Seminoff et al. 2001 Not reported Bahia de Los Angeles foraging area 6 Godley et al. 2002 nesting females Cyprus inter-nesting area, post-nesting migration 9 Hays et al. 2002a nesting adults Cyprus and Ascension Island inter-nesting areas 8 Hays et al. 2002b nesting females Ascension Island and Cyprus inter-nesting area 12 Heithaus et al. 2002 76-103 cm CCL Shark Bay, Western Australia not defined - possibly foraging area (seagrass) 12 Quaintance et al. 2002 45 kg body weight (sub-adult) Kiholo Bay, Hawai’i foraging area 2 Southwood et al. 2003 10-23.6 kg (range of body weights of all turtles) Heron Island, Australia foraging area 12 Hays et al. 2004a nesting females Ascension Island inter-nesting area 6 Salmon et al. 2004 newly hatched - 1-10 weeks old, increased from 62 mm to 79.1 mm SCL Florida current nursery habitat for hatchling turtles 33 Hatase et al. 2006 post-nesting females Japan post-nesting migration 4 Makowski et al. 2006 27.9-48.1 cm SCL Palm Beach, FL foraging area 10 Seminoff et al. 2006 64.1-96.7 cm SCL Bahia de Los Angeles, Mexico foraging area 34 Hays et al. 2007 69.5-93.4 cm CCL Bahia de Los Angeles, Mexico foraging area 5 Rice and Balazs 2008 migrating adults Lanikea, O’ahu, HI inter-nesting/breeding area, post-breeding migration 3 Bell et al. 2009 nesting females Raine Island, N. GBR inter-nesting area 6 Hazel et al. 2009 49-118 cm CCL near Brisbane, Australia foraging area 19 I-Jiunn 2009 range: 89-107 cm SCL, or 95-113 cm CCL Wan-an Island, Penghu Archipelago, Taiwan inter-nesting area 5 Yasuda and Arai 2009a 90-130 cm CCL, nesting females Huyong Island, Thailand inter-nesting area 4 Yasuda and Arai 2009b 90-109 cm CCL, nesting females Huyong Island, Thailand inter-nesting area 10 Blumenthal et al. 2010 mean CCL was 52.9 +/- 6.8 cm (SD) with range of 40.6-59.0 cm Cayman Islands foraging area 5 AVERAGE: 9.2 Table 6. Some of the many factors which can affect green turtle dive behavior, and whether or not each factor is considered in each of the 29 articles reviewed here. 1 = factor discussed within the article. 0 = factor not discussed. Article Authors Turtle's Activity at Site Water Temperature Season Tide Time of Day Current Turtle Gender Buoyancy Energetics/metabolism Predator Avoidance TOTAL: Brill et al. 1995 1 0 0 0 1 0 0 0 1 1 4 Renaud et al. 1995 1 0 1 0 1 0 0 0 0 0 3 Hays et al. 1999 1 0 0 0 1 1 0 0 1 0 4 Hochscheid et al. 1999 1 1 0 0 1 0 0 1 1 0 5 Hays et al. 2000 1 0 0 0 1 0 0 1 1 0 4 Rice et al. 2000 1 0 0 0 1 0 0 0 0 0 2 Glen et al. 2001 0 0 0 0 0 0 0 1 1 0 2 66 1620
  • 67.
    Hays et al.2001a 1 0 0 0 1 0 0 1 1 1 5 Hays et al. 2001b 1 0 0 0 0 0 1 0 1 0 3 Seminoff et al. 2001 1 0 0 0 1 0 0 0 0 0 2 Godley et al. 2002 1 1 1 0 0 0 0 0 1 0 4 Hays et al. 2002a 1 0 0 0 1 0 0 1 1 0 4 Hays et al. 2002b 0 1 0 0 0 0 0 0 1 0 2 Heithaus et al. 2002 1 0 0 0 0 0 0 0 1 0 2 Quaintance et al. 2002 1 1 0 0 1 0 0 0 1 0 4 Southwood et al. 2003 0 1 1 0 1 0 0 1 1 0 5 Hays et al. 2004a 1 0 0 0 0 0 0 1 1 0 3 Salmon et al. 2004 1 0 0 0 0 0 0 1 1 0 3 Hatase et al. 2006 1 1 0 0 1 0 0 1 0 0 4 Makowski et al. 2006 1 0 0 0 1 0 0 0 1 1 4 Seminoff et al. 2006 0 0 0 0 0 0 0 1 1 1 3 Hays et al. 2007 0 1 0 0 0 0 0 1 0 0 2 Rice and Balazs 2008 1 1 0 0 1 0 0 1 0 1 5 Bell et al. 2009 1 0 0 0 1 0 0 0 1 0 3 Hazel et al. 2009 1 1 1 0 1 0 0 1 1 1 7 I-Jiunn 2009 1 1 1 0 1 0 0 1 1 0 6 Yasuda and Arai 2009a 1 1 0 0 1 1 0 1 1 1 7 Yasuda and Arai 2009b 0 0 0 0 0 0 0 0 0 0 0 Blumenthal et al. 2010 0 0 0 0 1 0 0 0 0 1 2 TOTAL: 22 11 5 0 19 2 1 15 21 8 -- 67 1625 135
  • 68.
    FIGURES: Figure 1. Diveprofiles of two green turtles, showing (a) different dive “shapes” assigned letters resembling the dive shape; (b) multiple shallow traveling dives in a row; (c) a series of U-shaped dives in a row; (d) dives categorized as “S-shaped” and “other” (not resembling any letter shape). The dotted line represents the depth threshold used to identify discrete dives (2.5 m). Note: SSD represents shallow surface dives (Hochscheid et al. 1999). 68 1630
  • 69.
    Figure 2. Southwoodet al. (2003). Figure showing different letter-shaped dives performed by green turtles, and the threshold used to identify discrete dives (~1 m). Figure 3. Figure of four categories of dives based on their shape. See text for explanation of each dive type (Rice and Balazs 2008). 69 1635 1640 140
  • 70.
    Figure 4. Figureof the six generic dive types observed in the study by Seminoff et al. (2006). 70 1645 1650 1655 1660
  • 71.
    CHAPTER 2: Inferringthe behavior of juvenile green sea turtles (Chelonia mydas) in a shallow coastal habitat: augmenting time-depth-temperature records with visual observations ABSTRACT: There are inherent limitations to inferring green sea turtle (Chelonia mydas) diving behavior from time-depth recorders (TDRs) alone. Ground-truthing TDR data is imperative to determine the actual behaviors of the turtles, and to learn the extent to which the TDR data can be used to infer specific behaviors. Logistic regressions of video observational data, filmed concurrently alongside TDR data on six juvenile green turtles at the Kawai’nui Marsh Estuary (KME) in Kailua Bay, O’ahu, Hawai’i, were used to determine the extent to which the TDR data could be used to describe six behaviors witnessed within the diving videos. Our results showed that four behaviors (foraging, food searching, hovering, and breathing) could be reasonably explained each by its own combination of specified TDR variables, while swimming and resting behaviors could not be described by the TDR variables. Another set of logistic regressions, to determine the effect of habitat on turtle behavior, determined that resting and breathing could be detected in the ledge / channel habitat, and that hovering behavior could be detected across all habitats, but no other behaviors could be described by TDR data alone. By comparing video- recorded personal observations of juvenile green turtles to concurrent TDR data, this study determined the true behavior performed at this shallow foraging site, and concluded that TDR data alone can describe turtle behavior at KME to a great degree, but is insufficient on its own to describe a turtle’s full behavioral repertoire. To best understand juvenile green turtle behaviors, it is important that personal observations augment the deployment of TDRs to best ensure field studies are capturing and describing the full behavioral repertoire of green turtles in heterogeneous habitats. 71 1665 1670 1675 1680 1685
  • 72.
    INTRODUCTION: The advent oftime-depth-recorders (TDRs) has provided insights into the diving behavior of air-breathing marine vertebrates, including green sea turtles (Chelonia mydas). Simple TDRs document patterns of depth utilization, surfacing behavior, dive durations, and depth (Hays et al. 2007), from which researchers can infer behaviors (e.g., Glen et al. 2001; Hazel et al. 2009; I-Jiunn 2009). More sophisticated units also collect data on ancillary parameters, such as water temperature, swim speed, acceleration, flipper beat frequency, and compass heading. However, there are limitations associated with inferring behavior from TDR data. Short dives with continuous depth fluctuations during the bottom phase are normally considered foraging events (e.g., Brill et al. 1995; Makowski et al. 2006) while longer dives to a fixed depth are considered resting events (e.g., Hays et al. 2000b; Southwood et al. 2003). In certain cases, assigning individual behaviors to dive profiles can be misleading without independent visual confirmation (Houghton et al. 2000; Heithaus et al. 2001), especially in instances when turtles perform multiple activities during a single dive (Hochscheid et al. 1999). For instance, green turtles have been known to perform both active (e.g., Hochscheid et al. 1999; Houghton et al., 2002) and passive (e.g., Hays et al. 2000b; Southwood et al. 2003) behaviors on similar dive profiles (Hays et al. 2004), making it often impossible to determine activities exclusively on the basis of its dive profiles. Dives with extended periods spent along the sea floor can involve resting (Hochscheid et al. 1999; Seminoff et al. 2006) as well as movement along the seabed, suggesting the turtles are likely searching for prey (Hazel et al. 2009). Specific dive types may also include other unsuspected behaviors. For instance, green turtles observed rubbing against rocks and sponges to self-clean yielded dive profiles very similar to those from foraging turtles 72 1690 1695 1700 1705 1710 145
  • 73.
    (Heithaus et al.2002). To complicate matters further, dives to the sea floor can actually indicate up to three different types of foraging behavior (Seminoff et al. 2006). Another major problem with inferring behavior is that TDR data lack a spatial context to discriminate the location of specific dives (Blumenthal et al. 2010; Witt et al. 2010). This is problematic as green turtle diving behavior can vary within a single habitat, or can vary amongst many sites, such as foraging sites and even inter-nesting sites, where turtles are believed to primarily rest on the seabed in between nesting events. Despite what is commonly believed, at inter-nesting sites the spatial context of, and proximity of food availability may determine whether an adult female green turtle will predominantly forage or rest (e.g., Hochscheid et al. 1999; Hays et al. 2000a; Godley et al. 2002; Hays et al. 2002). Differing behavior by depth and location has also been documented in loggerhead turtles (Caretta caretta) and in hawksbill turtles (Eretmochelys imbricata; Houghton et al. 2002, 2003). Individual turtles may also vary their diving behavior by season, time of day, and habitat (Southwood et al. 2003, Makowski et al. 2006). While TDRs have revolutionized the study of turtle diving behavior, they cannot describe the full range of behavioral patterns that can be documented using visual observations (Houghton et al. 2002, 2003; Schofield et al. 2006). Visual behavioral observations are critical for confirming inferences derived from electronic tags (Hochscheid et al. 1999; Houghton et al. 2003; Schofield et al. 2006). Most visual observations of sea turtle behavior have relied on the Crittercam, a video- TDR, which records video or still images of the turtle and its environment, concurrently with standard diving and environmental data (time, depth, and water temperature) (e.g., Heithaus et al. 2002; Seminoff et al. 2006). A study by Heithaus et al. (2002) used Crittercam to document green turtles rubbing their bodies on rocks and sponges to clean themselves, a previously 73 1715 1720 1725 1730
  • 74.
    unknown behavior. Otherstudies of sea turtle behavior involve personal observation alongside TDR deployments (e.g., Davis et al. 2000; Houghton et al. 2000; Hays et al. 2002; Blumenthal et al. 2009); these studies often involve casual observations, which are not part of a carefully designed sampling regime but occur opportunistically (e.g., before re-capture for TDR retrieval). Traditionally, research of green sea turtle (Chelonia mydas) movements and diving behavior has focused on adult females during the inter-nesting period (e.g., Hays et al. 1999; Hochscheid et al. 1999; Hays et al. 2000b) or their subsequent migrations (e.g., Rice and Balazs 2008) in deep oceanic water, with more recent diving and tracking studies also focusing on juvenile turtles. These young, immature turtles can spend 20 or more years in neritic foraging and resting habitats, (Seminoff et al. 2002; Balazs and Chaloupka 2004; Makowski et al. 2006). Juvenile turtle coastal habits make them susceptible to potential negative interactions with humans during this prolonged life stage, including interactions with fishing gear and vessel strikes (Hazel et al. 2007; Chaloupka et al. 2008a). Understanding juvenile green turtle behavior in shallow coastal habitats is critical to determine their time allocation to feeding and resting, and to ascertain where and when they are most susceptible to human impacts. Yet, shallow-water studies are challenging for electronic tagging. Studying juvenile sea turtle behavior has proven difficult because tagged individuals are often difficult to recapture. Recent advances in technology have resulted in the miniaturization of electronic tags which enables researchers to track smaller animals (Godley et al. 2008). Tracking has also traditionally been inhibited by logistical constrains: most satellite tags are not capable of mapping small-scale (few km) foraging sites (Hazel et al. 2009) and very high frequency (VHF) acoustic tags require an intensive fieldwork effort, which render acoustic tracking studies prohibitive. Despite the revolutionary advent of miniaturized TDRs for the study of juvenile sea turtle diving behavior 74 1735 1740 1745 1750 1755 150
  • 75.
    and small-scale movements(Houghton et al. 2003; Myers et al. 2006; Witt et al. 2010), fundamental data on green turtles in their foraging grounds remains scant (Hazel 2009). This study seeks to determine to what extent juvenile green turtle behaviors (e.g., resting, foraging, and breathing) can be inferred solely by the use of time-depth-temperature-recorders (TDTRs). Through the comparison of TDTR data alongside visual observations made from video recordings of juvenile green turtles in the Kawai’nui Marsh Estuary on O’ahu, Hawai’i, we will determine for which behaviors TDR data inferences are valid and for which ones ground- truthing using visual observation is required. METHODS: Study Area The Kawai’nui Marsh Estuary (KME) study area is located at the northern end of Kailua Bay on the island of O’ahu, Hawai’i (21° 25’ N, 157° 44’ W, Figure 1), encompassing six different habitats (cove, channel, ledge, canal, rocky shore, and bay) spanning approximately 0.5 km2 . At the northern edge of KME is a shallow (0.5-1.5 m) cove with pavement-type coral reef and carbonate rock, with macroalgae and invertebrates covering 50-90% of the substrate (NOAA CCMA 2007). Bordering this cove is a dredged channel connecting to a man-made 2.75 km- long canal, both of which have sandy to muddy substrate and are 3-4 m deep, leading to the Kawai’nui Marsh. On either side of the channel is a vertical ledge, primarily composed of rock, dead reef, macroalgae, and sessile invertebrates. Commonly, the channel and ledge will be included as the same habitat. On the south side of the channel is another relatively shallow (0.5- 3.0 m) reef/rock flat habitat, known as Kailua Bay, which also supports abundant macroalgae and sessile invertebrates (NOAA CCMA 2007). The shallowest portion (0-0.5 m) is hereafter 75 1760 1765 1770 1775
  • 76.
    referred to asthe rocky shore (Figure 2). The marsh is 336 hectares in size, and drains through the canal into the ocean. Visibility was typically poor (approximately 2-10 m visibility), especially at the mouth of the canal, with the highly eutrophic and silty fresh water input from the marsh. Turtle Capture and Marking Juvenile green turtles were captured at KME by personnel from the National Oceanographic and Atmospheric Administration’s Marine Turtle Research Program (NOAA- MTRP), either by scoop net or hand capture, and were immediately brought to shore for weighing, body measurements, and a general health assessment. NOAA-MTRP has been studying green turtle population size, growth rate, and health at this site since 2000. A unique identification number, approximately three cm tall by three cm wide and one mm deep, was etched into the left and right sides of each turtle’s carapace. These numbers were then painted white to aid identification of the turtle in the water while snorkeling. Additionally, turtles were tagged with a passive integrated transponder (PIT) tag injected into each hind flipper. Time-Depth-Temperature Recorders (TDTRs) In March, 2010, four individual turtles were equipped with time-depth-temperature recorders (TDTRs; Lotek, model LAT 1500 – pressure accuracy of ± 1%, pressure resolution of 0.05%, temperature accuracy < 0.2 °C, temperature resolution of 0.05 °C) to monitor their diving behavior. Two more turtles were equipped with TDTRs in June, 2010. Devices were attached to the turtle’s carapace by an attachment method similar to the elastomer-fiberglass-resin protocol 76 1780 1785 1790 1795 1800
  • 77.
    of Balazs etal. (1996). The temperature and depth sensors on the devices were left uncovered so as not to interfere with data collection. After the fiberglass and resin hardened, each turtle was returned to the water and released as quickly as possible to minimize stress. Each of the six TDTR-tagged turtles (numbers T2, T15, T16, T17, T34, T37) were equipped with one (T15, T34, and T37) or two (T2, T16, and T17) TDTRs. Each turtle received one course-scale tag sampling water pressure and temperature every 15 seconds for approximately 33 days (filling the device’s memory). Three turtles received a second fine-scale tag sampling the same parameters every second for approximately two days. The collection of two replicates of the dive data from the same individual, sampled at two different temporal resolutions allowed us to test for potential inter-tag variability in the pressure and depth measurements. Field sampling occurred approximately once per month, between March and September 2010, with the goal of retrieving and re-deploying the TDTRs. Turtles were recaptured and released after uploading their dive data in the field. Following Hazel et al. (2009), the minimum depth value for each TDTR dataset was determined and added to all depth values to correct inter- tag calibration differences. This correction assumes that the 15-second sampling captured a turtle breathing at the surface at least once, during each 33-day deployment. It is possible that data collection or measurement errors could have occurred with the TDTR devices. The TDTRs have the inherent potential to collect false data, and negative depth data created the need to subjectively tweak the data to remove these values. As the data collected by the TDTR devices and behavioral observation videos did not begin on the same 15- second intervals, it is possible that in shifting the TDTR data (by no more than eight seconds) to match the video data, the TDTR data may not truly describe the behavior witnessed in the video. 77 1805 1810 1815 1820 1825 155
  • 78.
    However, such asmall time shift is unlikely to have created TDTR datasets which falsely describe the true behavior witnessed within the videos. Behavioral Survey Videos To complement and validate the TDTR devices being used to characterize diving behavior, focal-animal behavioral surveys were performed following Altmann (1974). During the same six-month time period as the TDTR deployments, individual turtles were filmed in KME by one snorkeler (DF) within three distinct habitat types: the cove, the adjacent channel and ledge, and Kailua Bay (Figure 2). An Olympus Stylus 1010 digital camera with underwater housing was used to video record the turtles, each video lasting for up to eight minutes. Videos were shorter if sight of the turtle was lost due to poor visibility or if the turtle was continuously resting in the same position for five minutes. A video length of eight minutes was chosen due to camera battery and memory card capacity constraints, but if conditions allowed for it, longer videos (up to ten minutes) were taken. To randomize the surveys, the three habitats and three potential starting points within each habitat were randomly chosen using a random number table. After arriving at the starting position, the first turtle sighted within the targeted habitat would be selected, and filming would start immediately upon approaching the turtle. All surveys occurred between 10:00 and 16:00 local time, when turtle abundance was highest (Asuncion 2010) and when the high sun angle provided the best visibility. These surveys covered four tidal phases (flooding, ebbing, high, low) spanning six consecutive 28-day lunar cycles, with each tidal phase being sampled twice during each lunar cycle (once in each 14-day period). 78 1830 1835 1840 1845
  • 79.
    During each videosampling day, the goal was to record two turtles within each of the three habitats (cove, channel / ledge, and Kailua Bay) during the two-hour sampling period. However, due to constraints such as varying turtle abundance and poor visibility, it was not always possible to film two turtles within each habitat each day. In those cases, more turtles were filmed in other habitats, if possible, to reach the goal of six videos per sampling session (see Table 1 for a description of the location, tidal cycle, and lunar cycle associated with each behavioral video). During filming, the snorkeler remained at least two human body lengths (three meters) away from the turtle at all times and moved with very slow and deliberate movements, to minimize his influence on the turtles’ behaviors. Due to the great amount of human presence at KME, turtles are habituated to snorkelers at this site, which allowed for observation without disturbance. If a turtle appeared to be disturbed by my presence, video recording was immediately ceased and the turtle was left alone. Analysis of Behavioral Videos Each video was analyzed to determine a set of behavioral parameters defined prior to data collection (Table 2). Instantaneous behaviors were recorded on 15-second intervals (the same sampling resolution as the TDTRs) beginning at the start and running through the end of each video. These eight behaviors involved: foraging (searching for food and actively feeding), food searching, resting, hovering, posing, swimming (with vertical and horizontal direction), face or body “swiping,” and breathing. Three continuous behavioral variables were also quantified beginning at the start and running through the end of each video: the number of flipper beats per 30 seconds, the number of bites per 15 seconds, and the timing of each breath (to the nearest 79 1850 1855 1860 1865 1870 160
  • 80.
    second; whether ornot it occurred on a 15-second interval). Additionally, the movement rate of the turtle was deduced using a GPS device (Garmin, model eTrex Legend), attached to the snorkeler and used to record position every 15 seconds. Comparison of TDTR data to Behavioral Survey Video Data A Matlab program was written to summarize 83 different depth and temperature characteristics of the TDTR data for the length of each video, of which seven were chosen to compare with video data. For depth, these characteristics included maximum, average, and median depth of the turtle, total depth displacement, proportion of time spent between the surface and 0.5 m depth, proportion of time spent below 0.5 m depth, and the coefficient of variation (CV) of depth (as a means of determining activity level; e.g., Blumenthal et al. 2009). For temperature, these summary parameters included average, median, maximum, and minimum temperature, as well as the CV of the temperature. We used two complementary approaches to synthesize the behavioral data: an ordination of all the observed behaviors, followed by logistic regressions to characterize the common individual behaviors. A non-metric multidimensional scaling (NMDS) analysis of the behavioral variables was run to determine the relatedness of the occurrence of six individual behaviors within the videos: foraging, food searching, resting, hovering, swimming, and breathing. Six behaviors were chosen for this study on the basis of their occurrence in at least two of the 26 videos (see Table 3 for definitions): food searching, foraging, resting, general swimming, hovering, and breathing (Table 4). Because many food searching events occurred without a corresponding foraging behavior, food searching and foraging were considered separate behaviors in these analyses, even though all foraging events occurred in videos with food 80 1875 1880 1885 1890
  • 81.
    searching behavior. Thebehaviors of posing and body swiping were excluded in the analyses as they each occurred only once in the 26 videos. NMDS can be used to determine the relationship between objects or species (for instance, presence/absence of turtle behavior) and environmental descriptors (for instance, TDTR parameters) for non-metric, non-normal, and categorical data. This analysis looks for the best ordination of n objects along k dimensions (axes) in order to minimize the amount of “stress” (an indication of the model’s goodness of fit) within the final configuration. Using multiple iterations, NMDS compares pair-wise distances of the objects in reduced space against the dissimilarity of the objects in the real world (Clarke 1993). The NMDS was performed using the PC-ORD software, with the Relative Sorensen distance metric, and statistical significance was assessed with a randomization test (with 50 runs of real data and 999 runs of randomized data, using the random starting point) (McCune and Grace 2002). The resulting ordination of “samples” (turtle videos) and “species” (behaviors) is graphically represented in the context of the TDTR parameters, plotted as environmental vectors relating to the ordination axes. A second step involved using stepwise logistic regressions to determine if the length of the behavioral survey video had an effect on the presence or absence of specific behaviors, when the other TDTR variables were considered. Using the Systat 11.0 computer software, binary stepwise (forward and backward) logistic regressions were used to determine if these TDTR parameters could predict the presence or absence of these eight turtle behaviors (similar to the methodology by Barnett-Johnson et al. 2007). The stepwise logistic regressions were followed by complete logistic regressions for those behaviors where the TDTR parameters provided significant results (alpha = 0.1 for marginal significance; this alpha value was selected for the 81 1895 1900 1905 1910 1915
  • 82.
    logistic regressions onlyto be able to explain a higher percent of the occurrence of behaviors through TDTR data alone). These logistic regressions provided a “logit” value defined as: Li = log (pj / (1-pj)) = Σ(aij x bij) + c; where Li = logit value, or inverse of the logistic function, or linearly predicted value for the associated behavior based on the combination of TDTR parameters with which the behavior is significantly related; i = the number of videos (ranging from 1-26); j = the number of TDTR parameters (marginally) significantly related to the behavior; pj = the probability (0-1) of the occurrence of a particular behavior; aij = TDTR parameter value (marginally) significantly related to the behavior; bij = the logistic regression estimated value, or “weight,” associated with each TDTR parameter; c = a calculated constant, the line intercept. Finally, to investigate finer-scale associations of the individual behaviors with specific habitats, each of the videos was split into 2-minute segments. The GPS track of each 2-minute segment was used to ascribe each 15-second location to a specific habitat. To address specific habitat associations, only those 2-minute segments (tracks of 8 consecutive 15-second locations) contained solely within one habitat (channel / ledge, Kailua Bay, cove, or rocky shore) were considered in the subsequent analysis. A G-test was used to analyze the potential association of the eight specific fine-scale behaviors and the four habitats (Zar 1984). For the subset of behavior – habitat combinations with a minimum of three occurrences – stepwise (forward and backward, alpha = 0.1) and 82 1920 1925 1930 1935 165
  • 83.
    complete logistic regressionswere used to relate the occurrence of the behavior to the TDTR parameters. RESULTS: Dataset Over the 6-month study period, 16 TDTR course-scale tags (15-second intervals) datasets were uploaded from the six tagged turtles, 15 of which had usable, uncorrupted data (T2 = 2datasets, T15 = 3 datasets, T16 = 3 datasets, T17 = 1 dataset, T34 = 3 datasets, T37 = 3 datasets). Of the 277 total videos documenting turtle behavior, 26 recorded turtles also equipped with TDTRs, yielding 26 individual videos of turtles with concurrent TDTR data (Table 1). The videos with matching TDTR data were distributed throughout the 6-month study and cover all four tidal cycle phases (low, rising, falling, high), all three of the habitats (cove, Kailua Bay, and channel / ledge), and showcase four of the six TDTR-tagged turtles (turtles numbered 15 and 17 were not filmed while their TDTRs were active; Table 1). The videos range in length from two to 10 minutes (average of 7.71 ± 1.53 (S.D.) minutes). Seven TDTR parameters, calculated using the Matlab computer software (v. 7.4.0.287 (R2007a)) were chosen to compare the behavioral video observations: depth displacement, depth coefficient of variation (CV), maximum depth, average depth, surface proportion (arcsine transformed for normalization), average temperature, and temperature CV (Table 5). Even though some of these parameters were highly cross-correlated (Table 6), they were all included in the analyses to determine which parameters best predicted turtle behaviors. With highly cross-correlated TDTR parameters, certain parameters may have been excluded from logistic regression results; performing stepwise forward and backward logistic regressions avoided this 83 1940 1945 1950 1955 1960
  • 84.
    potential problem. Diveduration, other than time within the top 0.5 m, was not used as a TDTR parameter due to the shallow nature of the site, making it difficult to define dives based on shape or duration. Dives were instead defined based on depth bins (0.5 m bins), similar to the methods of Hazel et al. (2009). The 26 videos of varying durations were split into 99 different 2-minute segments, 75 of which were contained solely within one habitat. Thirty-one (41.3%) occurred in the channel / ledge, 11 (14.7%) in the cove, 23 (30.7%) in Kailua Bay, and 10 (13.3%) in the rocky shore. Comparison of Presence/Absence of Behaviors (NMDS Analysis) A three-dimensional answer was identified as the best non-metric multidimensional scaling analysis (NMDS) solution, when considering the reduction in stress (including axes until the reduction in minimum observed stress < 5) and the p-values (p < 0.05) for each axis (Figure 3). Final stress was 5.34, indicating a minimal risk of drawing false conclusions from the NMDS plot (McCune and Grace 2002). Three axes explained a total of 97.0% of the variation, with axis 1 explaining 54.4% (p = 0.001), axis 2 explaining 7.5% (p = 0.001), and axis 3 explaining 35.0% (p = 0.001). As axes 1 and 3 explain the highest amount of variance (total of 89.4%), these axes were used to describe the relationships between the occurrences of the six behaviors within each of the 26 behavioral videos. The NMDS revealed three widespread behaviors (hovering, breathing, and swimming), two restricted behaviors (foraging and food searching) associated with specific TDTR parameters, and one highly-restricted behavior (resting) associated with very specific TDTR parameters. The three behaviors of hovering (16 presences / 10 absences), swimming (22 presences / 4 absences), and breathing (14 presences / 12 absences) were clustered together close 84 1965 1970 1975 1980 170
  • 85.
    to the originof the NMDS plot, indicating that these were frequent, generalized behaviors not necessarily related to any specific TDTR parameter. Swimming was often interspersed with hovering behavior, especially as the turtles would often swim very slowly, pausing in the mid- water column before resuming their flipper beats. While all videos including foraging also involved food searching behavior, turtles also quite frequently interspersed hovering between consecutive foraging events, underscoring the close association of these behaviors. Yet, because the hovering behavior was observed more frequently in the 26 videos than foraging (9 presences / 17 absences) and food searching (11 presences / 15 absences), it is the closest to the origin and to other behaviors. Foraging and food searching were closely grouped together, indicating that the occurrence of these behaviors was closely linked. Both were similarly positioned along axis 1. Resting (8 presences / 18 absences) behavior was positioned at the opposite end of axis 1 and appears distinct from all other behaviors, as its presence within a video was least related to the presence of other behaviors. The Kendall (non-parametric, tau) correlations revealed associations of the TDTR parameters with the NMDS axes (Table 7). Foraging and food searching were positively related with depth displacement, video length (axes 1 and 3), average depth, and maximum depth (axis 3). The behaviors of hovering, breathing, and swimming were related to depth displacement (axis 1), surface proportion, temperature CV, depth CV, and average temperature (axes 1 and 3). Resting was found at the opposite end of axis 1 from the two other clusters, indicating that the occurrence of this distinct behavior was therefore negatively related to depth displacement (axis 1) and surface proportion (axes 1 and 3), but positively related to average depth and maximum depth (axes 1 and 3). 85 1985 1990 1995 2000 2005
  • 86.
    Few TDTR parameterswere significantly related with any of the NMDS axes (Table 7). Depth displacement was significantly positively related with axis 1, highlighting the association of foraging, food searching, hovering, swimming, breathing, and swimming with a great deal of vertical movement, as the turtle actively moves up and down in the water column. Conversely, resting is negatively related to TDTR depth displacement – as depth displacement decreases, the amount of resting increases. The turtles did perform other behaviors in five of the eight videos involving resting, however, aligning resting behavior positively with depth displacement on axis 3, which explains a much smaller amount of the observed variance than axis 1. Maximum and average depth were significantly aligned positively with foraging, food searching, and resting along axis 3, suggesting that these behaviors occur at deeper depths. Indeed, the majority of the foraging that was video-recorded occurred in Kailua Bay, which is deeper (2-3 m) than the cove (0.5-1 m) where turtles commonly forage on algae. Maximum and average depths were also negatively significantly related to axis 1, suggesting resting occurred in deeper water than foraging activities. Resting was commonly witnessed under the ledge in the channel habitat, at deeper (2-3 m) depths. TDTR surface proportion is correlated positively with breathing and swimming (axes 1 and 3), indicating that these behaviors are associated with spending time within the top 0.5 m of the water. Breathing must occur at the surface, and swimming behavior occurred at all depths. The association between swimming and surface proportion may be coincidental as swimming behavior is so close to the origin (indicating its close relationship will all other behaviors), or may be a result of the disproportionate turtle use of shallow water (0-1 m) habitats. Depth CV is negatively related to average depth and maximum depth (axes 1 and 3), indicating that as turtles spent more time in deeper water, their depth did not fluctuate as much. 86 2010 2015 2020 2025
  • 87.
    In other words,the turtles were diving to deeper depths and remaining there, whether for foraging or resting, rather than transiting from the surface to the bottom repeatedly. Average temperature, negatively significantly related to axis 3, and temperature CV were both associated positively with axis 1 and negatively with axis 3. Because these parameters are correlated negatively with foraging, food searching, and resting along axis 3, these behaviors are associated with homogeneously colder water temperature. However, average temperature and temperature CV are positively associated with all behaviors (except resting) along axis 1. This result suggests that average temperatures are higher near the surface and that the turtles experience a larger amount of temperature fluctuation as they swim up and down while foraging, swimming, and breathing. The one conditional parameter not related to TDTR values was video length. This parameter is associated with both axes 1 and 3, and points in the direction of foraging and food searching (Figure 3). Therefore, this result suggests that as the length of the behavioral survey video increases, the likelihood of observing foraging or food searching increased. Comparison of TDTR Parameters with Behavioral Observation Videos (Logistic Regressions) Stepwise (forward and backward) binary logistic regressions revealed that four of the six behaviors documented in the videos were significantly related with one or more TDTR parameters when combined into a logistic or logit function (Table 8a-b). Complete logistic regressions using these four behaviors and their associated significant TDTR parameters revealed that none of these four behaviors could be predicted 100% of the time (“percent correct” values, Table 8a), although percentages were fairly high, and that the probability of the occurrence of each behavior was not a binary (0% or 100%) response based on the logit function 87 2030 2035 2040 2045 2050 175
  • 88.
    relationship of theassociated TDTR parameters (Figures 4-7). The lack of significance of the survey video length as a predictor parameter suggests that the varying video lengths did not introduce biases in the behavioral observations, since the ability to observe any given behavior did not vary significantly with changes in the length of the observation period. Following previous examples, three metrics were used to quantify the ability of the TDTR parameters to predict the occurrence of a specific turtle behavior (Barnett-Johnson et al. 2007; Tinker et al. 2007). Sensitivity represents the proportion of actual positives, which are identified as such (the number of data points in which both the video and TDTR data agreed a behavior occurred), and specificity represents the proportion of negatives, which are correctly identified (the number of data points in which both the video and TDTR data agreed a behavior did not occur). By using these values, the percent correct value can be determined, giving an overall assessment of the likelihood than any particular logit value will correctly predict the occurrence of a particular behavior. If the presence and absence of a behavior was perfectly predicted by its associated logit value, the sensitivity, specificity, and percent correct values (Table 8a) for this behavior would all have a value of 1.00 or 100%. A potential downfall with the analysis is that it utilized a relatively small sample size (26 videos), and therefore may not accurately depict the relationship of TDTR parameters to personal observation. Additionally, specific behaviors were removed from the logistic regression analysis (posing and body swiping) as their presence/absence data were not evenly distributed, each only occurring in one of the 26 videos. Dive behaviors could not be assigned to typical dive profile “shapes” as the shallow nature of the study site prevented this (Houghton et al. 2002), which is one of the primary methods employed by researchers in describing turtle behavior. These factors may make it difficult to apply the conclusions from this study to other relevant studies. 88 2055 2060 2065 2070 2075
  • 89.
    Foraging: depth displacement,and depth CV (Figure 4) Foraging behavior was related to the combination of increasing TDTR depth displacement, and decreasing depth CV (Table 8a). Because foraging behavior was positively correlated with depth displacement, turtles likely exhibit more vertical movement (greater depth displacement) on foraging dives. With a positive estimate value, as the odds ratio for depth displacement is greater than one, as a turtle increases its depth displacement, the likelihood of foraging behavior increases. Therefore, the degree of a turtle's vertical movement can serve as a proxy for foraging activity. Foraging was also related to decreasing depth CV, suggesting that as a turtle’s bottom depth becomes steadier, foraging behavior is more likely. This result contrasts with the relationship between foraging and depth displacement. It may be possible that if turtles spent a great amount of time foraging along the substrate, with minimal trips to the surface to breathe, this could result in a small depth CV value. But, as the 95% confidence intervals for the odds ratio of this parameter cross the value of one, and it has only marginal significance with this behavior (p = 0.06), there may also be times where foraging behavior would occur when the turtle exhibits a greater amount of variation in its depth throughout the video. It is important to remember that in order to predict the presence/absence of foraging behavior, the logistic combination of both TDTR parameters must be considered. A low sensitivity value (0.57) shows that the logistic regression performed poorly in showing agreement between the TDTR logit value and video evidence of the occurrence of foraging behavior. However, with a fairly high specificity value (0.77), the overall percent correct value was 70.0%, indicating that foraging can be inferred from TDTR data with fairly high confidence, but is not perfect in predicting the behavior. 89 2080 2085 2090 2095 180
  • 90.
    Food searching: depthdisplacement, depth CV, and surface proportion (Figure 5) Food searching behavior was related to the combination of increasing TDTR depth displacement, decreasing depth CV, and increasing surface proportion (Table 8a). The odds ratio value above 1 confirms that as TDTR depth displacement increases, the probability of food searching increases. As with foraging, food searching is negatively related to depth CV, indicating that the occurrence of this behavior increases with smaller depth CV values. While food searching, the turtles skimmed along the substrate, rarely changing their depths. However, with an odds ratio 95% confidence limit crossing the value of one, and a marginally significant p-value of 0.07, this negative relationship may not always hold – food searching did also occur with increasing depth CV values, as the turtles would surface to breathe. The occurrence of food searching increases with a larger proportion of time spent within the top 0.5 m of the water column. This result may be due to the turtles tendency to search for food in the shallow cove (where algal abundance is high), or from their tendency to take multiple breaths interspersed with food searching. Although the odds ratio 95% confidence limit interval crosses one, this relationship on its own did not always hold true. Therefore, the combination of this TDTR parameter, along with depth displacement and depth CV are needed to predict the occurrence of food searching behavior. Even though food searching occurred in every video involving foraging, foraging did not occur every time food searching was witnessed (Table 4), possibly because the turtles were not able to locate algae for consuming, or the currents or surge were too strong to allow them to graze. This may explain why food searching behavior is closer to the origin of the NMDS than foraging behavior. Despite the more generalized nature of searching behavior, its predictability increased above that of foraging: with sensitivity of 0.82, specificity of 0.87, and a higher correct 90 2100 2105 2110 2115 2120
  • 91.
    percentage (84.4%). Thisgreater explanatory power may be due to the inclusion of a third TDTR parameter – surface proportion. The more variables to explain a behavior, the more likely it is to be able to predict the presence or absence of that particular behavior. With such a high confidence level for food searching, this behavior is well predicted by the TDTR parameters. Hovering: depth displacement (Figure 6) Hovering behavior was related to increasing TDTR depth displacement (Table 8a). Because the presence/absence of hovering is also closely related to foraging and food searching (Figure 3), it was also significantly related to TDTR depth displacement. This relationship is intuitive, since turtles hover while approaching the substrate before taking a bite, and between consecutive bites. An odds ratio value above 1 once again shows that as TDTR depth displacement increases, the probability of hovering increases. However, even though the sensitivity value is fairly high (0.71), the specificity value is rather low (0.53), indicating that the logistic regression performed poorly because TDTR values consistently predicted the presence of hovering behavior not confirmed by the videos. A lower overall percent correct value of 64.1% suggests that the TDTR depth displacement parameter can predict the occurrence of hovering, but was not ground-truthed as accurately as foraging or food searching behaviors. Breathing: average temperature, depth displacement, and maximum depth (Figure 7) Breathing behavior was related to the combination of increasing TDTR average temperature, increasing depth displacement, and decreasing maximum depth (Table 8a). The relationship of breathing behavior with average water temperature likely results from the shallow nature of the site, which leads to warmer surface water. Therefore, as breathing occurs at the 91 2125 2130 2135 2140
  • 92.
    surface, it isrelated to warmer water temperatures. However, the odds ratio 95% confidence interval crossing the value of one suggests that the association of breathing in warm surface waters did not always hold true. Buoyant fresher and cooler surface water from the Kawai’nui Marsh may occasionally have replaced the warmer surface water, causing a negative relationship of water temperature and the occurrence of breathing behavior. Because turtles must swim to the surface to breathe, and often rest in deeper water, the significant relationship of this behavior with depth displacement and maximum depth is justified. However, resting turtles did occasionally swim to the surface for an extended breathing bout followed by re-submergence, never to resurface again during the video. This behavioral pattern may have resulted in a marginally significant relationship between breathing behavior and TDTR maximum depth, with an odds ratio 95% confidence limit interval which crosses the value of one. However, the logistic regression predicted this behavior with a fairly high sensitivity (0.80), specificity (0.77), and overall percent correct (78.8%) values due to the combination of multiple TDTR values. Behavioral survey video length as a confounding parameter The analysis of the logistic regressions using behavioral survey video length as a potential parameter which could affect the ability to detect specific behaviors did not yield any significant relationships (p < 0.1) with any behavior. It was hypothesized that certain behaviors, such as breathing and swimming, may be positively related to video length as these are generalized behaviors that all turtles perform at regular intervals, or that the frequency of more specific behaviors, such as foraging and food searching behavior would increase with increasing video length as the likelihood of those activities being captured on film would increase. 92 2145 2150 2155 2160 2165 185
  • 93.
    Predicting Behaviors withinHabitat Using 2-Minute Video Segments The contingency tables (G-tests; Table 9) analysis of the occurrence of each behavior within specific habitats revealed a lack of independence for four “specialized” behaviors: foraging, food searching, resting, and breathing behaviors. It was expected that foraging, food searching, and resting would occur within specific habitats as the majority of foraging and food searching was witnessed within the cove, Kailua Bay, and rocky shore habitats, and resting was primarily seen under the ledge habitat within the channel. However, breathing was also dependent on habitat. This behavior never occurred in Kailua Bay (on 15-second interval data points), even though it did occur in the channel / ledge, cove, and rocky shore habitats. While breathing is expected to occur in the foraging habitats (Kailua Bay, cove, and rocky shore), it also occurred in the channel / ledge when resting turtles surfaced to breathe. Conversely, two generalized behaviors occurred widely, independent of habitat: hovering and swimming. These generalized behaviors are often interspersed with foraging and breathing, or even follow resting behavior. Stepwise logistic regressions to determine which TDTR parameters were significantly related to specific behaviors within particular habitats revealed three significant relationships. Resting behavior was significantly related to increasing TDTR average depth and decreasing maximum depth in the channel / ledge; breathing behavior was significantly related to increasing TDTR temperature CV in the channel / ledge; and hovering behavior was significantly related to decreasing TDTR average temperature, increasing depth displacement, and increasing surface proportion across all habitats. Complete logistic regressions relating the occurrence of these behaviors to their associated significant TDTR parameters within specific habitats revealed that behaviors were predicted more accurately without partitioning behavior by habitat (Table 10a-b), 93 2170 2175 2180 2185 2190
  • 94.
    as the logisticregressions of the 2-minute video segments yielded smaller sensitivity, specificity, and percent correct values than the logistic regressions of the full videos. The ability to predict hovering behavior decreased to 62.0% for all habitats (from 64.1%) and breathing behavior (within the channel / ledge) decreased to 69.0% (from 78.8% from all habitats). However, resting behavior was found to have a significant relationship with specific TDTR parameters within the channel / ledge (whereas it had no significant relationship with the analysis from the full videos), the model allowing the behavior to be predicted correctly 77.0% of the time. Resting: TDTR average depth and decreasing maximum depth in the channel / ledge Resting was significantly related to decreasing maximum depth and increasing average depth within the channel / ledge, the only habitat where this behavior occurred (Table 10a). In particular, the TDTR average depth parameter has a larger influence on the logit value for each 2-minute video segment, given its larger coefficient estimate. As stated above, the turtles did rest under the ledge within the channel, at the deeper depths within the site. This behavior can be predicted correctly within the channel / ledge 77% of the time (with a sensitivity of 0.71 and specificity of 0.82) using these two TDTR parameters alone. Breathing: TDTR temperature CV in the channel / ledge Although breathing behavior occurred in three of the four habitats (channel / ledge, cove, and rocky shore), it was only significantly related to the TDTR parameter of temperature CV within the channel / ledge (Table 10a). The significance of the TDTR temperature CV may be related to the turtles’ swimming from deep resting locations (approximately 2-3 m) to the surface to take a breath. This behavior was predicted correctly 69.0% of the time, with a sensitivity of 94 2195 2200 2205 2210 190
  • 95.
    0.40 and specificityof 0.79. As breathing behavior did occur in Kailua Bay (during 2-minute segments that spanned multiple habitats), and with such a low sensitivity, this result must be taken with caution. Hovering: TDTR average temperature, depth displacement, and surface proportion across all habitats Hovering behavior, which was a widespread behavior independent of habitat, was found significantly related to decreasing average temperature, increasing depth displacement, and increasing surface proportion (Table 10a). Hovering turtles do not stay at one depth level, but rather move up and down, leading to an increasing TDTR depth displacement. Hovering turtles also experience cooler water temperatures in the deeper water when slightly negatively buoyant (leading to a decreasing TDTR average temperature), and spend more time within the top 0.5 m of the water column when slightly positively buoyant (leading to an increasing TDTR surface proportion), leading to a sensitivity of 0.63, specificity of 0.60, and correct percentage value of 62.0%. DISCUSSION: Comparison of Presence/Absence of Behaviors (NMDS Analysis) Behaviors were separated into three groups according to the NMDS, indicating that specialized behaviors (foraging and food searching) and highly specialized behaviors (resting) occur independently of each other, with generalized behaviors (swimming, breathing, and hovering) occurring amongst all types of specialized behaviors. In three of the eight videos involving resting behavior, the turtles performed no other behavior (including any generalized 95 2215 2220 2225 2230 2235
  • 96.
    behaviors), resting forthe entire duration of the video. This is not surprising, given evidence that green turtles can rest in shallow foraging locations for up to 60 minutes (Hazel et al. 2009). In the other five videos involving resting, the behavior was almost always followed by breathing (whether or not it was recorded on the instantaneous 15-second interval), and subsequently swimming behavior. The separation of active and inactive behaviors has been frequently encountered in green turtles (e.g., Mendonca 1983; Hays et al. 1999; Hays et al 2000b; Seminoff et al. 2001; Makowski et al. 2006; Rice and Balazs 2008; Hazel et al. 2009; I-Jiunn 2009; Blumenthal et al. 2010). Hawksbill turtles also partition their resting and foraging behaviors into different time periods of the day (van Dam and Diez 1996; Blumenthal et al. 2009; Witt et al. 2010). At some locations, turtles will perform resting and foraging behaviors in conjunction with one another, such as in Cyprus (Hochscheid et al. 1999) and at Laguna San Ignacio, off the Pacific coast of Baja California, Mexico, where green turtles are active at all times of the day (Senko et al. 2010), indicating that they must interchange active dives with resting dives on a regular basis. Juvenile hawksbill turtles have also shown an alternating pattern of short foraging dives followed immediately by deeper, longer resting dives (Houghton et al. 2003). Foraging and food searching behaviors were positively related with depth displacement, and average and maximum depth, indicating that the turtles were swimming from the substrate, where they would forage or search for algae, to the surface frequently while performing these behaviors. Foraging and food searching dives involve a higher metabolic demand than inactive dives (Hays et al. 1999), likely due to the extra vertical movement turtles must exhibit to replenish their quickly depleted oxygen stores (Houghton et al. 2003). Resting behavior was primarily negatively related to depth displacement and surface proportion, indicating less vertical movement and less time at the surface on resting dives, despite performing other behaviors 96 2240 2245 2250 2255
  • 97.
    alongside resting infive out of eight videos. Resting behavior was also positively correlated with average and maximum depth. Green turtles have previously been documented to rest in deeper water in Hawai’i (Brill et al. 1995) and in other locations (Bjorndal 1980; Mendonca 1983; Southwood et al. 2003; Makowski et al. 2006; Yasuda and Arai 2009). Generalized behaviors were positively related with depth displacement, surface proportion, temperature CV, average water temperature, and depth CV, showing that the turtles would greatly vary their depth while performing these behaviors, with higher water temperatures nearer the surface. Comparison of TDTR Parameters with Behavioral Observation Videos (Logistic Regressions) The logistic regression analyses confirm certain inferences made regarding the relationships of specific behaviors to specific TDTR parameters from the NMDS. The logistic regressions indicate only four (marginally) significant relationships between the TDTR parameters and the witnessed behaviors, these inferences must be considered with caution, particularly as so many parameters have a p-value above the critical value of 0.05 suggesting only marginal or non-significance. Foraging: depth displacement, and depth CV; Food searching: depth displacement, depth CV, and surface proportion (Figures 4-5) The combination of increasing TDTR depth displacement and decreasing depth CV were ground-truthed as a fairly reliable proxy for a turtle’s foraging and food searching activities. Turtles must surface frequently while foraging or food searching to replenish quickly depleted oxygen stores during heavily exertive activities, such as foraging (Houghton et al. 2003; Southwood et al. 2003). For instance, I-Jiunn (2009) found that on active-type dives turtles stay 97 2260 2265 2270 2275 2280 195
  • 98.
    at specific depthsfor very short time periods, consequently exhibiting a great amount of vertical movement, resulting in an erratic bottom profile with a high standard deviation of bottom depth. This is in direct contrast to the second component that was found in the current study to describe foraging and food searching behaviors: along with increasing depth displacement, foraging behavior also occurred as a turtle’s bottom depth became steadier (decreasing depth CV). It is likely that a small sample size may have caused this contrast, causing a marginally significant result that would have otherwise been insignificant. Food searching behavior was described by a third TDTR variable as well – increasing time within the top 0.5 m of the water column. The shallow cove, full of algae, was consistently used by the turtles for foraging. Green turtles are known to forage at shallower depths than where they perform other behaviors (Seminoff et al. 2001; Salmon et al. 2004; Hart and Fujisaki 2010). Hovering: depth displacement (Figure 6) Hovering was positively related with TDTR depth displacement. The changing depths associated with hovering may have been due to currents or slight flipper movements moving the turtles vertically. Breath size may have also affected a turtle’s vertical movement while hovering. The number and sizes of breaths sea turtles take regulates the balance of gasses within their bodies (Hochscheid et al. 1999) and controls their underwater buoyancy, determining the depth at which the turtle will reach neutral buoyancy as its lungs compress as the turtle dives (Hays et al. 2000b). When returning to the surface, the lungs expand, assisting the turtle to reach the surface, expending less energy to do so (Hays et al. 2007). As turtles would begin to move slightly vertically, their lung volume would change, affecting their buoyancy, and likely further augmenting their vertical movements. 98 2285 2290 2295 2300 2305
  • 99.
    Breathing: average temperature,depth displacement, and maximum depth (Figure 7) Breathing was significantly related to increasing depth displacement and decreasing maximum depth. Turtle submergence intervals and diving depths are strongly related to activity level (Brill et al. 1995; I-Jiunn 2009), with Hawaiian green turtles known to take a single breath between subsequent shallow foraging bouts and only taking a few seconds before returning to their foraging (Rice et al. 2000). A greater amount of activity (increased depth displacement) will require that the turtles surface to regulate the oxygen gas balance (Hochsheid et al. 1999). Long duration dives in shallow sites, such as in the current study, are often associated with resting behavior on the sea floor (Hays et al. 1999), resulting in a lower overall activity level and therefore fewer number of breaths when in slightly deeper waters. Brill et al. (1995) also found that long and regular dives by green turtles were associated with minimal movement on the substrate (defined as resting behavior), while dives with more activity were typically much shallower and shorter in duration (defined as foraging behavior), and involved more surfacing events. Colder water temperatures have also been linked to longer dives, and therefore fewer breathing events (Hazel et al. 2009), making it more likely for breathing to occur in warmer water, as was found in the current study. Other behaviors not significantly related to TDTR parameters It is quite impressive that no other significant logistic regression relationships occurred, particularly for the behavior of resting, which is separated from all other behaviors within the NMDS. Yet, because of the long duration of the videos, the signature of resting behavior in the TDTR record was likely blurred. Five out of eight videos in which resting occurred also involved other behaviors with substantial vertical displacement, like breathing and swimming. 99 2310 2315 2320 2325 200
  • 100.
    And, as swimmingbehavior was performed in 22 of the 26 videos, its presence may have been too pervasive for TDTR data to describe it. It is also interesting that no individual behavior (other than breathing behavior being marginally related to increasing average water temperature) was directly related to any temperature parameters, possibly due to the shallow nature of the site with minimal temperature changes from the surface to the bottom. In the current study, the TDTR temperature varied only slightly during these 26 videos (maximum difference of 2.19°C, average of 0.56 ± 0.54°C S.D.) A lack of a relationship between behavior and water temperature has been found in previous studies. I-Jiunn (2009) found a non-significant relationship between water temperature and the length of the inter-nesting interval at Wan-an Island, Penghu Archipelago, Taiwan, suggesting minimal behavioral thermoregulation. Yasuda and Arai (2009) also found no noticeable effect of water temperature on the diving behavior of green turtles at Huyong Island, Thailand, perhaps because they inhabited a small temperature range (mean ambient water temperature during the bottom phase of dives ranging from 28.23 ± 1.54 °C S.D. to 29.31 ± 0.69 °C S.D.). Due to the small difference in water temperature found in the current study, it is very unlikely that it had an effect on buoyancy (Rice and Balazs 2008). Therefore, temperature was very unlikely to affect turtle behavior. Behavioral survey video length as a confounding parameter One major difference between the NMDS analysis and the logistic regressions is that the logistic regressions suggest that video length is not related to any behavior, while it is related to foraging and food searching behaviors in the NMDS, although the NMDS result was not statistically significant. It is possible that the overall maximum video length (eight to ten 100 2330 2335 2340 2345 2350
  • 101.
    minutes) was tooshort to significantly capture any behavioral events. Therefore, there was no evidence of a confounding effect by the video length variable within the logistic regression analyses, as it was not significantly related to the occurrence of any of the behaviors considered. Predicting Behaviors within Habitats Using 2-Minute Video Segments A smaller explanatory power than with the logistic regression results utilizing full video lengths may be due to a smaller dataset, as the 2-minute video segments utilized only 8 data points, possibly not a large enough sample size to obtain higher percentage correct values. Tinker et al. (2007) found incredible variation between feeding bouts for sea otters, likely due to their small TDR sample size when utilizing the logistic regression method. However, increasing the time length of the video segments connected to specific habitats would have greatly decreased the overall number of records of turtles within one habitat, making this analytical method impractical. It is important to note that the logistic regression analysis using the 2- minute video segments is a novel method to relate turtle behaviors to TDTR parameters within specific habitats. The 2-minute snapshots were selected to separate the videos into four discrete segments, each within a unique specific habitat. Because this fine-scale analysis used multiple consecutive segments from the same videos, with different segments and videos per tagged turtle, any estimates of turtle behavioral rates would be susceptible to pseudoreplication, potentially inhibiting or biasing the results, describing differences amongst turtles and not habitats (Hurlbert 1984). 101 2355 2360 2365 2370
  • 102.
    Significant Results, 2-minutelogistic regressions Foraging, food searching, resting, and breathing behaviors were found to be habitat- dependent behaviors, with resting and breathing each significantly described by TDTR parameters. Hawaiian green turtles are known to perform habitat-specific behaviors. Typical foraging grounds include reef flats and shallow rocky shelves, often not exceeding three meters in depth (like the cove and rocky shore), and turtles often rest in vertical crevices or vertical- walled channels within a reef flat, both of which are typically shallower than eight meters (like the channel and ledge; Balazs et al. 1987; Rice et al. 2000). Breathing was also found to be a site-specific behavior, but only did not occur in Kailua Bay when dividing videos into 2-minute segments solely contained within a specific habitat. As turtles must surface to breathe frequently while foraging (Balazs 1980; Rice et al. 2000), a common behavior in Kailua Bay, it is likely due to chance that this behavior was not recorded there and was witnessed in the other habitats. Hovering behavior was found to be a generalized behavior, just as in the full video logistic regressions. Non-significant results: other behaviors Swimming may not have been significantly related to any TDTR parameters within the 2- minute video segments because this behavior was so common within each habitat, with its habitat-specific associations, that its overall occurrence may have been too difficult for the logistic regressions to predict. Additionally, foraging and food searching behaviors were not found to be significant with any TDTR parameters within either the cove or Kailua Bay, where these behaviors predominantly occurred. A lack of a significant relationship with foraging and 102 2375 2380 2385 2390 2395 205
  • 103.
    food searching behaviorsmay have been due to their dispersion with other generalized behaviors such as swimming and hovering. Benefits of Performing Personal Observation While TDRs have revolutionized the study of turtle diving behavior, they cannot describe the full range of behavioral patterns that can be documented using visual observations (Houghton et al. 2002). Direct observations of animal behavior are useful for studying an organism within its natural habitat, for understanding an animal’s function within its ecosystem, and for confirming inferences using electronic or remote technology (Hochscheid et al. 1999; Houghton et al. 2003; Schofield et al. 2006). Field observations of behavior are critical to the effective conservation of animals in their natural habitat (Mills et al. 2005). There are several benefits of using personal observations to augment time-depth-recorder (TDR) data, by including information on the location, and the actual behavior of the turtles. For example, an inherit problem of using TDRs is that the researcher must define specific parameters, such as the sampling rate of the device. If the sampling rate is too course, dive statistics such as the average number of dives each day, duration of the dives, and maximum achieved depth can supply false results (Hagihara et al. 2011). Therefore, comparing different studies of dive shapes and geographical locations presents data analysis problems that may involve subjective judgments or arbitrary decisions (Fedak et al. 2001). One must be very cautious when applying a dive type to a specific behavior as inferring turtle movement and behavior from dive profiles alone is problematic and, at times, somewhat circular (Schofield et al. 2006; Seminoff et al. 2006; Blumenthal et al. 2009). 103 2400 2405 2410 2415
  • 104.
    Additionally, turtle behaviorcan vary across (Hazel 2009), and even within, habitats. Resting green turtles off Ascension Island dive to similar depths (20-25 m) as do foraging green turtles off the coast of Japan (Hays et al. 2000b; Hatase et al. 2006). Resting and foraging depths are also dependent on the bathymetry of the site (Hatase et al. 2006; Seminoff et al. 2006). Even habitat type and quality can affect the home range, and the behavioral repertoire, of a turtle (Makowski et al. 2006). Yet, TDRs report only the depth of the dive, not the location. Green turtles may also perform novel behaviors, which would not be quantifiable using TDR data alone. For example, adult female green turtles actually feed in water deeper than 200 m, but this rarely occurs (Troëng et al. 2005; Hatase et al. 2006). Even though green turtles are primarily herbivorous, certain individuals may occasionally consume sponges, mollusk eggs, and jellyfish (Bjorndal 1997), thus changing their foraging behavior. For instance, at some inter-nesting locations, turtles may perform many types of behaviors dependent on the availability of prey – they may forage if food is available or rest if there is none (Houghton et al. 2008). It would be necessary to perform visual observations of the site in order to fully understand the behaviors being performed by these turtles. Brill et al. (1995) found that green turtle movement behavior in Kaneohe Bay (O’ahu) varied greatly amongst individuals. While some turtles moved extensively, traversing between channels separating shoreline reef flats, patch reefs, and the sandbar, others remained within shallow water with significant coral cover and algae growth. Moreover, as the turtle population recovers in Hawai’i (Chaloupka et al. 2008b), their behavioral patterns have changed, with a switch from night-time to daytime foraging, being very tolerant to human presence, basking on shore, and gathering in underwater cleaning stations (Balazs 1996). Such changes of existing behavioral patterns and the onset of new behaviors would be very difficult to interpret solely 104 2420 2425 2430 2435 2440 210
  • 105.
    using TDR data.Therefore, augmenting TDTR studies with visual observations can provide a clear picture of the behavioral repertoire and even reveal behaviors not known to previously exist. Other Studies Utilizing Personal Observation for Green Turtle Behavior To date, there is a paucity of studies which utilize a rigorous methodology of personal observation to quantify green turtle diving behavior (Schofield et al. 2006), especially ones which also include the use of electronic devices to collect diving data (Table 11 provides an extensive list of publications on green turtle behavior which have implemented visual observations). Personal observations of turtle diving behavior range from “casual” in which researchers briefly mention a sporadically witnessed behavior, with no formal methodology, to studies with “rigorous” pre-meditated personal observation methods to quantify the behavior of the species. Casual personal observation papers will have only a sentence or two mentioning that a sporadic or random observation confirmed their results. For example, Southwood et al. (2003) inferred that green turtles at Heron Island in Australia most likely rest while performing shallow dives at night, confirmed by a brief chance observation. As another example, Carr and Meylan (1980) happened upon three green turtle hatchlings swimming in a sargassum mat and briefly described their observations as a side note in their study of the movements of an adult female green turtle. The authors made no further behavioral observations of these hatchlings. Or, personal observations can be slightly more rigorous, but still not complete enough to truly describe diving behavior. Although studying hawksbill sea turtles (Eretmochelys imbricata) in the Cayman Islands, Blumenthal et al. (2009) used a combination of TDRs, acoustic devices, and focal observations to study diving behavior. Their study focused primarily 105 2445 2450 2455 2460
  • 106.
    on the TDRand acoustic results, with a quick discussion of their personal observation methodology: 39 instantaneous recordings of hawksbill behavior were recorded as each turtle was captured, broken into six categories (feeding, breathing, swimming, hovering, fleeing, or resting/motionless). As more active behaviors were encountered during the day, the authors concluded that diurnal dives must have involved searching, traveling, and feeding. The authors made continuous observation (a more rigorous methodology, like in the current study) for only one dive of one turtle. Although casual observations may sometimes be useful, they do not necessarily quantify turtle diving behavior in an ecologically meaningful way. More rigorous personal observations on turtle diving behavior have been performed in a variety of ways. One prominent methodology is the use of a Crittercam, a video camera which is attached to the carapace of a turtle to video record its behavior. This methodology allows first- hand observation of animal behavior (Schofield et al. 2006) and has been used on green turtles (e.g., Heithaus et al. 2002; Seminoff et al. 2006; Hays et al. 2007) and other turtle species (e.g., loggerheads, Caretta caretta – Heithaus et al. 2002; leatherbacks, Dermochelys coriacea – Reina et al. 2005). Crittercams have shown the existence of previously unknown turtle behaviors, such as swimming to the benthos to rub their bodies on rocks and sponges for cleaning purposes (Heithaus et al. 2002). They also allow true documentation of the amount of time spent performing each behavior, and the location in which it occurs, with more precise behavioral detail. For example, Seminoff et al. (2006) was able to break green turtle foraging behavior into three specific categories: active benthic foraging, active midwater foraging (may appear as swimming behavior using only TDR data), and stationary benthic foraging (may appear to be resting using only TDR data). The intensity and number of flipper beats can also be recorded, a great metric for energy expenditure (Hays et al. 2007). Losey et al. (1994) filmed turtles in situ 106 2465 2470 2475 2480 2485
  • 107.
    to record theassociation of the posing behavior at cleaning stations with the wrasse Thalassoma duperry. Like Losey et al. (1994), we opted to film individual turtles for shorter durations over a longer study period, but on a different temporal scale. Video technology used for behavioral observation does have its drawbacks, however. Crittercams (and other video cameras) are limited in the amount of memory they can store. Night also creates great light limitations in capturing clear video footage. Therefore, other video recording techniques may be applicable. Fuller et al. (2009) used a camera device called an Underwater Timed Picture Recorder to record still images of green turtle behavior, with a flash, over a much longer temporal scale than is capable with Crittercam technology. The authors also suggest video technology that could be triggered on/off by jaw movement of the turtle, to only record those behaviors, such as foraging, that are of most interest thereby saving the battery and memory space of the device. Personal observation methodologies can still be rigorous without the use of video technology. Some studies recorded behavioral observations while working in the field, rather than analyzing video data. Whittow and Balazs (1982) utilized a single observer to keep a complete behavioral record of green turtles basking on shore in Hawai’i, recording the turtle’s movements, behavior, orientation to the sun and wind and respiratory patterns. While a few studies monitor turtle behavior from shore or a boat (e.g., Carr and Meylan 1980; Whittow and Balazs 1982; Quaintance et al. 2002), most studies make use of in-water observation of green turtle diving behavior (e.g., Booth and Peters 1972; Frick 1976; Witzell 1982; Losey et al. 1994; Börjesson 2000; Rice et al. 2000; Houghton et al. 2003; Salmon et al. 2004; Schofield et al. 2006). For instance, Booth and Peters (1972) used direct underwater observations to document green turtle mating behavior as well as posing behavior while being cleaned by cleaner fish. 107 2490 2495 2500 2505 2510 215
  • 108.
    Some studies utilizedtransect lines to document turtle diving behavior, making note of instantaneous behaviors and location (Rice et al. 2000; loggerhead sea turtles – Houghton et al. 2003), as well as environmental conditions (Börjesson 2000). Other studies, such as the current study, are more focal-animal based rather than based on instantaneous observations of behavior. Frick (1976) and Salmon et al. (2004) released and then monitored the diving behaviors of individual green turtle hatchlings. Schofield et al. (2006) actually recorded a total of 286 hours of loggerhead turtle observations with 1534 sightings of activity. Other observational methods have been utilized as well: although studying loggerhead sea turtles, Frick et al. (2000) used a low-flying aircraft running transects over SE Georgia and NE Florida to document courtship behavior. The number of studies comparing TDR data with visual behavioral observations remains limited, and not just for green turtles, but for all air-breathing marine vertebrates. A few examples do exist. Davis et al. (2003) used video/data recorders on 10 adult Weddell seals, revealing four different dive types, determining that previous studies utilizing TDRs alone had misclassified certain dive types. Tinker et al. (2007) compared TDR data on California sea otters to observational data as an attempt to validate TDR data to detect differences in diet and foraging behavior amongst dives. The authors used a multivariate clustering method to cluster 13 adult female sea otters based on six defined dive parameters recorded by the TDRs. The final solution described three clusters of dive types, each based on specific diet type and foraging strategy of each individual. Only one (of 13) individuals was misclassified, as shown by personal observation, showing that TDR data can be used > 90% of the time to identify specific diets and foraging behavior. In another study, an Underwater Timed Picture Recorder (UTPR) camera was placed on six lactating female fur seals to differentiate feeding dives from other dives with 108 2515 2520 2525 2530
  • 109.
    similar TDR-based two-dimensionaldive shapes. Lastly, even though Fuller et al. (2009) described the lack of studies comparing TDR data with personal observations, they did not include any TDR methodology in their study alongside personal observation. There are a limited number of examples in which TDR data is directly compared with personal observation data for green turtles. Ballorain (2010) used snorkel and scuba surveys to visually record dive behaviors (feeding, travelling, and resting) of green turtles, later to be compared to a principal component analysis using 10 dive parameters collected by the TDRs. However, their personal observations were used merely to confirm inferences made using the TDR data, rather than used in a statistical analysis to determine the extent to which the data collected by the TDRs truly describes the turtles’ behaviors. Another study (Rice et al. 2000) used only one green turtle as a subject, visually observing the turtle’s behaviors while on shore and snorkeling. Visual observations were used solely to later associate specific TDR dive profiles with certain behaviors. However, as individual turtles can show great variability in the behaviors they perform and individuals within a sub-population can behave differently (Hays et al. 1999), it is necessary to analyze multiple subjects to account for that inherent variability, as done in the current study. Difficulties Associated with Performing Personal Observations There are a great number of difficulties associated with the use of visual observations to study green turtle diving behavior. Direct observations are constrained by logistical limitations and environmental conditions such as depth, sea state, visibility, availability of natural light, and the risk to the researcher (Hooker and Baird 2001, Myers et al. 2006). Records are typically brief or opportunistic, and the presence of the researcher may disrupt any natural behaviors, 109 2535 2540 2545 2550 2555 220
  • 110.
    biasing the observations(Witt et al. 2010). Therefore, many studies rely on inferences from animal-borne devices, such as TDRs, to collect behavioral data (Schofield et al. 2006). Video equipment, such as Crittercams, can be used on larger individuals, but are not suitable for smaller animals due to body size constraints. Additionally, these cameras are large, costly, and memory constrained (Moll et al. 2007). CONCLUSIONS: The majority of studies which utilize time-depth recorders (TDRs) to study green turtle diving behavior do not accompany this methodology with visual observations to ground-truth any behavioral assumptions made using the TDR data with the true behavior being performed. Ground-truthing TDR data is imperative to determine the actual behaviors of the turtles, and to learn the extent to which the TDR data can be used to infer specific behaviors. By comparing video-recorded personal observations of juvenile green turtles on 26 separate incidences to concurrent time-depth-temperature recorder (TDTR) data, this study determined the true behavior performed at this shallow foraging site, and concluded that TDTR data alone can describe turtle behavior at the Kawai’nui Marsh Estuary to a great degree, even when divided into discrete habitats where specific behaviors are known to occur, but is insufficient on its own to describe a turtle’s full behavioral repertoire. Using binary logistic regression models, only four (foraging, food searching, hovering, and breathing) of the six behaviors considered were (marginally) significantly related to specific TDTR parameters. When analyzing behaviors within 2-minute segments to associate specific behaviors with specific habitats, the ability to predict behavior decreased. Therefore, analyzing behavior by specific habitat within the study site does not increase the likelihood of correctly 110 2560 2565 2570 2575
  • 111.
    identifying behaviors basedon TDTR data alone. To best understand juvenile green turtle behaviors, it is important that personal observations augment the deployment of TDRs to best ensure field studies are capturing and describing the full behavioral repertoire of green turtles in heterogeneous habitats. REFERENCES: Altmann, J. 1974. Observational study of behavior: sampling methods. Behaviour 49(3): 227- 267. Asuncion, B. 2010. Characterizing juvenile green sea turtle (Chelonia mydas) habitat use in Kawai’nui, O’ahu: a multi-disciplinary approach. Master’s thesis, Hawai’i Pacific University, Kaneohe, HI. 89 pp. Balazs, G.H. 1980. Synopsis of biological data on the green turtle in the Hawaiian Islands. U.S. Department of Commerce, NOAATM-NMFS-SWFC-7, Honolulu, HI. 141 pp. Balazs, G. H. 1996. Behavioral changes within the recovering Hawaiian green turtle population. In Keinath, J.A., Barnard, D.E., Musick, J.A., and Bell, B.A., compilers. Proceedings of the fifteenth annual symposium on sea turtle biology and conservation, February 20–25, 1995. NOAA Technical Memorandum NMFS–SEFSC-387:16–21. Balazs, G.H., and Chaloupka, M. 2004. Spatial and temporal variability in somatic growth of green sea turtles (Chelonia mydas) resident in the Hawaiian Archipelago. Marine Biology 145:1043-1059. Balazs, G.H., Forsyth, R.G., and Kam, A.K.H. 1987. Preliminary assessment of habitat utilization by Hawaiian green turtles in their resident foraging pastures. U.S. Dep. Commer., NOAA Tech. Memo. NOAA-TM-NMFS-SWFC-71, 107 p. Balazs, G.H., Miya, R.K., and Beavers, S.C. 1996. Procedures to attach a satellite transmitter to the carapace of an adult green turtle, Chelonia mydas. Proceedings of the Fifteenth Annual Symposium on Sea Turtle Biology and Conservation. NOAA Technical Memorandum NMFS-SEFSC-387, pp. 21-26 Ballorain, K. 2010. Ecologie trophique de la tortue verte Chelonia mydas dans les herbiers marins et algueraies du sud-ouest de l’océan Indien. Doctoral thesis, University of Strausbourg, France. 286 pp. Barnett-Johnson, R., Grimes, C.B., Royer, C.F., and Donohoe, C.J. 2007. Identifying the contribution of wild and hatchery Chinook salmon (Oncorhynchus tshawytscha) to the 111 2580 2585 2590 2595 2600 2605 2610 2615
  • 112.
    ocean fishery usingotolith microstructure as natural tags. Canadian Journal of Fisheries and Aquatic Sciences 64:1683-1692. Bjormdal, K.A. 1980. Nutrition and grazing behavior of the green turtle Chelonia mydas. Marine Biology 56:147-154. Bjorndal, K. A. 1997. Foraging ecology and nutrition of sea turtles. In Lutz, P. L., and Musick, J.A., editors. The biology of sea turtles. CRC Press, Boca Raton, Florida, USA. Pp 199– 231. Blumenthal, J.M., Austin, T.J., Bothwell, J.B., Broderick, A.C., Ebanks-Petrie, G., Olynik, J.R., Orr, M.F., Solomon, J.L., Witt, M.J., and Godley, B.J. 2009. Diving behavior and movements of juvenile hawksbill turtles Eretmochelys imbricata on a Caribbean coral reef. Coral Reefs 28:55-65. Blumenthal, J.M., Austin, T.J., Bothwell, J.B., Broderick, A.C., Ebanks-Petrie, G., Olynik, J.R., Orr, M.F., Solomon, J.L., Witt, M.J., and Godley, B.J. 2010. Life in (and out of) the lagoon: fine-scale movements of green turtles tracked using time-depth recorders. Aquatic Biology 9:113-121. Booth, J., and Peters, J.A. 1972. Behavioural studies on the green turtle (Chelonia mydas) in the sea. Animal Behaviour 20:808-812. Börjesson, L. 2000. An ecological assessment of green turtles (Chelonia mydas) in coastal foraging and resting habitats of Kailua Bay, Laniakea, and Papailoa, on O’ahu, Hawaiian Islands. Master of Science Thesis, The Department of Marine Ecology, University of Gothenburg, Sweden, 28 p. Brill, R.W., Balazs, G.H., Holland, K.N., Chang, R.K.C., Sullivan, S., and George, J.C. 1995. Daily movements, habitat use, and submergence intervals of normal and tumor-bearing juvenile green turtles (Chelonia mydas) within a foraging area in the Hawaiian Islands. Journal of Experimental Marine Biology and Ecology 185:203-218. Carr, A., and Meylan, A.B. 1980. Evidence of passive migration of green turtle hatchlings in sargassum. Copeia 1980(2):366-368. Chaloupka, M., Work, T.M., Balazs, G.H., Murakawa, S.K.K., and Morris, R. 2008a. Cause- specific temporal and spatial trends in green sea turtle strandings in the Hawaiian Archipelago (1982-2003). Marine Biology 154:887-898. Chaloupka, M., Bjorndal, K.A., Balazs, G.H., Bolten, A.B., Ehrhart, L.M., Limpus, C.J., Suganuma, H., Troëng, S., and Manami, Y. 2008b. Encouraging outlook for recovery of a once severely exploited marine megaherbivore. Global Ecology and Biogeography 17:297-304. Clarke, K. R. 1993. Non-parametric multivariate analyses of changes in community structure. Australian Journal of Ecology 18:117-143. 112 2620 2625 2630 2635 2640 2645 2650 2655 2660 2665 225
  • 113.
    Davis, E.E., Rice,M.R., Harrington, K.A., and Balazs, G.H. 2000. Green turtle diving and foraging patterns at Puako, Hawai’i. Proceedings of the Nineteenth Annual Symposium on Sea Turtle Conservation and Biology. NOAA Technical Memorandum NMFS-SEFSC- 443, pp. 153-154. Davis, R.W., Fuiman, L.A., Williams, T.M., Horning, M., Hagey, W. 2003. Classification of Weddell seal dives based on 3-dimensional movements and video-recorded observations. Marine Ecology Progress Series 264:109-122. Fedak, M.A., Lovell, P., and Grant, S.M. 2001. Two approaches to compressing and interpreting time-depth information as collected by time-depth recorders and satellite-linked data recorders. Marine Mammal Science 17(1):94-110. Frick, J. 1976. Orientation and behaviour of hatchling green turtles (Chelonia mydas) in the sea. Animal Behaviour 24:849-857. Frick, M.G., Slay, C.K., Quinn, C.A., Windham-Reid, A., Duley, P.A., Ryder, C.M., and Morse, L.J. 2000. Aerial observations of courtship behavior in loggerhead sea turtles (Caretta caretta) from southeastern Georgia and northeastern Florida. Journal of Herpetology 34(1):153-158. Fuller, W.J., Broderick, A.C., Hooker, S.K., Witt, M.J., and Godley, B.J. 2009. Insights into habitat utilization by green turtles (Chelonia mydas) during the inter-nesting period using animal-borne digital cameras. Marine Technology Society Journal 43(3):51-59. Glen, F., Broderick, A.C., Godley, B.J., Metcalfe, J.D., and Hays, G.C. 2001. Dive angles for a green turtle (Chelonia mydas). Journal of the Marine Biological Association of the United Kingdom 81:683-686. Godley, B.J., Richardson, S., Broderick, A.C., Coyne, M.S., Glen, F., and Hays, G.C. 2002. Long-term satellite telemetry of the movements and habitat utilisation by green turtles in the Mediterranean. Ecography 25:352-362. Godley, B.J., Blumenthal, J.M., Broderick, A.C., Coyne, M.S., Godfrey, M.H., Hawkes, L.A., and Witt, M.J. 2008. Satellite tracking of sea turtles: Where have we been and where do we go next? Endangered Species Research 4:3-22. Hagihara, R., Jones, R.E., Sheppard, J.K., Hodgson, A.J., and Marsh, H. 2011. Minimizing errors in the analysis of dive recordings from shallow-diving animals. Journal of Experimental Marine Biology and Ecology 399:173-181. Hart, K.M., and Fujisaki, I. 2010. Satellite tracking reveals habitat use by juvenile green sea turtles Chelonia mydas in the Everglades, Florida, USA. Endangered Species Research 11:221-232. 113 2670 2675 2680 2685 2690 2695 2700 2705 2710
  • 114.
    Hatase, H., Sato,K., Yamaguchi, M., Takahashi, K., and Tsukamoto, K. 2006. Individual variation in feeding habitat use by adult female green turtles (Chelonia mydas): are they obligately neritic herbivores? Oecologia 149:52-64. Hays, G.C., Luschi, P., Papi, F., del Seppia, C., and Marsh, R. 1999. Changes in behaviour during the internesting period and post-nesting migration for Ascension Island green turtles. Marine Ecology Progress Series 189:263-273. Hays, G.C., Hochscheid, S., Broderick, A.C., Godley, B.J., and Metcalfe, J.D. 2000a. Diving behaviour of green turtles: dive depth, dive duration and activity levels. Marine Ecology Progress Series 208:297-298. Hays, G.C., Adams, C.R., Broderick, A.C., Godley, B.J., Lucas, D.J., Metcalfe, J.D., and Prior, A.A. 2000b. The diving behaviour of green turtles at Ascension Island. Animal Behaviour 59:577-586. Hays, G.C., Broderick, A.C., Glen, F., Godley, B.J., Houghton, J.D.R., and Metcalfe, J.D. 2002. Water temperature and internesting intervals for loggerhead (Caretta caretta) and green (Chelonia mydas) sea turtles. Journal of Thermal Biology 27:429-432. Hays, G.C., Metcalfe, J.D., Walne, A.W., and Wilson, R.P. 2004. First records of flipper beat frequency during sea turtle diving. Journal of Experimental Marine Biology and Ecology 303:243-260. Hays, G.C., Marshall, G.J., and Seminoff, J.A. 2007. Flipper beat frequency and amplitude changes in diving green turtles, Chelonia mydas. Marine Biology 150:1003-1009. Hazel, J. 2009. Evaluation of fast-acquisition GPS in stationary tests and fine-scale tracking of green turtles. Journal of Experimental Marine Biology and Ecology 374:58-68. Hazel, J., Lawler, I.R., Marsh, H., and Robson, S. 2007. Vessel speed increases collision risk for green turtle Chelonia mydas. Endangered Species Research 3:105-113. Hazel, J., Lawler, I.R., and Hamann, M. 2009. Diving at the shallow end: Green turtle behaviour in near-shore foraging habitat. Journal of Experimental Marine Biology and Ecology 371(1):84-92. Heithaus, M.R., Marshall, G.J., Buhleier, B.M., and Dill, L.M. 2001. Employing Crittercam to study habitat use and behaviour of large sharks. Marine Ecology Progress Series 209:307-310. Heithaus, M.R., McLash, J.J., Frid, A., Dill, L.M., and Marshall, G.J. 2002. Novel insights into green sea turtle behaviour using animal-borne video cameras. Journal of the Marine Biological Association of the United Kingdom 82:1049-1050. Hochscheid, S., Godley, B.J., Broderick, A.C., and Wilson, R.P. 1999. Reptilian diving: highly 114 2715 2720 2725 2730 2735 2740 2745 2750 2755 230
  • 115.
    variable dive patternsin the green turtle Chelonia mydas. Marine Ecology Progress Series 185:101-112. Hooker, S.K., and Baird, R.W. 2001. Diving and ranging behaviour of odontocetes: a methodological review and critique. Mammal Review 31(1):81-105. Houghton, J.D.R., Woolmer, A., and Hays, G.C. 2000. Sea turtle diving and foraging behaviour around the Greek island of Kefalonia. Journal of the Marine Biological Association of the United Kingdom 80:761-762. Houghton, J.D.R., Broderick, A.C., Godley, B.J., Metcalfe, J.D., and Hays, G.C. 2002. Diving behaviour during the internesting interval for loggerhead turtles Caretta caretta nesting in Cyprus. Marine Ecology Progress Series 227:63-70. Houghton, J.D.R., Callow, M.J., and Hays, G.C. 2003. Habitat utilization by juvenile hawksbill turtles (Eretmochelys imbricata, Linneaus, 1766) around a shallow water coral reef. Journal of Natural History 37:1269-1280. Houghton, J.D.R., Cedras, A., Myers, A.E., Liebsch, N., Metcalfe, J.D., Mortimer, J.A., and Hays, G.C. 2008. Measuring the state of consciousness in a free-living diving sea turtle. Journal of Experimental Marine Biology and Ecology 356:115-120. Hurlbert, S.H. 1984. Pseudoreplication and the design of ecological field experiments. Ecological Monographs 54(2):187-211. I-Jiunn, C. 2009. Changes in diving behaviour during the internesting period by green turtles. Journal of Experimental Marine Biology and Ecology 381:18-24. Losey, G.S., Balazs, G.H., and Privitera, L.A. 1994. Cleaning symbiosis between the wrasse, Thalassoma duperry, and the green turtle, Chelonia mydas. Copeia 1994(3):684-690. Makowski, C., Seminoff, J.A., and Salmon, M. 2006. Home range and habitat use of juvenile Atlantic green turtles (Chelonia mydas L.) on shallow reef habitats in Palm Beach, Florida, USA. Marine Biology 148:1167-1179. McCune, B., and Grace, J.B. 2002. Analysis of Ecological Communities. MjM Software, Gleneden Beach, Oregon, USA. Mendonca, M.T. 1983. Movement and feeding ecology of immature green turtles (Chelonia mydas) in a Florida Lagoon. Copeia 1983:1013-1023. Mills, D.J., Verdouw G., and Frusher, S.D. 2005. Remote multi-camera system for in situ observations of behaviour and predator/prey interactions of marine benthic macrofauna. New Zealand Journal of Marine and Freshwater Research 39:347-352. Moll, R.J., Millspaugh, J.J., Beringer, J., Sartwell, J., and He, Z. 2007. A new ‘view’ of ecology 115 2760 2765 2770 2775 2780 2785 2790 2795 2800
  • 116.
    and conservation throughanimal-borne video systems. TRENDS in Ecology and Evolution 22(12):660-668. Myers, A.E., Lovell, P., and Hays, G.C. 2006. Tools for studying animal behaviour: validation of dive profiles relayed via the Argos satellite system. Animal Behaviour 71:989-993. NOAA CCMA. 2007. Shallow-water benthic habitats of the main Hawaiian Islands. http://ccma.nos.noaa.gov/products/biogeography/hawaii_cd_07/htm/data.html Quaintance, J.K., Rice, M.R., and Balazs, G.H. Basking, foraging, and resting behavior of two sub-adult green turtles in Kiholo Bay Lagoon, Hawai’i. In Seminoff, J.A., compiler. Proceedings of the twenty-second annual symposium on sea turtle biology and conservation, April 4-7, 2002. NOAA Technical Memorandum NMFS-SEFSC-503:225- 226. Reina, R.D., Abernathy, K.J., Marshall, G.J., and Spotila, J.R. 2005. Respiratory frequency, dive behaviour and social interactions of leatherback turtles, Dermochelys coriacea during the inter-nesting interval. Journal of Experimental Marine Biology and Ecology 316:1-16. Rice, M.R., Balazs, G.H., Hallacher, L., Dudley, W., Watson, G., Krusell, K., and Larson, B. 2000. Diving, basking, and foraging patterns of a sub-adult green turtle at Punalu’u, Hawai’i. In Abreu-Grobois, F.A., Briseño-Dueñas, R., Márquez, R., and Sarti, L., compilers. Proceedings of the eighteenth international sea turtle symposium. March 3-7, 1998. NOAA Technical Memorandum NMFS-SEFSC-436:229-231. Rice, M.R. and Balazs, G.H. 2008. Diving behavior of the Hawaiian green turtle (Chelonia mydas) during oceanic migrations. Journal of Experimental Marine Biology and Ecology 356:121-127. Salmon, M., Jones, T.T., and Horch, K.W. 2004. Ontogeny of diving and feeding behavior in juvenile seaturtles: leatherback seaturtles (Dermochelys coriacea L) and green seaturtles (Chelonia mydas L) in the Florida current. Journal of Herpetology 38(1):36-43. Schofield, G., Katselidis, K.A., Dimopolous, P., Pantis, J.D., and Hays, G.C. 2006. Behaviour analysis of the loggerhead sea turtle Caretta caretta from direct in-water observation. Endangered Species Research 2:71-79. Seminoff, J., Resendiz, A., Smith, T.W., and Yarnell, L. 2001. Diving patterns of green turtles (Chelonia mydas agassizii) in the Gulf of California. Proceedings of the Twenty-First Annual Symposium on Sea Turtle Biology and Conservation. NOAA Technical Memorandum NMFS-SEFSC-528, pp. 321-323. Seminoff, J.A., Resendiz, A., and Nichols, W.J. 2002. Home range of green turtles Chelonia mydas at a coastal foraging area in the Gulf of California, Mexico. Marine Ecology Progress Series 242:253-265. 116 2805 2810 2815 2820 2825 2830 2835 2840 2845
  • 117.
    Seminoff, J.A., Jones,T.T., and Marshall, G.J. 2006. Underwater behaviour of green turtles monitored with video-time-depth recorders: what’s missing from dive profiles? Marine Ecology Progress Series 322:269-280. Senko, J., Koch, V., Megill, W.M., Carthy, R.R., Templeton, R.P., and Nichols, W.J. 2010. Fine scale daily movements and habitat use of East Pacific green turtles at a shallow coastal lagoon in Baja California Sur, Mexico. Journal of Experimental Marine Biology and Ecology 391:92-100. Southwood, A.L., Reina, R.D., Jones, V.S., and Jones, D.R. 2003. Seasonal diving patterns and body temperatures of juvenile green turtles at Heron Island, Australia. Canadian Journal of Zoology 81:1014-1024. Tinker, M.T., Costa, D.P., Estes, J.A., and Wieringa, N. 2007. Individual dietary specialization and dive behaviour in the California sea otter: using archival time-depth data to detect alternative foraging strategies. Deep Sea Research Part II: Topical Studies in Oceanography 54(3-4):330-342. Troëng, S., Dutton, P.H., and Evans, D. 2005. Migration of hawksbill turtles Eretmochelys imbricata from Tortuguero, Costa Rica. Ecography 28:394-402. van Dam, R.P. and Diez, C.E. 1996. Diving behavior of immature hawksbills (Eretmochelys imbricata) in a Caribbean cliffwall habitat. Marine Biology 127:171–178. Whittow, G.C., and Balazs, G.H. 1982. Basking behavior of the Hawaiian green turtle (Chelonia mydas). Pacific Science 36(2):129-140. Witt, M.J., McGowan, A., Blumenthal, J.A., Broderick, A.C., Gore, S., Wheatley, D., White, J., and Godley, B.J. 2010. Inferring vertical and horizontal movements of juvenile marine turtles from time-depth recorders. Aquatic Biology 8:169-177. Witzell, W.N. Observations on the green sea turtle (Chelonia mydas) in Western Samoa. Copeia 1982(1):183-185. Yasuda, T., and Arai, N. 2009. Changes in flipper beat frequency, body angle and swimming speed of female green turtles Chelonia mydas. Marine Ecology Progress Series 386:275- 286. Zar, J.H. 1984. Biostatistical analysis. 2nd edition. Englewood Cliffs, NJ: Prentice-Hall. 130 p. TABLES: Table 1. A description of the 26 juvenile green turtle behavioral videos used in this study with concurrent TDTR data. 117 2850 2855 2860 2865 2870 2875 2880 2885 2890 2895 235
  • 118.
    Video Number Turtle ID Number Month (Lunar Cycle),Date Tidal Cycle Phase Starting Habitat of Video 1 2 1, 3/23/10 Low Cove 2 2 1, 3/24/10 Falling Kailua Bay 3 2 1, 3/25/10 High Cove 4 16 1, 3/25/10 High Kailua Bay 5 16 2, 4/17/10 Rising Kailua Bay 6 16 2, 4/17/10 Rising Channel / Ledge 7 16 3, 5/16/10 Rising Cove 8 34 3, 6/5/10 High Channel / Ledge 9 37 3, 6/6/10 Falling Channel / Ledge 10 34 3, 6/6/10 Falling Channel / Ledge 11 37 4, 6/30/10 Rising Channel / Ledge 12 16 4, 7/5/10 Falling Cove 13 37 4, 7/5/10 Falling Channel / Ledge 14 34 4, 7/6/10 High Cove 15 37 5, 7/14/10 Rising Channel / Ledge 16 34 5, 7/20/10 High Cove 17 37 5, 7/20/10 High Channel / Ledge 18 34 5, 7/30/10 Rising Cove 19 34 5, 7/31/10 Low Channel / Ledge 20 37 5, 8/3/10 Falling Channel / Ledge 21 37 6, 8/14/10 Low Channel / Ledge 22 34 6, 8/18/10 Falling Cove 23 2 6, 8/18/10 Falling Channel / Ledge 24 34 6, 8/19/10 Rising Channel / Ledge 25 2 6, 8/28/10 Rising Cove 26 34 6, 8/29/10 Low Channel / Ledge 118 2900
  • 119.
    Table 2. Thedefinitions of each behavior and environmental parameter recorded during behavioral surveys. “IB” = Instantaneous Behaviors, recorded every 15 seconds. “CB” = Continuous Behaviors, counted continuously throughout the video. “PC” = Physical Conditions, or environmental parameters recorded on 15 second intervals. Behavioral Category Behavior Definition IB Foraging Food Searching Actively moving along bottom substrate, head moving around looking down for food, using flippers to steady self Foraging Turtle takes a bite of the vegetation on the substrate, or food is in its mouth and the jaw is moving up and down Resting On substrate Motionless, no flipper movement while in contact with bottom substrate, turtle's overall position does not change Assisted Motionless, no flipper movement while in contact with bottom substrate, turtle's overall position does not change, using a structure to maintain its position Swimming Hovering Motionless, or minimal amount of flipper movement while in water column, turtle's position relative to the substrate does not change Posing Motionless, or minimal amount of flipper movement while in water column, turtle's position relative to the substrate does not change; turtle’s flippers and neck are outstretched, likely in vicinity of cleaning station General Swimming: Direction Turtle is actively using its flippers to change its position relative to the substrate. Classified as either movement up (nearer the surface), down (further from the surface), or horizontal (distance from surface does not change) Rel. Speed Distance traveled (m) / time (s), in km/hr - calculated by GPS (Garmin) Breathing Turtle is at surface of water, its head clears water surface, bubbles and expulsion of water may or may not be seen Flipper “Swipe” Turtle uses its front flipper(s) to deliberately wipe its face, plastron, or carapace CB Swimming Beats/30 s Number of flipper beats per 30 seconds of video footage Foraging Bites/15 s Number of bites per 15 seconds of video footage Breathing The time (s) of the video in which a breathing event begins, when the turtle's head breaks the surface PC Turtle Depth Relative depth of turtle from surface (in 0.5 m bins) Water Depth Relative depth of substrate from surface, at turtle's location (in 0.5 m bins) Substrate Type Substrate type at turtle's location: rocks, sand, algae, coral, rubble, urchins, and other invertebrates 119 2905 240
  • 120.
    Table 3. Thedescription of each of seven TDTR parameters compared with 26 behavioral observation videos. TDTR Parameter Description Depth Displacement The total vertical distance (m; recorded by the TDTR) moved by the turtle during the length of the video Depth Coefficient of Variation (CV) The coefficient of variation (CV) of the turtle's depth (m; recorded by the TDTR) during the length of the video Maximum Depth The turtle's maximum reached depth (m; recorded by the TDTR) during the length of the video Average Depth The turtle's average depth (m; recorded by the TDTR) during the length of the video Surface Proportion (arcsine transformed) The proportion, or percent, of the video in which the turtle was within the top 0.5 m (recorded by the TDTR) of the water column Average Temperature The average water temperature (°C; recorded by the TDTR) during the length of the video Temperature CV The CV of the water temperature (°C; recorded by the TDTR) during the length of the video 120 2910 2915 2920 2925 2930 2935
  • 121.
    Table 4. Presence/absenceof behaviors in each of the 26 behavioral observation videos. Behaviors were included in the analyses only if they were present in at least 2 of the 26 videos (excluding posing and body swiping behaviors). A “0” indicates the behavior was not present in the video, while a “1” indicates the behavior was present. Video Number, Turtle ID Number Behavior Presence Foraging Food Searching Resting Hovering Swimming Breathing Posing Body Swiping 1, 2 0 0 0 1 1 1 0 0 2, 2 1 1 0 1 0 0 0 0 3, 2 0 1 0 0 1 1 0 1 4, 16 0 1 0 1 1 0 0 0 5, 16 1 1 0 1 1 0 0 0 6, 16 0 0 0 1 1 0 0 0 7, 16 1 1 0 1 1 0 0 0 8, 34 0 0 1 0 0 0 0 0 9, 37 1 1 0 1 1 1 0 0 10, 34 0 0 1 1 1 1 0 0 11, 37 1 1 1 1 1 1 0 0 12, 16 1 1 0 1 1 1 0 0 13, 37 0 0 1 1 1 1 0 0 14, 34 0 0 0 0 1 1 0 0 15, 37 0 0 1 0 0 0 0 0 16, 34 0 0 0 0 1 1 0 0 17, 37 0 0 1 1 1 1 0 0 18, 34 0 0 0 0 1 0 0 0 19, 34 0 0 0 1 1 1 0 0 20, 37 0 0 1 0 0 0 0 0 21, 37 1 1 1 1 1 1 0 0 22, 34 0 0 0 0 1 1 0 0 23, 2 1 1 0 1 1 1 0 0 24, 34 0 0 0 0 1 0 1 0 25, 2 1 1 0 1 1 0 0 0 26, 34 0 0 0 0 1 0 0 0 Total Presence (out of 26 videos): 9 11 8 16 22 14 1 1 Table 5. The depth and temperature TDTR parameters calculated by Matlab computer software for the length of each of the 26 videos. Video Depth Parameters Temperature Parameters 121 2940 2945 2950
  • 122.
    Number Disp CVMax Avg Surface Proportion (arcsine transformed) Avg CV 1 7.87 54.27 1.73 0.77 0.18 27.68 1.85 2 5.74 12.33 2.30 1.81 0.00 26.10 0.40 3 9.87 59.29 1.80 0.79 0.16 26.95 2.74 4 7.36 18.53 1.98 1.48 0.00 24.49 0.44 5 10.58 23.43 2.68 2.08 0.02 23.40 0.00 6 5.76 19.50 1.63 1.16 0.00 23.59 0.07 7 3.59 32.25 0.80 0.54 0.22 26.73 0.47 8 1.20 5.970 2.21 1.75 0.00 24.99 0.34 9 7.69 27.24 1.71 1.02 0.00 26.88 1.37 10 6.06 35.34 1.71 1.04 0.00 27.42 1.64 11 6.45 30.53 2.13 1.50 0.02 27.22 0.18 12 3.22 19.42 0.50 0.41 0.57 27.36 0.18 13 7.48 48.01 1.94 1.21 0.12 26.69 0.89 14 5.91 33.01 1.42 0.84 0.06 27.60 1.13 15 0.72 2.00 1.50 1.45 0.09 28.06 0.07 16 3.83 19.88 0.92 0.71 0.08 28.63 0.42 17 4.54 62.50 1.92 1.26 0.18 26.89 0.90 18 1.24 56.51 1.45 0.93 0.25 28.41 0.81 19 6.24 26.21 1.57 1.10 0.04 27.27 0.33 20 1.47 2.54 1.82 1.70 0.00 26.37 0.08 21 12.53 55.28 2.35 1.20 0.10 26.53 0.34 22 7.26 54.38 1.50 0.67 0.22 27.91 0.57 23 8.48 23.41 2.28 1.87 0.00 27.91 0.26 24 4.12 45.57 2.07 1.28 0.00 27.61 1.12 25 8.68 30.32 2.03 1.46 0.00 28.00 0.53 26 6.04 53.57 2.25 1.04 0.02 26.86 0.25 Table 6. Pearson correlation coefficients for all seven TDTR parameters. Depth Disp Depth CV Max Depth Avg Depth Surface Proportion Avg Temp Temp CV Depth Disp 1.00 - - - - - - 122 2955 2960 245
  • 123.
    Depth CV 0.411.00 - - - - - Max Depth 0.48 0.08 1.00 - - - - Avg Depth 0.10 -0.45 0.80 1.00 - - - Surface Proportion -0.14 0.33 -0.65 -0.67 1.00 - - Avg Temp -0.20 0.30 -0.41 -0.47 0.27 1.00 - Temp CV 0.26 0.56 -0.06 -0.41 0.11 0.28 1.00 Table 7. Kendall non-parametric rank correlations (tau) and p-values of the TDTR parameters with the three axes of the NMDS analysis. Values in bold are significant (p < 0.05). TDTR Variable Axis 1 Axis 2 Axis 3 tau p-value tau p-value tau p-value Depth Disp 0.39 p < 0.01 0.17 p > 0.1 0.19 p > 0.1 Depth CV 0.18 p > 0.1 -0.10 p > 0.1 -0.20 p > 0.1 Max Depth -0.20 p > 0.1 0.05 p > 0.1 0.33 0.05 < p < 0.01 Avg Depth -0.30 0.05 < p < 0.01 -0.00 p > 0.1 0.32 0.05 < p < 0.01 Surface Proportion 0.30 0.05 < p < 0.01 -0.00 p > 0.1 -0.20 p > 0.1 Avg Temp 0.21 p > 0.1 -0.10 p > 0.1 -0.30 0.05 < p < 0.01 Temp CV 0.26 0.05 < p < 0.1 -0.00 p > 0.1 -0.20 p > 0.1 Video Length 0.10 p > 0.1 0.01 p > 0.1 0.17 p > 0.1 123 2965 2970 2975 2980
  • 124.
    Table 8a. Significantresults from the complete logistic regression analyses (assuming marginal significance: alpha = 0.1). Behavior = turtle behavior recorded from observational video; TDTR Parameter = parameter(s) collected by the TDTR, the linear combination (logit function) of which are (marginally) significantly related to the listed behavior; Estimate = “weight” given to the TDTR parameter in the logit function; S.E. = standard error of the estimate; t-ratio = t-statistic of the estimate; p-value = significance level of the estimate; Odds Ratio = description of the strength of the binary association – the larger the value above one (below one), the stronger the positive (negative) correlation between the behavior and TDTR parameter; Upper/Lower 95% = 95% ranges for the Odds Ratio; Sensitivity = the proportion of actual positives which are correctly identified as such; Specificity = the proportion of negatives which are correctly identified; Percent Correct = the likelihood that any specific logit function result of the listed TDTR parameter(s) will indicate the behavior with which it is significantly related. Behavior TDTR Parameter (ai) Estimat e (bi) S.E. t- ratio p- value Odds Ratio Upper 95% Lower 95% Sensitivity Specificity Percent Correct Foraging Depth Disp 0.61 0.26 2.34 0.02 1.84 3.07 1.10 0.57 0.77 0.700 Depth CV -0.08 0.04 -1.92 0.06 0.92 1.00 0.84 Food Searching Depth Disp 2.64 1.33 1.99 0.05 13.96 187.71 1.04 0.82 0.87 0.844Depth CV -0.48 0.24 -1.83 0.07 0.64 1.03 0.40 Surface Proportion 50.67 30.35 1.67 0.10 1.01x10²² N/A 0.00 Hovering Depth Disp 0.42 0.19 2.18 0.03 1.53 2.23 1.04 0.71 0.53 0.641 Breathing Avg Temp 1.20 0.65 1.86 0.06 3.32 11.81 0.93 0.80 0.77 0.788Depth Disp 0.85 0.35 2.45 0.01 2.34 4.63 1.19 Max Depth -2.38 1.39 -1.71 0.09 0.09 1.40 0.01 Table 8b. Significant results from the complete logistic regression analyses (assuming marginal significance: alpha = 0.1). Constant = linear predictor or line intercept of the logistic regression. S.E. = standard error of the estimate; t-ratio = t-statistic of the estimate; p-value = significance level of the estimate. Behavior Constant (c) S.E. t-ratio p-value Foraging -18.52 1.26 -1.47 0.14 Food Searching -6.62 3.66 -1.81 0.07 Hovering -1.89 1.14 -1.65 0.10 Breathing -32.39 18.55 -1.78 0.08 124 2985 2990 2995 250
  • 125.
    Table 9. G-Testsfor the occurrence of six behaviors across four habitats within 26 behavioral video surveys broken into 2-minute segments. Behaviors are not independent of habitat if p > 0.05. Cells with superscripts (* or †) show the behaviors and habitats further tested with stepwise logistic regressions to determine if any TDTR parameters were significantly related to the specific behavior within the specific habitat (only cells with occurrences in 3 or more 2-minute segments were tested). Behavior Habitat G-score p-value Channel / Ledge Cove Kailua Bay Rocky Shore Foraging* 0 5* 10* 1 17.57 p < 0.001 Food Searching* 2 8* 13* 1 14.92 0.005 < p < 0.001 Resting* 12 0 0 0 18.89 p < 0.001 Hovering† 9† 7† 20† 3† 6.32 0.25 < p < 0.10 Swimming† 21† 11† 17† 10† 0.92 p > 0.25 Breathing* 8* 4* 0 3* 10.08 0.025 < p < 0.01 Total No. of 2-min Segments 31 11 23 10 -- -- *specialized behaviors – not independent of habitat †generalized behaviors – independent of habitat 125 3000 3005 3010 3015 3020 3025 3030
  • 126.
    Table 10a. Significantresults from the complete logistic regression analyses (assuming marginal significance: alpha = 0.1) of the 2-minute video segments highlighted in Table 9. Behavior = turtle behavior recorded from observational video; TDTR Parameter = parameter(s) collected by the TDTR, the linear combination (logit function) of which are (marginally) significantly related to the listed behavior; Estimate = “weight” given to the TDTR parameter in the logit function; S.E. = standard error of the estimate; t-ratio = t-statistic of the estimate; p-value = significance level of the estimate; Odds Ratio = description of the strength of the binary association – the larger the value above one (below one), the stronger the positive (negative) correlation between the behavior and TDTR parameter; Upper/Lower 95% = 95% ranges for the Odds Ratio; Sensitivity = the proportion of actual positives which are correctly identified as such; Specificity = the proportion of negatives which are correctly identified; Percent Correct = the likelihood that any specific logit function result of the listed TDTR parameter(s) will indicate the behavior with which it is significantly related. Habitat Behavior TDTR Parameter (ai) Estimat e (bi) S.E. t-ratio p- value Odds Ratio Upper 95% Lower 95% Sensitivity Specificity Percent Correct Channel / Ledge Resting Max Depth -6.41 3.26 -1.97 0.05 0.00 0.98 0.00 0.71 0.82 0.77 Avg Depth 9.90 3.52 2.82 0.01 19992.04 1.97x10⁷ 20.32 Channel / Ledge Breathing Temp CV 4.30 1.97 2.18 0.03 73.62 3523.22 1.54 0.40 0.79 0.69 All Habitats Hovering Avg Temp -0.83 0.27 -3.04 0.00 0.44 0.75 0.26 0.63 0.60 0.62Depth Disp 0.72 0.32 2.26 0.02 2.04 3.80 1.10 Surface Proportion 2.47 1.42 1.74 0.08 11.81 190.9 0.73 Table 10b. Significant results from the complete logistic regression analyses (assuming marginal significance: alpha = 0.1). Constant = linear predictor or line intercept of the logistic regression. S.E. = standard error of the estimate; t-ratio = t-statistic of the estimate; p-value = significance level of the estimate. Habitat Behavior Constant (c) S.E. t-ratio p-value Channel / Ledge Resting -4.13 4.07 -1.02 0.31 Channel / Ledge Breathing -2.04 0.67 -3.04 0.00 All Habitats Hovering 21.02 7.21 2.91 0.00 126 3035 3040 3045 3050
  • 127.
    Table 11. Alist of green turtle studies which have implemented visual observations as a method to study diving behavior. NR = not reported. Author/Year Location Turtles Observed Visual Observational Method(s) "Intensity" of Observations No. Visual Observations Time Spent Performing Visual Observations Electronic Devices Used Booth and Peters 1972 Fairfax Island, Australia NR Underwater Rigorous NR NR None Frick 1976 Tortuguero, Costa Rica; Bermuda 45 Underwater Rigorous 45 > 22.5 hr None Carr and Meylan 1980 Panama Coast 3 Boat Casual 1 NR None Witzell 1982 Upolu Island, Western Samoa 113 Boat, Underwater, Aerial Rigorous 113 NR None Whittow and Balazs 1982 French Frigate Shoals, HI, USA 8 Land Rigorous NR NR Thermistor Losey et al. 1994 Kaneohe Bay, O’ahu, HI, USA NR Underwater Rigorous NR 9.75 hr Stationed video camera Börjesson 2000 O’ahu, HI, USA NR Land, Underwater Rigorous 379 NR None Rice et al. 2000 Hawai’i, USA 1 Land, Underwater Rigorous NR 176 hr TDR Heithaus et al. 2002 Shark Bay, Australia 12 green Underwater Rigorous NR > 36 hr TDR, Crittercam Quaintance et al. 2002 Kiholo Bay, HI, USA 2 Land Rigorous NR 460 hr TDR, Stationed video camera, Acoustics Southwood et al. 2003 Heron Island, Australia 12 Underwater Casual NR NR TDR Salmon et al. 2004 Boynton Beach, Florida, USA 33 green Underwater Rigorous 299 NR TDR Seminoff et al. 2006 Gulf of California, Mexico 34 Underwater Rigorous 36 89.5 hr TDR, Crittercam Hays et al. 2007 Bahía de los Angeles, Mexico 5 Underwater Rigorous 5 > 15 hr TDR, Crittercam Fuller et al. 2009 Algadi Beach, Cyprus 2 Underwater Rigorous 2899 NR Underwater Timed Picture Recorder (UTPR) Ballorain 2010 Mayotte Island, Southwest Indian Ocean 8 Underwater Rigorous > 8 NR TDR, GPS Francke et al. 2011 (current study) Kailua Bay, HI, USA 26 Underwater Rigorous 26 3.36 hr TDR, video camera 127255
  • 128.
    FIGURES: Figure 1. A)The main Hawaiian Islands. B) Kailua Bay on the windward side of the island of O’ahu. C) The Kawai’nui Marsh Estuary study site. 128 3055 3060
  • 129.
    Figure 2. Locationsof five specific habitats with the Kawai’nui Marsh Estuary study site. Video behavioral surveys occurred in the cove, channel, and Kailua Bay habitats, with randomized starting positions labeled as A,B, and C within each habitat. 129 3065 260
  • 130.
    Figure 3. Therelationship of the presence/absence of six juvenile green turtle behaviors within 26 behavioral observation videos filmed at the Kawai’nui Marsh Estuary study site (non-metric multidimensional scaling analysis; NMDS). Three-dimensional solution: total r2 = 0.97; Axis 1: r2 = 0.544, p = 0.001; Axis 2: r2 = 0.075, p = 0.001; Axis 3 r2 = 0.35, p = 0.001. Axes 1 and 3 explain the highest amount of variance (r2 = 0.894). Black points and text correspond to the six behaviors. Vectors (red lines) show non-parametric correlations (tau) of time-depth-temperature recorder (TDTR) parameters from the 26 videos with each axis. 130 3070 3075
  • 131.
    Figure 4. Predictingthe likelihood of the occurrence of foraging behavior using TDTR data. A) The observations from 26 behavioral videos, of whether or not foraging behavior occurred as a function of a linear combination of depth displacement (m) and depth CV parameters (the combination of which is marginally significant with foraging behavior) collected by the TDTR. The dashed red line indicates the hypothetical line which the “yes” and “no” points should not cross if the logit function were to perfectly explain the presence/absence of foraging behavior. B) Complete logistic regression showing the probability of the occurrence of foraging behavior, as a function of the linear combination of depth displacement and depth CV TDTR parameters. 131 3080 3085
  • 132.
    Figure 5. Predictingthe likelihood of the occurrence of food searching behavior using TDTR data. A) The observations from 26 behavioral videos, of whether or not food searching behavior occurred as a function of a linear combination of depth displacement (m), depth CV, and surface proportion parameters (the combination of which is marginally significant with food searching behavior) collected by the TDTR. The dashed red line indicates the hypothetical line which the “yes” and “no” points should not cross if the logit function were to perfectly explain the presence/absence of food searching behavior. B) Complete logistic regression showing the probability of the occurrence of food searching behavior, as a function of the linear combination of depth displacement, depth CV, and surface proportion TDTR parameters. 132 3090 3095 265
  • 133.
    Figure 6. Predictingthe likelihood of the occurrence of hovering behavior using TDTR data. A) The observations from 26 behavioral videos, of whether or not hovering behavior occurred as a function of the depth displacement (m) parameter (marginally significant with hovering behavior) collected by the TDTR. The dashed red line indicates the hypothetical line which the “yes” and “no” points should not cross if the logit function were to perfectly explain the presence/absence of hovering behavior. B) Complete logistic regression showing the probability of the occurrence of hovering behavior, as a function of the depth displacement TDTR parameter. 133 3100 3105
  • 134.
    Figure 7. Predictingthe likelihood of the occurrence of breathing behavior using TDTR data. A) The observations from 26 behavioral videos, of whether or not breathing behavior occurred as a function of a linear combination of average water temperature (°C), depth displacement (m), and maximum depth (m) parameters (the combination of which is marginally significant with breathing behavior) collected by the TDTR. The dashed red line indicates the hypothetical line which the “yes” and “no” points should not cross if the logit function were to perfectly explain the presence/absence of breathing behavior. B) Complete logistic regression showing the probability of the occurrence of breathing behavior, as a function of the linear combination of average water temperature, depth displacement, and maximum depth TDTR parameters. 134 3110 3115 270
  • 135.
    CHAPTER 3: Juvenilegreen sea turtle (Chelonia mydas) diving behavior in relation to habitat heterogeneity and water temperature in Kawai’nui, O’ahu (Hawai’i) ABSTRACT: Few studies have focused on the diving behavior of juvenile green sea turtles (Chelonia mydas) within their foraging habitats because their movements and residency patterns can be unpredictable. The Kawai’nui Marsh Estuary (KME) in Kailua Bay, O’ahu, Hawai’i, supports a large number (seasonal estimates: 40 – 100 turtles) of juvenile green turtles during spring – summer. Studying the movements and behaviors of juvenile turtles within their foraging habitats is critical for understanding their feeding ecology, habitat use, and conservation needs. To characterize the behavioral patterns of turtles within KME, we used four approaches: (i) underwater video was used to document turtle behavior; (ii) time-depth-temperature recorders deployed on six turtles measured their diving patterns; (iii) water temperature data-loggers were emplaced throughout the site; and (iv) seasonal changes in algal biomass were measured in those areas most grazed by the turtles. These methodologies were integrated to (i) describe turtle behavior within various habitats, and (ii) determine the effects of algal biomass, water temperature, and tidal / diel cycles on turtle behavior. Our results highlighted site-specific behavioral patterns: turtles primarily foraged over shallow, rocky shelves with higher algal biomass, rested within the deeper, adjacent channel and canal, and visited a previously unknown cleaning station within the channel. Tidal phase, tidal height, and Julian Day had no significant effect on turtle behavior, allowing the inference that temporal changes in water temperature and algal biomass also had no effects on turtle behavior. The combination of these distinct habitats within a small area distinguishes KME as an important site for juvenile green turtles in Hawai’i. INTRODUCTION: 135 3120 3125 3130 3135 3140
  • 136.
    Green sea turtlesare important megafaunal consumers of marine macroalgae and their foraging activities are vital to maintaining the structure and function of many coastal ecosystems (Bjorndal 1997, Jackson et al. 2001). Turtle foraging has a direct impact via the algae they consume changing the structure of the foraging habitat, leading to an indirect effect changing the behavior of other species (Jackson et al. 2001; Wabnitz et al. 2010). Thus, turtles play a critical role in ecosystem balance (Pandolfi et al. 2003), acting as consumers, prey, competitors, parasitic hosts, substrates for epibionts, engineers of the benthic substrate, and nutrient transporters (Bjorndal and Jackson 2003). For instance, a larger green turtle population in the Caribbean would result in more grazing on Thalassia testudinum seagrass, reducing the time for epibiont colonization on the blades and shortening seagrass nutrient cycling times (Jackson 2001). Studying the movements and behavior of individual turtles is essential to understanding their feeding ecology, habitat use and conservation needs (Seminoff et al. 2002, 2006). Enhanced understanding provides insights into time budgets (feeding / resting), and helps to identify important habitats used for critical activities (Senko et al. 2010; Hart and Fujisaki 2010). Electronic devices, including time-depth recorders (TDRs), activity loggers and tracking systems via acoustic receivers, satellites, and global positioning system (GPS) have opened a window into the ecology of sea turtles both in oceanic and coastal systems (Myers et al. 2006; Godley et al. 2008). However, it can be very difficult to ascertain fine details of dive behavior by using one of these devices on its own. Therefore, many studies have used a combination of these different devices (e.g., acoustic receivers and TDRs: Makowski et al. 2006; Blumenthal et al. 2009; TDRs and satellite tags: Myers et al. 2006; acoustic receivers, capture/recapture, and TDRs: Blumenthal et al. 2010; acoustic receivers and GPS: Senko et al. 2010), or have used 136 3145 3150 3155 3160
  • 137.
    them in suitewith other electronic devices, such as visual imaging systems or swim speed sensors (e.g., Hays et al. 2004). While animal-borne loggers and cameras have been widely used to study turtle behavior, these observations can be difficult to interpret due to the large behavioral repertoire of the turtles and the great extent of individual variability in movement and activity patterns (Hochscheid et al. 1999; 2005; Seminoff et al. 2006; Witt et al. 2010). Therefore, visual observations of dive behavior have been used to help interpret dive data from TDRs and other animal-borne data loggers (e.g., chapter 2; Houghton et al. 2002; 2003; Hays et al. 2007). Personal observations provide a method for describing turtle movements or behavior, which effectively characterizes the visitation and use of specific habitats (e.g., Asuncion 2010). This methodology has proven effective for the fine-scale study of animal movements and has facilitated ecological inferences about such behaviors and habitat associations (Schofield et al. 2006). Green turtles undergo ontogenetic habitat shifts (Hatase et al. 2006); returning to the neritic habitat and changing its diet to benthic algae and seagrass (Musick and Limpus 1997; Bjorndal 1997) after spending three to six “lost” years in the epi-pelagic habitat foraging on plankton and floating algal mats detached from shallow water (Frick 1976; Balazs and Chaloupka 2004a; Makowski et al. 2006). Although green sea turtles switch to a primarily herbivorous diet when entering their coastal habitat, they will occasionally consume animals such as sponges, mollusk eggs, and jellyfish (Bjorndal 1997). Most of our knowledge of green turtle diving behavior is limited to adult females during the breeding, nesting, inter-nesting, or post-nesting migration periods. While recent tagging and tracking studies have started focusing on juvenile turtles, their movements and home ranges remain poorly understood, complicating the tasks of resource managers (Seminoff et al. 2001; 137 3165 3170 3175 3180 3185 275
  • 138.
    2002; Godley etal. 2008; Hazel 2009; Hazel et al. 2009). Previous studies have shown some juvenile green turtles spend between 20 (Seminoff et al. 2001) and 40 (Balazs and Chaloupka 2004a) years in a coastal habitat before reaching sexual maturity. Within these coastal foraging habitats, turtles may maintain limited home ranges and exhibit high site fidelity (Limpus et al. 1992; Balazs and Chaloupka 2004b). Turtles will often establish core areas within their home ranges which they primarily use for foraging and resting (Makowski et al. 2006). Larger home ranges are maintained when the resources are more dispersed (Makowski et al. 2006). Studies of immature or juvenile turtles at foraging grounds are inhibited by the inherent difficulties involved in the ability to retrieve the time-depth recorders (TDRs) (e.g., Southwood et al. 2003a). Despite the difficulties in obtaining juvenile turtle behavior in foraging habitats, some conclusions can still be drawn from previous studies. Juvenile green turtle behavior is highly variable and shaped by local environmental conditions, and varies both temporally (e.g., time of day) and in different habitats (Hays et al. 2002; Hochscheid et al. 2005; Makowski et al. 2006). For instance, the topography of a site can greatly influence a turtle’s particular habits (Houghton et al. 2003). Typically as water temperature decreases, turtles dive for longer time periods (Hazel et al. 2009). Daytime dives are typically shallower and shorter than night dives (Bjorndal 1980; Mendonca 1983; Davis et al. 2000; Makowski et al. 2006; Taquet et al. 2006; Hazel et al. 2009). This pattern of deep and long night-time dives in colder water suggests resting behavior, while shallow and short day-time dives in warmer water are associated with a great deal of activity (Hays et al. 1999; Hazel et al. 2009). However, this dichotomy does not always hold true, and different patterns have been documented, including shallower nocturnal dives (Brill et al. 1995; Southwood et al. 2003a), individual variability in diurnal and nocturnal depth selection (Seminoff et al. 2001), and active turtles throughout all the day and night (Senko 138 3190 3195 3200 3205
  • 139.
    et al. 2010).The reason for these differences in diving behavior are unknown, but theories regarding predators (Heithaus et al. 2007), conspecifics, intertidal food availability, lack of shelter in deeper water (Senko et al. 2010), and seasonal changes in temperature, photoperiod, and food availability (Southwood et al. 2003a) have been suggested. In Kaneohe Bay, O’ahu, HI, green turtle submergence intervals of 12 juvenile green turtles were strongly related to activity level. Long and regular dives with minimal movement, indicating resting behavior, occurred over muddy substrate or in the side of the coral reef, while shorter dives were associated with swimming behavior. During daylight, turtles tended to prefer the mud or side of the reef, with only a few turtles remaining in the shallower foraging grounds. At night, all but one turtle moved up to the shallower patch reef where they foraged (Brill et al. 1995). In some locations, such as the Kau District on the island of Hawai’i, observations of feeding behavior have shown considerable swimming and maneuvering to prevent hitting the rocky bottom with heavy swells and waves. Turtles also swam to the surface for regular breathing intervals. In Kiholo Bay, also on the island of Hawai’i, green turtle populations have been increasing, preempting a change in foraging and resting behavior (Rice et al. 2002). Foraging behavior, which previously occurred at night, now occurs during the day. Additionally, turtles now rest and bask on shore more frequently, gather in underwater cleaning stations, and are more tolerant of human presence (Balazs 1996). At French Frigate Shoals (in the Northwest Hawaiian Islands), foraging areas are very shallow – only one meter deep – requiring the turtles to wait for high tide to forage (Balazs 1980). This research focuses on the Kawai’nui Marsh Estuary (KME) in Kailua Bay, O’ahu, HI. This site is home to anywhere between 40 (winter) and 100 (spring) juvenile green turtles with strong year-round fidelity to the site (Asuncion, 2010). A previous study of juvenile green turtle 139 3210 3215 3220 3225 3230 280
  • 140.
    movement patterns atKME suggested that diurnal foraging occurred in the shallow cove and rocky shelf habitat, with nocturnal resting within the adjacent channel and canal leading to the marsh (Asuncion 2010). The high site fidelity of the juvenile turtles and the close proximity of the foraging and resting locations, less than one kilometer apart, makes KME a unique site within the Hawaiian Islands as most other foraging and resting locations are much further apart (Balazs et al. 1987). We used a multi-disciplinary approach to study juvenile green turtle diving behavior at KME, involving a combination of TDR deployments, underwater videos, water temperature monitoring, and surveys of algal abundance. We hypothesized that turtles would engage in distinct activities in different habitats within KME, and that these behaviors would vary in response to changing water temperature and algal biomass. More specifically, we expected that foraging would occur in warmer water where algae would likely grow more rapidly and turtles would experience higher metabolic rates (Hays et al. 2002), and in shallower habitats with higher algal biomass, while resting would occur in colder water and deeper habitats with less algal biomass. METHODS: Study Area The Kawai’nui Marsh Estuary (KME) study area (21° 25’ N, 157° 44’ W) is located at the northern end of Kailua Bay on the island of O’ahu, Hawai’i (Figure 1). Despite its small area (approximately 0.5 km2 ), KME encompasses six distinct habitats: cove, channel, ledge, canal, rocky shore, and bay. At the northern edge of KME is a shallow (0.5-1.5 m) cove with pavement-type coral reef and carbonate rock, and high coverage (50-90%) primarily of macroalgae and some sessile invertebrates (NOAA CCMA 2007). Offshore of the cove is a 140 3235 3240 3245 3250 3255
  • 141.
    deeper (3 –4 m) dredged channel with sandy to silty substrate and bordered on either side by a vertical ledge. The ledge and channel habitats are often considered the same habitat within this study. The channel connects to a man-made 2.75 km-long canal leading to the Kawai’nui Marsh, which is 336 hectares in size and drains through the canal into the ocean. The Kailua Bay habitat within KME lies on the south side of the channel, and is characterized by a relatively shallow (0.5-3.0 m) reef/rock flat habitat, which also supports abundant macroalgae and sessile invertebrates (NOAA CCMA 2007). The shallowest (0-0.5 m) portion of the KME, spanning along the southwestern edge of the study area, is referred to as the rocky shore (Figure 2). Salinity To characterize the salinity range at the site, measurements were taken using a hand-held refractometer at five locations at the study site (Figure 3): (1) canal bend, (2) boat mooring located in the channel near the edge of the cove and the mouth of the canal, (3) cove, (4) cleaning station, located in the channel between the cove and Kailua Bay, and (5) in the bay. A total of 40 measurements were taken by sampling each site during four tidal phases (low, rising, falling, high) twice within a two month time span (August 15 – October 15, 2010). Each measurement consisted of three replicate samples, which were averaged, taken from both the surface and the bottom, for a total of 240 salinity records. Water Temperature Temperature loggers (HOBO Pro v2 U22-001; accuracy of ± 0.2 °C, resolution of ± 0.02 °C), set to record water temperature continuously every 30 minutes, were used throughout the study site from March 2010 through September 2010. These loggers were deployed at five 141 3260 3265 3270 3275
  • 142.
    locations: 1) thecanal bend, approximately 200 m from the mouth of the canal, 2) the boat mooring, approximately 40 m past the mouth of the canal, 3) within the cove, approximately 50 m from shore and 20 m from the ledge, 4) offshore, approximately 375 m past the mouth of the canal, and 5) within Kailua Bay (Figure 3). Unfortunately, two of the five time series were not used due to human interference. The Kailua Bay logger was moved multiple times throughout the study period, and the cove logger was moved once from its location for a two-day period. Yet, when this time period was removed from the record, the temperature data from the cove was highly correlated with the concurrent data from the boat mooring (Pearson correlation, r = 0.967, n = 9608 observations). The three remaining loggers were collected periodically to upload data and were immediately replaced to avoid gaps in the time series. Because the three water temperature time series were normally distributed (average skewness = -0.507, and average kurtosis = -0.357) and had no “zero” data, a Principal Component Analysis (PCA; Euclidian distance measure, PC- ORD software) was performed to determine the temporal and spatial patterns of water temperature variability. PCAs summarize complex relationships among samples and objects by developing a smaller number of synthetic variables explaining specific levels of shared variance, whose significance can be assessed using randomization tests (with 999 iterations) (McCune and Grace 2002). Lastly, a Fourier (spectral) analysis was performed on the principal component values to quantify the “energy” of the dominant patterns of water temperature fluctuation over the course of the study (e.g., Papastamatiou et al. 2009). Algae Abundance 142 3280 3285 3290 3295 3300 285
  • 143.
    Benthic algae biomassand percent cover were recorded in three separate time periods in two different habitats (cove and rocky shore) within the KME study area on 1.5 month intervals (early June, mid-July, early September) spanning a three month summer-fall transition. Using Google Earth, 18 random points (three quadrats per habitat during three time periods) were assigned within the two habitats for data collection (Figure 4). A 1600 cm2 quadrat was placed at each location, and the substrate type (Battista et al. 2007) and algal cover functional group (articulated, complex branching, filamentous, foliose, mass forming, simple branching, and turf algae; Table 1; Arthur 2005) were recorded at 25 equally-spaced intersecting points to determine percent cover using the quadrat-point-intersect method (Reed 1980). Following the quadrat- weight method (Reed 1980), all algae of the same functional group within each quadrat was scraped off the hard substrate and placed in separate plastic bags to prevent drying. Functional group samples were weighed using an Acculab Sartorius Group scale (accuracy of 0.1 g) to determine initial wet weight, and then placed in a drying oven (Thermo Scientific, model 3511) for an initial 16 hours at 160 °F (71.1 °C; similar to the methods of Daday et al. (1977) and Cline et al. (1982)). Samples were stored in a freezer at zero °C between drying sessions for preservation. Individual samples were weighed and dried for additional three hour increments, until two successive weight measurements did not vary (within the balance’s 0.1 g resolution). This final constant weight was used to estimate the dry biomass weight of the sample per unit area (g dry weight / m2 ). Classifying algae by taxonomic name can be difficult in algal-dominated communities with a great number of plant fragments, which can often be missing diagnostic characteristics. Therefore, classifying algae by functional group can provide insight into foraging ecology. Also, grouping by morphology can be more temporally stable and predictable than comparing by 143 3305 3310 3315 3320
  • 144.
    species level, asstructural aspects of algae species are not necessarily related to its taxonomic name (Arthur 2005). Species composition at a site can change, but morphological characteristics rarely differ over time (Steneck and Dethier 1994). And, classifying algae by morphology allows extrapolation of results and conclusions to other sites that may not necessarily have the same species of algae, but still show the preferences of turtles’ diets (Arthur 2005). A multivariate ANOVA was performed to determine the effects of habitat (cove, rocky shore) and time (early June, late July, early September) on algal biomass functional group. The algal biomass was log-transformed (Transformed Biomass = Log (Biomass + 1)) to achieve a normal distribution. Two rare functional groups of algae (foliose and articulated calcareous algae) were only recorded in trace amounts at three out of 18 quadrats sampled, and were thus excluded from our statistical analysis due to their extremely non-normal distributions. Turtle Capture and Marking Juvenile green turtles were caught at KME by personnel from the National Oceanic and Atmospheric Administration’s Marine Turtle Research Program (NOAA-MTRP), either by scoop net or hand capture, and were immediately brought to shore for weighing, body measurements, and a general health assessment. NOAA-MTRP has been studying green turtle population size, growth rate, and health at this study site since 2000. Following Balazs (1995), a Moto-Tool (Dremel MultiPro Cordless 9.6V Model 780) was used to etch a unique identification number, approximately three cm tall by three cm wide and one mm deep, into both the left and right sides of each turtle’s carapace. The numbers were painted white to aid identification of individual turtles in the water while snorkeling to diminish the need for re-capture. Additionally, turtles were injected with a passive integrated transponder 144 3325 3330 3335 3340 3345 290
  • 145.
    (PIT) tag insertedinto a hind flipper to facilitate future identification after the visual marks wore off. Time-Depth-Temperature Recorders (TDTRs) In March, 2010, four individual turtles were equipped with time-depth-temperature recorders (TDTRs; Lotek, model LAT 1500 – pressure accuracy of ± 1%, pressure resolution of 0.05%, temperature accuracy < 0.2 °C, temperature resolution of 0.05 °C) to monitor their diving behavior. Two more turtles were equipped with TDTRs in June, 2010. Devices were attached to the turtle’s carapace by an attachment method similar to the elastomer-fiberglass-resin protocol of Balazs et al. (1996). The temperature and depth sensors on the devices were left uncovered so as not to interfere with data collection. After the fiberglass and resin hardened, each turtle was returned to the water and released by hand as quickly as possible to minimize stress. Each of the six TDTR-tagged turtles (moto-tool numbers T2, T15, T16, T17, T34, T37) were equipped with one (T15, T34, and T37) or two (T2, T16, and T17) TDTRs. Each turtle received one course-scale tag sampling water pressure and temperature every 15 seconds for approximately 33 days (filling the device’s memory). Three turtles received a second fine-scale tag sampling the same parameters every second for approximately two days. The collection of two replicates of the dive data from the same individual, sampled at two different temporal resolutions allowed us to test for potential inter-tag variability in the pressure and depth measurements. Field sampling occurred approximately once per month, between March and September 2010, with the goal of retrieving and re-deploying the TDTRs. Turtles were recaptured and released after uploading their dive data in the field. Following Hazel et al. (2009), the minimum 145 3350 3355 3360 3365 3370
  • 146.
    depth value foreach TDTR dataset was determined and added to all depth values to correct inter- tag calibration differences. This correction assumes that the 15-second sampling captured a turtle breathing at the surface at least once, during each 33-day deployment. On four TDTR data uploading events (out of 23), depth data could not be used as depths were consistently deeper than 60 m, or erratically jumped between negative values and 60 m (within the time frame of 1 or 15 seconds). It is possible that the pressure gauge on these four devices were broken by nibbling cleaner fish, a turtle bumping into a hard object, or the device may have simply just malfunctioned. Behavioral Survey Videos To complement and validate the TDTR measurements of turtle diving, focal-animal behavioral surveys were performed following Altmann (1974). During the same six-month time period as the TDTR deployments, individual turtles were filmed in KME by one snorkeler (DF) within three distinct habitats: the cove, the adjacent channel / ledge, and Kailua Bay (Figure 2). An Olympus Stylus 1010 digital camera with underwater housing was used to video record the turtles for up to eight minutes, a maximum video length chosen due to camera battery and memory card capacity constraints. Videos were shorter if sight of the turtle was lost due to poor visibility or if the turtle was resting in the same position for five minutes. To randomize the surveys, the three habitats and three potential starting points within each habitat were randomly chosen using a random number table (Altmann 1974). After arriving at the starting position, the first turtle sighted within the targeted habitat would be selected, and filming would start immediately upon approaching the turtle. All surveys occurred between 10:00 and 16:00 local time, when turtle abundance was highest (Asuncion 2010) and when the 146 3375 3380 3385 3390
  • 147.
    high sun angleprovided the best visibility. These surveys covered four tidal phases (flooding, ebbing, high, low) spanning six consecutive 28-day lunar cycles, with each tidal phase being sampled twice during each lunar cycle (once in each 14-day period). During filming, the snorkeler remained at least two human body lengths away from the turtle at all times and moved with very slow and deliberate motions, to minimize observer influence on the turtles’ behaviors. If a turtle swam out of sight within the first two minutes (11 instances), or engaged in obvious predator avoidance behavior (e.g., swimming in circles with its carapace facing the snorkeler at all times; one instance), the video was not used for behavioral analysis. During each video sampling day, the goal was to record two turtles within each of the three habitats (cove, channel / ledge, and Kailua Bay) during the two-hour sampling period. However, when it was not always possible to film two turtles within each habitat, more turtles were filmed in other habitats to reach the goal of six videos per sampling session. Each video was analyzed to determine a set of behavioral parameters defined prior to data collection (Table 2). Eight instantaneous behaviors were recorded on 15-second intervals (the same sampling resolution as the TDTRs) through the entire video: foraging (searching for food and feeding), resting, hovering, posing, swimming (with vertical and horizontal direction), face or body “swiping,” and breathing. Three continuous behavioral variables were also quantified beginning at the start and running through the end of each video: the number of flipper beats per 30 seconds, the number of bites per 15 seconds, and the timing of each breath (to the nearest second; whether or not it occurred on a 15-second interval). Additionally, the movement rate of the turtle was estimated using a GPS device (Garmin, model eTrex Legend), attached to the snorkeler and used to record position every 15 seconds. A number of ancillary variables were recorded alongside the aforementioned behavioral variables: Julian Day, the lunar cycle during 147 3395 3400 3405 3410 3415 295
  • 148.
    which the videowas filmed (1-6), the habitats (cove, channel, Kailua Bay, rocky shore, canal) and substrates (rock, rubble, sand, algae, bivalve, urchin, coral) used by the turtle during the video, water depth parameters, video length, cloud cover (quantified using octas), wind speed and precipitation (from measurements taken at the Kaneohe Marine Air Corps Station, http://raws.wrh.noaa.gov/cgi-bin/roman/meso_base.cgi?stn=PHNG&time=GMT, from the 24 hours preceding filming), and tidal height (from the National Oceanic and Atmospheric Administration buoy at Mokuoloe in Kaneohe Bay, http://tidesandcurrents.noaa.gov/data_menu.shtml?stn=1612480%20Mokuoloe, %20HI&type=Historic%20Tide%20Data). Comparison of TDTR Data to Video Surveys Cross-correlations of the TDTR data and the video behavioral survey data were used to validate the potentially subjective visual observations using the parameters measured objectively by the logger. The correlations of the diving parameters quantified concurrently for the length of each video using both methodologies (instantaneous turtle depth, average turtle depth, median turtle depth, maximum turtle depth, coefficient of variation (CV) of turtle depth, and vertical depth displacement), are used to validate the visual behavioral observations. Analysis of Behavioral Survey Videos A non-metric multidimensional scaling (NMDS) analysis of the behavioral video surveys was used to determine the associations amongst 20 different behavioral parameters recorded within 277 videos, belonging to five distinct categories: 1) the percent of the video spent performing a specific behavior, 2) various turtle depth parameters, 3) various flipper beat 148 3420 3425 3430 3435
  • 149.
    parameters, 4) variousforaging bite parameters, and 5) various breathing parameters (Table 3). Additionally, the NMDS axes were correlated (non-parametrically) with a second set of 24 explanatory variables (22 quantitative and 2 categorical), belonging to five distinct categories: 1) environmental parameters, 2) the percent of the video spent within specific habitats, 3) the percent of the video spent over specific substrates, 4) various water depth parameters, and 5) video length (Table 4). Each parameter (both behavioral and explanatory variables) was summarized for each entire behavioral observation, and the length of each video was used as a co-variate to test for potential biases associated with disparities in the duration of the visual observations. Namely, longer videos were expected to record more behavioral states. NMDS is a non-parametric ordination method, ideal for synthesizing large datasets of cross-correlated non-normal and categorical variables, which quantifies the relationship between objects (in this case, turtle behavioral parameters) and explanatory descriptors. This analysis iteratively searches for the best ordination of these objects along k dimensions (axes) in order to minimize the amount of “stress” within the final configuration (Clarke 1993). The NMDS was performed using the PC-ORD software, with the relative Sorensen distance metric, and statistical significance was assessed with a randomization test (with 50 runs of real data and 999 runs of randomized data, using the random starting point) (McCune and Grace 2002). The resulting ordination of “samples” (277 videos) and “objects” (20 behavioral parameters) is graphically represented in the context of the explanatory parameters, plotted as environmental vectors relating to the ordination axes. We then analyzed these 277 videos by testing specific group comparisons using the multivariate statistical technique of multi-replicate permutation procedures (MRPPs). These series of MRPPs (relative Sorensen distance, PC-ORD computer software) were used to 149 3440 3445 3450 3455 3460 300
  • 150.
    determine the influenceof various categorical parameters on turtle behavior. More specifically, MRPPs can test hypotheses of no differences between subjective groups of two or more entities (McCune and Grace 2002). Because a multivariate analysis of variance (MANOVA) approach was not feasible due to uneven replication in the number of videos across behaviors / habitats / time periods, we only tested direct effects and did not address interactions between amongst the categorical variables. Three different MRPPs were performed to test the effects of the following variables on turtle behavior: 1) the amount of resting, foraging / food searching, and posing behaviors performed by the turtle (groups defined in Table 5). Four groups were not included in this analysis because there were no videos consisting of: (i) 100% foraging / food searching, (ii) 100% posing, (iii) some resting, no foraging / food searching, some posing, and (iv) some resting and some foraging / food searching, some posing, these four groups were not included in the analysis); 2) a combination of tidal phase and month (groups defined in Table 5); and 3) the amount of time spent within specific habitats (groups defined in Table 5). Four groups were not included in this analysis: (i) there were no videos spent primarily within the canal, and there was only one incidence of observations (ii) primarily in both cove and Kailua Bay habitats, (iii) being primarily in both the channel / ledge and the rocky shore habitats, and (iv) being primarily in both the channel / ledge and Kailua bay habitats). If significant differences were found between the specific groups compared in each MRPP, an indicator species analysis (ISA; relative Sorensen distance, PC-ORD software, 4999 randomizations to test for significance) was performed to determine which of the 20 behavioral 150 3465 3470 3475 3480 3485
  • 151.
    parameters influenced thedifferences detected between the groups. ISA is used after MRPP to determine the effects of individual objects amongst groups (McCune and Grace 2002). The combination of these MRPPs and ISAs tests described the specific associations between turtle behaviors, as well as the temporal and environmental factors influencing these behaviors. Analysis of Behavior by Habitat GPS locations were recorded continuously every 15 seconds throughout the duration of the behavioral videos. Because GPS data were not recorded in twenty-six videos due to battery and equipment failures, 251 complete records were obtained from the 277 behavioral videos. One observer (DF) viewed the videos and assigned each of the recorded locations (7480 points; Figure 5) to one of six possible behavioral states: foraging (n = 1000), resting (n = 672), breathing (n = 176), swimming (n = 4334), hovering (n = 1034), and posing (n = 228). Using ArcGIS 9.3 Geographic Information System software (Environmental Research Systems Institute; www.esri.com/software/arcview), each of the six behaviors were mapped within KME. RESULTS: Salinity Water salinity analyses were based on data collected over four tidal phases at two depths (surface / bottom) and five habitats (canal bend, boat mooring, cove, cleaning station, Kailua Bay). Salinities ranged from 31.0-37.0 ppt at the surface and 34.7-37.0 ppt at the bottom. A multivariate ANOVA revealed a significant difference in salinity amongst three categorical variables: habitats (F = 6.93, df = 4, p < 0.001), depths (F = 9.84, df = 1, p = 0.003), and tidal phase (F = 5.10, df = 3, p = 0.005). Furthermore, there was a significant interaction of habitat 151 3490 3495 3500 3505
  • 152.
    and depth (F= 4.70, df = 4, p = 0.003) and a significant trend, evident as a positive relationship with the day of sampling (F = 77.37, df = 1, p < 0.001) (Table 6). Precipitation, in intervals of 1, 3, 6, 9, 12, and 24 hours prior to sampling did not have an effect on salinity. Post-hoc tests revealed that salinity at the canal bend was significantly lower than the cove (p = 0.04) and marginally lower than the cleaning station (p = 0.06) and Kailua Bay (p = 0.06). Salinity was lowest in the canal habitat and increased with further distance from the mouth of the canal. Rising and low tides were marginally different (p = 0.09), with flooding tides corresponding to higher salinity. Surface salinities were 1-2 ppt saltier than at depth, except at the canal bend location, where water was saltier at depth due to the surface freshwater input from Kawai’nui Marsh. Water Temperature Dataset Water temperature analyses were based on data collected every 30 minutes from three stations: boat mooring, canal bend, and offshore, each positioned just above the benthos (approximately 2.0 m, 0.5 m, and 4.0 m depths, respectively). Each of these loggers collected 9701 data points over the time span of March 14 to October 2, 2010. Pair-wise Pearson correlations of water temperature were highly positively correlated (r = 0.90 – 0.93), indicating that temperature variability at the sampled locations was very similar (Figure 6A). Principal component analysis (PCA) Analysis of water temperature by PCA revealed that three principal components (PCs) described 100% of the variation seen, with the first PC explaining 94.45% of the variance (Table 152 3510 3515 3520 3525 3530 305
  • 153.
    7). Randomization testsrevealed that only the first PC was significant (p = 0.001) as the observed eigenvalue was larger than those arising from 1000 randomizations of the data (Table 7). To determine the number of PCs that best explained the results, two “rules” were followed: 1) comparing the eigenvalue of an axis to the eigenvalue produced by chance (broken-stick eigenvalue; Table 7), using any PCs with an eigenvalue > broken-stick eigenvalue (PC 1 only), and 2) comparing an observed eigenvalue for a given PC to the average eigenvalue obtained through randomizations, and using any PC with a p-value < 0.05 (PC 1 only; Table 7). Even though PC 2 was not significant, it did explain 3.53% of the variation, and was negatively loaded with the canal bend location (loading of -0.788), indicating a stronger influence of cool fresh water from the marsh at this location (Figure 7; Table 8). The value of PC 1 decreased over time, indicating an increase in temperature, while the values of PC 2 and PC 3 remained relatively stable across time (Figure 6B). Date (r = -0.780) strongly negatively correlated with PC 1, while time of day (r = -0.228) was weakly correlated with PC 1, indicating weak diel rhythms and a stronger warming trend. All three stations were strongly correlated with PC1: boat mooring (r = -0.974), canal bend (r = -0.967), and offshore (r = -0.975) (Table 9). Fourier (spectral) analysis Fourier (spectral) analysis of the PC 1 values showed monthly effects on water temperature change (Figure 8). Small energy peaks at approximately 15 and 30 days indicate high-frequency water temperature fluctuations at the half and full lunar cycle, and a larger energy peak at the 90-day cycle is indicative of low-frequency temperature changes on the 3- month time scale. 153 3535 3540 3545 3550
  • 154.
    Algae Abundance A comparisonof algal percent cover to algal percent biomass was performed to determine if one parameter could be a good indicator of the other (Figure 9; Table 10). Pearson correlations were performed for each of the seven algal functional groups comparing the percent algal cover to the percent algal biomass in each quadrat, using each of the 18 total data points per functional group. The simple branching algae had the highest correlation (0.961), and the filamentous algae had the lowest (0.271). While complex branching, mass forming, and turf algae have fairly similar percent cover and percent biomass across time and location, filamentous algae contributes more to total biomass than percent cover across location and time. Because foliose and articulated calcareous algae were never recorded on one of the 25 intersection points of any quadrat, the Pearson correlation could not be performed for these functional groups. Overall, algal percent cover and percent biomass provide different perspectives into algal abundance and composition. Although, a few of the functional groups have high correlations, others have low correlations. Thus, we opted for using the biomass measurements to assess changes in algal abundance and composition across habitats and time periods. Overall, turf algae was the dominant functional groups in terms of percent cover and biomass across both habitats and three time periods. Complex branching (primarily Acanthophora sp. and Turbinaria sp.) and mass forming (Dictyosphaeria cavernosa) were the next most prevalent algal functional group types, with filamentous (encompassing a wide variety of algal species) and simple branching (primarily Dictyota sp.) fairly rare, and foliose and articulated calcareous algae (both encompassing a wide variety of algal species) only found in trace amounts. Additionally, the cove habitat showed a larger amount of turf, filamentous, and 154 3555 3560 3565 3570 3575 310
  • 155.
    complex branching algaebiomass, while the rocky shore had more mass forming and simple branching algae biomass (Figure 10; Table 11). Total turf algae biomass increased from June to July then decreased again in September. Total complex branching algae biomass showed the opposite trend, first decreasing, and then increasing. Total filamentous and mass forming algal biomasses both showed a generally decreasing trend over time, while simple branching algal biomass increased. Additionally, the cove habitat showed a larger amount of turf, filamentous, and complex branching algae biomass, while the rocky shore had more mass forming and simple branching algae biomass (Figure 10; Table 11). A multi-way ANOVA revealed a significant difference in biomass amongst the five abundant algal functional groups (turf, filamentous, complex branching, mass forming, simple branching) (F = 26.44, df = 4, p < 0.001), but no differences across habitats or time periods (Table 12). There were also significant interactions between functional groups and time periods (F = 2.30, df = 8, p < 0.05) and functional groups and habitats (F = 3.83, df = 4, p < 0.01). To determine the pair-wise differences in the biomass of specific algal functional groups, a post-hoc Tukey Test revealed that turf algae biomass was significantly different from every other functional group (Table 11). Comparison of TDTR Data to Video Surveys Concurrent data were collected by both time-depth-temperature recorders (TDTRs) and video behavioral surveys on 26 occasions, with a total of 801 shared data points collected every 15 seconds. These 26 samples, ranging in length from two to ten minutes (mean = 7.71, S.D. = 1.53) covered all four tidal cycle phases (low, rising, falling, high), all three habitats covered by 155 3580 3585 3590 3595
  • 156.
    the behavioral surveys(cove, channel / ledge, Kailua Bay), and showcase four of the six TDTR- tagged turtles. Pearson correlations show high similarities between five parameters measured concurrently via TDTR and video (Table 13), indicating that behavioral observations using 0.5 m depth bins approximate the more precise TDTR data. Analysis of Video Behavioral Surveys Dataset A total of 277 video behavioral surveys occurred between March 18 and September 11, 2010. These videos were spread out through all four tidal cycle phases (Low: n = 64; Rising: n = 74; Falling: n = 67; High: n = 72), all three primary habitats of focus (cove: n = 80; channel / ledge: n = 106; Kailua Bay: n = 91), and all six months (March 18 – April 16: n = 50; April 17 – May 15: n = 44; May 16 – June 14: n = 44; June 15 – July 13: n = 45; July 14 – August 11: n = 48; August 12 – September 11: n = 46). The 277 videos ranged in length from 2 to 10.25 minutes (mean = 7.46, S.D. = 1.35). GPS data was collected for 251 of the 277 videos, resulting in 7,480 individual locations each associated with a specific behavior (Figure 11-12). Non-metric multidimensional scaling (NMDS) analysis A one-dimensional ordination was identified as the best NMDS solution when considering the reduction in stress (including axes until the reduction in minimum observed stress < 5) and the p-values (p < 0.05) for each axis (Figure 13). Final stress was 8.857, indicating a minimal risk of drawing false conclusions from the NMDS plot (McCune and Grace 2002). This axis, which explained a total of 79.9% of the variation in the data (p = 0.001), can 156 3600 3605 3610 3615 3620
  • 157.
    be used todescribe the relationships between the groups analyzed (8 different behavioral states and 12 behavioral variables) and the 277 video samples. The NMDS analysis revealed two groupings within the 8 behavioral states (Figure 13A), indicating that resting would more often occur on its own, while the other “non-resting” behaviors would occur together. In particular, the NMDS results highlight the separation of resting and foraging / food searching, the two behaviors found on opposite ends of the axis. Indeed, only six of the 277 videos contained both resting and foraging / food searching behaviors, highlighting that these “site-specific” behaviors are spatially and temporally segregated. Conversely, resting and foraging / food searching co-occurred with some of the other generalized behaviors (breathing, hovering, and swimming). Within the non-resting grouping, posing was the most distinct behavior, which would often occur independently but was often related to the three generalized behaviors. On the more positive end of this grouping were foraging and food searching behaviors, showing that these were separate from resting and posing(the other site-specific behaviors), but were associated with the three general behaviors (swimming, hovering, and breathing). Body swiping behavior occurred in the middle of the non-resting group, showing that it co-occurred with all behaviors within this grouping. The behavioral variables along the ordination axis were broken into three groupings: average/maximum turtle depth, average/maximum number of foraging bites, and all other variables (Figure 13B). Average and maximum turtle depth were closest to the behavioral state of resting, indicating that resting turtles rested in deeper water. Average and maximum turtle depth were also close to the posing behavior (being slightly negative), indicating that posing would often occur in deeper water. As expected, average and maximum number of bites were 157 3625 3630 3635 3640 315
  • 158.
    closest to theforaging and food searching behavioral states. Within the third grouping of behavioral variables involved the flipper beat parameters (a proxy for turtle speed; Yasuda and Arai 2009), breathing parameters, coefficient of variation of number of foraging bites and turtle depth, and number of depth bin changes per video. These parameters are not closely related with any site-specific behavior (foraging, food searching, posing, resting), and instead represent the general behaviors of swimming, hovering, breathing, and body swiping. These are all slightly positive on the ordination axis. The video samples along the ordination axis are broken into four groupings: primarily resting, primarily posing, primarily foraging, and generalized behaviors (Figure 13C). On the negative end of the axis is the primarily resting group – videos in which turtles rested for all or nearly all of the video, closest to resting behavior and those behavioral variables associated with resting. One lone point represents primarily posing within a video (near value of -2 on the ordination axis). On the positive end of the axis is the grouping of videos in which turtles spent a great amount of time foraging / food searching, closest to foraging and food searching behaviors, and those behavioral variables most closely associated with those behaviors. Scattered around the origin of the axis are the videos in which generalized behaviors occurred. The more negative side of this grouping involved more resting and posing, and the more positive side of this grouping involved more foraging behavior interspersed with swimming, hovering, breathing, and body swiping. The Kendall rank (tau) correlations revealed associations of 22 quantitative environmental variables with the ordination axis of the NMDS (Table 14; Figure 14). The proportion of time spent in the cove habitat (tau = 0.152) was positively related (tau > 0.079, p < 0.05) to the ordination axis. Additionally, algae (tau = 0.183), rubble (tau = 0.194), urchin (tau = 158 3645 3650 3655 3660 3665
  • 159.
    0.097), and coral(tau = 0.087) substrates were positively correlated with the axis. Lastly, video length (tau = 0.33) was significantly related with the axis. Being positively correlated with the ordination axis, these environmental variables were associated with the foraging and food searching behaviors. Several other variables were negatively related (tau < -0.079, p < 0.05) with the ordination axis and were thus not associated with foraging and food searching behaviors. The proportion of time spent in the channel (tau = -0.137), ledge (tau = -0.115) and canal (tau = -0.109) habitats, as well as average water depth (tau = -0.124) were significantly related to the negative end of the axis. As turtles were witnessed resting almost exclusively under the ledge, the amount of time spent within the channel and ledge habitats were greatly correlated with resting behavior. Average water depth was also significantly related with the negative end of the ordination axis, and thus resting behavior, as resting did primarily occur in the deepest part of the site. Time spent within the canal habitat was also related to the negative end of the axis, but very few turtles swam into the canal, often performing the behaviors of swimming and hovering. Therefore, the canal habitat’s significance with the axis may be due just to chance. As in the case of foraging and food searching behaviors, it once again cannot be assumed that if a turtle was in either the channel or ledge habitat, or in deep water, that it was performing resting behavior. But the associations between this behavior and these environmental variables are strong. The rest of the explanatory variables, including all general environmental parameters (precipitation, tidal height, lunar cycle, Julian Day, cloud cover, wind speed), three substrate types (bivalves, rock, sand), the proportion of time spent within the rocky shore habitat, and the 159 3670 3675 3680 3685 320
  • 160.
    CV of waterdepth were not significantly correlated with the ordination axis, and were thus not associated with any behavioral state or variables. Multi-replicate permutation procedures (MRPPs) and indicator species analyses (ISAs) The amount of resting, foraging / food searching, and posing behaviors on overall turtle behavior showed a strong effect size (MRPP T-statistic = -89.880; δ = 0.26) and a strong separation between defined groups and a within-group agreement value (A = 0.471) above zero, indicating less heterogeneity within groups than expected by chance (overall p < 0.001, Table 15). The only groups not significantly different from each other were groups 3, 4, and 6 (Figure 15; Table 15), showing that if there was either no resting or posing, or only some of these two behaviors, overall turtle behavior was unaffected. It is likely that when foraging / food searching was occurring in conjunction with posing or resting, it was such a minimal amount that it could not be differentiated from no resting or posing occurring. A follow-up ISA determined that 15 of the 20 behavioral variables could be used to determine the amount of resting, foraging / food searching, and posing behaviors that were occurring (p < 0.05; Table 16). To be considered significant, a variable must have an indicator value of at least 25%, as this indicates this variable occurs in at least 50% of one site group (this will always be 0% or 100% in this study) and that its magnitude within the group is at least 25%. Thus, if one of the two values is 100%, the other one will always be > 25% (as done in Dufrêne and Legendre 1997). Therefore, the amount of resting (IV = 74.6) indicates when a turtle rests for the entire length of one video (group 1), the CV of the number of flipper beats (IV = 28.4) can be used to describe when a turtle does some resting, but no foraging / food searching or no posing (group 2), the amounts of foraging (IV = 37.0) and food searching (IV = 56.0), and the average number of bites (IV = 52.2) can be used to 160 3690 3695 3700 3705 3710
  • 161.
    describe when aturtle does no resting or posing, but some foraging / food searching (group 3), the amount of posing (IV = 71.3) can be used to indicate when a turtle does no resting or foraging / food searching, but some posing (group 4), the maximum (IV = 31.7) and CV (IV = 36.2) of the number of bites can indicate when a turtle does some resting and some foraging / food searching, but no posing (group 5), no behavioral parameters indicated no resting, but some foraging / food searching and some posing behaviors (group 6), and the amount of swimming behavior (IV = 28.6) can indicate when no resting, posing, or foraging / food searching occurs (group 7). The amount of time spent swimming within a video could be used to indicate when none of the three behaviors occurred, likely because the turtle spent these videos primarily swimming, but also hovering, breathing, and occasionally body swiping. The effect of the combination of month and tidal phase on overall turtle behavior yielded a small effect size (MRPP T-statistic = -1.154; δ = 0.49) indicating an overall weak separation between the defined groups and a chance corrected within-group agreement value (A = 0.012) very close to zero, suggesting that the heterogeneity within groups equals the expectation by chance (overall p = 0.127, Table 17). The MRPP analysis of behavior by month and tidal phase did not yield significant results and identified no behavioral variable indicators. Because these temporal variables did not predict turtle behavior within KME, this result suggests that turtle behavior did not change as a function of tidal cycles and months (March – October) throughout the course of this study. Because there were no significant differences amongst the defined groups, no ISA was conducted to identify the variables responsible for these pair-wise differences. The effect of habitat on overall turtle behavior yielded a strong effect size (MRPP T- statistic = -18.706; δ = 0.47) indicating an overall strong separation between defined groups, but 161 3715 3720 3725 3730 3735
  • 162.
    a chance correctedwithin-group agreement value (A = 0.069) very close to zero indicating heterogeneity within groups equals expectation by chance (overall p < 0.001, Table 18). The only groups not significantly different from each other were groups 3 and 4 (Figure 16; Table 18), showing that turtle behavior in Kailua bay and the rocky shore habitats could not be distinguished, likely because the rocky shore is basically a shallow-water extension of Kailua Bay. A follow-up ISA determined that 14 of the 20 behavioral species could be used to distinguish habitats (p < 0.05; Table 19). With the additional criterion of the IV > 25%, the amount of foraging (IV = 38.9) and food searching (IV = 28.4) behaviors, the average (IV = 43.0) and maximum (IV = 34.2) number of bites, and the number of breaths per video length (IV = 39.5) could be used to determine when a turtle was primarily in the cove habitat (group 1). The amount of resting (IV = 34.4), and the average (IV = 35.8) and maximum (IV = 32.8) turtle depth could be used to determine when a turtle was primarily in the channel or ledge habitats (group 2). The amount of swimming (IV = 32.7), the CV of turtle depth (IV = 29.5), the average number of flipper beats (IV = 30.0), and the average time between breaths (IV = 30.5) could be used to determine when a turtle was primarily in the rocky shore habitat (group 4). DISCUSSION: Juvenile green turtles at the Kawai’nui Marsh Estuary (KME) study site traverse amongst various heterogeneous habitats, differing in physical and biological properties which show temporal variability in water temperature and algal biomass. The goal of the study was to characterize turtle behavior in response to various environmental changes and different habitat characteristics. We hypothesized that behavior would vary by habitat, water temperature, and algal biomass within KME, with foraging occurring in warmer, shallower water with higher algal 162 3740 3745 3750 3755 325
  • 163.
    biomass, and restingoccurring in colder, deeper water with less algal biomass. By studying how these turtles utilize their surroundings across spatial and temporal scales, we can better understand how turtles survive and grow to maturity in critical densely-populated juvenile foraging / resting / cleaning habitats, allowing any necessary management actions to be enacted. Water Temperature Variability All three water temperature stations (canal bend, boat mooring, offshore) were highly correlated suggesting that there was little systematic variability in water temperature across KME. Thus it is unlikely that water temperature fluctuations would influence turtle distribution and behavior within the study site. Water temperature fluctuations on daily and lunar cycles ranged from 2 to 3 °C, with coolest water temperatures at night and warmest during the day, corresponding with green turtle resting behavior at night and more activity during the day, as suggested by the TDTR data (unpublished). While similar temperature cycles have been witnessed at other sites, like Heron Island, Australia (Southwood et al. 2003a), larger fluctuations would be expected at the shallow-water KME site with a seasonally variable strong stream input (as suggested by the salinity data). Yet, with such minor fluctuations in temperature on the daily and lunar scales, turtle behavior may have been more affected by other environmental parameters, and only slightly by water temperature. Over the course of the study, overall average water temperature increased by approximately 4 °C across the site, suggesting a transition from early-spring to early-fall conditions. However, there were no trends in turtle behavior over the scale of the entire study, as indicated by the lack of significant relationships with two metrics of time (Julian Day, month), despite the warming trends documented during the study. In summary, there is little evidence of 163 3760 3765 3770 3775 3780
  • 164.
    water-induced changes inturtle behavior at this tropical site, where temperature fluctuated from 21.56 °C (boat mooring, 4/17/2010) to 28.84 °C (canal bend, 7/17/2010) over the span of seven months (Figure 6A). In other subtropical study sites (e.g., Hazel et al. 2009, in Moreton Bay, Australia) with more substantial water temperature fluctuations (13.8 to 30.3 °C), green turtles did respond to the changing water temperature, performing longer dives during cooler water conditions. Varying water temperature has been shown to affect turtle behavior (e.g., Hays et al. 2002; Southwood et al. 2003a; Hatase et al. 2006) because they cannot raise their body temperature more than 1-3 °C above that of the surrounding water (Sato et al. 1998; Southwood et al. 2003a), and often rely on behavioral thermal regulation (e.g., basking) or decrease their activity during cold-water conditions (Balazs 1980; Godley et al. 2002; Southwood et al. 2003a; Hochscheid et al. 2005). Off the coast of Florida, green turtles avoid overheating by diving to cooler water temperatures at depth, and diminishing their activity levels (Mendonca 1983). While water temperature affects turtle buoyancy (Hatase et al. 2006), metabolic rate (Sato et al. 1998; Hays et al. 2002; Southwood et al 2003a), and activity patterns (Hays et al. 2002) of green turtles, these responses are not pervasive. For instance, green turtles inhabiting a shallow foraging site off the coast of Australia did not change locations or swim to deeper waters with lower water temperature even when surface temperature rose to 30.3°C. However, deeper cooler water was not easily accessible to these turtles (Hazel et al. 2009). Similarly, varying water temperatures (17-26 °C) had no effect on juvenile green turtle breathing rates within a lab setting in Vancouver, Canada (Southwood et al. 2003b). Due to the small differences in surface and bottom temperature at KME due to the shallow nature of the site (average difference of 0.15 °C between the surface and at depth, made 164 3785 3790 3795 3800 330
  • 165.
    at 24 locationswithin KME in October 2009, unpublished data), it was hypothesized that turtles would not be able to mitigate changes in water temperature behaviorally, and would therefore exhibit more resting behavior in the cooler, earlier part of the study (lower metabolic rates in cooler water), and more foraging in the warmer, later part of the study. This was not found to be the case, as behavior did not vary by Julian day or month. Because the turtle response to water temperature is based on a correlational analysis, it may be confounded by other concurrent environmental changes. For instance, it is possible that the same level of turtle activity was maintained throughout the study, if turtles were attempting to create metabolic heat through heightened activity (e.g., Mendonca 1983) in the early part of the study period, when forage was plentiful. And turtles may have been forced to search for food harder in the later part of the study period, when forage was depleted. Algae Biomass We quantified spatial variability in algae biomass between two habitats used by foraging turtles (cove, rocky shore) and temporal changes spanning from late spring (June) through early fall (September). Biomass of distinct algae functional groups varied as a function of time, likely due to the seasonality of algal growth throughout the Hawaiian Islands. Frondose algae biomass in the Hawaiian Islands is minimal during the summer (July – September) and reaches the maximum values in spring (February – May), although these fluctuations do not relate with light intensity, temperature, water movement or salinity (Santelices 1977). Certain species, however, such as Dictyosphaeria cavernosa (mass forming) have highest algal abundance during the summer. Other species, such as Acanthophora spicifera (complex branching) have an irregular pattern of biomass change throughout the year (Santelices 1977). Alternatively, the observed 165 3805 3810 3815 3820 3825
  • 166.
    variation in algalbiomass may also be due to grazing by green turtles at the site rather than just seasonality, perhaps explaining the decline in mass forming algae at a time when its abundance should be high. Hawaiian green turtles feed on both seagrass and algae (Balazs 1980). As green turtles are known to be opportunistic specific feeders that can adapt to forage on the most nutritious algae available (Bjorndal 1980; Arthur and Balazs 2008), they are expected to forage preferentially on the items of the highest quality, despite their broad diets (Balazs 1980, Bjorndal 1997). Namely, the decline in complex branching algae in the rocky shore habitat and mass forming algae in both the cove and rocky shore habitats over time may be explained by turtle preference for this forage. Algae biomass also differed by habitat, likely as a result of different grazing pressures. However, as foraging behavior is not significantly related to Julian Day, any associations drawn between this behavior and changes in algal biomass over time must be considered with caution. In Hawai’i, red algae are present in 99.5% of green turtle diet samples, with a single species (e.g., Acanthophora sp., Dictyosphaeria sp., Gracilaria sp., Halophila sp., and others) dominating an individual’s diet 78.9% of the time (Arthur 2005; Arthur and Balazs 2008). Frequently, complex branching algae (Acanthophora spicifera and Hypnea musciformis) are the primary diet items (Arthur 2005). Other major algae included in the diet of Hawaiian green turtles are Codium sp. (mass forming), Ulva sp. (foliose), and Pterocladia sp. (turf) (Balazs 1980). Despite the consistently high biomass of turf algae across time, which could suggest that this is not a targeted food item of green turtles in this location, the turf algae was heavily grazed upon and cropped, either by turtles or other grazers (Wabnitz et al. 2010). Because foliose algae was found in only trace amounts, turtles may have foraged opportunistically on this species, keeping its overall abundance very low, competing with other algal grazers. 166 3830 3835 3840 3845 3850
  • 167.
    Alternatively, turtle dietsthroughout the Hawaiian Islands vary by site driven by prey availability. Therefore, differences in diet could reflect differences in food availability (Arthur 2005). For example, Hypnea musciformis (a complex branching alga) has now colonized around the islands of Molokai and O’ahu, and has become major forage items of local turtles (Balazs and Chaloupka 2004a). At Punalu’u on the island of Hawai’i, the primary food source of turtles is the red alga Pterocladia capillacea (Balazs et al. 1994). Turtles also occasionally eat Dictyota sp. (simple branching), but cannot digest it as well as other algal functional groups (Arthur 2005). Therefore, simple branching algae may increase over time if turtles are primarily grazing on more digestible types of algae. Even though flexibility of the turtles’ diet and the presence of other potential grazers inhibit the establishment of direct cause – effect interactions, these results do not suggest a systematic decrease in algae biomass over the study period. The results of this analysis are subject to the large degree of within-site variability in algae biomass. These large variations in algal biomass within one habitat (e.g. turf in the rocky shore habitat) are caused by the small sample sizes and the inherent heterogeneity in the algae distributions within and between habitats. Turtle Behavioral Observations The video observations of turtle behavior provided valuable insights into their activity patterns within different habitats (Hochscheid et al. 1999; Houghton et al. 2003; Schofield et al. 2006). In particular, because some of these observations occurred concurrently with the deployment of TDRs, they facilitated calibrated comparisons of turtle depth in the water column. Despite estimating turtle vertical position using coarse depth bins (0.5 m) in the video behavioral surveys, Pearson correlations between the instantaneous turtle depths from video and TDR data 167 3855 3860 3865 3870 335
  • 168.
    were relatively high(Table 5), suggesting a good agreement between these two concurrent observations. This comparison strengthened the results of the subjective analysis of turtle diving behavior from video observations. General Description of Turtle Behaviors: Resting Resting turtles would lie completely motionless, with no flipper movement, while in contact with the substrate. This may involved the use of a natural or anthropogenic underwater structure (e.g., rocky ledge, garbage can) to hold the turtle in place (Table 2). Upon reaching the surface after resting, turtles would typically remain at the surface for a much longer breathing bout than foraging turtles, often staying at the surface for up to two minutes, taking multiple breaths, before resuming their diving activities. Resting was primarily concentrated along either side of the channel habitat (the ledge; Figures 11a, 12a). General Description of Turtle Behaviors: Foraging / Food Searching Food searching occurs when a turtle moves horizontally along the substrate using minimal flipper movements to steady itself in the current or surge while actively looking for food, as evidenced by frequent head turning and eyes focused on the substrate (Table 2). Typically, foraging turtles would dive from the surface at a shallow angle, apparently to allow them to scan the substrate for suitable algae (Glen et al. 2001). Upon reaching the bottom, foraging turtles would engage in slow horizontal movements, using their flippers to both steady themselves and even crawl along the substrate, moving their heads back and forth in search of preferred algae. Upon encountering suitable algae, the turtle would take one or multiple small bites, pulling its head up from the substrate as its jaw continued to move up and down, possibly 168 3875 3880 3885 3890 3895
  • 169.
    chewing the itemin its mouth (Table 2). The turtle would then return its head to the substrate to take another bite, or continue moving slowly along the substrate performing the food searching behavior. This foraging behavior involved algae of various functional groups, primarily including complex branching, mass forming, and turf algae, Foraging / food searching dives were typically very active, with a great amount of movement both horizontally along the substrate and vertically as the turtles would surface frequently for quick breaths. Because these types of dives would result in an erratic bottom profile, with a great amount of fluctuation in bottom depth, foraging turtles would be expected to be characterized by high variability in depth (high depth CV). Foraging / food searching behaviors were concentrated within the cove and Kailua Bay habitats, but fairly scattered within each (Figures 11b, 12b). General Description of Turtle Behaviors: Breathing Breathing turtles were motionless with their head above the surface, with occasional visible bubbles and/or expulsion of water (Table 2). Turtles spent a varying amount of time at the surface breathing while taking anywhere from one to 9 breaths. Typically, breathing during foraging would entail a single quick breath, with the turtle immediately returning to the bottom. Breathing events after resting would typically entail a much longer surfacing interval, with a greater number of breaths being taken. Number of breaths taken per 30 seconds was positively significantly correlated with time spent within the cove habitat (r = 0.42, p < 0.01) and no other habitat, indicating a greater amount of active behavior within this habitat. Average time between breaths was positively significantly related with time spent in the Kailua Bay (r = 0.16, p < 0.01) and the rocky shore habitat (r = 0.17, p < 0.01), and negatively significantly correlated with time 169 3900 3905 3910 3915 340
  • 170.
    spent in theledge habitat (r = -0.50, p < 0.01). This indicated longer time between breaths while in the Kailua Bay and rocky shore habitats where turtles would primarily forage and spend a great amount of time swimming horizontally, and spending much less time between breaths after finishing a resting event on the ledge. Breathing behavior was widespread throughout the entire site (Figures 11c, 12c). General Description of Turtle Behaviors: Posing While posing, a turtle would remain motionless in the water column or engage in minimal flipper movements to maintain the horizontal position, while its vertical position relative to the substrate would not change (as described by Losey et al. 1994). The turtle’s flippers and neck would be completely outstretched and hung downward (Table 2). This behavior occurred only at the cleaning station, a group of three large boulders in the middle of the channel habitat. After assuming the posing position, cleaning fishes would pick at the skin and carapaces of the turtles. Posing behavior occurred only within the channel at the cleaning station (Figures 11d, 12d). General Description of Turtle Behaviors: Swimming Swimming turtles actively used their front flippers to propel themselves forward and to ascend or descend (Table 2). Turtles utilized the entire water column (0-5 m) for swimming, although drag resistance is known to be minimal at approximately 2.5-3 times an animal’s body thickness (Hays et al. 2001). When diving from the surface, turtles would beat their flippers at a high rate and begin at a steep angle, which would decrease as their depth increased, likely allowing them to overcome the resistance from buoyancy (Glen et al. 2001; Hays et al. 2004). 170 3920 3925 3930 3935 3940
  • 171.
    When rising tothe surface from depth, turtles would use fewer flipper beats to fight negative or neutral buoyancy, thereafter ascending passively. This pattern resembles the flipper beat behavior described in Hays et al. (2001) and Yasuda and Arai (2009). However, average number of flipper beats per 30 seconds is negatively correlated with average turtle depth (r = -0.45, p < 0.01) indicating more flipper beats in shallower water, possibly due to the inherently shallow nature of the site. The CV of turtle depth was positively significantly correlated with both average number of beats (r = 0.45, p < 0.01) and maximum number of flipper beats (r = 0.52, p < 0.01) per 30 seconds, indicating a strong correlation between diving intensity and number of flipper beats. When swimming horizontally (presumably at neutral buoyancy), turtles would employ a stroke-and-glide technique, likely to reduce energy output as drag increases with increasing horizontal speed (Sato et al. 2003). Turtles would often travel at a constant low speed, also minimizing metabolic loss (Hays et al. 1999). Swimming behavior was very widespread across the entire site (Figures 11e, 12e). General Description of Turtle Behaviors: Hovering (Figures 11f, 12f) Hovering behavior occurred when a motionless or drifting turtle would engage in minimal flipper beats, while retaining its horizontal position in relation to the substrate (Table 2). Additionally, turtles would often rise vertically to the surface from a dive without engaging in flipper beats, likely to be minimizing energy loss in this fashion (Hays et al. 2001). Turtles engaged in hovering at depth and at the surface. They would often pause their flipper movements and remain still in the water column, while drifting horizontally. Turtles would also frequently rest at the surface in between breathing events, with their heads under the surface, possibly basking in the sunlight for short periods of time to increase their body temperature 171 3945 3950 3955 3960 3965
  • 172.
    (Balazs 1980). Hoveringbehavior was widespread across the site, but was also focused within the cleaning station in the channel (Figures 11f, 12f). General Description of Turtle Behaviors: Body Swiping Body swiping behavior involved a turtle using its front flipper(s) to wipe or swipe its face, plastron or carapace, while moving in the mid-water column (Table 2). This behavior has been interpreted as a turtle demonstrating its annoyance with another turtle, fish, or human when using its flippers to wipe its face (Bennett and Keuper-Bennett, unpublished data). Nevertheless, particles would often be wiped off as the turtles swiped their bodies, suggesting this behavior may also involve cutting food in the turtle’s mouth (Balazs 1980) or may represent self-cleaning behavior. Video Surveys: Behavioral and Environmental Relationships Within the current study, resting and non-resting behaviors of juvenile green turtles differed substantially, as these two groupings were placed in opposite ends of the non-metric multidimensional scaling (NMDS) analysis main ordination axis. Many previous studies also found a separation in these behaviors, with green turtles foraging during the day and resting at night (e.g., Mendonca 1983; Hays et al. 1999; 2000; Seminoff et al. 2001; Makowski et al. 2006; Rice and Balazs 2008; Hazel et al. 2009; I-Jiunn 2009; Blumenthal et al. 2010). Alternatively, Mendonca (1983) found turtles to rest in mid-day (approximately 10:00 AM to 2:00 PM) and to feed in the early morning and late afternoon. Yet, other studies have found that these behaviors are performed in combination with each other. In Cyprus, green turtles both feed and rest when performing U-shaped dives (Hochscheid et al. 1999). At Laguna San Ignacio, off the Pacific 172 3970 3975 3980 3985 345
  • 173.
    coast of BajaCalifornia, Mexico, green turtles are active throughout 24-hour periods (Senko et al. 2010), suggesting that they alternate foraging with resting dives. This pattern was rarely seen within KME as only six of the 277 videos documented both resting and feeding behavior. Perhaps with a longer video length, this combination of behaviors would have been witnessed more often. These surveys also documented another site-specific behavior, termed posing, described above. The posing behavior was placed on the opposite end of the ordination axis, within the “non-resting” grouping but apart from foraging / food searching, and more closely interspersed with the three general behaviors (swimming, hovering, breathing). Thus, posing was more closely related to foraging / food searching than resting behavior, which was segregated. The hypothesis that resting would be associated with deeper water was verified by its close association with the average and maximum turtle depth variables in the NMDS along the negative end of the ordination axis. The placement of foraging / food searching on the positive end of the axis confirms the hypothesis of foraging in shallow water. Indeed, turtles would primarily rest under the ledge in the channel / ledge habitat, the deepest part of the site. Green turtles are known to rest in deeper water and to forage in shallower water (e.g., Bjorndal 1980; Mendonca 1983; Brill et al. 1995; Southwood et al. 2003a; Makowski et al. 2006; Yasuda and Arai 2009). Foraging dives, in which turtles seek and consume forage, involve higher metabolic demands, and therefore are likely to be shorter and shallower (Hays et al. 1999). In particular, foraging dives are shorter than resting dives because they involve more energy expenditure, and thus deplete a turtle’s oxygen stores more quickly (Houghton et al. 2003). Yet, due to the shallow nature of the KME site, the resting depths of these turtles were relatively shallow, compared to the resting depths of green turtles measured in other studies (e.g., 173 3990 3995 4000 4005 4010
  • 174.
    16-40 m, Daviset al. 2000; 18-20 m, Hays et al. 2000;15-20 m, Hatase et al. 2006; 7-26.5 m, Seminoff et al. 2006). When deep-water is not available, turtles have been shown to rest in shallow water, as suggested by Hazel et al. (2009), in a study of green turtles in a shallow near- shore foraging area in Moreton Bay, Australia. All resting events (except for one) involved the use of underwater structures to hold a turtle in place. These “assisted resting” events could have helped a turtle to maintain its position while being positively buoyant after taking a large breath to maximize resting time. Or, it is possible that resting in or near vertical structures could have provided a refuge from predation (Seminoff et al. 2006). Furthermore, one turtle (ID #T37) was known to exhibit territoriality – it would frequently be found resting in the same position under the ledge in the channel / ledge habitat, and was witnessed excluding another resting turtle from the location. Average and maximum depth were also closely related with posing behavior, which occurred exclusively at the cleaning station within the channel habitat, in one of the deepest parts of the site. Cleaning stations in Hawai’i are known to be associated with some prominent feature, such as a large coral head (Losey et al. 1994). Within the deep channel habitat, three large boulders indicated the location of the cleaning station, thus explaining the correlation of posing behavior with average and maximum turtle depth. However, as turtles were not always along the substrate while performing this behavior, unlike resting behavior, the association between these depth variables and posing behavior is not quite as strong. Although the specific species of reef fishes cleaning the turtles were not documented in the current study, in Hawai’i, three species of surgeon fishes are known to graze on green turtles – Acanthurus nigrofuscus, Ctenochaetus strigosus, and Zebrasoma flavescens. Two species of wrasses and one damselfish are known to graze on turtles’ bodies in Hawai’i as well – Thalassoma duperry (Losey et al. 174 4015 4020 4025 4030 350
  • 175.
    1994) and Thalassomalunare, and Abudefduf sexfasciatus (Booth and Peters 1972). These fishes primarily feed on the algae and molting skin of the turtles (Losey et al. 1994). There were typically anywhere from one to five turtles in the vicinity of the cleaning station whenever it was approached by the primary snorkeler. The relationships and interactions between reef fish and sea turtles remains poorly documented (Grossman et al. 2006). It is thus important that this mutualistic cleaning relationship be explored further. All other behavioral variables (flipper beat parameters, breathing parameters, coefficient of variation (CV) of number of foraging bites and turtle depth, and number of depth bin changes per video) were placed close to the generalized behaviors (swimming, hovering, breathing, body swiping) near the origin of the NMDS axis. Therefore, these variables cannot be used as proxies of site-specific behaviors (foraging, food searching, posing, resting). Yet, some of these behavioral variables would have been expected to be strongly associated with specific behaviors. For instance, flipper beat frequency, which responds to changes in buoyancy (Hays et al. 2004; Yasuda and Arai 2009), should have been positively related to behaviors (like foraging) involving increased vertical and horizontal movements and negatively related with resting. Nevertheless, it is possible that due to the pervasiveness of the breathing and swimming behaviors, the long duration of the video observations masked the flipper-beat patterns associated with foraging (high beat frequency) and resting (low beat frequency). The placement of the behavioral and environmental variables along the ordination axis provided additional insights into turtle behavior and activity patterns. For instance, the association of the average and maximum number of foraging bites with the foraging / food searching behaviors reinforces the notion that food searching behaviors were correctly identified when viewing the behavioral videos. 175 4035 4040 4045 4050 4055
  • 176.
    When grouping thevideo observations according to the occurrence of site-specific behaviors (resting, posing, foraging / food searching categories; MRPP), different variables allowed us to discriminate amongst turtle behaviors. For instance, increased foraging / food searching, evident as a higher rate of foraging bites, was associated with specific habitats with high algae cover (cove and Kailua Bay). Therefore, because foraging focused in these shallow habitats, and was interspersed with breathing and swimming, foraging / food searching behaviors were not related to any depth parameters. On the other hand, the incidence of the resting behavior, whether a turtle spent the entire video (group 1), or the majority of a video resting (with no foraging / food searching or posing behaviors; group 2), this behavior was evident in the large CV of the number of flipper beats. This large variability in the number of flipper beats was due to a sudden increase in the number of flipper beats needed to increase acceleration (Yasuda and Arai 2009), when a resting turtle had to overcome initial neutral or negative buoyancy to rise from depth for a breath (Hays et al. 2007). Although resting occurred in the deepest part of the site, none of the depth parameters were indicative of the resting behavioral groups. This result is likely caused by the association of the posing behavior in deeper water. Thus, the MRPP and ISA tests could not distinguish between the depth profiles of posing and resting turtles. However, a large (23.40%) and significant (p < 0.05) indicator value (IV) for average turtle depth (group 1), suggests there is a relationship, albeit weak, between resting and turtle depth. In addition to these clear distinctions between the site-specific behaviors, the behavioral videos also yielded cases in which these behaviors co-occurred during an observation period. For instance, whenever resting and foraging / food searching occurred in the same video (group 5), the maximum and the CV of the number of bites predicted this behavioral combination. In this case, the CV had a larger indicator value, suggesting that the turtle transitioned from a 176 4060 4065 4070 4075 4080
  • 177.
    resting state toforaging within the time frame of the video. Nevertheless, because there were very few (n = 6 / 277) instances in which foraging and resting co-occurred within the same video, this result must be considered with caution. It became increasingly difficult to find significant indicator variables in those rare cases where three behaviors co-occurred within an observation video, because of the highly variable turtle behavior during these observations. For instance, no behavioral variables could be used to indicate the behavioral combination of no resting, some posing, and some foraging / food searching. Many environmental variables were significantly correlated with foraging and food searching behaviors, including four substrate types (algae, rubble, urchin, coral) and video length. The strong correlation between foraging behavior and algal substrate is not surprising, given the reliance of green turtles on this forage in the study site (Arthur and Balazs 2008), and confirms our hypothesis that foraging behavior would primarily occur in habitats with a greater amount of algal cover. The strong correlation with the other substrates is likely the result of the turtle-habitat associations, with coral and urchin occurrence within Kailua Bay, and with the widespread presence of rubble within Kailua Bay and the cove. However, turtles did perform other behaviors than foraging and food searching within these habitats, so one must be cautious about assuming behavioral occurrences based on the associations of substrates and habitats. Conversely, because bivalve, rocky, and sandy substrates occurred throughout the site, no correlations between these variables and turtle behaviors were observed. The length of the behavioral videos was strongly related to foraging and food searching behaviors, indicating that with a longer video, these site-specific behaviors were more likely to be witnessed. The strong correlation of video length with foraging / food searching behaviors is interesting because it contradicts the results of the logistic regressions in chapter 2, in which 177 4085 4090 4095 4100 355
  • 178.
    video length wasnot significantly related to any behavior (Chapter 2 of this thesis). It is possible that the small sample size of videos analyzed in chapter 2 (n = 26) was not large enough to show significance, compared with the larger sample size analyzed in this chapter (n = 277). On the negative end of the NMDS ordination axis were those environmental variables most closely associated with resting behavior, which frequently occurred in deeper water and was positively correlated with average water depth. This result agrees with other previous studies of green turtles in Puako, Hawai’i, (Davis et al. 2000) and Kaneohe Bay, although some turtles rest in the shallows at night in this location (Brill et al. 1995). In particular, turtles frequently rest on the undersides of ledges (Balazs 1980; Brill et al. 1995), as was witnessed in the current study. Similarly, because the ledge extended into the channel habitat, where the posing behavior took place, a strong correlation emerged between the channel habitat and the resting and posing behaviors. The MRPP and ISA testing habitat effects on turtle behavior confirmed the predictions that the cove was primarily used as a foraging location (as indicated by the amounts of foraging and food searching, and by the average and maximum number of bites), and that the channel / ledge habitat was used for resting (as indicated by the amount of resting, and by the average and maximum turtle depths). Lastly, because the rocky shore was frequently very shallow, turtles travelled quickly through this habitat to reach the deeper Kailua Bay habitat. Thus, this habitat was characterized by higher amounts of swimming behavior, by higher average intervals between consecutive breaths, and by higher flipper beats (which can be used as a proxy for speed; Hays et al. 2004). The CV of turtle depth increased if they stopped within the rocky shore to forage, moving vertically more frequently than if just passing through. 178 4105 4110 4115 4120 4125
  • 179.
    All other environmentalvariables were not significantly related to behavior (NMDS). For instance, the parameters describing 24-hour precipitation accumulation, cloud cover, tidal height, and wind speed were not significantly related with the axis, and thus any site-specific behaviors (foraging / food searching, resting, or posing). A lack of a relationship between precipitation and behavior may be due to the small changes in salinity (1-2 ppt) measured in the study site following significant rainfall, despite any significant sediment and nutrient input. A lack of a relationship of tidal height with behavior is unexpected as turtles can only enter the cove habitat, a primary foraging location, when the tidal height is high. Furthermore, Hazel (2009) found that tidal height greatly influenced turtle behavior in another shallow-water habitat (Moreton Bay, Australia) by facilitating access to shallow habitats only during the higher tides. Month and tidal phase were found not to be significantly related to turtle behavior. We hypothesized there would be a behavioral difference by tidal phase, as turtles were expected to forage primarily during higher tides when they had access to the shallow cove habitat. For instance, green turtles in French Frigate Shoals (Northwest Hawaiian Islands) perform more foraging during high tide, when they have access to food sources closer to shore (Balazs 1980). However, because the behavioral videos revealed substantial foraging in the deeper Kailua Bay habitat, turtle foraging at KME is not limited by the tides. Furthermore, a previous study found that turtle abundance at KME was not significantly related with tidal phase and amplitude (Asuncion 2010). Similarly, other studies suggest that when turtles feed throughout the day, as was the case in the current study, tidal feeding patterns are not discernible (Senko et al. 2010). Julian Day and month had no significant relationship with turtle behavior (NMDS and MRPP analyses), suggesting that our hypothesis that foraging and resting behaviors vary seasonally is incorrect. Nevertheless, this result may be attributable to the short duration of this 179 4130 4135 4140 4145 360
  • 180.
    study, during aperiod of high turtle abundance at the site and little environmental change. Namely, if the study had spanned longer than six months, we would have expected to detect seasonal changes in turtle behavior. However, this spring-summer study was inhibited by the low turtle abundance at this site (Asuncion 2010) and the need to retrieve the TDTRs. At Heron Island, Australia, green sea turtles are known to vary diving behavior by season, and changes in behavior between seasons are due to changes in both environmental and physiological factors (Southwood et al. 2003a). Thus, additional year-long studies at this site will require the deployment of satellite-linked or phone-linked GPS transmitters. CONCLUSIONS: In Hawai’i, green turtles spend the majority of their lives in coastal areas where they alternate between foraging and resting (Balazs 1980). Foraging grounds typically do not exceed three meters in depth and include reef flats, channels and shallow rocky shelves. Frequent resting sites include coral recesses, undersides of ledges, and sandy bottom areas, which typically do not exceed 20 m in depth. Turtles have also been recorded resting in vertical crevices, as well as vertical-walled channels within a reef flat, both of which are normally shallower than eight meters (Balazs et al. 1987). Sometimes the turtles rest near feeding areas by basking at the surface (Balazs 1980). Very shallow foraging dives have been recorded (less than three meters) with brief surface intervals (less than five seconds; Balazs 1980). Resting dives are greater in duration (more than 20 minutes) and occur in deeper water, averaging 12.9 m at Punalu’u, Hawai’i, for example (Rice et al. 2000). Resting and foraging locations are typically located within two kilometers of each other, as suggested by the short dives that turtles make between these locations (Balazs et al. 2002). Some adult green turtles swim to the outer ledge of the 180 4150 4155 4160 4165 4170
  • 181.
    Hawaiian Island Bank(18-27 m deep) to rest, then return to shallower water to forage (Balazs et al. 1987). However, as each individual foraging / resting location within the Hawaiian Islands is different, natural variations exist in feeding and resting behavior at each site (Balazs 1980), and each must be studied independently. Despite recent tracking and diving studies, fundamental behavioral data on juvenile green turtles within their foraging grounds remains scant within the literature. In particular, very little is known about the habitat needs and movements of juvenile green turtles (e.g., Hart and Fujisaki 2010). While broad-scale surveys or opportunistic observations of behavior can help identify high-use habitats, rigorous observations are required to investigate the spatial and temporal variability of potential foraging aggregations (e.g., Mills et al. 2005; Asuncion 2010). Fine-scale behavioral observations and TDTR studies can help to interpret turtle behavioral within small- scale foraging habitats (e.g., Hazel et al. 2009, this study). Understanding the habitat requirements the turtles need to forage, rest, and perform other activities is crucial for their conservation (Balazs et al. 1987; Seminoff et al. 2002). In particular, management measures to protect juvenile green turtles are of utmost importance, as turtles can spend 20-50 years within one foraging habitat while growing to maturity (Makowski et al. 2006). Studying the movements of the species is critical to best implement any needed management actions (Blumenthal et al. 2009), especially through an ecological-based approach that involves an understanding of the species roles in the ecosystem (Wabnitz et al. 2010). Thus, turtle conservation actions will need to target the specific circumstances of local populations (Hochscheid et al. 1999). Namely, because Hawaiian green turtles have high site fidelity (Brill et al. 1995; Keuper-Bennett and Bennett 2002), and many turtle foraging sites, such as KME, are heavily used by human activities (ecotourism, aquaria collecting, commercial and recreational 181 4175 4180 4185 4190
  • 182.
    fishing, recreational boating,surfing), management will entail monitoring site-specific human impacts. For instance, turtles are susceptible to entanglement in fishing gear and vessel strikes (Chaloupka et al. 2008, Hazel et al. 2009). This study characterized turtle behavior and activity patterns within a small-scale heterogeneous study site. This information provides a baseline for assessing human activities and overlap within this site, and serves as an example to stimulate additional habitat use studies at other known turtle foraging sites throughout the Hawaiian Islands. REFERENCES: Altmann, J. 1974. Observational study of behavior: sampling methods. Behaviour 49(3): 227- 267. Arthur, K. 2005. Ecotoxicology of the cyanobacterium Lyngba majuscula and health implications for green turtles (Chelonia mydas). PhD Thesis, Centre for Marine Studies, University of Queensland, Brisbane, Australia. 222 pp. Arthur, K.E., and Balazs, G.H. 2008. A comparison of immature green turtle (Chelonia mydas) diets among seven sites in the Main Hawaiian Islands. Pacific Science 62(2):205-217. Asuncion, B. 2010. Characterizing juvenile green sea turtle (Chelonia mydas) habitat use in Kawai’nui, O’ahu: a multi-disciplinary approach. Master’s thesis, Hawai’i Pacific University, Kaneohe, HI. 89 pp. Balazs, G.H. 1980. Synopsis of biological data on the green turtle in the Hawaiian Islands. U.S. Department of Commerce, NOAATM-NMFS-SWFC-7, Honolulu, HI. 141 pp. Balazs, G.H. 1995. Innovative techniques to facilitate field studies of the green turtles, Chelonia mydas. In Richardson, J.I., and Richardson, compilers. Proceedings of the twelfth annual symposium on sea turtle biology and conservation. NOAA Technical Memorandum NMFS-SEFSC-361:158-161. Balazs, G. H. 1996. Behavioral changes within the recovering Hawaiian green turtle population. In Keinath, J.A., Barnard, D.E., Musick, J.A., and Bell, B.A., compilers. Proceedings of the fifteenth annual symposium on sea turtle biology and conservation, February 20–25, 1995. NOAA Technical Memorandum NMFS–SEFSC-387:16–21. Balazs, G.H., and Chaloupka, M. 2004a. Spatial and temporal variability in somatic growth of 182 4195 4200 4205 4210 4215 4220 4225 4230 365
  • 183.
    green sea turtles(Chelonia mydas) resident in the Hawaiian Archipelago. Marine Biology 145:1043-1059. Balazs, G.H., and Chaloupka, M. 2004b. Thirty-year recovery trend in the once depleted Hawaiian green sea turtle stock. Biological Conservation 117:491-498. Balazs, G.H., Forsyth, R.G., and Kam, A.K.H. 1987. Preliminary assessment of habitat utilization by Hawaiian green turtles in their resident foraging pastures. U.S. Dep. Commer., NOAA Tech. Memo. NOAA-TM-NMFS-SWFC-71, 107 p. Balazs, G.H., Dudley, W.C., Hallacher, L.E., Coney, J.P., and Koga, S. 1994. Ecology and cultural significance of sea turtles at Punalu'u, Hawai’i. Proceedings of the Fourteenth Annual Symposium on Sea Turtle Biology and Conservation. U.S. Dep. Commer., NOAA Tech. Memo.NMFS-SEFSC-351:10-13. Balazs, G.H., Miya, R.K., and Beavers, S.C. 1996. Procedures to attach a satellite transmitter to the carapace of an adult green turtle, Chelonia mydas. Proceedings of the Fifteenth Annual Symposium on Sea Turtle Biology and Conservation. NOAA Technical Memorandum NMFS-SEFSC-387, pp. 21-26 Balazs, G.H., Keuper-Bennett, U., Bennett, P., Rice, R.R., and Russell, D.J. 2002. Evidence for near shore nocturnal foraging by green turtles at Honokawai, Maui, Hawai’i Islands. Proceedings of the Twenty-Second Annual Symposium on Sea Turtle Biology and Conservation. NOAA Technical Memorandum NMFS-SEFSC-503, pp. 32-34 Battista, T.A., Costa, B.M., and Anderson, S.M. 2007. Shallow-water benthic habitats of the main eight Hawaiian Islands (DVD). NOAA Technical Memorandum NOS NCCOS 61, Biogeography Branch. Silver Spring, MD. http://ccma.nos.noaa.gov/products/biogeography/Hawaii_cd_07/htm/overview.htm. Bjorndal, K.A. 1980. Nutrition and grazing behavior of the green turtle Chelonia mydas. Marine Biology 56:147-154. Bjorndal, K. A. 1997. Foraging ecology and nutrition of sea turtles. In Lutz, P. L., and Musick, J.A., editors. The biology of sea turtles. CRC Press, Boca Raton, Florida, USA. Pp 199– 231. Bjorndal, K.A., and Jackson, J.B.C. 2003. Roles of sea turtles in marine ecosystems: reconstructing the past. In: Lutz, P.L., Musick, J.A., Wyneken, J. (Eds.),The Biology of Sea Turtles, vol. II. CRC Press, pp. 259–273. Blumenthal, J.M., Austin, T.J., Bothwell, J.B., Broderick, A.C., Ebanks-Petrie, G., Olynik, J.R., Orr, M.F., Solomon, J.L., Witt, M.J., and Godley, B.J. 2009. Diving behavior and movements of juvenile hawksbill turtles Eretmochelys imbricata on a Caribbean coral reef. Coral Reefs 28:55-65. 183 4235 4240 4245 4250 4255 4260 4265 4270 4275
  • 184.
    Blumenthal, J.M., Austin,T.J., Bothwell, J.B., Broderick, A.C., Ebanks-Petrie, G., Olynik, J.R., Orr, M.F., Solomon, J.L., Witt, M.J., and Godley, B.J. 2010. Life in (and out of) the lagoon: fine-scale movements of green turtles tracked using time-depth recorders. Aquatic Biology 9:113-121. Booth, J., and Peters, J.A. 1972. Behavioural studies on the green turtle (Chelonia mydas) in the sea. Animal Behaviour 20:808-812. Brill, R.W., Balazs, G.H., Holland, K.N., Chang, R.K.C., Sullivan, S., and George, J.C. 1995. Daily movements, habitat use, and submergence intervals of normal and tumor-bearing juvenile green turtles (Chelonia mydas) within a foraging area in the Hawaiian Islands. Journal of Experimental Marine Biology and Ecology 185:203-218. Chaloupka, M., Bjorndal, K.A., Balazs, G.H., Bolten, A.B., Ehrhart, L.M., Limpus, C.J., Suganuma, H., Troëng, S., and Manami, Y. 2008. Encouraging outlook for recovery of a once severely exploited marine megaherbivore. Global Ecology and Biogeography 17:297-304. Clarke, K. R. 1993. Non-parametric multivariate analyses of changes in community structure. Australian Journal of Ecology 18:117-143. Cline, L.D., Short, R.A., and Ward, J.V. 1982. The influence of highway construction on the macroinvertebrates and epilithic algae of a high mountain stream. Hydrobiologia 96:149- 159. Daday, A., Platz, R.A., and Smith, G.D. 1977. Anaerobic and aerobic hydrogen gas formation by the blue-green alga Anabaena cylindrica. Applied and Environmental Microbiology 34(5):478-483. Davis, E.E., Rice, M.R., Harrington, K.A., and Balazs, G.H. 2000. Green turtle diving and foraging patterns at Puako, Hawai’i. Proceedings of the Nineteenth Annual Symposium on Sea Turtle Conservation and Biology. NOAA Technical Memorandum NMFS-SEFSC- 443, pp. 153-154. Dufrêne, M. and Legendre, P. 1997. Species assemblages and indicator species: the need for a flexible asymmetrical approach. Ecological Monographs 67(3):345-366. Frick, J. 1976. Orientation and behaviour of hatchling green turtles (Chelonia mydas) in the sea. Animal Behaviour 24:849-857. Glen, F., Broderick, A.C., Godley, B.J., Metcalfe, J.D., and Hays, G.C. 2001. Dive angles for a green turtle (Chelonia mydas). Journal of the Marine Biological Association of the United Kingdom 81:683-686. Godley, B.J., Richardson, S., Broderick, A.C., Coyne, M.S., Glen, F., and Hays, G.C. 2002. 184 4280 4285 4290 4295 4300 4305 4310 4315 4320 370
  • 185.
    Long-term satellite telemetryof the movements and habitat utilisation by green turtles in the Mediterranean. Ecography 25:352-362. Godley, B.J., Blumenthal, J.M., Broderick, A.C., Coyne, M.S., Godfrey, M.H., Hawkes, L.A., and Witt, M.J. 2008. Satellite tracking of sea turtles: Where have we been and where do we go next? Endangered Species Research 4:3-22. Grossman, A., Sazima, C., Bellini, C., and Sazima, I. 2006. Cleaning symbioses between hawksbill turtles and reef fishes at Fernando de Noronha Archipelago, off Northeast Brazil. Chelonian Conservation and Biology 5(2):284-288. Hart, K.M., and Fujisaki, I. 2010. Satellite tracking reveals habitat use by juvenile green sea turtles Chelonia mydas in the Everglades, Florida, USA. Endangered Species Research 11:221-232. Hatase, H., Sato, K., Yamaguchi, M., Takahashi, K., and Tsukamoto, K. 2006. Individual variation in feeding habitat use by adult female green turtles (Chelonia mydas): are they obligately neritic herbivores? Oecologia 149:52-64. Hays, G.C., Luschi, P., Papi, F., del Seppia, C., and Marsh, R. 1999. Changes in behaviour during the internesting period and post-nesting migration for Ascension Island green turtles. Marine Ecology Progress Series 189:263-273. Hays, G.C., Adams, C.R., Broderick, A.C., Godley, B.J., Lucas, D.J., Metcalfe, J.D., and Prior, A.A. 2000. The diving behaviour of green turtles at Ascension Island. Animal Behaviour 59:577-586. Hays, G.C., Åkesson, S., Broderick, A.C, Glen, F., Godley, B.J., Luschi, P., Martin, C., Metcalfe, J.D., and Papi, F. 2001. The diving behaviour of green turtles undertaking oceanic migration to and from Ascension Island: dive durations, dive profiles, and depth distribution. The Journal of Experimental Biology 204:4093-4098. Hays, G.C., Broderick, A.C., Glen, F., Godley, B.J., Houghton, J.D.R., and Metcalfe, J.D. 2002. Water temperature and internesting intervals for loggerhead (Caretta caretta) and green (Chelonia mydas) sea turtles. Journal of Thermal Biology 27:429-432. Hays, G.C., Metcalfe, J.D., Walne, A.W., and Wilson, R.P. 2004. First records of flipper beat frequency during sea turtle diving. Journal of Experimental Marine Biology and Ecology 303:243-260. Hays, G.C., Marshall, G.J., and Seminoff, J.A. 2007. Flipper beat frequency and amplitude changes in diving green turtles, Chelonia mydas. Marine Biology 150:1003-1009. Hazel, J. 2009. Evaluation of fast-acquisition GPS in stationary tests and fine-scale tracking of green turtles. Journal of Experimental Marine Biology and Ecology 374:58-68. 185 4325 4330 4335 4340 4345 4350 4355 4360 4365
  • 186.
    Hazel, J., Lawler,I.R., and Hamann, M. 2009. Diving at the shallow end: Green turtle behaviour in near-shore foraging habitat. Journal of Experimental Marine Biology and Ecology 371(1):84-92. Heithaus, M.R., Frid, A., Wirsing, A.J., Dill, L.M, Fourqurean, J.W., Burkholder, D., Thomas, J., and Bejdger, L. 2007. State-dependent risk-taking by green sea turtles mediates top-down effects of tiger shark intimidation in a marine ecosystem. Journal of Animal Ecology 76:837-844. Hochscheid, S., Godley, B.J., Broderick, A.C., and Wilson, R.P. 1999. Reptilian diving: highly variable dive patterns in the green turtle Chelonia mydas. Marine Ecology Progress Series 185:101-112. Hochscheid, S., Maffucci, F., Bentivegna, F., and Wilson, R.P. 2005. Gulps, wheezes, and sniffs: how measurement of beak movement in sea turtles can elucidate their behaviour and ecology. Journal of Experimental Marine Biology and Ecology 316:45-53. Houghton, J.D.R., Broderick, A.C., Godley, B.J., Metcalfe, J.D., and Hays, G.C. 2002. Diving behaviour during the internesting interval for loggerhead turtles Caretta caretta nesting in Cyprus. Marine Ecology Progress Series 227:63-70. Houghton, J.D.R., Callow, M.J., and Hays, G.C. 2003. Habitat utilization by juvenile hawksbill turtles (Eretmochelys imbricata, Linneaus, 1766) around a shallow water coral reef. Journal of Natural History 37:1269-1280. I-Jiunn, C. 2009. Changes in diving behaviour during the internesting period by green turtles. Journal of Experimental Marine Biology and Ecology 381:18-24. Jackson, J.B.C. 2001. What was natural in the coastal oceans? Proceedings of the National Academy of Sciences of the United States of America 98:5411-5418. Jackson, J.B.C., Kirby, M.X., Berger, W.H., Bjorndal, K.A., Botsford, L.W., Bourque B.J., Bradbury, R.H., Cooke, R., Erlandson, J., Estes, J.A., Hughes, T.P., Kidwell, S., Lange, C.B., Lenihan, H.S., Pandolfi, J.M., Peterson, C.H., Steneck, R.S., Tegner, M.J., and Warner, R.R. 2001. Historical overfishing and the recent collapse of coastal ecosystems. Science 293:629-638. Keuper-Bennett, U. and Bennett, P.A. 2002. Home sweet home: aspects of green turtle and hawksbill presence in their feeding, resting and cleaning areas off Honokowai, West Maui, Hawai’i (1989-1999). Proceedings of the Twentieth Annual Symposium on Sea Turtle Biology and Conservation. NOAA Technical Memorandum NMFS-SEFSC-477, pp. 57-59. Limpus, C.J., Miller, J.D., Paramenter, C.J., Reimer, D., McLachlan, N., and Webb, R. 1992. Migration of green (Chelonia mydas) and loggerhead (Caretta caretta) turtles to and from eastern Australian Rookeries. Wildlife Research 19:347–358. 186 4370 4375 4380 4385 4390 4395 4400 4405 4410
  • 187.
    Losey, G.S., Balazs,G.H., and Privitera, L.A. 1994. Cleaning symbiosis between the wrasse, Thalassoma duperry, and the green turtle, Chelonia mydas. Copeia 1994(3):684-690. Makowski, C., Seminoff, J.A., and Salmon, M. 2006. Home range and habitat use of juvenile Atlantic green turtles (Chelonia mydas L.) on shallow reef habitats in Palm Beach, Florida, USA. Marine Biology 148:1167-1179. McCune, B. and Grace, J.B. 2002. Analysis of Ecological Communities. MjM Software, Gleneden Beach, Oregon, USA. Mendonca, M.T. 1983. Movement and feeding ecology of immature green turtles (Chelonia mydas) in a Florida Lagoon. Copeia 1983:1013-1023. Mills, D.J., Verdouw G., and Frusher, S.D. 2005. Remote multi-camera system for in situ observations of behaviour and predator/prey interactions of marine benthic macrofauna. New Zealand Journal of Marine and Freshwater Research 39:347-352. Musick, J.A. and Limpus, C.J. 1997. Habitat utilisation and migration in juvenile sea turtles. In Lutz, P.L. and Musick, J.A. (eds). The biology of sea turtles. CRC Press, Boca Raton, pp. 137–165. Myers, A.E., Lovell, P., and Hays, G.C. 2006. Tools for studying animal behaviour: validation of dive profiles relayed via the Argos satellite system. Animal Behaviour 71:989-993. NOAA CCMA. 2007. Shallow-water benthic habitats of the main Hawaiian Islands. http://ccma.nos.noaa.gov/products/biogeography/Hawaii_cd_07/htm/data.html Pandolfi, J.M., Bradbury, R.H., Sala, E., Hughes, T.P., Bjorndal, K.A., Cooke, R.G., McArdle, D., McClenachan, L., Newman, M.J., Paredes, G., Warner, R.R., and Jackson, J.B. 2003. Global trajectories of the long-term decline of coral reef ecosystems. Science 301:955- 958. Papastamatiou, Y.P., Lowe, C.G., Caselle, J.E., and Friedlander, A.M. 2009. Scale-dependent effects of habitat on movements and path structure of reef sharks at a predator-dominated atoll. Ecology 90(4):996-1008. Reed, S.A. 1980. Sampling and transecting techniques on tropical reef substrates. In: Environmental survey techniques for coastal water assessment. University of Hawai’i Sea Grant College Program. Sea Grant Cooperative Report UNIHI-SEAGRANT-CR-80- 01:71-89. Rice, M.R. and Balazs, G.H. 2008. Diving behavior of the Hawaiian green turtle (Chelonia mydas) during oceanic migrations. Journal of Experimental Marine Biology and Ecology 356:121-127. 187 4415 4420 4425 4430 4435 4440 4445 4450 4455 4460 375
  • 188.
    Rice, M.R., Balazs,G.H., Hallacher, L., Dudley, W., Watson, G., Krusell, K., and Larson, B. 2000. Diving, basking, and foraging patterns of a sub-adult green turtle at Punalu’u, Hawai’i. In Abreu-Grobois, F.A., Briseño-Dueñas, R., Márquez, R., and Sarti, L., compilers. Proceedings of the eighteenth international sea turtle symposium. March 3-7, 1998. NOAA Technical Memorandum NMFS-SEFSC-436:229-231. Rice, M.R., Balazs, G.H., Kopra, D., and Whittow, G.C. 2002. Ecology and behavior of green turtles basking at Kiholo Bay, Hawai’i. Proceedings of the Twentieth Annual Symposium on Sea Turtle Biology and Conservation. NOAA Technical Memorandum NMFS-SEFSC- 477, pp. 153-155. Santelices, B. 1977. Water movement and seasonal algae growth in Hawai’i. Marine Biology 43:225-235. Sato, K., Matsuzawa, Y., Tanaka, H., Bando, T., Minamikawa, S., Sakamoto, W., and Naito, Y. 1998. Internesting intervals for loggerhead turtles, Caretta caretta, and green turtles, Chelonia mydas, are affected by temperature. Canadian Journal of Zoology 76:1651- 1662. Sato, K., Mitani, Y., Cameron, M.F., Siniff, D.B., and Naito, Y. 2003. Factors affecting stroking patterns and body angle in diving Weddell seals under natural conditions. The Journal of Experimental Biology 206:1461-1470. Schofield, G., Katselidis, K.A., Dimopolous, P., Pantis, J.D., and Hays, G.C. 2006. Behaviour analysis of the loggerhead sea turtle Caretta caretta from direct in-water observation. Endangered Species Research 2:71-79. Seminoff, J., Resendiz, A., Smith, T.W., and Yarnell, L. 2001. Diving patterns of green turtles (Chelonia mydas agassizii) in the Gulf of California. Proceedings of the Twenty-First Annual Symposium on Sea Turtle Biology and Conservation. NOAA Technical Memorandum NMFS-SEFSC-528, pp. 321-323. Seminoff, J.A., Resendiz, A., and Nichols, W.J. 2002. Home range of green turtles Chelonia mydas at a coastal foraging area in the Gulf of California, Mexico. Marine Ecology Progress Series 242:253-265. Seminoff, J.A., Jones, T.T., and Marshall, G.J. 2006. Underwater behaviour of green turtles monitored with video-time-depth recorders: what’s missing from dive profiles? Marine Ecology Progress Series 322:269-280. Senko, J., Koch, V., Megill, W.M., Carthy, R.R., Templeton, R.P., and Nichols, W.J. 2010. Fine scale daily movements and habitat use of East Pacific green turtles at a shallow coastal lagoon in Baja California Sur, Mexico. Journal of Experimental Marine Biology and Ecology 391:92-100. Southwood, A.L., Reina, R.D., Jones, V.S., and Jones, D.R. 2003a. Seasonal diving patterns and 188 4465 4470 4475 4480 4485 4490 4495 4500 4505
  • 189.
    body temperatures ofjuvenile green turtles at Heron Island, Australia. Canadian Journal of Zoology 81:1014-1024. Southwood, A.L., Darveau, C.A., and Jones, D.R. 2003b. Metabolic and cardiovascular adjustments of juvenile green turtles to seasonal changes in temperature and photoperiod. The Journal of Experimental Biology 206:4521-4531. Steneck, R.S. and Dethier, M.N. 1994. A functional group approach to the structure of algal- dominated communities. Oikos 69:476-498. Steneck, R.S. and Watling, L. 1982. Feeding capabilities and limitations of herbivorous mollusks: a functional group approach. Marine Biology 68:299-319. Taquet, C., Taquet, M., Dempster, T., Soria, M., Ciccione, S., Roos, D., and Dagorn, L. 2006. Foraging on the green sea turtle Chelonia mydas on seagrass beds at Mayotte Island (Indian Ocean), determined by acoustic transmitters. Marine Ecology Progress Series 306:295-302. Wabnitz, C.C.C., Balazs, G., Beavers, S., Bjorndal, K.A., Bolten, A.B., Christensen, V., Hargrove, S., Pauly, D. 2010. Ecosystem structure and processes at Kaloko Honokohau, focusing on the role of herbivores, including the green sea turtle Chelonia mydas, in reef resilience. Marine Ecology Progress Series 420:27-44. Witt, M.J., McGowan, A., Blumenthal, J.A., Broderick, A.C., Gore, S., Wheatley, D., White, J., and Godley, B.J. 2010. Inferring vertical and horizontal movements of juvenile marine turtles from time-depth recorders. Aquatic Biology 8:169-177. Yasuda, T. and Arai, N. 2009. Changes in flipper beat frequency, body angle and swimming speed of female green turtles Chelonia mydas. Marine Ecology Progress Series 386:275- 286. 189 4510 4515 4520 4525 4530 4535 380
  • 190.
    TABLES: Table 1. Commontypes of algae found within each functional group at the Kawai’nui Marsh Estuary study site. Functional Group Common Examples Articulated Calcareous Halimeda spp. Complex Branching Acanthophora spicifera; Turbinaria ornata Filamentous Cladophora spp. Foliose Padina sp.; Ulva sp. Mass Forming Dictyosphaeria cavernosa Simple Branching Dictyota spp. Turf Pterocladia spp. 190 4540 4545 4550 4555 4560 4565 4570 4575
  • 191.
    Table 2. Definitionsof each parameter recorded during behavioral surveys. “IB” = Instantaneous Behaviors, recorded every 15 seconds. “CB” = Continuous Behaviors, counted continuously throughout each video. “DS” = Turtle depth, water depth, and substrate type, recorded on 15 second intervals. Behavioral Category Behavior Definition IB Foraging Food Searching Actively moving along bottom substrate, head moving around looking down for food, using flippers to steady self Foraging Turtle takes a bite of the vegetation on the substrate, or food is in its mouth and the jaw is moving up and down Resting On substrate Motionless, no flipper movement while in contact with bottom substrate, turtle's overall position does not change Assisted Motionless, no flipper movement while in contact with bottom substrate, turtle's overall position does not change, using a structure to maintain its position Swimming Hovering Motionless, or minimal amount of flipper movement while in water column, turtle's position relative to the substrate does not change Posing Motionless, or minimal amount of flipper movement while in water column, turtle's position relative to the substrate does not change; turtle’s flippers and neck are outstretched, likely in vicinity of cleaning station General Swimming: Direction Turtle is actively using its flippers to change its position relative to the substrate. Classified as either movement up (nearer the surface), down (further from the surface), or horizontal (distance from surface does not change) Rel. Speed Distance traveled (m) / time (s), in km/hr - calculated by GPS (Garmin) Breathing Turtle is at surface of water, its head clears water surface, bubbles and expulsion of water may or may not be seen Flipper “Swipe” Turtle uses its front flipper(s) to deliberately wipe its face, plastron, or carapace CB Swimming Beats/30 s Number of flipper beats per 30 seconds of video footage Foraging Bites/15 s Number of bites per 15 seconds of video footage Breathing The time (s) of the video in which a breathing event begins, when the turtle's head breaks the surface PC Turtle Depth Relative depth of turtle from surface (in 0.5 m bins) Water Depth Relative depth of substrate from surface, at turtle's location (in 0.5 m bins) Substrate Type Substrate type at turtle's location: rocks, sand, algae, coral, rubble, urchins, and other invertebrates 191 4580
  • 192.
    Table 3. Definitionsof the 20 behavioral parameters, calculated for each of 277 video behavioral surveys, used within the non-metric multidimensional scaling analysis (NMDS). To achieve normal distributions, the proportions (percentages, parameters divided by video length) were arcsine transformed and the average time between breaths was log transformed. Behavioral Category Behavioral Parameters 1. Percent of Video Spent Performing Specific Behaviors Foraging Food Searching Resting Hovering Posing Swimming Breathing Body Swiping 2. Turtle Depth Parameters Average Turtle Depth Number of Depth Bin Changes / Video Length 3. Flipper Beat Parameters Average Number of Flipper Beats / 30 Seconds Maximum Number of Flipper Beats / 30 Seconds Coefficient of Variation of Number of Flipper Beats / 30 Seconds 4. Foraging Bite Parameters Average Number of Bites / 15 Seconds Maximum Number of Bites / 15 Seconds Coefficient of Variation of Number of Bites / 15 Seconds 5. Breathing Parameters Number of Breaths / Video Length Average Time Between Breaths Table 4. Definitions of the 24 environmental parameters, calculated for each of 277 video behavioral surveys, used within the non-metric multidimensional scaling analysis (NMDS), broken into 5 categories. 192 4585 4590 4595 4600 4605 4610 385
  • 193.
    To achieve normaldistributions the proportions (all percentages and cloud cover) were arcsine transformed, and Julian Day and Video Length were log transformed. Environmental Category Environmental Parameter 1. General Environmental Parameters Julian Day Tidal Phase Tidal Height Lunar Cycle Cloud Cover Wind Speed Wind Direction Precipitation 2. Percent of Video Spent Within Specific Habitats Cove Rocky Shore Kailua Bay Channel Ledge Canal 3. Percent of Video Spent Over Specific Substrates Rock Rubble Algae Sand Coral Bivalves Urchins 4. Water Depth Parameters Average Water Depth Coefficient of Variation of Water Depth 5. Video Length Video Length Table 5. Definition and sample sizes (N) of all groups within three multi-replicate permutation procedures (MRPPs) testing the effects of site-specific behaviors, month-tide, and habitat on various turtle diving behavioral variables. 193 4615 4620 4625 4630
  • 194.
    MRPP Group No.Group Definition Sample Size (N) Site-Specific Behaviors (Resting, Foraging / Food Searching, Posing) 1 All resting 21 2 Some resting, no foraging / food searching, no posing 20 3 No resting, some foraging / food searching, no posing 94 4 No resting, no foraging / food searching, some posing 22 5 Some resting, some foraging / food searching, no posing 6 6 No resting, some foraging / food searching, some posing 11 7 No resting, no foraging / food searching, no posing 103 Month-Tide 1 March 18 - April 16, 2010; Low Tide 12 2 March 18 - April 16, 2010; Rising Tide 12 3 March 18 - April 16, 2010; Falling Tide 14 4 March 18 - April 16, 2010; High Tide 12 5 April 17 - May 15, 2010; Low Tide 8 6 April 17 - May 15, 2010; Rising Tide 13 7 April 17 - May 15, 2010; Falling Tide 10 8 April 17 - May 15, 2010; High Tide 13 9 May 16 - June 14, 2010; Low Tide 10 10 May 16 - June 14, 2010; Rising Tide 11 11 May 16 - June 14, 2010; Falling Tide 11 12 May 16 - June 14, 2010; High Tide 12 13 June 15 - July 13, 2010; Low Tide 12 14 June 15 - July 13, 2010; Rising Tide 13 15 June 15 - July 13, 2010; Falling Tide 9 16 June 15 - July 13, 2010; High Tide 11 17 July 14 - August 11, 2010; Low Tide 12 18 July 14 - August 11, 2010; Rising Tide 13 19 July 14 - August 11, 2010; Falling Tide 11 20 July 14 - August 11, 2010; High Tide 12 21 August 12 - September 10, 2010; Low Tide 10 22 August 12 - September 10, 2010; Rising Tide 12 23 August 12 - September 10, 2010; Falling Tide 12 24 August 12 - September 10, 2010; High Tide 12 Habitat 1 Primarily in cove habitat 45 2 Primarily in channel / ledge habitat 111 3 Primarily in Kailua Bay habitat 102 4 Primarily in rocky shore habitat 16 Table 6. Results of a multivariate ANOVA of salinity at five locations throughout the KME study site (canal bend, boat mooring, cove, cleaning station, and Kailua Bay). Samples were collected at the surface and at depth of each location, sampling each tidal phase (low, rising, falling, high) across two lunar cycles 194 390
  • 195.
    (September-October, 2010). Interactionsof these three categorical variables were considered and time trends were tested using the co-variate “day”. Significant results (p < 0.05) are bolded. Source Sum-of-Squares df Mean-Square F-ratio p Habitat 8.64 4 2.16 6.93 < 0.001 Depth 3.07 1 3.07 9.84 0.003 Tide 4.77 3 1.59 5.10 0.005 Habitat*Depth 5.86 4 1.46 4.70 0.003 Habitat*Tide 2.07 12 0.17 0.55 0.870 Depth*Tide 1.33 3 0.44 1.42 0.250 Habitat*Depth*Tide 1.83 12 0.15 0.49 0.910 Day 24.12 1 24.12 77.37 < 0.001 Error 12.16 39 0.31 - - Table 7. Results of a principal component analysis (PCA) of water temperature variability sampled every 30 minutes from March 14 - October 2, 2010 at three water temperature stations (boat mooring, canal bend, and offshore locations), including the eigenvalues of the first three principal components (PC), the amount of explained variance, and results of randomization tests (p-values) for the first three PCs. p- value = (n + 1) / (N + 1), where n is the number of randomizations with an eigenvalue for that axis that is > than the observed eigenvalue for that axis, and N is the total number of randomizations (N = 1000). Significant results (p < 0.05) are bolded. PC (Axis) Eigenvalue % of Variance Cum.% of Var. Broken-stick Eigenvalue p-value 1 40783.72 94.45 94.45 26389.15 0.001 2 1523.04 3.53 97.97 11995.07 1.000 3 875.50 2.02 100.00 4798.03 1.000 Table 8. Scaled PCA eigenvector loading values of the three sampling stations . First three principal components (PC) are shown for water temperature values measured every 30 minutes from March 14 – October 2, 2010. Species Eigenvector Loading Values PC 1 PC 2 PC 3 Boat Mooring -0.59 +0.57 +0.57 Canal Bend -0.58 -0.79 +0.17 Offshore -0.55 +0.23 -0.80 Table 9. Pearson (r) correlations with three PCA ordination axes of water temperature measured every 30 minutes from March 14 – October 2, 2010 in three locations: boat mooring, canal bend, and offshore. Parameter PC 1 PC 2 PC 3 r r2 r r2 r r2 195 4635 4640 4645 4650 4655 4660
  • 196.
    Date -0.78 0.610.04 0.00 -0.34 0.12 Time of Day -0.23 0.05 0.14 0.02 0.18 0.03 Boat Mooring -0.97 0.95 0.18 0.03 0.14 0.02 Canal Bend -0.97 0.94 -0.25 0.06 0.04 0.00 Offshore -0.98 0.95 0.08 0.01 -0.21 0.04 Table 10. Pearson Correlation Coefficient (and p-value) for each of the seven algal functional groups, correlating the algal percent cover (per quadrat) to the algal percent biomass (per quadrat). Also listed are the percent of quadrats in which both biomass and cover were present. As articulated calcareous and foliose algae were never recorded for percent cover, no statistical analysis could be done for these two algal functional groups. Significant results (p < 0.05) are bolded. Algal Functional Group Pearson Correlation Coefficient p-value Percent Quadrats Biomass Present Percent Quadrats Cover Present Articulated Calcareous N/A N/A 5.56 0.00 Complex Branching 0.60 0.008 94.44 88.89 Filamentous 0.27 0.277 38.89 5.56 Foliose N/A N/A 11.11 0.00 Mass Forming 0.77 < 0.001 88.89 55.56 Simple Branching 0.96 < 0.001 50.00 33.33 Turf 0.70 0.001 100.00 100.00 Table 11. Biomass of each functional group (g/m2 ± SD) for each time period and habitat. Subscripts refer to the results of the post-hoc Tukey Test performed to determine pair-wise differences. Same subscripts indicate that algal functional groups are not different. X= functional group excluded from the statistical analysis due to small sample size causing a non-normal distribution. Time Period Early June Late July Early September Habitat Cove Rocky Shore Cove Rocky Shore Cove Rocky Shore Algal Functional Group Articulated Calcareousx 0.00 ± 0.00 2.29 ± 3.97 0.00 ± 0.00 0.00 ± 0.00 0.00 ± 0.00 0.00 ± 0.00 Complex Branchinga 26.25 ± 16.78 25.42 ± 13.20 24.17 ± 27.78 3.13 ± 3.90 60.00 ± 55.06 19.17 ± 4.02 Filamentousb 13.13 ± 11.58 0.00 ± 0.00 0.00 ± 0.00 3.96 ± 3.55 2.71 ± 3.66 0.00 ± 0.00 Foliosex 0.21 ± 0.36 0.00 ± 0.00 0.63 ± 1.08 0.00 ± 0.00 0.00 ± 0.00 0.00 ± 0.00 Mass Forminga,b 9.80 ± 8.63 12.92 ± 3.61 9.17 ± 4.52 9.38 ± 6.96 6.25 ± 10.29 5.83 ± 4.52 Simple Branchingb 0.21 ± 0.36 2.08 ± 2.60 0.00 ± 0.00 6.04 ± 8.89 0.21 ± 0.36 31.67 ± 21.67 Turfc 169.59 ± 137.50 35.00 ± 28.03 250.83 ± 211.83 539.17 ± 846.40 238.96 ± 245.48 17.29 ± 15.89 Table 12. Results of a multivariate ANOVA of biomass (log(biomass + 1)) of five algal functional group biomass (complex branching, filamentous, mass forming, simple branching, and turf algae). Foliose and articulated calcareous functional groups are not included as these two groups were not collected in all three time periods (early June, late July, and early September). Significant results (p < 0.05) are bolded. Source Sum-of-Squares df Mean-Square F-ratio p-value Time 0.00 2.00 0.00 0.01 0.99 196 4665 4670 4675 4680
  • 197.
    Location 0.18 1.000.18 1.59 0.21 Group 11.63 4.00 2.91 26.44 <0.01 Time*Location 0.05 2.00 0.02 0.21 0.81 Time*Group 2.02 8.00 0.25 2.30 0.03 Location*Group 1.69 4.00 0.42 3.83 0.01 Time*Location*Group 1.00 8.00 0.12 1.13 0.36 Error 6.60 60.00 0.11 - - Table 13. Pearson (r) Correlations for various video behavioral survey and time-depth-temperature recorder (TDTR) parameters, covering all times when data were collected concurrently with both methodologies (N = 801 data points, on 15-second intervals, or 26 videos). All correlations are significant (p < 0.05). Video / TDTR Parameter Sample Size (N) Pearson Correlation (r) p-value Instantaneous Turtle Depth 801 0.61 p < 0.01 Average Turtle Depth 26 0.81 p < 0.01 Maximum Turtle Depth 26 0.51 p < 0.01 Coefficient of Variation of Turtle Depth 26 0.66 p < 0.01 Vertical Turtle Depth Displacement 26 0.71 p < 0.01 Table 14. Non-parametric Kendall rank correlations (tau) of 22 quantitative environmental behavioral variables with axis 1 of the NMDS. Bolded values indicate significant correlations (p < 0.05). Tidal phase and wind direction were not included because they are categorical variables. Environmental Behavioral Variables Axis 1 tau p Julian Day +0.04 p > 0.1 Tidal Height +0.05 p > 0.1 197 4685 4690 4695 4700 4705 4710 395
  • 198.
    Lunar Cycle +0.04p > 0.1 Cloud Cover -0.02 p > 0.1 Wind Speed -0.08 0.05 < p < 0.1 Precipitation +0.06 p > 0.1 Cove Habitat +0.15 p < 0.001 Rocky Shore Habitat -0.08 0.05 < p < 0.1 Kailua Bay Habitat +0.08 0.05 < p < 0.1 Channel Habitat -0.14 p < 0.001 Ledge Habitat -0.12 0.002 < p < 0.005 Canal Habitat -0.11 0.005 < p < 0.01 Rocky Substrate +0.00 p > 0.1 Rubble Substrate +0.19 p < 0.001 Algae Substrate +0.18 p < 0.001 Sandy Substrate -0.02 p > 0.1 Coral Substrate +0.09 0.02 < p < 0.05 Bivalve Substrate +0.02 p > 0.1 Urchin Substrate +0.10 0.01 < p < 0.02 Average Water Depth -0.12 0.002 < p < 0.005 Coefficient of Variation of Water Depth -0.07 0.05 < p < 0.1 Video Length +0.33 p < 0.001 Table 15. Summary statistics for the multi-replicate permutation procedure (MRPP; relative Sorensen distance), using resting, foraging / food searching, and posing behaviors as the grouping variable, with the null hypothesis that there will be no differences when grouping turtle behavior by amount of resting. Group 1 = all resting; Group 2 = some resting, foraging / food searching, no posing; Group 3 = no resting, some foraging / food searching, no posing; Group 4 = no resting, no foraging / food searching, some posing; Group 5 = some resting, some foraging / food searching, no posing; Group 6 = no resting, some foraging / food searching, some posing; Group 7 = no resting, no foraging / food searching, no posing. As there were no videos with 1) all foraging / food searching, 2) all posing, 3) some resting, no foraging / food searching, some posing, and 4) some resting, some foraging / food searching, some posing, these 198 4715 4720 4725 4730 4735
  • 199.
    four groups werenot included in the analysis. The Test Statistic, T, measures effect size, the A Statistic measures within-group agreement, and the p-value determines the probability of a δ as small or smaller than the observed δ. The observed δ (0.26) is significantly different from the expected δ under the null hypothesis (0.50) (T = -89.88, A = 0.47, p < 0.01). Only significant group pair-wise comparisons (p < 0.05) are shown. Group Pair-wise Comparisons T p A 7 vs. 6 -107.91 0.00 0.36 7 vs. 1 -66.44 0.00 0.34 7 vs. 2 -16.43 0.00 0.07 7 vs. 4 -23.27 0.00 0.11 7 vs. 5 -12.77 0.00 0.05 7 vs. 3 -13.53 0.00 0.07 6 vs. 1 -63.93 0.00 0.38 6 vs. 2 -32.72 0.00 0.17 6 vs. 5 -35.83 0.00 0.19 1 vs. 2 -25.37 0.00 0.51 1 vs. 4 -19.40 0.00 0.43 1 vs. 5 -26.95 0.00 0.52 1 vs. 3 -13.52 0.00 0.31 2 vs. 4 -12.37 0.00 0.24 2 vs. 5 -2.50 0.03 0.02 2 vs. 3 -9.47 0.00 0.19 4 vs. 5 -13.40 0.00 0.22 5 vs. 3 -11.24 0.00 0.19 Table 16. Summary statistics (Monte Carlo test of significance of the observed maximum indicator value, IV, based on 4999 randomizations) of the Indicator Species Analysis, using resting, foraging / food searching, and posing behaviors as the grouping variable. Means and standard deviations of the IV from the randomizations are reported along with p-values for the null hypothesis of no difference between resting groups, where p = (1 + number of runs > observed IV) / (1 + number of randomized runs). Max Group refers to the defined resting group with the maximum observed IV. Significant results (IV > 25.00, p < 0.05) are bolded. Species Max Observed Indicator IV from randomized groups 199 4740 4745 4750 4755 4760 400
  • 200.
    Group Value (IV)Mean S. Dev. p 1) % Foraging 3 37.00 11.60 4.50 0.00 2) % Food Searching 3 56.00 12.30 4.44 0.00 3) % Resting 1 74.60 8.50 4.45 0.00 4) % Hovering 3 22.80 16.50 3.36 0.05 5) % Posing 4 71.30 7.60 4.45 0.00 6) % Swimming 7 28.60 16.80 1.73 0.00 7) % Breathing 6 13.40 12.70 3.85 0.32 8) % Body Swiping 4 6.30 6.50 4.28 0.35 9) Avg Turtle Depth 1 23.40 16.60 1.19 0.00 10) CV Turtle Depth 5 20.40 16.20 1.50 0.01 11) Max Turtle Depth 5 17.40 16.10 0.89 0.09 12) # Depth Bin Changes / Video Length 5 21.90 16.70 1.89 0.02 13) Avg Flipper Beats / 30 Sec 7 22.90 16.20 1.19 0.00 14) Max Flipper Beats / 30 Sec 7 18.70 15.80 0.93 0.01 15) CV Flipper Beats / 30 Sec 2 28.40 18.80 2.87 0.01 16) Avg # Bites / 15 Sec 3 52.20 13.20 4.66 0.00 17) Max # Bites / 15 Sec 5 31.70 12.30 3.98 0.00 18) CV # Bites / 15 Sec 5 36.20 12.40 3.99 0.00 19) # Breaths / Video Length 6 21.50 16.60 2.51 0.05 20) Avg Time Between Breaths 6 18.20 15.06 1.76 0.08 Table 17. Summary statistics for the multi-replicate permutation procedure (MRPP; Relative Sorensen distance), using a combination of Month and Tide as the grouping variable, with the null hypothesis that there will be no differences when grouping turtle behavior by Month and Tide. Group 1 = March 18- April 16, 2010 (Month 1), Low Tide; Group 2 = Month 1, Rising Tide; Group 3 = Month 1, Falling Tide, Group 4 = Month 1, High Tide; Group 5 = April 17-May15, 2010 (Month 2), Low Tide; Group 6 = Month 2, Rising Tide; Group 7 = Month 2, Falling Tide; Group 8 = Month 2, High Tide; Group 9 = May 16-June 14, 2010 (Month 3), Low Tide; Group 10 = Month 3, Rising Tide; Group 11 = Month 3, Falling Tide; Group 12 = Month 3, High Tide; Group 13 = June 15-July 13, 2010 (Month 4), Low Tide; Group 14 = Month 4, Rising Tide; Group 15 = Month 4, Falling Tide; Group 16 = Month 4, High Tide; Group 17 = July 14-August 11, 2010 (Month 5); Low Tide; Group 18 = Month 5, Rising Tide; Group 19 = Month 5, Falling Tide; Group 20 = Month 5, High Tide; Group 21 = August 12-September 10, 2010 (Month 6), Low Tide; Group 22 = Month 6, Rising Tide; Group 23 = Month 6, Falling Tide; Group 24 = Month 6, 200 4765 4770 4775 4780 4785
  • 201.
    High Tide. TheTest Statistic, T, measures effect size, the A Statistic measures within-group agreement, and the p-value determines the probability of a δ as small or smaller than the observed δ. The observed δ (0.49) is not significantly different from the expected δ under the null hypothesis (0.50) (T = -1.15, A = 0.01, p = 0.13). Only significant group pair-wise comparisons (p < 0.05) are shown, although they are only significant by chance. Group Pair-wise Comparisons T p A 2 vs. 13 -3.05 0.02 0.08 1 vs. 13 -3.77 0.01 0.10 1 vs. 17 -2.74 0.02 0.06 1 vs. 21 -2.17 0.04 0.05 3 vs. 10 -2.70 0.02 0.05 4 vs. 8 -2.06 0.04 0.05 4 vs. 13 -3.22 0.01 0.08 8 vs. 9 -3.81 0.01 0.11 8 vs. 10 -4.43 0.00 0.11 8 vs. 18 -2.35 0.03 0.06 9 vs. 13 -3.86 0.01 0.12 9 vs. 20 -2.07 0.04 0.05 9 vs. 24 -2.48 0.03 0.06 12 vs. 10 -2.26 0.03 0.05 11 vs. 13 -2.20 0.04 0.06 10 vs. 13 -4.77 0.00 0.13 10 vs. 19 -2.04 0.04 0.05 10 vs. 20 -2.34 0.03 0.05 10 vs. 24 -3.74 0.01 0.08 13 vs. 16 -2.14 0.04 0.06 13 vs. 20 -2.49 0.03 0.06 13 vs. 18 -4.36 0.00 0.10 13 vs. 22 -2.15 0.04 0.05 Table 18. Summary statistics for the multi-replicate permutation procedure (MRPP; Relative Sorensen distance), using Habitat as the grouping variable, with the null hypothesis that there will be no differences when grouping turtle behavior by Habitat. Group 1 = primarily in cove habitat; Group 2 = primarily in channel / ledge habitat; Group 3 = primarily in Kailua Bay habitat; Group 4 = primarily in rocky shore habitat. As there were no videos spent primarily within the canal habitat, and only one incidence each of 1) being primarily in both cove and Kailua Bay habitats, 2) being primarily in both channel / ledge and rocky shore habitats, and 3) being primarily in both channel / ledge and Kailua Bay habitats, these groupings were not included in the analysis. The Test Statistic, T, measures effect size, the A Statistic measures within-group agreement, and the p-value determines the probability of a δ as small or smaller than the observed δ. The observed δ (0.47) is significantly different from the expected δ under the null hypothesis (0.50) (T = -18.71, A = 0.07, p < 0.01). Only significant group pair-wise comparisons (p < 0.05) are shown. 201 4790 4795 4800 4805
  • 202.
    Group Pair-wise Comparisons T pA 2 vs. 1 -19.04 0.00 0.07 2 vs. 3 -17.67 0.00 0.05 2 vs. 4 -5.32 0.00 0.03 1 vs. 3 -6.77 0.00 0.03 1 vs. 4 -3.75 0.01 0.04 Table 19. Summary statistics (Monte Carlo test of significance of the observed maximum indicator value, IV, based on 4999 randomizations) of the Indicator Species Analysis, using Habitat as the grouping variable. Means and standard deviations of the IV from the randomizations are reported along with p- values for the null hypothesis of no difference between resting groups, where p = (1 + number of runs > observed IV) / (1 + number of randomized runs). Max Group refers to the defined resting group with the maximum observed IV. Significant results (IV > 25.00, p < 0.05) are bolded. Species Max Group Observed Indicator Value (IV) IV from randomized groups Mean S. Dev. p 1) % Foraging 1 38.90 13.20 3.46 0.00 2) % Food Searching 1 28.40 14.40 3.51 0.01 3) % Resting 2 34.40 8.50 3.07 0.00 202 4810 4815 4820 4825 4830 4835 4840 405
  • 203.
    4) % Hovering3 25.40 23.10 3.19 0.18 5) % Posing 2 14.90 6.90 3.11 0.03 6) % Swimming 4 32.70 25.80 1.84 0.00 7) % Breathing 1 23.50 15.80 3.24 0.03 8) % Body Swiping 3 4.00 5.40 2.58 0.70 9) Avg Turtle Depth 2 35.80 26.90 1.16 0.00 10) CV Turtle Depth 4 29.50 25.10 1.69 0.02 11) Max Turtle Depth 2 32.80 26.60 0.94 0.00 12) # Depth Bin Changes / Video Length 4 29.40 25.50 1.95 0.04 13) Avg Flipper Beats / 30 Sec 4 30.30 25.70 1.45 0.00 14) Max Flipper Beats / 30 Sec 4 27.60 25.40 1.29 0.07 15) CV Flipper Beats / 30 Sec 1 31.70 27.60 2.70 0.08 16) Avg # Bites / 15 Sec 1 43.00 15.50 3.66 0.00 17) Max # Bites / 15 Sec 1 34.20 15.00 3.30 0.00 18) CV # Bites / 15 Sec 1 21.00 15.10 3.30 0.06 19) # Breaths / Video Length 1 39.50 24.30 2.50 0.00 20) Avg Time Between Breaths 4 30.50 23.50 2.02 0.01 FIGURES: 203 4845 4850 4855
  • 204.
    Figure 1. A)The main Hawaiian Islands. B) Kailua Bay on the windward side of the island of O’ahu. C) The Kawai’nui Marsh Estuary study site. 204 4860 410
  • 205.
    Figure 2. Thefive primary habitats of interest at the Kawai’nui Marsh Estuary study site. Video behavioral surveys occurred in the cove, channel, and Kailua Bay habitats, with randomized starting positions within each habitat, labeled A,B, and C. 205 4865
  • 206.
    Figure 3. Samplinglocations within the Kawai’nui Marsh Estuary study site: salinity water samples (yellow pentagons), and temperature loggers (white circles = used in analysis, red circles = not used in analysis due to missing data). 206 4870
  • 207.
    Figure 4. Locationof 18 algal biomass and percent cover sampling points within the rocky shore and cove habitats at the Kawai’nui Marsh Estuary site. Each habitat was sampled three times every 1.5 months from early June to early September, as shown by the dates. 207 4875 415
  • 208.
    Figure 5. Distributionof 7480 GPS points recorded every 15 seconds during 251 individual turtle behavior videos at the Kawai’nui Marsh Estuary study site, collected from March 23 through September 5, 2010. 208 4880
  • 209.
    Figure 6. A)Water temperature (°C) at three stations within the Kawai’nui Marsh estuary site (boat mooring, canal bend, and offshore). B) The first three principal component (PC) values of the principal component analysis (PCA) showing the relationship of water temperature amongst three stations (boat mooring, canal bend, and offshore) within the Kawai’nui Marsh Estuary study site. Water was sampled every 30 minutes from March 14 – October 2, 2010. 209 4885 4890 420
  • 210.
    Figure 7. Resultsof a Principal Component Analysis (PCA) which compares water temperature at three locations (boat mooring, canal bend, and offshore) in the Kawai’nui Marsh Estuary study site. One principal component (PC) solution; PC 1 r2 = 0.945, p < 0.05. PC 2 is shown as well to show a slight bit more variation (PC 2 r2 = 0.035), but PC 2 is not significant (p > 0.05). Water temperature was recorded every 30 minutes from March 14 – October 2, 2010 at each station. Black points represent each water temperature sample throughout the study period, while red vectors represent the three species, or stations, and their relationship to the water samples along the first two principal components. 210 4895 4900
  • 211.
    Figure 8. Fourier(spectral) analysis showing patterns of water temperature change as a function of number of days, as indicated by the first principal component (PC) of the principal component analysis (PCA) which explains 98.5% of the variation in water temperature amongst the three sampled locations (boat mooring, canal bend, offshore) within the Kawai’nui Marsh Estuary study site. 211 4905 4910
  • 212.
    Figure 9. Comparisonof percent biomass vs. percent cover for seven algal functional groups: A) complex branching, B) mass forming, C) filamentous, D) simple branching, and E) turf algae. The data points on each graph represent the 18 quadrats sampled in the study, coded by habitat: “C” refers to the cove, and “R” refers to the rocky shore. Numbers 1-3 refer to early June sampling, numbers 4-6 refer to late July sampling, and number 7-9 refer to early September sampling. Because the articulated calcareous and foliose functional groups were not recorded in the percent cover survey, statistical analyses were not possible for thesefunctional groups. 212 4915 4920 425
  • 213.
    Figure 10. Biomassof each functional group (mean ± SD) for each time period and habitat: A) complex branching, B) mass forming, C) filamentous, D) simple branching, and E) turf. Each value is an average of the functional group biomass collected from three quadrats sampled at each location during each time period. White bars represent the cove habitat, while grey bars represent the rocky shore habitat. 213 4925 4930
  • 214.
    Figure 11. Distributionof six behaviors mapped at 7,480 GPS points recorded every 15 seconds during 251 individual turtle behavior videos at the KME study site: A) Resting (n = 672); B) Foraging (n = 1000); C) Breathing (n = 176); D) Posing (n = 228); E) Swimming (n = 4334); F) Hovering (n = 1034). 214 4935 4940 430
  • 215.
    Figure 12. Kerneldensities (100%, 99%, 95%, and 50%) of six behaviors mapped at 7,480 GPS points recorded every 15 seconds during 251 individual turtle behavior videos at the KME study site: A) Resting (n = 672); B) Foraging (n = 1000); C) Breathing (n = 176); D) Posing (n = 228); E) Swimming (n = 4334); F) Hovering (n = 1034). 215 4945 4950
  • 216.
    Figure 13. Therelationships of 8 behavioral states (solid black points; A), 20 behavioral variables (solid grey points; B), and 277 video samples (hollow points; C) filmed at the KME study site (non-metric multidimensional scaling analysis; NMDS, stress = 8.857). One- dimensional solution: Axis 1 r2 = 0.797, p = 0.001. 216 4955
  • 217.
    Figure 14. Kendallrank correlations of 22 environmental variables with axis 1 of the NMDS. All parameters extending beyond vertical dashed lines (tau = ± 0.079, p < 0.05) are significantly correlated with the axis1 of the NMDS. 217 4960 435
  • 218.
    Figure 15. Pair-wisegroup comparisons for the MRPP, testing the null hypothesis of no differences when grouping turtle behavior by the amount of resting, foraging / food searching, and posing into seven groups: Group 1 = all resting; Group 2 = some resting, foraging / food searching, no posing; Group 3 = no resting, some foraging / food searching, no posing; Group 4 = no resting, no foraging / food searching, some posing; Group 5 = some resting, some foraging / food searching, no posing; Group 6 = no resting, some foraging / food searching, some posing; Group 7 = no resting, no foraging / food searching, no posing. Bolded lines represent groups which are significantly different from one another (p < 0.05), and dashed lines represent groups which are not significantly different from one another (p > 0.05). 218 4965 4970 4975
  • 219.
    Figure 16. Pair-wisecomparisons for the MRPP testing the null hypothesis of no differences when grouping turtle behavior by Habitat: Group 1 = primarily in cove habitat; Group 2 = primarily in channel / ledge habitat; Group 3 = primarily in Kailua Bay habitat; Group 4= primarily in rocky shore habitat. Bolded lines represent groups with are significantly different from one another (p < 0.05), and dashed lines represent groups which are not significantly different from one another (p > 0.05). CHAPTER 4: Conclusions 219 4980 4985 4990 4995 5000 440
  • 220.
    As the populationof Hawaiian green turtles (Chelonia mydas) continues to rise and they near pre-exploitation level carrying capacity (Chaloupka and Balazs 2007), their direct and indirect ecological services as a macroherbivore is becoming ever more important. Hawaiian green turtles are endemic and genotypically different from other stocks and are thus managed regionally (Chaloupka et al. 2008a; Wallace et al. 2010). These turtles reside in many coral reefs and coastal foraging grounds throughout the 132 Hawaiian Islands, primarily consume algae and seagrass, and spend most of their time in the shallows where their food is present (Brill et al. 1995;Balazs and Chaloupka 2004; Arthur and Balazs 2008). Sea turtles are critically important to the structure and function of ecosystems, by helping to maintain the balance between algae and coral cover (Jackson et al. 2001). Studying the movements and behaviors of sea turtles is critical in understanding their conservation needs, including their feeding ecology, habitat use and potential human threats (Seminoff et al. 2002; Hazel et al. 2009; Wallace et al. 2010). The worldwide population of green turtles is considered “endangered” under the Endangered Species Act (ESA; NMFS and USFWS 1998). Although listed as “threatened” in the Hawaiian islands, the endemic green turtle population has been growing at 5.7% per year (Balazs and Chaloupka 2004; Chaloupka et al. 2008a). As their numbers continue to rise, Bayesian state-space surplus-production models show that coastal populations have reached approximately 83% of pre-exploitation carrying capacity, based on commercial landings and nester abundance (Chaloupka and Balazs 2007). Evidence of this approach to carrying capacity comes from both foraging and breeding sites. At Kaloko-Honokohau, Hawai’i, resident green turtle populations are believed to have already reached 100% carrying capacity, on the basis of biomass and consumption rate estimates from the Ecopath and Ecosim software. At the site, urchins consume the same algal material as the turtles, limiting the algal biomass, and therefore 220 5005 5010 5015 5020 5025
  • 221.
    limiting the turtlepopulation (Wabnitz et al. 2010). Additionally, 200-700 female green turtles are known to nest annually at the French Frigate Shoals, where 90% of the population nests (Balazs et al. 1992), suggesting that the Hawaiian green turtle population may potentially be large enough to remain stable into the foreseeable future (NMFS and USFWS 1998). Due to the stabilization of the species, a discussion has begun for the potential delisting from the ESA and even for the potential initiation of harvesting on a limited basis. Bayesian state-space surplus- production models show that the harvest of 2.5 tonnes (approximately 50 immature turtles) per year would still produce a rising population, as there are currently about this number of turtles that are taken incidentally in shore-based fisheries each year (Chaloupka and Balazs 2007). As their numbers continue to rise, the turtles are expected to become ever more important in limiting the spread of invasive algae, and maintaining the health and resilience of seagrass and coral reef ecosystems in the Hawaiian Islands (Jackson et al. 2001). Despite increasing numbers, concerns have been raised about the ability of the green sea turtle population to cope with anthropogenic disturbances and habitat degradation, as well as global climate change impacts on nesting beaches and at-sea (Bjorndal and Jackson 2003, Chaloupka et al. 2008a). Thus, understanding turtle population dynamics is critical for their management, since fluctuations in their numbers can lead to cascading changes in the ecosystem (Pandolfi et al. 2003), due to the key ecological roles this species plays as a grazer, engineer of the benthic substrate, and nutrient transporter (Bjorndal and Jackson 2003). Therefore, understanding the roles and services this species plays in the marine ecosystem is another critical component, which will require population estimates and detailed studies of their seasonal and habitat-specific distributions and activity patterns. The behavioral research presented herein provides a model for juvenile green turtle activity and horizontal distributions at a critical 221 5030 5035 5040 5045 5050
  • 222.
    foraging / restinglocation which will provide managers with the information they need to make educated decisions regarding any conservation implementations. Methodology: Expanding Beyond Personal Observation to Avoid Time-Depth Recorder (TDR) Data-Based Biases As described in the second chapter of this thesis, augmenting time-depth recorder (TDR) data with personal observation ground-truths the inferences researchers make from electronic tags regarding behavior. If personal observation is not possible, there are a number of other techniques which could be employed to minimize the biases of inferring behavior from TDR data alone. For instance, besides classifying diving data by dive “shape,” dives can be classified by maximum depth, dive duration, descent rate, ascent rate, or bottom time. Or, rather than looking at the shape of each individual dive, it may be easier to cluster the dives based on their shape classification, or use other statistical techniques, as was done in the second and third chapters of this thesis. Another option would be to implement a dimensionless index of dive shape (Time Allocation at Depth Index, TAD), which is independent of depth and time, but depicts the depth range at which the diver has concentrated its activity, or to use an algorithm to pick out and analyze the points at which dive angle changes most drastically (Fedak et al. 2001). It may also be possible to integrate TDR datasets with bathymetric data to determine the locations in which dives have occurred. Blumenthal et al. (2010) inferred the location of dives by comparing dive and substrate depths, and confirmed these inferences with ultrasonic tracking and direct observation of the turtles. However, this technique still requires behavioral inferences, since a turtle’s depth will only relate to the water depth in those instances of benthic feeding. Therefore, other techniques would be advised. 222 5055 5060 5065 5070 445
  • 223.
    Another method ofdetermining a turtle’s location while diving relies on GPS (Geographic Positioning System) technology (e.g., Senko et al. 2010), which is much more accurate than satellite-linked telemetry and can upload data at a much quicker rate. Thus, the new Fast-lock FGPS technology allows the fine-scale (resolution of a few meters) tracking of marine animals, like green turtles, which surface briefly. Furthermore, unlike acoustic tracking, FGPS has several logistical advantages: it does not require a boat for tracking, and is not impacted by weather and wave conditions (Hazel 2009). Yet, FGPS tags either require data delivery through cell-phone systems (needing larger batteries and an antenna) or rely on the recapture of the tagged turtle (when using archival tags that store the data for manual download). Many studies combine the use of multiple devices to obtain a better picture of turtle diving behavior. The combination of TDRs alongside underwater hydrophones facilitates the analysis of horizontal and vertical movements (location), allowing the discrimination between resting and foraging behavior (Seminoff et al. 2002; Makowski et al. 2006; Blumenthal et al. 2009). The use of passive telemetry, such as acoustic monitoring, can determine rhythms of activity, such as switching between traveling, resting, and foraging behaviors (Brill et al. 1995; Taquet et al. 2006; Asuncion 2010). Yet, manual tracking with sonic tracking devices is labor intensive (Seminoff et al. 2002), and requires great financial investment (Witt et al. 2010). Therefore, some studies place acoustic receivers at specific locations within a site (e.g., Blumenthal et al. 2009) which may decrease labor and costs. In addition to location, electronic devices can also collect ancillary data to interpret the TDR dive data. For example, visual imaging systems, activity / swim speed sensors, and instruments that quantify jaw movement can reveal if specific activities are occurring (Hays et al. 2004). A critical parameter for understanding turtle diving behavior is the quantification of 223 5075 5080 5085 5090 5095
  • 224.
    flipper beat rate.A very small number of studies have explored this behavior using several instruments (Hays et al. 2007). Crittercams, if positioned properly, may be able to record the number of flipper beats a turtle takes on a specific dive or during a given time interval. Additionally, a movement sensor can be used to count the number of flipper beats using acceleration data. Hays et al. (2004) deployed a movement sensor in conjunction with a TDR on one green turtle and was able to determine active vs. inactive dives. In principle, the more data types an electronic device collects, the higher the ability to infer turtle behavior. Newer data loggers have the capability to collect data on multiple different parameters concurrently. For instance, Yasuda and Arai (2009) used accelerometers on green turtles in Thailand which recorded flipper beat frequency, body angle, swimming speed, and ambient water temperature. In a study by Hochscheid et al. (2005), six loggerheads were equipped with an IMASEN mandible / jaw sensor which detected beak movements while foraging, breathing, and moving water through their mouths. Using this sensor alongside a TDR could show great detail regarding turtle foraging behavior – whether they feed at the surface or benthic substrate, how often they eat or take bites, and even suggest what they are eating. While newer electronic devices may provide better options for describing diving behavior, the fact remains that without visual behavioral observations, turtle activities must still be inferred (Seminoff et al. 2006). Implications and Future Directions 224 5100 5105 5110 5115 450
  • 225.
    A better understandingof green sea turtle behavior, especially in areas subject to anthropogenic threats, is of utmost importance for the conservation of the species and its habitats. While technological developments have facilitated studies of turtle diving and movements in shallow coastal habitats, research of immature or juvenile turtles at foraging grounds is limited (especially for green turtles; Hart and Fujisaki 2010) because it is generally difficult to deploy and retrieve the time-depth recorders (TDRs) (e.g., Southwood et al. 2003). Thus, conservation efforts for green turtles in shallow, neritic foraging habitats have been hindered by a lack of understanding of how the turtles use these habitats (Seminoff et al. 2002). Yet, this is critical information for conservation, since these juveniles can spend decades within a small habitat (Makowski et al. 2006) and their survival is essential to the stability of their population (Chaloupka 2002). In particular, Hawaiian green turtles remain exposed to a number of anthropogenic dangers within their foraging grounds, especially as they will spend between 11 and 59 years in these habitats until they reach maturity (Balazs 1980). Green turtles swimming close to shore are in danger of entanglement in floating debris (Gribble et al. 1998), entanglement in fishing gear, and boat strikes. From 1982-2003, 75% of 3,372 Hawaiian green turtle strandings occurred on the heavily populated island of O’ahu, 50% of which occurred in near vicinity to Kaneohe Bay on the northeast side of the island, directly northwest of the Kawai’nui Marsh Estuary (KME) study site. Overall, 24% of all strandings in Hawai’i were caused by fishing gear-induced trauma (gillnets, hooking, or entanglement; Chaloupka et al. 2008b). While fishing gear interactions do not always end in strandings, they can negatively affect turtles by causing limb amputations. However, specific mortality for gillnet gear and for hook-and-line gear is 69% and 52%, respectively, with juvenile turtles being the most susceptible to this type of trauma 225 5120 5125 5130 5135 5140
  • 226.
    (Chaloupka et al.2008a). Hook-and-line gear trauma and boat strikes were most common on O’ahu than on any other island (Chaloupka et al. 2008a). This study focused on the resident green turtle population of KME in Kailua Bay, O’ahu, Hawai’i, a site that is home to between 40 (winter) and 100 (spring) juvenile green turtles with strong year-round fidelity to the site (Asuncion 2010). KME is located in a heavily populated area, and recreational vessels such as kayaks, outrigger canoes, and motor boats often pass through the site, with snorkeling, fishing, and surfing being popular activities suggesting a great amount of human-turtle interaction occurs at KME. Furthermore, daily abundance of green turtles peaks at midday, when human use of the site is highest (Asuncion 2010). These times may overlap with the periods in which the turtles forage heavily in the shallow cove and Kailua Bay habitats, both of which are utilized for human recreational activity. Particularly within the cove habitat, turtles are subject to the fishing lines and hooks of the fishers who remain on shore. During the study period, at least three turtles with amputated limbs were observed while another four were seen with either fishing hooks or line, often creating open wounds. Additionally, a great amount of fishing-related marine debris remains at the site presenting a threat to the turtles which rely on the location for foraging, resting, and cleaning. Ten months after the conclusion of data collection at KME, a buoy with a rattling chain was placed approximately 15 m from cleaning station; turtles are no longer observed at the cleaning station. This could be problematic as the cleaning station appears to be a feature drawing the turtles to the KME location, and could be critical in their health maintenance. Management Recommendations 226 5145 5150 5155 5160
  • 227.
    Most of thestudies on juvenile green turtle behavior in foraging locations have focused on reef habitats, deeper than most shallow foraging sites, where human mortality is of little concern (e.g. Seminoff et al. 2001; Southwood et al. 2003; Makowski et al. 2006). Because turtle behavior does change from foraging location to foraging location, the results of these studies are not necessarily applicable to other shallower sites (Hays et al. 2002). Therefore, prioritizing small areas for protection requires detailed location-specific information on turtle behavior and small scale movement patterns, and human activities (e.g., Hazel et al. 2009). Identifying important areas for management at KME requires considering the distribution of turtle behaviors and threats across habitats, using three criteria (scaled from 0 to 3) to determine the priority for protection (Table 1): (i) the prevalence of each behavior, calculated by dividing the number of GPS points collected within the study corresponding to a certain behavior by the total number of GPS points, and subsequently multiplying this calculated percentage by the highest possible score of three; (ii) the magnitude of human-induced risk, with one point awarded for the presence of each of three potential risks: boats (motorized and un-motorized), hook / line fishing, and gillnet fishing; and (iii) the degree to which these distributions can be mapped (Figure 1), with scores based on the spatial concentration of the different behaviors. The addition of the scores for these three criteria resulted in overall prioritization scores ranging from 0 to 9: 0.00-3.00 being considered low priority, 3.01-6.00 being considered medium priority, and 6.01-9.00 being considered high priority. 227 5165 5170 5175 5180 5185 455
  • 228.
    In this study,we primarily considered six behaviors, three of which were considered site- specific (resting, foraging / food searching, posing) and three which were generalized (swimming, hovering, and breathing). All six behaviors resulted in overall scores in the medium conservation priority range (3.01-6.00). Swimming behavior received the highest score (5.74), as it is very prevalent at the site and poses a greater risk of boat strikes, hook/line fishing, and gillnets. Foraging (5.40) and posing (5.09) behaviors had the next highest scores, because they occur where the turtles face many risks, and foraging is fairly condensed within the cove and Kailua Bay habitats while posing is highly condensed within the channel habitat, making them easier to map. Hovering (4.41) and breathing (4.07) had similar scores, primarily due to the spatial generality of the behaviors leading to more imposed risks. Resting resulted in the lowest score (3.27) as turtles were tucked away from dangers under the ledge, but as the behavior is fairly spatially condensed, it is easier to map. Resting turtles are primarily in danger of being struck by boats as they frequently surface to breathe after a resting event, and remain at the surface for an extended time period. Therefore, if attempting to enact conservation measures on behavioral characteristics alone, any management decisions should be based on the distributions of the swimming, foraging, and posing behaviors. Despite the scores awarded to each behavior, it may be important to consider the ecological importance of each behavior as its own criteria. While all behaviors are important ecologically for the turtles, it appears as though the turtles are drawn to KME due to the close proximity of resting habitat, foraging habitat, and a cleaning station (where the turtles pose). While all turtles are at risk from a variety of human activities at KME, shore-based fishing- induced trauma remains the largest threat, which mostly impacts the cove and rocky shore habitats, where foraging occurs, but also impacts the channel to a smaller degree, where resting 228 5190 5195 5200 5205
  • 229.
    and posing occur.Therefore, it may be best to focus conservation measures on these three specific behaviors, especially as they are the easiest to map and thereby predict. If planning conservation management strategies by habitat (Figure 2), four criteria must be considered, each of which is once again given a score of zero to three (Table 2): (i) the number of turtles utilizing the site, calculated by dividing the number of GPS points collected within the study corresponding to a certain habitat by the total number of GPS points, and subsequently multiplying this calculated percentage by the highest possible score of three; (ii) the magnitude of human-induced risk, scored the same as above; (iii) the presence / absence of each of the six specific behaviors within each habitat, with a presence given a score of 0.5; and (iv) the degree to which these habitats can be mapped, with scores arbitrarily given based on the topographical features used to define a habitat. As above, the addition of the scores for these four criteria resulted in overall scores, with an overall score of 0.00-4.00being considered low priority, 4.01-8.00 being considered medium priority, and 8.01-12.00 being considered high priority for conservation. The channel / ledge (9.21) and Kailua Bay (8.41) habitats each received scores in the high conservation priority category, as both of these habitats had the largest number of turtle GPS points, both are at high risk, contain the most variety of behavior, and are fairly easy to map. The cove habitat fell into the medium category, receiving a score of 7.48. This habitat had the lowest amount of turtle presence and the smallest amounts of behavioral variety, but the score was increased by high human-induced risks and the easiest degree of mapping. Therefore, 229 5210 5215 5220 5225 5230 460
  • 230.
    if focusing conservationmanagement strategies by habitat, the channel / ledge and Kailua Bay habitats would be highest priorities for protection, followed closely by the cove. It is important to note that the rocky shore and canal habitats were not the focus of the video behavioral surveys performed in this study, and therefore their overall conservation scores cannot be considered in this analysis. Previous research suggests that turtles rest in the canal and move in and out of this habitat in the morning and evening (Asuncion 2010), and turtles were often seen foraging or swimming within the rocky shore although it was often too shallow to enter safely. Thus, if the number of turtles in the canal and rocky shore habitats are considered to be the average of all other habitats combined, and human-induced risks, behavioral occurrence, and ease of mapping each habitat are considered, the canal and rocky shore would receive scores of 8.87 and 6.87 (respectively), putting the canal into the high conservation priority category, and the rocky shore in the medium priority category. It may also be important to consider each of the habitats from an ecological perspective for the turtles. The cove, channel / ledge, and canal are most important for the turtles as these are the habitats in which the turtles forage, rest, and get cleaned. While foraging behavior also occurs in the rocky shore and Kailua Bay habitats, it is not as prevalent there, and these habitats primarily appear to be used for traversing between habitats or sites. Therefore, as the cove, channel / ledge, and canal habitats appear to be the main features drawing the turtles to the site, these habitats may require the highest protection. Once resource managers have made the decision to enact a management strategy for KME, the first step for conservation management, outlined by the Green Turtle Recovery Plan, would be to protect and manage green turtles within their marine habitats through increasing public education and increasing / maintaining law enforcement (NMFS and USFW 1998). The 230 5235 5240 5245 5250
  • 231.
    fishers which utilizeKME should be educated regarding the use of circle hooks to minimize negative turtle interactions and the harmful impacts that fishing-related debris, such as fishing line, hooks, and weights, can have on the turtles and their ecosystems. Periodic beach / site clean-ups should be scheduled which involve fishers, the general public, and youth groups, to get the community involved and make them feel responsible for the health and well-being of the turtles. If the number of injured turtles does not decrease, further regulations should be imposed minimizing the amount of fishing and boat activity in KME, particularly during the spring and summer months when turtle abundance is highest at the site. The next priorities in Hawaiian green turtle conservation are determining the distribution, status, and abundance of green turtle populations (all of which were objectives in both the current study and that of Asuncion 2010), followed by identifying current threats and reducing their impacts, and protecting and managing marine (foraging) habitats (NMFS and USFW 1998). It is my hope that the data collected as part of this thesis will contribute to enacting these critical conservation steps. REFERENCES: Arthur, K.E., and Balazs, G.H. 2008. A comparison of immature green turtle (Chelonia mydas) diets among seven sites in the Main Hawaiian Islands. Pacific Science 62(2):205-217. Asuncion, B. 2010. Characterizing juvenile green sea turtle (Chelonia mydas) habitat use in Kawai’nui, O’ahu: a multi-disciplinary approach. Master’s thesis, Hawai’i Pacific University, Kaneohe, HI. 89 pp. Balazs, G.H. 1980. Synopsis of biological data on the green turtle in the Hawaiian Islands. U.S. Department of Commerce, NOAATM-NMFS-SWFC-7, Honolulu, HI. 141 pp. Balazs, G.H., and Chaloupka, M. 2004. Thirty-year recovery trend in the once depleted Hawaiian green sea turtle stock. Biological Conservation 117:491-498. Balazs, G.H., Hirth, H., Kawamoto, P., Nitta, E., Ogren, L., Wass, R., and Wetherall, J. 1992. 231 5255 5260 5265 5270 5275 5280
  • 232.
    Interim Recovery Planfor Hawaiian Sea Turtles. Honolulu Lab., Southwest Fish. Sci. Cent., Natl. Mar. Fish. Serv., NOAA, Honolulu, HI 96822-2396. Southwest Fish. Sci. Cent. Admin. Rep. H-92-01. 76 pp. Bjorndal, K.A., and Jackson, J.B.C. 2003. Roles of sea turtles in marine ecosystems: reconstructing the past. In: Lutz, P.L., Musick, J.A., Wyneken, J. (Eds.),The Biology of Sea Turtles, vol. II. CRC Press, pp. 259–273. Blumenthal, J.M., Austin, T.J., Bothwell, J.B., Broderick, A.C., Ebanks-Petrie, G., Olynik, J.R., Orr, M.F., Solomon, J.L., Witt, M.J., and Godley, B.J. 2009. Diving behavior and movements of juvenile hawksbill turtles Eretmochelys imbricata on a Caribbean coral reef. Coral Reefs 28:55-65. Blumenthal, J.M., Austin, T.J., Bothwell, J.B., Broderick, A.C., Ebanks-Petrie, G., Olynik, J.R., Orr, M.F., Solomon, J.L., Witt, M.J., and Godley, B.J. 2010. Life in (and out of) the lagoon: fine-scale movements of green turtles tracked using time-depth recorders. Aquatic Biology 9:113-121. Brill, R.W., Balazs, G.H., Holland, K.N., Chang, R.K.C., Sullivan, S., and George, J.C. 1995. Daily movements, habitat use, and submergence intervals of normal and tumor-bearing juvenile green turtles (Chelonia mydas) within a foraging area in the Hawaiian Islands. Journal of Experimental Marine Biology and Ecology 185:203-218. Chaloupka, M. 2002. Stochastic simulation modelling of southern Great Barrier Reef green turtle population dynamics. Ecological Modelling 148:79-109. Chaloupka, M., and Balazs, G. 2007. Using Bayesian state-space modelling to assess the recovery and harvest potential of the Hawaiian green sea turtle stock. Ecological Modelling 205:93-109. Chaloupka, M., Work, T.M., Balazs, G.H., Murakawa, S.K.K., and Morris, R. 2008a. Cause- specific temporal and spatial trends in green sea turtle strandings in the Hawaiian Archipelago (1982-2003). Marine Biology 154:887-898. Chaloupka, M., Bjorndal, K.A., Balazs, G.H., Bolten, A.B., Ehrhart, L.M., Limpus, C.J., Suganuma, H., Troëng, S., and Manami, Y. 2008b. Encouraging outlook for recovery of a once severely exploited marine megaherbivore. Global Ecology and Biogeography 17:297-304. Fedak, M.A., Lovell, P., and Grant, S.M. 2001. Two approaches to compressing and interpreting time-depth information as collected by time-depth recorders and satellite-linked data recorders. Marine Mammal Science 17(1):94-110. Gribble, N.A., McPherson G., and Lane, B. 1998. Effect of the Queensland shark control 232 5285 5290 5295 5300 5305 5310 5315 5320 5325 465
  • 233.
    program on non-targetspecies: whale, dugong, turtle, and dolphin: a review. Australian Journal of Marine and Freshwater Research 49:645-651. Hart, K.M., and Fujisaki, I. 2010. Satellite tracking reveals habitat use by juvenile green sea turtles Chelonia mydas in the Everglades, Florida, USA. Endangered Species Research 11:221-232. Hays, G.C., Glen, F., Broderick, A.C., Godley, B.J., and Metcalfe, J.D. 2002. Behavioural plasticity in a large marine herbivore: contrasting patterns of depth utilisation between two green turtle (Chelonia mydas) populations. Marine Biology 141:985-990. Hays, G.C., Metcalfe, J.D., Walne, A.W., and Wilson, R.P. 2004. First records of flipper beat frequency during sea turtle diving. Journal of Experimental Marine Biology and Ecology 303:243-260. Hays, G.C., Marshall, G.J., and Seminoff, J.A. 2007. Flipper beat frequency and amplitude changes in diving green turtles, Chelonia mydas. Marine Biology 150:1003-1009. Hazel, J. 2009. Evaluation of fast-acquisition GPS in stationary tests and fine-scale tracking of green turtles. Journal of Experimental Marine Biology and Ecology 374:58-68. Hazel, J., Lawler, I.R., and Hamann, M. 2009. Diving at the shallow end: Green turtle behaviour in near-shore foraging habitat. Journal of Experimental Marine Biology and Ecology 371(1):84-92. Hochscheid, S., Maffucci, F., Bentivegna, F., and Wilson, R.P. 2005. Gulps, wheezes, and sniffs: how measurement of beak movement in sea turtles can elucidate their behaviour and ecology. Journal of Experimental Marine Biology and Ecology 316:45-53. Jackson, J.B.C., Kirby, M.X., Berger, W.H., Bjorndal, K.A., Botsford, L.W., Bourque B.J., Bradbury, R.H., Cooke, R., Erlandson, J., Estes, J.A., Hughes, T.P., Kidwell, S., Lange, C.B., Lenihan, H.S., Pandolfi, J.M., Peterson, C.H., Steneck, R.S., Tegner, M.J., and Warner, R.R. 2001. Historical overfishing and the recent collapse of coastal ecosystems. Science 293:629-638. Makowski, C., Seminoff, J.A., and Salmon, M. 2006. Home range and habitat use of juvenile Atlantic green turtles (Chelonia mydas L.) on shallow reef habitats in Palm Beach, Florida, USA. Marine Biology 148:1167-1179. National Marine Fisheries Service and U.S. Fish and Wildlife Service. 1998. Recovery Plan for U.S. Pacific Populations of the Green Turtle (Chelonia mydas). National Marine Fisheries Service, Silver Spring, MD. Pandolfi, J.M., Bradbury, R.H., Sala, E., Hughes, T.P., Bjorndal, K.A., Cooke, R.G., McArdle, 233 5330 5335 5340 5345 5350 5355 5360 5365 5370
  • 234.
    D., McClenachan, L.,Newman, M.J., Paredes, G., Warner, R.R., and Jackson, J.B. 2003. Global trajectories of the long-term decline of coral reef ecosystems. Science 301:955- 958. Seminoff, J., Resendiz, A., Smith, T.W., and Yarnell, L. 2001. Diving patterns of green turtles (Chelonia mydas agassizii) in the Gulf of California. Proceedings of the Twenty-First Annual Symposium on Sea Turtle Biology and Conservation. NOAA Technical Memorandum NMFS-SEFSC-528, pp. 321-323. Seminoff, J.A., Resendiz, A., and Nichols, W.J. 2002. Home range of green turtles Chelonia mydas at a coastal foraging area in the Gulf of California, Mexico. Marine Ecology Progress Series 242:253-265. Seminoff, J.A., Jones, T.T., and Marshall, G.J. 2006. Underwater behaviour of green turtles monitored with video-time-depth recorders: what’s missing from dive profiles? Marine Ecology Progress Series 322:269-280. Senko, J., Koch, V., Megill, W.M., Carthy, R.R., Templeton, R.P., and Nichols, W.J. 2010. Fine scale daily movements and habitat use of East Pacific green turtles at a shallow coastal lagoon in Baja California Sur, Mexico. Journal of Experimental Marine Biology and Ecology 391:92-100. Southwood, A.L., Reina, R.D., Jones, V.S., and Jones, D.R. 2003. Seasonal diving patterns and body temperatures of juvenile green turtles at Heron Island, Australia. Canadian Journal of Zoology 81:1014-1024. Taquet, C., Taquet, M., Dempster, T., Soria, M., Ciccione, S., Roos, D., and Dagorn, L. 2006. Foraging on the green sea turtle Chelonia mydas on seagrass beds at Mayotte Island (Indian Ocean), determined by acoustic transmitters. Marine Ecology Progress Series 306:295-302. Wabnitz, C.C.C., Balazs, G., Beavers, S., Bjorndal, K.A., Bolten, A.B., Christensen, V., Hargrove, S., Pauly, D. 2010. Ecosystem structure and processes at Kaloko Honokohau, focusing on the role of herbivores, including the green sea turtle Chelonia mydas, in reef resilience. Marine Ecology Progress Series 420:27-44. Wallace B.P., DiMatteo A.D., Hurley B.J., Finkbeiner E.M., Bolten A.B., et al. 2010. Regional Management Units for Marine Turtles: A Novel Framework for Prioritizing Conservation and Research across Multiple Scales. PLoS ONE 5(12): e15465. doi:10.1371/journal.pone.0015465 Witt, M.J., McGowan, A., Blumenthal, J.A., Broderick, A.C., Gore, S., Wheatley, D., White, J., and Godley, B.J. 2010. Inferring vertical and horizontal movements of juvenile marine turtles from time-depth recorders. Aquatic Biology 8:169-177. Yasuda, T. and Arai, N. 2009. Changes in flipper beat frequency, body angle and swimming 234 5375 5380 5385 5390 5395 5400 5405 5410 5415 470
  • 235.
    speed of femalegreen turtles Chelonia mydas. Marine Ecology Progress Series 386:275- 286. TABLES: 235 5420 5425 5430 5435 5440 5445 5450 5455 5460 5465
  • 236.
    Table 1. Feasibilityfor the spatial management of juvenile green sea turtle activities performed by the resident turtles at the Kawai’nui Marsh Estuary study site, based on three criteria: (i) the prevalence of the behavior, (ii) the magnitude of human-induced risk, and (iii) the degree to which these distributions can be mapped. Metrics are scores as: High (3), Medium (2) and Low (1). Risk BEHAVIOR Prevalence Boat Hook/Line Gillne t Risk Score Mapability Overall Score Foraging 0.40 1 1 1 3 2 5.40 Resting 0.27 1 0 0 1 2 3.27 Posing 0.09 1 1 0 2 3 5.09 Swimming 1.74 1 1 1 3 1 5.74 Hovering 0.41 1 1 1 3 1 4.41 Breathing 0.07 1 1 1 3 1 4.07 236 5470 5475 5480 5485
  • 237.
    Table 2. Feasibilityfor the spatial management of resident juvenile green sea turtle at the Kawai’nui Marsh Estuary study site by habitat, based on four criteria: (i) the number of turtles utilizing the habitat, (ii) the magnitude of human-induced risk, (iii) the number of behaviors which occur within each habitat, and (iv) the degree to which these habitats can be mapped. Metrics are scores as: High (3), Medium (2) and Low (1). Risk Behavioral Occurrence HABITAT # Turtles Boat Hook / Line Gillnet Risk Score Foraging Resting Posing Swimming Hovering Breathing Behavior Score Mapability Overall Score Cove 0.48 0 1 1 2 0.5 0 0 0.5 0.5 0.5 2 3 7.48 Channel / Ledge 1.21 1 1 0 2 0.5 0.5 0.5 0.5 0.5 0.5 3 3 9.21 Kailua Bay 0.91 1 1 1 3 0.5 0.5 0 0.5 0.5 0.5 2.5 2 8.41 237 5490 475
  • 238.
    FIGURES: Figure 1. Kerneldensities (100%, 99%, 95%, and 50%) of six behaviors mapped at 7,480 GPS points recorded every 15 seconds during 251 individual turtle behavior videos at the KME study site: A) Resting (n = 672); B) Foraging (n = 1000); C) Breathing (n = 176); D) Posing (n = 228); E) Swimming (n = 4334); F) Hovering (n = 1034). 238 5495 5500
  • 239.
    Figure 2. Thefive primary habitats of interest at the Kawai’nui Marsh Estuary study site. Video behavioral surveys occurred in the cove, channel, and Kailua Bay habitats. 239 5505 480