This document is a master's thesis report submitted by Ganesh Kumar Tirumalasetty to three universities in partial fulfillment of a master's degree in advanced materials science. The thesis investigates the mechanical characterization of hybrid biocomposites, with a focus on testing mollusc shells. Chapter 1 introduces biomimetics and the potential to develop new materials by understanding the mechanical properties of natural composites like mollusc shells. While previous studies examined shells using microindentation and nanoindentation in dry conditions, this study aims to characterize shells in wet conditions as well, and develop methods to test intricately shaped biological materials.


![38
Subscript for K1c denotes that the plane strain fracture toughness for mode I crack
displacement. Brittle materials, for which appreciable plastic deformation is not possible in
front of an advancing crack, have low K1c values and are vulnerable to catastrophic failure.
On the other hand, K1c values are relatively large for ductile materials. Fracture mechanics is
especially useful in predicting catastrophic failure in materials.
The compact tension (CT) and the three point loaded bend specimen have been
standardized by ASTM (Dieter, 1986). After the notch is machined in the specimen, the
sharpest possible crack is produced at the notch root by fatiguing the specimen in a low cycle
high strain mode. The initial crack length a includes both the depth of the notch and the length
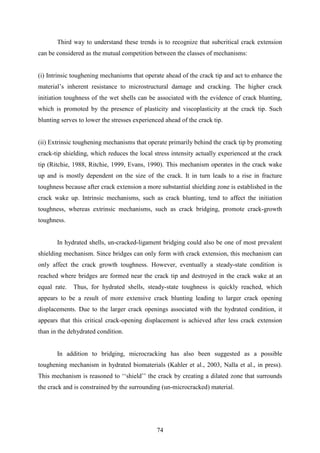
of the fatigue crack. Plain strain toughness test is generally carried out in a tensile testing
machine which provides a continous record of load P and relative displacement. A typical
load displacemnet curve for a brittle material is as shown in the figure 3.14 .The curve shows
a complete pop in instabilty where the initial crack movement continously propagates towards
failure.
Fig 3.14: Load displacement plot for a brittle material
The value of PQ determined from load displacement curve is used to calculate a conditional
value of fracture toughness denoted by KQ (Dieter, 1986).
KQ = (PQ S/BW3/2
) [ 2.9 (a/W)1/2
– 4.6(a/W)3/2
+ 21.8(a/W)5/2
– 37.6 (a/W)7/2
+ 38.7 (a/W)9/2
]](https://image.slidesharecdn.com/dff80ee5-ba31-4a1a-94dd-c7a881611830-160908134021/85/Master-Thesis_Ganesh-40-320.jpg)


![68
1 2 3
0.0
0.2
0.4
0.6
0.8
1.0
1.2
1.4
FractureToughness(MPa(m)
1/2
)
Sample position
Dry Condition
Wet Condition
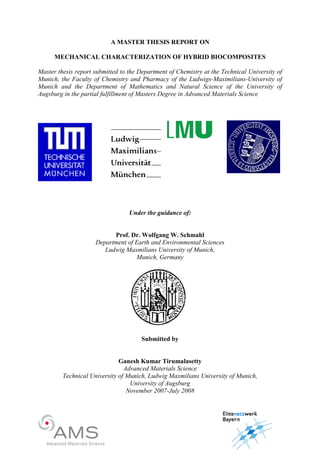
Table 2: Fracture toughness calculations for Elliptio crassidens in dry and wet conditions
The dehydrated specimen, however, showed lower fracture toughness 0.83 MPa√m as
compared to for the hydrated specimen 1.37 MPa√m. This difference is significant as the
conditional fracture toughness (Kq) in hydrated condition is almost twice compared to the
value in dry condition as shown below in the fig 4.30.
Fig 4.30: Calculated values of fracture toughness sample of Elliptio crassidens in wet
and dry condition
Name S (m) a (m) B (m) W (m) Pq (N) a/W
Elliptio (Dry) 0.0200 0.0016 0.00255 0.0051 69.69 0.628
Elliptio (Wet) 0.0200 0.0020 0.00250 0.00485 58.27 0.8
Name
[2.9 *(a/W)1/2
– 4.6*(a/W)3/2
+21.8*(a/W)5/2
–
37.6*(a/W)7/2
+ 38.7*(a/W)9/2
]
(Pq*S)/(B*W3/2
)
MPa√m
Kq
MPa√m
Elliptio (Dry) 4.20 0.199 0.83
Elliptio (Wet) 8.74 0.157 1.37
Name P0 (N) σ0 (MPa) 2.5*( Kq/σ0)2
Elliptio (Dry) 69.69 31.52 0.0017
Elliptio (Wet) 58.27 29.72 0.0053](https://image.slidesharecdn.com/dff80ee5-ba31-4a1a-94dd-c7a881611830-160908134021/85/Master-Thesis_Ganesh-70-320.jpg)