Download to read offline


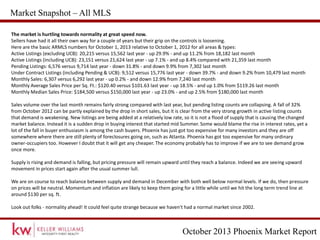
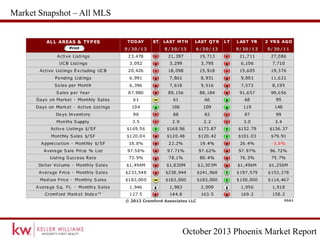
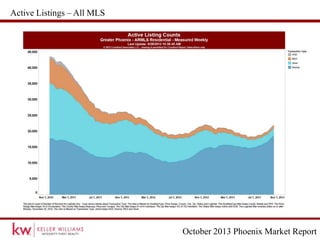
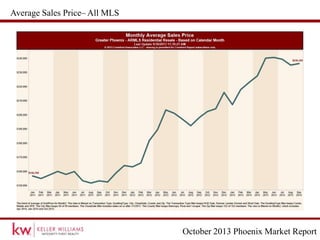
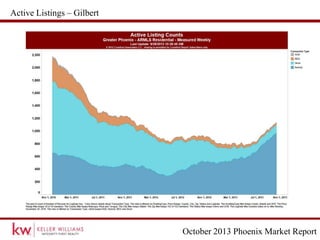
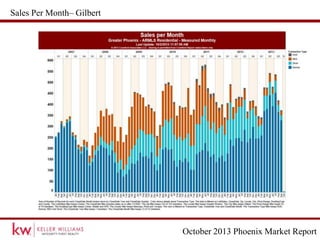
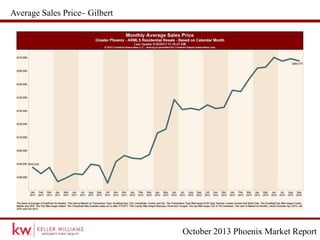
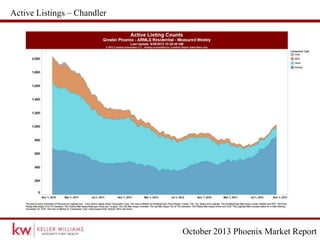
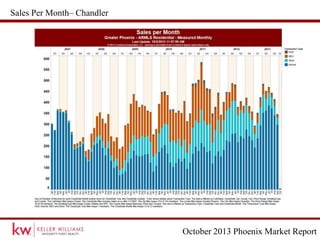


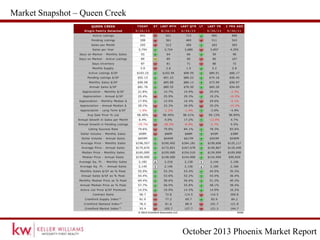
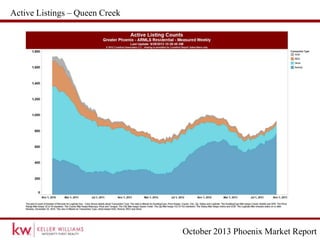
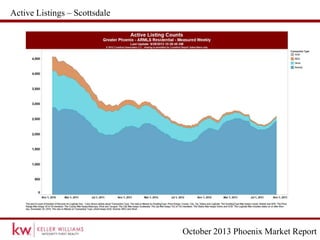
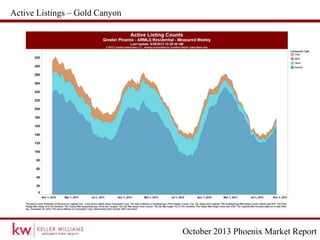

The real estate market in Phoenix is moving towards normality after years of sellers having an advantage. According to the October 2013 report, active listings are up 29.9% from the previous year while pending listings are down 31.8% and sales volume has remained steady. Demand appears to be weakening as new listings are added at a low rate rather than an influx of supply. Prices continue rising but the market is expected to reach a balanced state in December with supply and demand both below normal levels.


