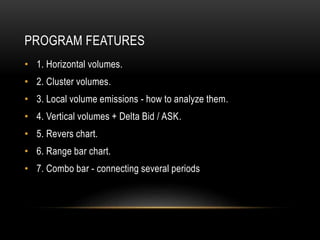
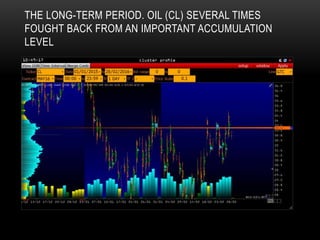
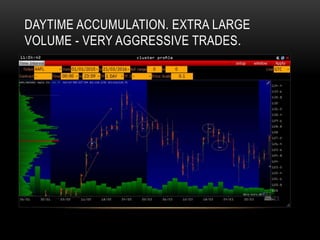
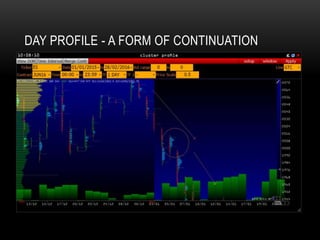
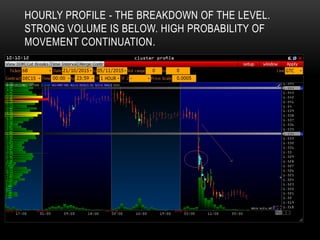
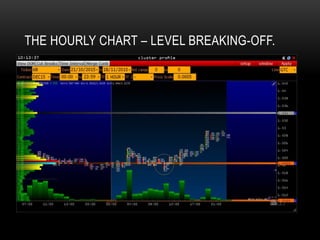
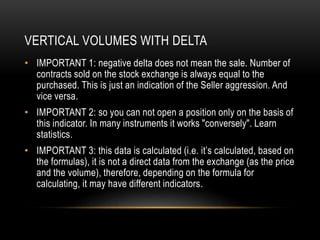
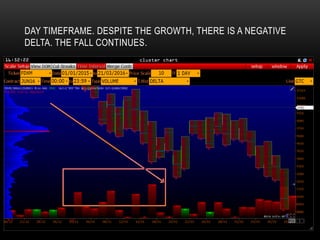
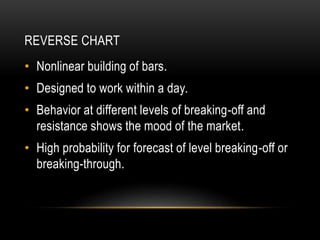
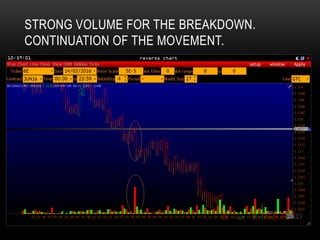
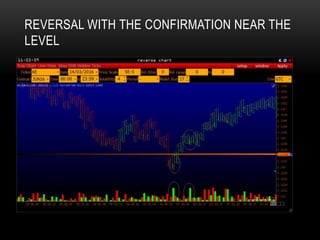
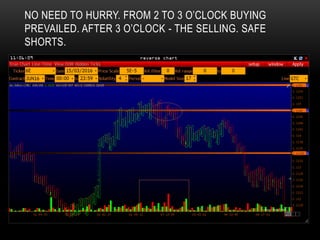
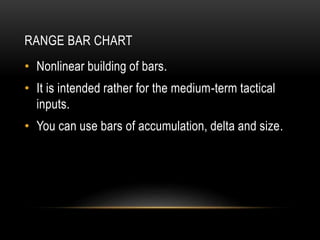
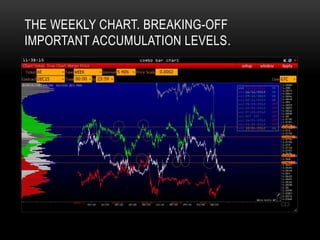
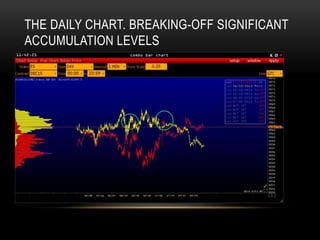
Different methods of analysis of
volumes
On the basis of the platform VOLFIX
VOLFIX
PROGRAM FEATURES
• 1. Horizontal volumes.
• 2. Cluster volumes.
• 3. Local volume emissions - how to analyze them.
• 4. Vertical volumes + Delta Bid / ASK.
• 5. Revers chart.
• 6. Range bar chart.
• 7. Combo bar - connecting several periods
HORIZONTAL VOLUMES
• Work on all the instruments, but have their own specifics.
They’re very important to determine the tactical inputs for the
mid-term trader. They are a good guide for the input and
output.
• Current volumes of accumulation, volumes of accumulation for
the previous period, as well as for the selected period may be
important.
THE LONG-TERM PERIOD. OIL (CL) SEVERAL TIMES
FOUGHT BACK FROM AN IMPORTANT ACCUMULATION
LEVEL
MEDIUM TERM (1 HOUR). BREAKING OFF IMPORTANT
LEVEL OF ACCUMULATION FOR THE BRITISH POUND, THE
HOURLY CHART.
SHORT-TERM (INTRADAY). BREAKING OFF THE LEVEL OF
DAILY SAVINGS. EURO / DOLLAR(6Е)
CLUSTER VOLUMES
• Have several important functions :
• Determine the places (levels) of active trading ranges.
• With high probability identify the level of breaking-thru or
breaking-off.
• Are the areas of support / resistance for the following
periods.
• Depending on the shape of the bar and accumulation,
provide other information on the probabilistic direction of
price movement.
VOLUMES ON THE DAILY TIMEFRAMES. THE SHAPE OF THE BAR
INDICATING THE POSSIBILITY OF REVERSAL
DAYTIME ACCUMULATION. EXTRA LARGE
VOLUME - VERY AGGRESSIVE TRADES.
DAY PROFILE - A FORM OF CONTINUATION
HOURLY PROFILE - THE BREAKDOWN OF THE LEVEL.
STRONG VOLUME IS BELOW. HIGH PROBABILITY OF
MOVEMENT CONTINUATION.
THE HOURLY CHART – LEVEL BREAKING-OFF.
15 MIN CHART– CRITICAL LEVEL BREAKING-OFF. LARGE
VOLUMES WERE FORMED OVER, BUT NOT UNDER THE
LEVEL
15 MIN CHART. BREAKDOWN OF IMPORTANT LEVEL.
VOLUMES WERE FORMED ABOVE THE LEVEL.
LOCAL INTRA-DAY VOLUMES
• Local volumes appear on the important support and
resistance levels.
• Depending on the location of volumes, it is possible to predict
a further break-off / breakdown of the level.
• The impact of force and rate of accumulation is important to
predict with high probability – whether it’s a break-off or a
breakdown of the level.
BREAKING-OFF WITH CONFIRMATION
BREAKING-OFFWITHOUT CONFIRMATION
LEVEL BREAKING-THROUGH WITH
CONFIRMATION
LEVEL TEST WITHOUT VOLUMES & LEVEL
BREAKING-THROUGH WITH VOLUMES
VERTICAL VOLUMES WITH DELTA
• IMPORTANT 1: negative delta does not mean the sale. Number of
contracts sold on the stock exchange is always equal to the
purchased. This is just an indication of the Seller aggression. And
vice versa.
• IMPORTANT 2: so you can not open a position only on the basis of
this indicator. In many instruments it works "conversely". Learn
statistics.
• IMPORTANT 3: this data is calculated (i.e. it’s calculated, based on
the formulas), it is not a direct data from the exchange (as the price
and the volume), therefore, depending on the formula for
calculating, it may have different indicators.
DAY TIMEFRAME. DESPITE THE GROWTH, THERE IS A NEGATIVE
DELTA. THE FALL CONTINUES.
ATTENUATION OF AGGRESSIVE PURCHASES AT
LOCAL LEVELS. IT MAY BE A REVERSAL.
IN SPITE OF THE STRONG DECREASE OF THE DAY, THERE’S A BIG
ENOUGH POSITIVE DELTA - HIGH PROBABILITY OF FURTHER
GROWTH IN THE NEXT DAY.
REVERSE CHART
• Nonlinear building of bars.
• Designed to work within a day.
• Behavior at different levels of breaking-off and
resistance shows the mood of the market.
• High probability for forecast of level breaking-off or
breaking-through.
STRONG VOLUME FOR THE BREAKDOWN.
CONTINUATION OF THE MOVEMENT.
REVERSAL WITH THE CONFIRMATION NEAR THE
LEVEL
NO NEED TO HURRY. FROM 2 TO 3 O’CLOCK BUYING
PREVAILED. AFTER 3 O’CLOCK - THE SELLING. SAFE
SHORTS.
RANGE BAR CHART
• Nonlinear building of bars.
• It is intended rather for the medium-term tactical
inputs.
• You can use bars of accumulation, delta and size.
WITH IDENTICAL BAR VOLUMES (EACH BAR IS FORMED AFTER ACCUMULATING
5,000 LOTS), IT’S CLEARLY SEEN, THAT THE REDUCTION BARS HAVE A
NEGATIVE DELTA MUCH STRONGER, THAN THE INCREASE BARS HAVE THE
POSITIVE ONE
EXAMPLE 2. ON THE CONTRARY. WITH A SET OF (50 000 LOTS),
INCREASING BARS HAVE SIGNIFICANTLY HIGHER POSITIVE
DELTA, THAN LOWERING BARS HAVE THE NEGATIVE ONE.
EVEN MORE CLEAR DEMONSTRATION, IF YOU RANK THE
PREVIOUS EXAMPLE BY DELTA (5000 LOTS)
COMBO BAR
• It allows you to connect the different periods of the
same instrument.
• At the same time you can see the accumulation
levels for each period.
• These levels may act as support and resistance in
the subsequent approach.
THE WEEKLY CHART. BREAKING-OFF
IMPORTANT ACCUMULATION LEVELS.
THE DAILY CHART. BREAKING-OFF SIGNIFICANT
ACCUMULATION LEVELS
CONSTRUCTING ARBITRAGE TRADES
• Arbitration intraday in the Tick chart module.
• Arbitrage more than one day in the Bar chart module.
ARBITRATION WITHIN A DAY(BRENT/CRUDE OIL)
WEEKLY ARBITRATION (FDAX/FESX)
• Join us on Facebook https://www.facebook.com/volfix-hub
• We work with a variety of strategies and tools.
• If you need settings - please write to starkoff@volfix.net

Market profile in commodities trading

  • 1.
    Different methods ofanalysis of volumes On the basis of the platform VOLFIX VOLFIX
  • 2.
    PROGRAM FEATURES • 1.Horizontal volumes. • 2. Cluster volumes. • 3. Local volume emissions - how to analyze them. • 4. Vertical volumes + Delta Bid / ASK. • 5. Revers chart. • 6. Range bar chart. • 7. Combo bar - connecting several periods
  • 3.
    HORIZONTAL VOLUMES • Workon all the instruments, but have their own specifics. They’re very important to determine the tactical inputs for the mid-term trader. They are a good guide for the input and output. • Current volumes of accumulation, volumes of accumulation for the previous period, as well as for the selected period may be important.
  • 4.
    THE LONG-TERM PERIOD.OIL (CL) SEVERAL TIMES FOUGHT BACK FROM AN IMPORTANT ACCUMULATION LEVEL
  • 5.
    MEDIUM TERM (1HOUR). BREAKING OFF IMPORTANT LEVEL OF ACCUMULATION FOR THE BRITISH POUND, THE HOURLY CHART.
  • 6.
    SHORT-TERM (INTRADAY). BREAKINGOFF THE LEVEL OF DAILY SAVINGS. EURO / DOLLAR(6Е)
  • 7.
    CLUSTER VOLUMES • Haveseveral important functions : • Determine the places (levels) of active trading ranges. • With high probability identify the level of breaking-thru or breaking-off. • Are the areas of support / resistance for the following periods. • Depending on the shape of the bar and accumulation, provide other information on the probabilistic direction of price movement.
  • 8.
    VOLUMES ON THEDAILY TIMEFRAMES. THE SHAPE OF THE BAR INDICATING THE POSSIBILITY OF REVERSAL
  • 9.
    DAYTIME ACCUMULATION. EXTRALARGE VOLUME - VERY AGGRESSIVE TRADES.
  • 10.
    DAY PROFILE -A FORM OF CONTINUATION
  • 11.
    HOURLY PROFILE -THE BREAKDOWN OF THE LEVEL. STRONG VOLUME IS BELOW. HIGH PROBABILITY OF MOVEMENT CONTINUATION.
  • 12.
    THE HOURLY CHART– LEVEL BREAKING-OFF.
  • 13.
    15 MIN CHART–CRITICAL LEVEL BREAKING-OFF. LARGE VOLUMES WERE FORMED OVER, BUT NOT UNDER THE LEVEL
  • 14.
    15 MIN CHART.BREAKDOWN OF IMPORTANT LEVEL. VOLUMES WERE FORMED ABOVE THE LEVEL.
  • 15.
    LOCAL INTRA-DAY VOLUMES •Local volumes appear on the important support and resistance levels. • Depending on the location of volumes, it is possible to predict a further break-off / breakdown of the level. • The impact of force and rate of accumulation is important to predict with high probability – whether it’s a break-off or a breakdown of the level.
  • 16.
  • 17.
  • 18.
  • 19.
    LEVEL TEST WITHOUTVOLUMES & LEVEL BREAKING-THROUGH WITH VOLUMES
  • 20.
    VERTICAL VOLUMES WITHDELTA • IMPORTANT 1: negative delta does not mean the sale. Number of contracts sold on the stock exchange is always equal to the purchased. This is just an indication of the Seller aggression. And vice versa. • IMPORTANT 2: so you can not open a position only on the basis of this indicator. In many instruments it works "conversely". Learn statistics. • IMPORTANT 3: this data is calculated (i.e. it’s calculated, based on the formulas), it is not a direct data from the exchange (as the price and the volume), therefore, depending on the formula for calculating, it may have different indicators.
  • 21.
    DAY TIMEFRAME. DESPITETHE GROWTH, THERE IS A NEGATIVE DELTA. THE FALL CONTINUES.
  • 22.
    ATTENUATION OF AGGRESSIVEPURCHASES AT LOCAL LEVELS. IT MAY BE A REVERSAL.
  • 23.
    IN SPITE OFTHE STRONG DECREASE OF THE DAY, THERE’S A BIG ENOUGH POSITIVE DELTA - HIGH PROBABILITY OF FURTHER GROWTH IN THE NEXT DAY.
  • 24.
    REVERSE CHART • Nonlinearbuilding of bars. • Designed to work within a day. • Behavior at different levels of breaking-off and resistance shows the mood of the market. • High probability for forecast of level breaking-off or breaking-through.
  • 25.
    STRONG VOLUME FORTHE BREAKDOWN. CONTINUATION OF THE MOVEMENT.
  • 26.
    REVERSAL WITH THECONFIRMATION NEAR THE LEVEL
  • 27.
    NO NEED TOHURRY. FROM 2 TO 3 O’CLOCK BUYING PREVAILED. AFTER 3 O’CLOCK - THE SELLING. SAFE SHORTS.
  • 28.
    RANGE BAR CHART •Nonlinear building of bars. • It is intended rather for the medium-term tactical inputs. • You can use bars of accumulation, delta and size.
  • 29.
    WITH IDENTICAL BARVOLUMES (EACH BAR IS FORMED AFTER ACCUMULATING 5,000 LOTS), IT’S CLEARLY SEEN, THAT THE REDUCTION BARS HAVE A NEGATIVE DELTA MUCH STRONGER, THAN THE INCREASE BARS HAVE THE POSITIVE ONE
  • 30.
    EXAMPLE 2. ONTHE CONTRARY. WITH A SET OF (50 000 LOTS), INCREASING BARS HAVE SIGNIFICANTLY HIGHER POSITIVE DELTA, THAN LOWERING BARS HAVE THE NEGATIVE ONE.
  • 31.
    EVEN MORE CLEARDEMONSTRATION, IF YOU RANK THE PREVIOUS EXAMPLE BY DELTA (5000 LOTS)
  • 32.
    COMBO BAR • Itallows you to connect the different periods of the same instrument. • At the same time you can see the accumulation levels for each period. • These levels may act as support and resistance in the subsequent approach.
  • 33.
    THE WEEKLY CHART.BREAKING-OFF IMPORTANT ACCUMULATION LEVELS.
  • 34.
    THE DAILY CHART.BREAKING-OFF SIGNIFICANT ACCUMULATION LEVELS
  • 35.
    CONSTRUCTING ARBITRAGE TRADES •Arbitration intraday in the Tick chart module. • Arbitrage more than one day in the Bar chart module.
  • 36.
    ARBITRATION WITHIN ADAY(BRENT/CRUDE OIL)
  • 37.
  • 38.
    • Join uson Facebook https://www.facebook.com/volfix-hub • We work with a variety of strategies and tools. • If you need settings - please write to starkoff@volfix.net