1. Malnutrition Documentation Improvement Project
Joyce Kutin RN, MSN, MOL Kenneth Nepple MD Mary Kay Brooks RN, MSN, CPHQ Doug Robertson RDN, LD Bridget Drapeaux MA, RDN, LD
Heidi Williams RN, BSN Lewis Thomas MD Sheala Mullaney Joan Dolezal RDN, LD Pamela Lynn RN Larry Newman DNP, ARNP Ericka Larson RN,BSN
Sherri Schomberg RN, BSN, ONC Kelly Petrulevich RN, BSN , OCN Michael Willey MD Dale Winnike RN, MSN, OCN Debra Herold RN, MSN, CCRN
University of Iowa Hospitals and Clinics Iowa City, Iowa
Multi-disciplinary Working Group Interventions
ResultsProblem
Inadequately documenting malnutrition underestimates inpatient
complexity , resulting in significant negative impact on risk-
adjustment of publicly reported data
Standardized Guideline
Malnutrition
Definition: American Society for Parenteral and Enteral Nutrition
(ASPEN) consensus evidence-based guidelines defines malnutrition as a
non-severe or severe condition based on the presence of:
Two or more of these six characteristics:
1. Insufficient energy intake
2. Weight loss
3. Loss of muscle mass
4. Loss of subcutaneous fat
5. Localized or generalized fluid accumulation that can mask
weight loss
6. Decreased functional status as measured by hand grip
strength device
In one of these three contexts:
1. Chronic illness: duration of 3 months or more (e.g.,
widespread metastatic cancer, severe malabsorption
syndromes, HIV, or chemotherapy.
2. Social/environmental circumstances: Severe
debilitation, the elderly living alone without social support,
or lack of care
3. Acute illness or injury: GI surgery, multisystem trauma,
intubation, prolonged vomiting, or limited oral food intake
When two or more criteria are present in any of the three contexts,
the patient is considered to have malnutrition.
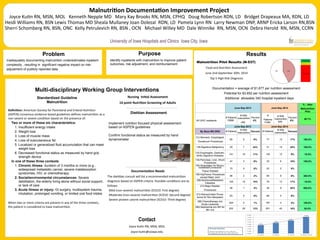
June-Sep 2013 June-Sep 2014
% ↑ after
Malnutrition
Pilot
All UIHC inpatients
# Patients
10868
# With
malnutrition
459
Percent
4%
#
Patients
11084
# With
malnutrition
646
Percent
6%
40.7%
June-Sep 2013 June-Sep 2014
By Base MS DRG # Patients
# With
malnutrition
Percent # Patients
# With
malnutrition
Percent
113-Stomach, Esophageal,
Duodenum Procedures
65 5 8% 77 13 17% 160.0%
126-Digestive Malignancy 29 7 24% 31 14 45% 100.0%
132-Esophagitis, Gastroen-
teritis Digestive Diseases
141 16 11% 145 13 9% -18.8%
134-Pancreas, Liver, Shunt
Procedures
47 3 6% 33 6 18% 100.0%
154-Amputation for Muscu-
loskeletal/Connective
Tissue Disease
15 0 0% 22 2 9%
156-Hip/Femur Procedures
except Major Joint
96 2 2% 85 8 9% 300.0%
206-Nutritional/Metabolic
Diseases
105 16 15% 76 13 17% -18.8%
210-Major Bladder
Procedures
26 1 4% 36 9 25% 800.0%
212-Kidney/Ureter Proce-
dures for Non-Neoplasm
93 0 0% 88 5 6%
285-Chemotherapy w/o
Acute Leukemia
204 2 1% 167 4 2% 100.0%
294-Septicemia w/o MV for
96+ hrs
222 28 13% 261 42 16% 50.0%
Purpose
Identify inpatients with malnutrition to improve patient
outcomes, risk adjustment, and reimbursement
Contact
Joyce Kutin RN, MSN, MOL
Joyce-kutin@uiowa.edu
Nursing Initial Assessment
16 point Nutrition Screening of Adults
Dietitian Assessment
Implement nutrition focused physical assessment
based on ASPEN guidelines
Confirm functional status as measured by hand
dynamometer
Documentation Needs
The dietitian consult will list a recommended malnutrition
diagnosis based on ASPEN criteria. Possible conditions are as
follows:
Mild (non-severe) malnutrition (ICD10: First degree)
Moderate (non-severe) malnutrition (ICD10: Second degree)
Severe protein calorie malnutrition (ICD10: Third degree)
Malnutrition Pilot Results (N-537)
Food and Nutrition Assessment
June 2nd-September 30th, 2014
Top 5 High Risk Diagnosis
Documentation = average of $1,877 per nutrition assessment
Potential for $3,652 per nutrition assessment
Additional allowable 340 hospital inpatient days
3.6%
4.6%
5.6%
7.2%
0.0%
1.0%
2.0%
3.0%
4.0%
5.0%
6.0%
7.0%
8.0%
FY 2012 FY 2013 FY 2014 FY 2015 (YTD)