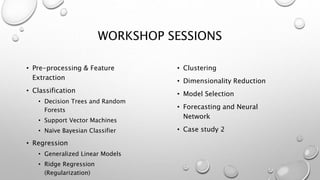
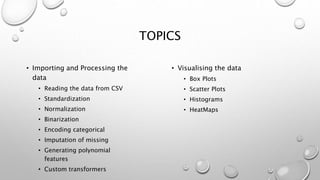
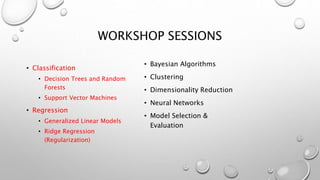
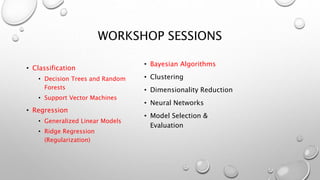
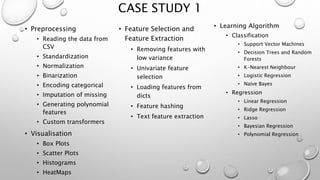
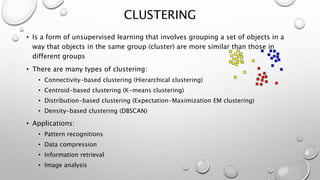
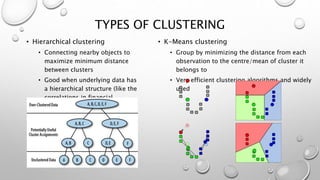
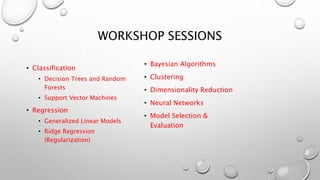
MACHINE LEARNING
ALGORITHMS
OSMAN RAMADAN
WORKSHOP SESSIONS
• Pre-processing & Feature
Extraction
• Classification
• Decision Trees and Random
Forests
• Support Vector Machines
• Naïve Bayesian Classifier
• Regression
• Generalized Linear Models
• Ridge Regression
(Regularization)
• Clustering
• Dimensionality Reduction
• Model Selection
• Forecasting and Neural
Network
• Case study 2
TODAY’S SESSION
PRE-PROCESSING
• INTRODUCTION
• APPLICATION
• EXAMPLES
• EXERCISE
TOPICS
• Importing and Processing the
data
• Reading the data from CSV
• Standardization
• Normalization
• Binarization
• Encoding categorical
• Imputation of missing
• Generating polynomial
features
• Custom transformers
• Visualising the data
• Box Plots
• Scatter Plots
• Histograms
• HeatMaps
TODAY’S SESSION
FEATURE EXTRACTION
• INTRODUCTION
• APPLICATION
• EXAMPLES
• EXERCISE
TOPICS
• Feature Selection
• Removing features with low
variance
• Univariate feature selection
• Feature Extraction
• Loading features from dicts
• Feature hashing
• Text feature extraction
• Image feature extraction
TODAY’S SESSION
CLASSIFICATION
• INTRODUCTION
• APPLICATION
• EXAMPLES
• EXERCISE
CLASSIFICATION
• Outputs are discrete
classes/categories
• Applications in
• Spam classifier
• Image recognition
• Speech recognition
• Pattern recognition
• Document classification
TOPICS
• Decision Trees and Random Forests
• Support Vector Machines
DECISION TREES
• Classification models in the form of a
tree structure
• Progressively splits the training set into
smaller subsets
• Each split in the data is made in order
to minimise a misclassification metric
(information gain, variance reduction)
• Characterised by the number of splits
or depth
RANDOM FORESTS
• Ensemble learning (or modelling) involves the combination of several diverse models
to solve a single prediction problem
• It works by generating multiple models, which learn and make predictions
independently
• The random forests model is an ensemble method since it aggregates a group of
decision trees into an ensemble
• Random Forests use averaging to find a natural balance between high variance and
high bias
• Once many models are generated, their predictions can be combined into a single
(mega) prediction using majority vote or averaging that should be better, on average,
than the prediction made by the single models.
SUPPORT VECTOR MACHINES
• SVM classifier attempts to construct a boundary that
separates the instances of different classes as
accurately as possible
• There are multiple possible linear separators that
can accurately separate the instances of the two
classes
• The core concept behind the success and the
powerful nature of Support Vector Machines is that
of margin maximisation
• SVM classifier is entirely determined by a (usually
fairly small) subset of the training instances - known
• The input space in this case cannot be separated well
by a linear classifier
• The data are mapped from the input space XX into a
transformed feature space HH, where linear separation
is potentially feasible using a non-linear function ϕ
• The most commonly applied kernels are:
• Gaussian Radial Basis Function (RBF)
• Polynomial
• Sigmoid
NON-LINEAR SVM
WORKSHOP SESSIONS
• Classification
• Decision Trees and Random
Forests
• Support Vector Machines
• Regression
• Generalized Linear Models
• Ridge Regression
(Regularization)
• Bayesian Algorithms
• Clustering
• Dimensionality Reduction
• Neural Networks
REGRESSION
• Data is labelled with a real value (think floating point) rather
then a label
• Regression models predict a value of the Y variable given
known values of the X variables
• Applications:
• Price of a stock over time
• Temperature predictions
• Marketing
• Population and growth
LINEAR REGRESSION
(ORDINARY LEAST SQUARES)
• The target value is expected to be a linear combination of the
input variable
• if is the predicted value then
• The aim to find the coefficients that minimize the residual sum
of squares between the observed responses and that predicted
by linear approximation
• Linear regression can be extended by constructing polynomial
features from the coefficients
• This is still a linear model, imagine creating a new variable
RIDGE REGRESSION
• Ridge regression addresses some of the problems of Ordinary Least Squares by
imposing a penalty on the size of coefficients to minimize the variance
• The ridge coefficients minimize a penalized residual sum of squares
• α ≥ 0 is the complexity parameter that controls the amount of shrinkage: the
larger the value of α, the greater the amount of shrinkage and thus the
coefficients become more robust to collinearity
WORKSHOP SESSIONS
• Classification
• Decision Trees and Random
Forests
• Support Vector Machines
• Regression
• Generalized Linear Models
• Ridge Regression
(Regularization)
• Bayesian Algorithms
• Clustering
• Dimensionality Reduction
• Neural Networks
• Model Selection &
Evaluation
BAYESIAN ALGORITHMS
• Set of supervised learning algorithms based on applying Bayes’ theorem with the
“naïve” assumption of independence between features
• The classification rule is
• They are very good for document classification and spam filtering
• They require a small amount of training data to estimate the necessary parameters
• They can be extremely fast compared to more sophisticated methods
• Major drawback, they are known to be bad estimators
• The different naive Bayes classifiers differ mainly in the distribution of
• Gaussian Naïve Bayes
• Multinomial Naïve Bayes
• Bernoulli Naïve Bayes
WORKSHOP SESSIONS
• Classification
• Decision Trees and Random
Forests
• Support Vector Machines
• Regression
• Generalized Linear Models
• Ridge Regression
(Regularization)
• Bayesian Algorithms
• Clustering
• Dimensionality Reduction
• Neural Networks
• Model Selection &
Evaluation
CASE STUDY 1
• Preprocessing
• Reading the data from
CSV
• Standardization
• Normalization
• Binarization
• Encoding categorical
• Imputation of missing
• Generating polynomial
features
• Custom transformers
• Visualisation
• Box Plots
• Scatter Plots
• Histograms
• HeatMaps
• Feature Selection and
Feature Extraction
• Removing features with
low variance
• Univariate feature
selection
• Loading features from
dicts
• Feature hashing
• Text feature extraction
• Learning Algorithm
• Classification
• Support Vector Machines
• Decision Trees and Random
Forests
• K-Nearest Neighbour
• Logistic Regression
• Naïve Bayes
• Regression
• Linear Regression
• Ridge Regression
• Lasso
• Bayesian Regression
• Polynomial Regression
CLUSTERING
• Is a form of unsupervised learning that involves grouping a set of objects in a
way that objects in the same group (cluster) are more similar than those in
different groups
• There are many types of clustering:
• Connectivity-based clustering (Hierarchical clustering)
• Centroid-based clustering (K-means clustering)
• Distribution-based clustering (Expectation-Maximization EM clustering)
• Density-based clustering (DBSCAN)
• Applications:
• Pattern recognitions
• Data compression
• Information retrieval
• Image analysis
TYPES OF CLUSTERING
• Hierarchical clustering
• Connecting nearby objects to
maximize minimum distance
between clusters
• Good when underlying data has
a hierarchical structure (like the
correlations in financial
markets)
• K-Means clustering
• Group by minimizing the distance from each
observation to the centre/mean of cluster it
belongs to
• Very efficient clustering algorithms and widely
used
TYPES OF CLUSTERING
• Expectation-Maximization (EM)
clustering
• Based on distribution models by
finding the maximum likelihood
parameters of the model
• Used in portfolio management and
risk modelling
• Density-based clustering (DBSCAN)
• Group together points that are closely packed
together and mark low-density regions as
outliers
• No need to specify the number of clusters
• Robust to outliers/noise
• Can handle clusters of different shapes and sizes
WORKSHOP SESSIONS
• Classification
• Decision Trees and Random
Forests
• Support Vector Machines
• Regression
• Generalized Linear Models
• Ridge Regression
(Regularization)
• Bayesian Algorithms
• Clustering
• Dimensionality Reduction
• Neural Networks
• Model Selection &
Evaluation
DIMENSIONALITY REDUCTION
• Reduce the number of features either by finding a subset of the original
variables (Feature Selection) or by transforming the data to a space of fewer
dimensions (Feature Extraction)
• Principal Component Analysis (PCA) is a statistical procedure to transform the
data to a space of fewer dimensions that allow more variation (less correlation)
WORKSHOP SESSIONS
• Classification
• Decision Trees and Random
Forests
• Support Vector Machines
• Regression
• Generalized Linear Models
• Ridge Regression
(Regularization)
• Bayesian Algorithms
• Clustering
• Dimensionality Reduction
• Neural Networks
• Model Selection &
Evaluation
NEURAL NETWORKS
• Machine learning models that are inspired by the structure and/or function of
biological neural networks
• They are a class of pattern matching that are commonly used for regression and
classification
WORKSHOP SESSIONS
• Classification
• Decision Trees and Random
Forests
• Support Vector Machines
• Regression
• Generalized Linear Models
• Ridge Regression
(Regularization)
• Bayesian Algorithms
• Clustering
• Dimensionality Reduction
• Neural Networks
• Model Selection &
Evaluation
TODAY’S SESSION
• Pipeline: chaining estimators
• Pipelines
• FeatureUnion
• Model Selection and Evaluation
• Cross-validation: evaluating
estimator performance
• Tuning the hyper-parameters of an
estimator
• Model evaluation: quantifying the
quality of predictions
• Model Persistence
• Validation curves: plotting scores
to evaluate models
WORKSHOP SESSIONS
• Classification
• Decision Trees and Random
Forests
• Support Vector Machines
• Regression
• Generalized Linear Models
• Ridge Regression
(Regularization)
• Bayesian Algorithms
• Clustering
• Dimensionality Reduction
• Neural Networks
• Model Selection &
Evaluation

Machine Learning Workshop

  • 1.
  • 2.
    WORKSHOP SESSIONS • Pre-processing& Feature Extraction • Classification • Decision Trees and Random Forests • Support Vector Machines • Naïve Bayesian Classifier • Regression • Generalized Linear Models • Ridge Regression (Regularization) • Clustering • Dimensionality Reduction • Model Selection • Forecasting and Neural Network • Case study 2
  • 3.
    TODAY’S SESSION PRE-PROCESSING • INTRODUCTION •APPLICATION • EXAMPLES • EXERCISE
  • 4.
    TOPICS • Importing andProcessing the data • Reading the data from CSV • Standardization • Normalization • Binarization • Encoding categorical • Imputation of missing • Generating polynomial features • Custom transformers • Visualising the data • Box Plots • Scatter Plots • Histograms • HeatMaps
  • 5.
    TODAY’S SESSION FEATURE EXTRACTION •INTRODUCTION • APPLICATION • EXAMPLES • EXERCISE
  • 6.
    TOPICS • Feature Selection •Removing features with low variance • Univariate feature selection • Feature Extraction • Loading features from dicts • Feature hashing • Text feature extraction • Image feature extraction
  • 7.
    TODAY’S SESSION CLASSIFICATION • INTRODUCTION •APPLICATION • EXAMPLES • EXERCISE
  • 8.
    CLASSIFICATION • Outputs arediscrete classes/categories • Applications in • Spam classifier • Image recognition • Speech recognition • Pattern recognition • Document classification
  • 9.
    TOPICS • Decision Treesand Random Forests • Support Vector Machines
  • 10.
    DECISION TREES • Classificationmodels in the form of a tree structure • Progressively splits the training set into smaller subsets • Each split in the data is made in order to minimise a misclassification metric (information gain, variance reduction) • Characterised by the number of splits or depth
  • 11.
    RANDOM FORESTS • Ensemblelearning (or modelling) involves the combination of several diverse models to solve a single prediction problem • It works by generating multiple models, which learn and make predictions independently • The random forests model is an ensemble method since it aggregates a group of decision trees into an ensemble • Random Forests use averaging to find a natural balance between high variance and high bias • Once many models are generated, their predictions can be combined into a single (mega) prediction using majority vote or averaging that should be better, on average, than the prediction made by the single models.
  • 12.
    SUPPORT VECTOR MACHINES •SVM classifier attempts to construct a boundary that separates the instances of different classes as accurately as possible • There are multiple possible linear separators that can accurately separate the instances of the two classes • The core concept behind the success and the powerful nature of Support Vector Machines is that of margin maximisation • SVM classifier is entirely determined by a (usually fairly small) subset of the training instances - known
  • 13.
    • The inputspace in this case cannot be separated well by a linear classifier • The data are mapped from the input space XX into a transformed feature space HH, where linear separation is potentially feasible using a non-linear function ϕ • The most commonly applied kernels are: • Gaussian Radial Basis Function (RBF) • Polynomial • Sigmoid NON-LINEAR SVM
  • 14.
    WORKSHOP SESSIONS • Classification •Decision Trees and Random Forests • Support Vector Machines • Regression • Generalized Linear Models • Ridge Regression (Regularization) • Bayesian Algorithms • Clustering • Dimensionality Reduction • Neural Networks
  • 15.
    REGRESSION • Data islabelled with a real value (think floating point) rather then a label • Regression models predict a value of the Y variable given known values of the X variables • Applications: • Price of a stock over time • Temperature predictions • Marketing • Population and growth
  • 16.
    LINEAR REGRESSION (ORDINARY LEASTSQUARES) • The target value is expected to be a linear combination of the input variable • if is the predicted value then • The aim to find the coefficients that minimize the residual sum of squares between the observed responses and that predicted by linear approximation • Linear regression can be extended by constructing polynomial features from the coefficients • This is still a linear model, imagine creating a new variable
  • 17.
    RIDGE REGRESSION • Ridgeregression addresses some of the problems of Ordinary Least Squares by imposing a penalty on the size of coefficients to minimize the variance • The ridge coefficients minimize a penalized residual sum of squares • α ≥ 0 is the complexity parameter that controls the amount of shrinkage: the larger the value of α, the greater the amount of shrinkage and thus the coefficients become more robust to collinearity
  • 18.
    WORKSHOP SESSIONS • Classification •Decision Trees and Random Forests • Support Vector Machines • Regression • Generalized Linear Models • Ridge Regression (Regularization) • Bayesian Algorithms • Clustering • Dimensionality Reduction • Neural Networks • Model Selection & Evaluation
  • 19.
    BAYESIAN ALGORITHMS • Setof supervised learning algorithms based on applying Bayes’ theorem with the “naïve” assumption of independence between features • The classification rule is • They are very good for document classification and spam filtering • They require a small amount of training data to estimate the necessary parameters • They can be extremely fast compared to more sophisticated methods • Major drawback, they are known to be bad estimators • The different naive Bayes classifiers differ mainly in the distribution of • Gaussian Naïve Bayes • Multinomial Naïve Bayes • Bernoulli Naïve Bayes
  • 20.
    WORKSHOP SESSIONS • Classification •Decision Trees and Random Forests • Support Vector Machines • Regression • Generalized Linear Models • Ridge Regression (Regularization) • Bayesian Algorithms • Clustering • Dimensionality Reduction • Neural Networks • Model Selection & Evaluation
  • 21.
    CASE STUDY 1 •Preprocessing • Reading the data from CSV • Standardization • Normalization • Binarization • Encoding categorical • Imputation of missing • Generating polynomial features • Custom transformers • Visualisation • Box Plots • Scatter Plots • Histograms • HeatMaps • Feature Selection and Feature Extraction • Removing features with low variance • Univariate feature selection • Loading features from dicts • Feature hashing • Text feature extraction • Learning Algorithm • Classification • Support Vector Machines • Decision Trees and Random Forests • K-Nearest Neighbour • Logistic Regression • Naïve Bayes • Regression • Linear Regression • Ridge Regression • Lasso • Bayesian Regression • Polynomial Regression
  • 22.
    CLUSTERING • Is aform of unsupervised learning that involves grouping a set of objects in a way that objects in the same group (cluster) are more similar than those in different groups • There are many types of clustering: • Connectivity-based clustering (Hierarchical clustering) • Centroid-based clustering (K-means clustering) • Distribution-based clustering (Expectation-Maximization EM clustering) • Density-based clustering (DBSCAN) • Applications: • Pattern recognitions • Data compression • Information retrieval • Image analysis
  • 23.
    TYPES OF CLUSTERING •Hierarchical clustering • Connecting nearby objects to maximize minimum distance between clusters • Good when underlying data has a hierarchical structure (like the correlations in financial markets) • K-Means clustering • Group by minimizing the distance from each observation to the centre/mean of cluster it belongs to • Very efficient clustering algorithms and widely used
  • 24.
    TYPES OF CLUSTERING •Expectation-Maximization (EM) clustering • Based on distribution models by finding the maximum likelihood parameters of the model • Used in portfolio management and risk modelling • Density-based clustering (DBSCAN) • Group together points that are closely packed together and mark low-density regions as outliers • No need to specify the number of clusters • Robust to outliers/noise • Can handle clusters of different shapes and sizes
  • 25.
    WORKSHOP SESSIONS • Classification •Decision Trees and Random Forests • Support Vector Machines • Regression • Generalized Linear Models • Ridge Regression (Regularization) • Bayesian Algorithms • Clustering • Dimensionality Reduction • Neural Networks • Model Selection & Evaluation
  • 26.
    DIMENSIONALITY REDUCTION • Reducethe number of features either by finding a subset of the original variables (Feature Selection) or by transforming the data to a space of fewer dimensions (Feature Extraction) • Principal Component Analysis (PCA) is a statistical procedure to transform the data to a space of fewer dimensions that allow more variation (less correlation)
  • 27.
    WORKSHOP SESSIONS • Classification •Decision Trees and Random Forests • Support Vector Machines • Regression • Generalized Linear Models • Ridge Regression (Regularization) • Bayesian Algorithms • Clustering • Dimensionality Reduction • Neural Networks • Model Selection & Evaluation
  • 28.
    NEURAL NETWORKS • Machinelearning models that are inspired by the structure and/or function of biological neural networks • They are a class of pattern matching that are commonly used for regression and classification
  • 29.
    WORKSHOP SESSIONS • Classification •Decision Trees and Random Forests • Support Vector Machines • Regression • Generalized Linear Models • Ridge Regression (Regularization) • Bayesian Algorithms • Clustering • Dimensionality Reduction • Neural Networks • Model Selection & Evaluation
  • 30.
    TODAY’S SESSION • Pipeline:chaining estimators • Pipelines • FeatureUnion • Model Selection and Evaluation • Cross-validation: evaluating estimator performance • Tuning the hyper-parameters of an estimator • Model evaluation: quantifying the quality of predictions • Model Persistence • Validation curves: plotting scores to evaluate models
  • 31.
    WORKSHOP SESSIONS • Classification •Decision Trees and Random Forests • Support Vector Machines • Regression • Generalized Linear Models • Ridge Regression (Regularization) • Bayesian Algorithms • Clustering • Dimensionality Reduction • Neural Networks • Model Selection & Evaluation