Download to read offline


![5
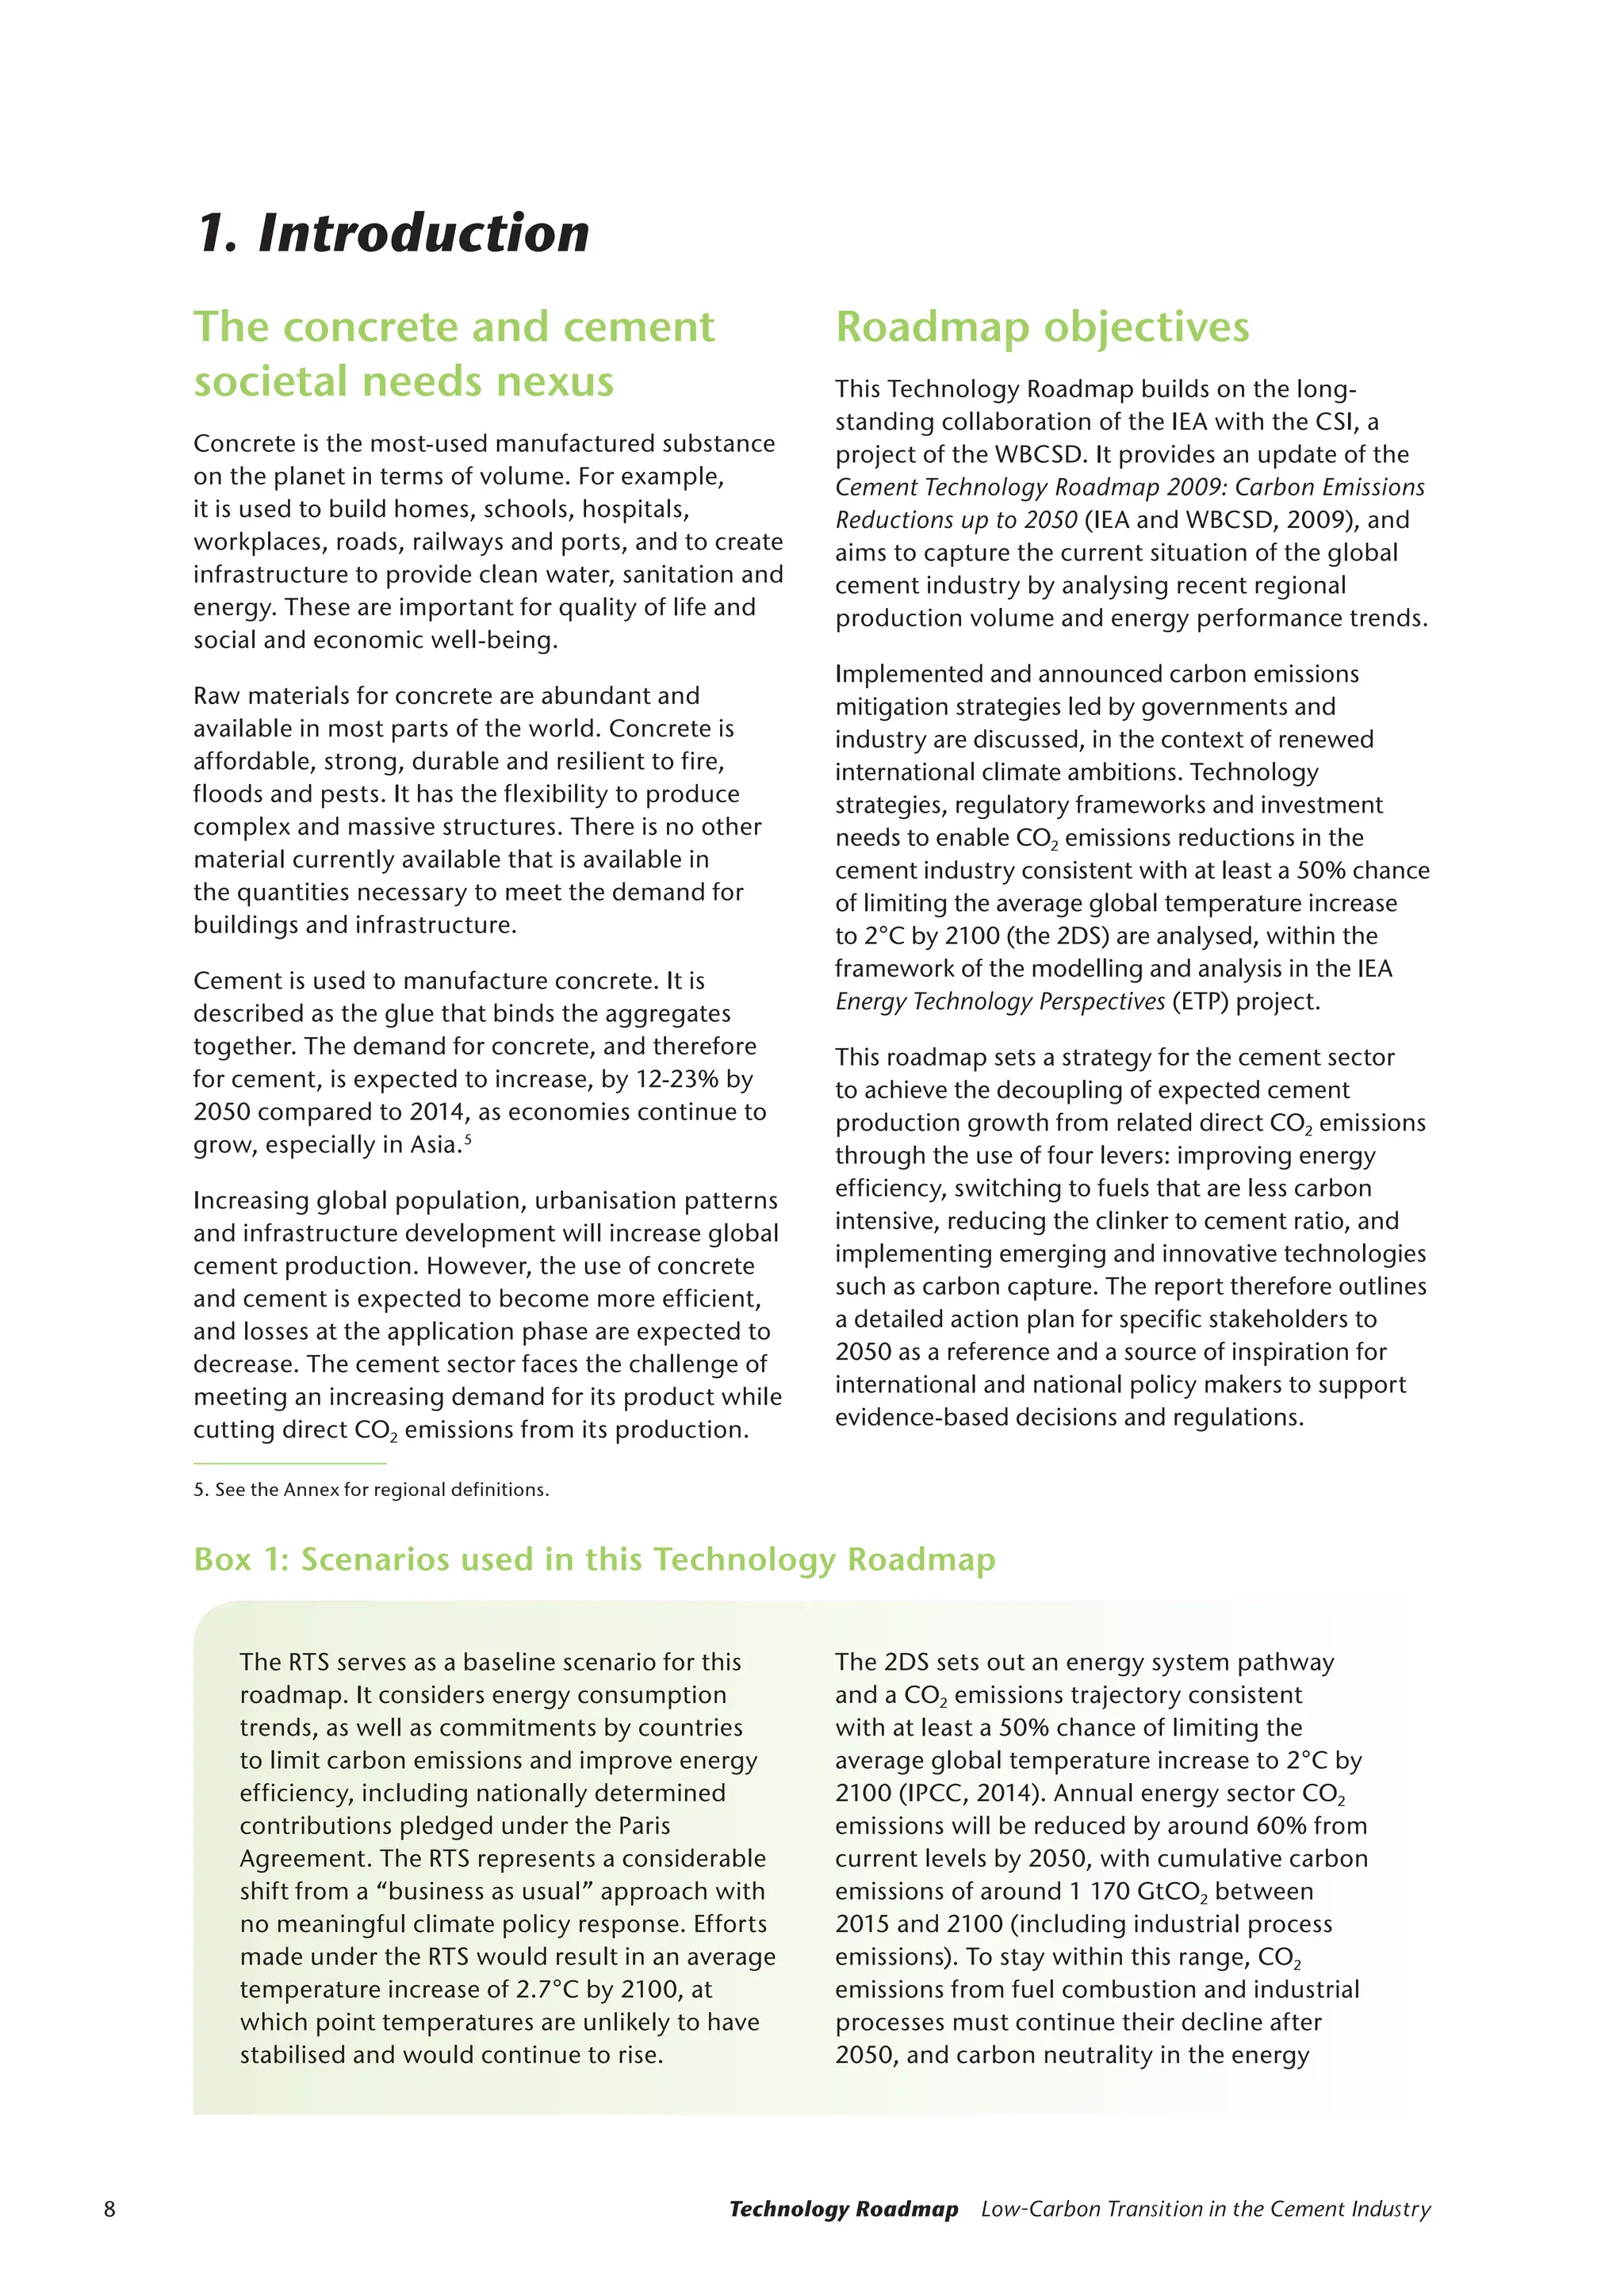
Cement is used to make concrete, the most consumed
manufactured substance on the planet. Concrete
builds homes, schools, hospitals, workplaces,
transport systems and infrastructure for clean water,
sanitation and energy, which are important for quality
of life and social and economic wellbeing.
The cement sector is the third-largest industrial
energy consumer, comprising 7% of the global
industrial energy use (10.7 exajoules [EJ]). Cement
production involves the decomposition of limestone
(calcium carbonate), which represents about
two-thirds of the total CO2 emissions generated in
the process, with the remainder of CO2 emissions
being due to combustion of fuels. Thus despite
considerable progress on energy efficiency, the
use of alternative fuels and clinker replacements,
the sector has the second-largest share of total
direct1
industrial carbon dioxide (CO2) emissions,
at 27% (2.2 gigatonnes of carbon dioxide per year
[GtCO2/
yr]) in 2014.
Rising global population and urbanisation patterns,
coupled with infrastructure development needs,
drive up the demand for cement and concrete.
Global cement production is set to grow by 12‑23%
by 2050 from the current level. Some regions, such
as People’s Republic of China and the Middle East,
have excess cement production capacity, with
cement production per capita levels well above the
global average. Other regions, such as India and
Africa, are set to increase their domestic cement
production capacity to fulfil their infrastructure
development needs.
Direct CO2 emissions from the cement industry
are expected to increase by 4% globally under
the International Energy Agency (IEA) Reference
Technology Scenario (RTS2
) by 2050 despite an
increase of 12% in global cement production in the
same period.
Realising the sustainable transition of the 2 degree
Celsius (°C) Scenario (2DS) implies a significant
reduction of the global direct CO2 emissions from
cement manufacture by 24% compared to current
levels by 2050 still with the expected increase
in global cement production. This represents
cumulative emissions reductions of 7.7 GtCO2
compared to the RTS by 2050, reaching 1.7 GtCO2,
equivalent to around 90% of current total global
industrial direct CO2 emissions. Implementing
this vision requires accelerated development and
deployment of CO2 emissions reduction levers,
supportive policy, public-private collaboration,
financing mechanisms and social acceptance.
1.
Direct CO2 emissions refer to emissions that are generated and
released in the cement production process.
2.
Please refer to Box 1 below for details on scenarios.
Key findings
Improving energy efficiency, switching to alternative
fuels (fuels that are less carbon intensive), reducing
the clinker to cement ratio and integrating carbon
capture into cement production are the main
carbon mitigation levers supporting the sustainable
transition of the cement sector. The integration
of emerging and innovative technologies like
carbon capture and reducing of the clinker content
in cement are identified to provide the largest
cumulative CO2 emissions reductions in the 2DS
compared to the RTS by 2050, with 48% and 37%
contributions, respectively. The remainder of the
reduction arises from switching to lower-carbon fuels
and, to a lesser extent, energy efficiency.
Alternative binding materials in principle offer
opportunities for carbon emissions reductions but
considerable further analysis is required to produce
robust, independent and publicly available life-
cycle assessment of these materials, including a
comparative quantification of the production costs
and their long-term performance. Further process
optimisation at the demonstration phase and
product standardisation could open more avenues
for commercial deployment.
Adopting a whole life-cycle approach and working
collaboratively along the whole construction
value chain offers additional opportunities for
carbon emissions reductions beyond the cement
manufacturing boundary. Optimising the use
of concrete in construction by reducing waste,
encouraging reuse and recycling, maximising design
life and using concrete’s properties to minimise
operational energy of the built environment, are key
strategies in this area.
Realising the RTS would incur cumulative
additional investments of United States dollars
(USD)3
107 billion to USD 127 billion by 2050
compared to a situation where the current energy
and carbon emissions footprint of cement making
remain unchanged. This effort is equivalent
to 24‑28% of the total cumulative investment
estimated to sustain global cement production over
that period at current performance levels. Between
USD 176 billion and USD 244 billion of additional
global investments are estimated as necessary to
implement the 2DS cumulatively by 2050 compared
to the RTS. This represents 32‑43% of the total
cumulative investment estimated to realise the RTS.
Governments, in collaboration with industry, can
play a determinant role in developing investment
risk-mitigating mechanisms that unlock private
finance in areas with low likelihood of independent
investment but important in the sustainable
transition of society.
3.
Investment figures are based on 2015 USD.
Key findings](https://image.slidesharecdn.com/low-carbon-transition-in-the-cement-industrycompress-251128094943-ddbcb7f9/75/low-carbon-transition-in-the-cement-industry_compress-pdf-Cement-is-used-to-make-concrete-the-most-consumed-manufactured-substance-on-the-planet-7-2048.jpg)

![7
Key actions to 2030
Table 1: Key indicators for the global cement industry in the 2DS by 2030
Notes: Thermal energy intensity of clinker does not include any impact related to other carbon mitigation levers beyond improving
energy efficiency (e.g. carbon capture). Electricity intensity of cement production does not include reduction in purchased electricity
demand from the use of EHR equipment or any impact related to other carbon mitigation levers beyond improving energy efficiency
(e.g. carbon capture). Alternative fuel use includes biomass, and biogenic and non-biogenic wastes. Direct CO2 intensity refers to gross
direct CO2 emissions, after carbon capture.
2DS low-variability case
2014 2030
Clinker to cement ratio 0.65 0.64
Thermal energy intensity of clinker (gigajoule
per tonne of clinker [GJ/t clinker])
3.5 3.3
Electricity intensity of cement (kilowatt hour
per tonne of cement [kWh/t cement])
91 87
Alternative fuel use (percentage of thermal energy) 5.6 17.5
CO2 captured and stored (million tonne of
carbon dioxide per year [MtCO2/yr])
- 14
Direct CO2 intensity of cement (tonne of carbon dioxide
per tonne of cement [tCO2/t cement])
0.54 0.52](https://image.slidesharecdn.com/low-carbon-transition-in-the-cement-industrycompress-251128094943-ddbcb7f9/75/low-carbon-transition-in-the-cement-industry_compress-pdf-Cement-is-used-to-make-concrete-the-most-consumed-manufactured-substance-on-the-planet-9-2048.jpg)


Cement is used to make concrete, the most consumed manufactured substance on the planet. Concrete builds homes, schools, hospitals, workplaces, transport systems and infrastructure for clean water, sanitation and energy, which are important for quality of life and social and economic wellbeing.


