Download to read offline


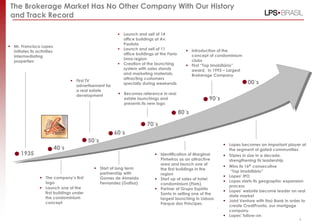
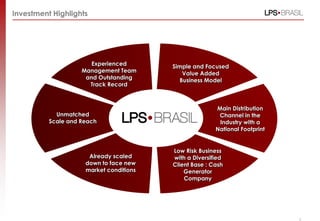
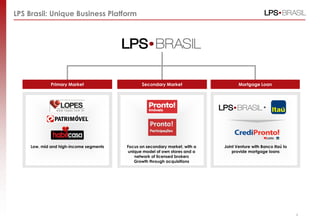
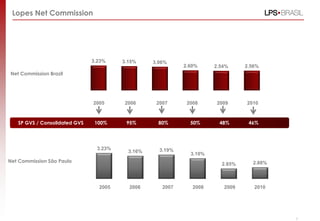


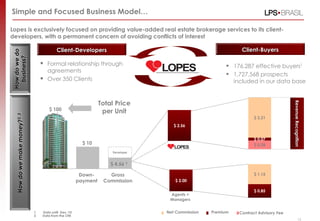


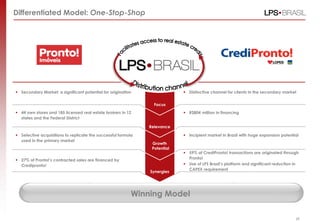


The document provides an overview of LPS Brasil, a real estate brokerage firm operating in Brazil. It highlights LPS Brasil's long history and leadership position in the Brazilian real estate market. The summary also notes that LPS Brasil has a simple and focused business model providing brokerage services to property developers while also operating in the primary, secondary, and mortgage loan markets.


