Download as KEY, PPTX
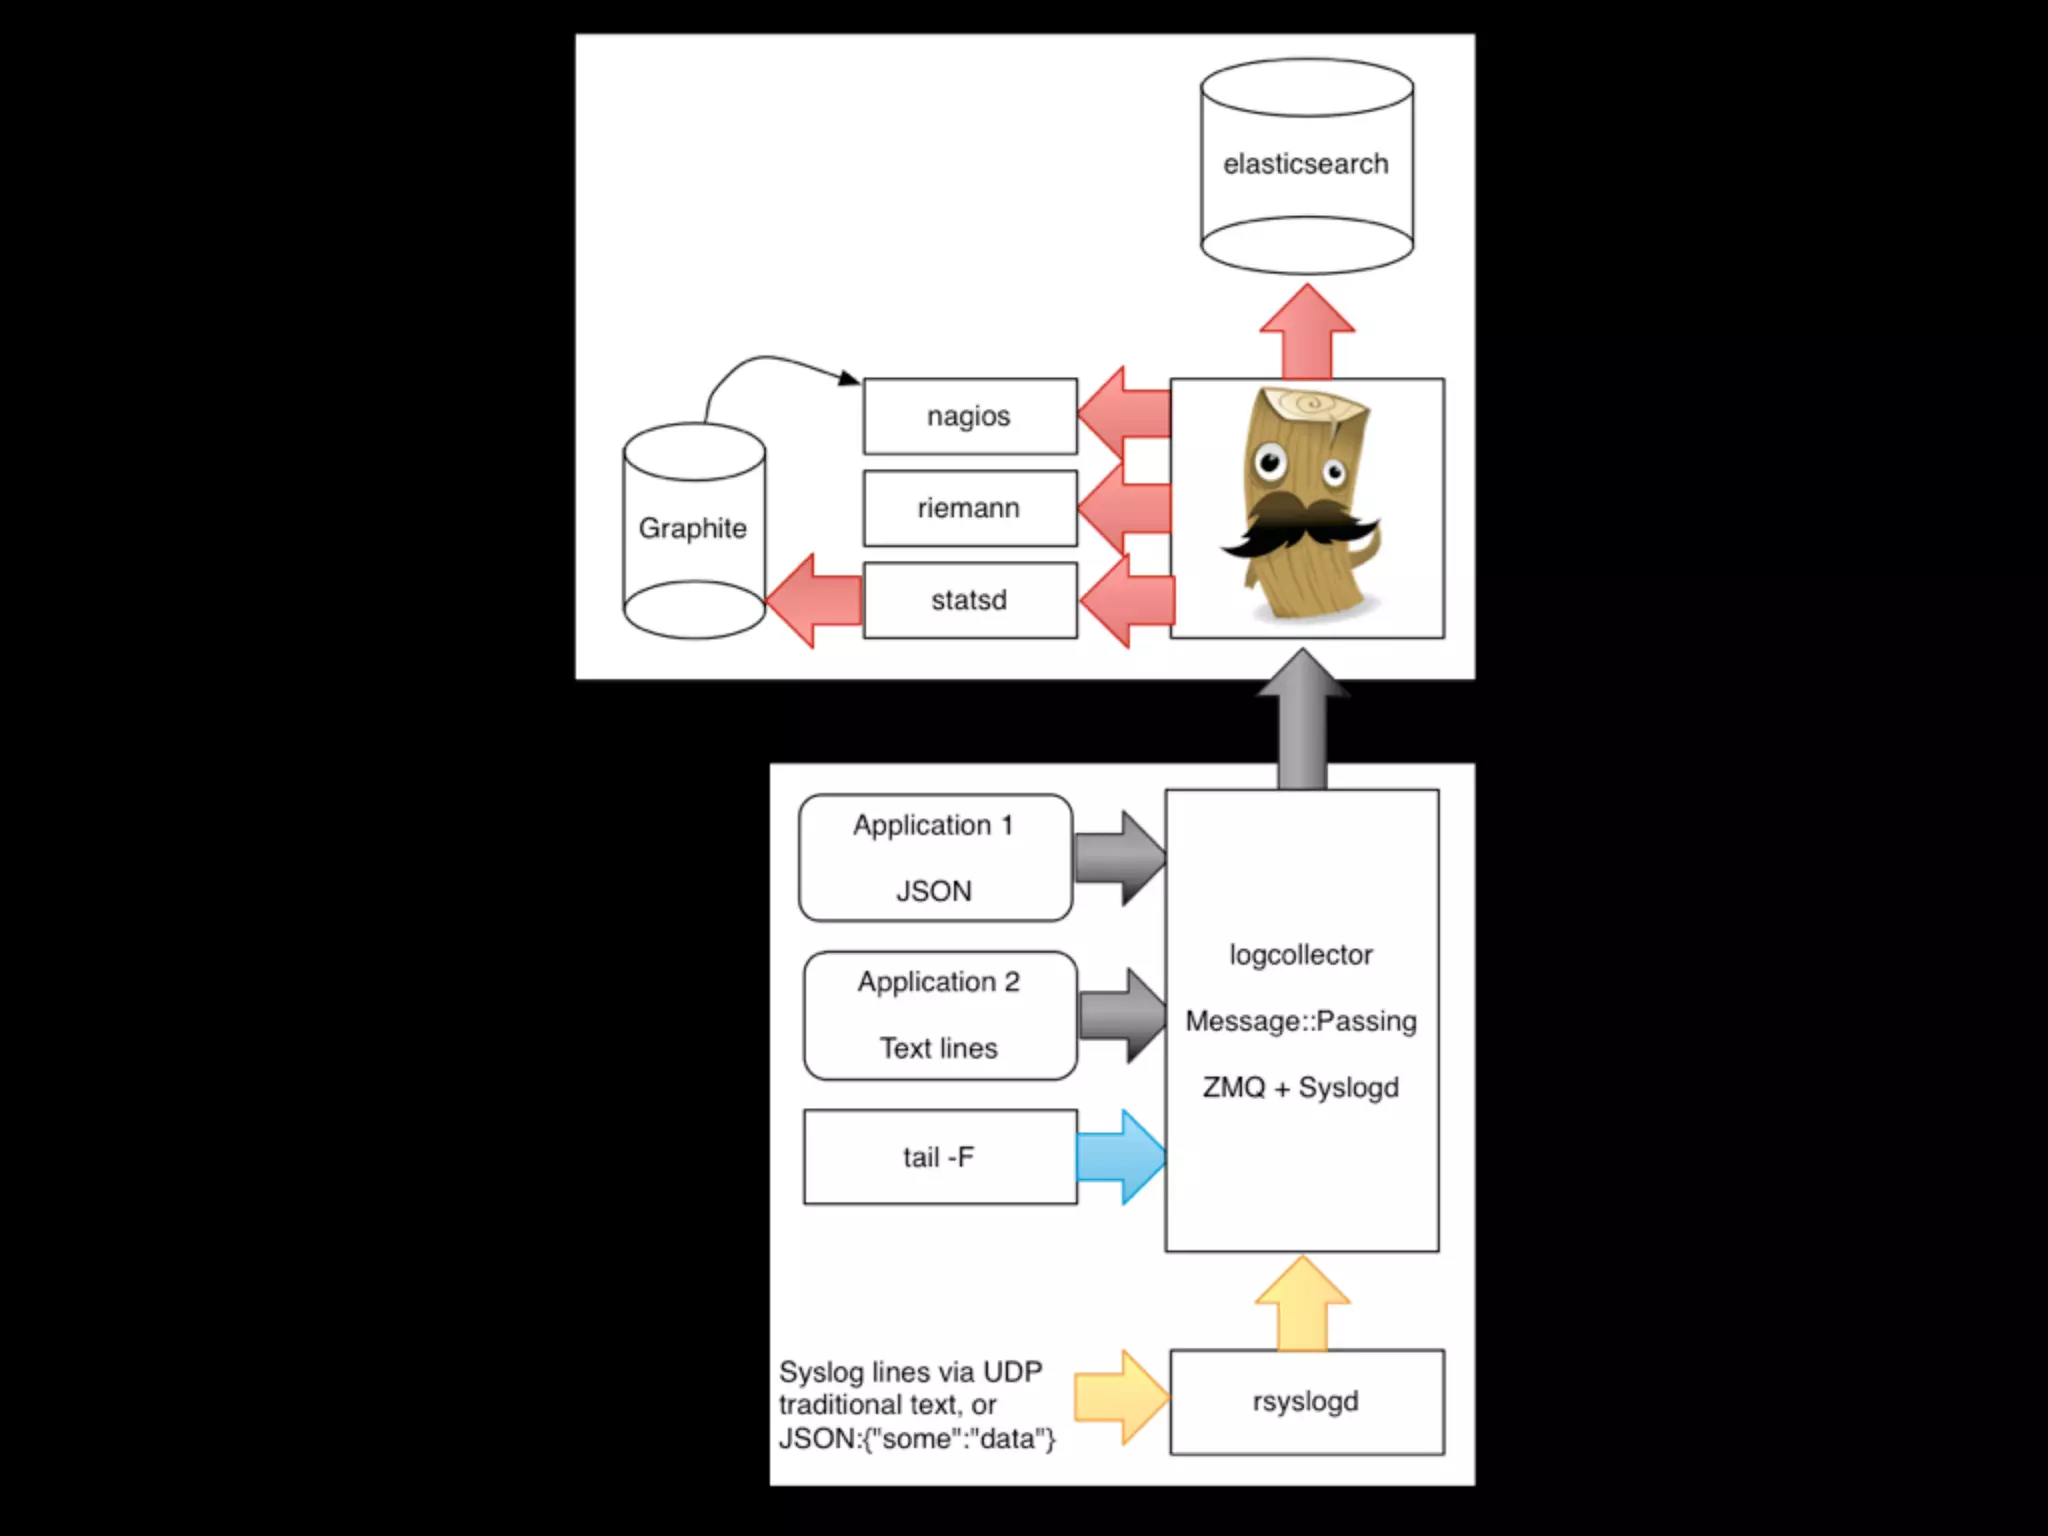
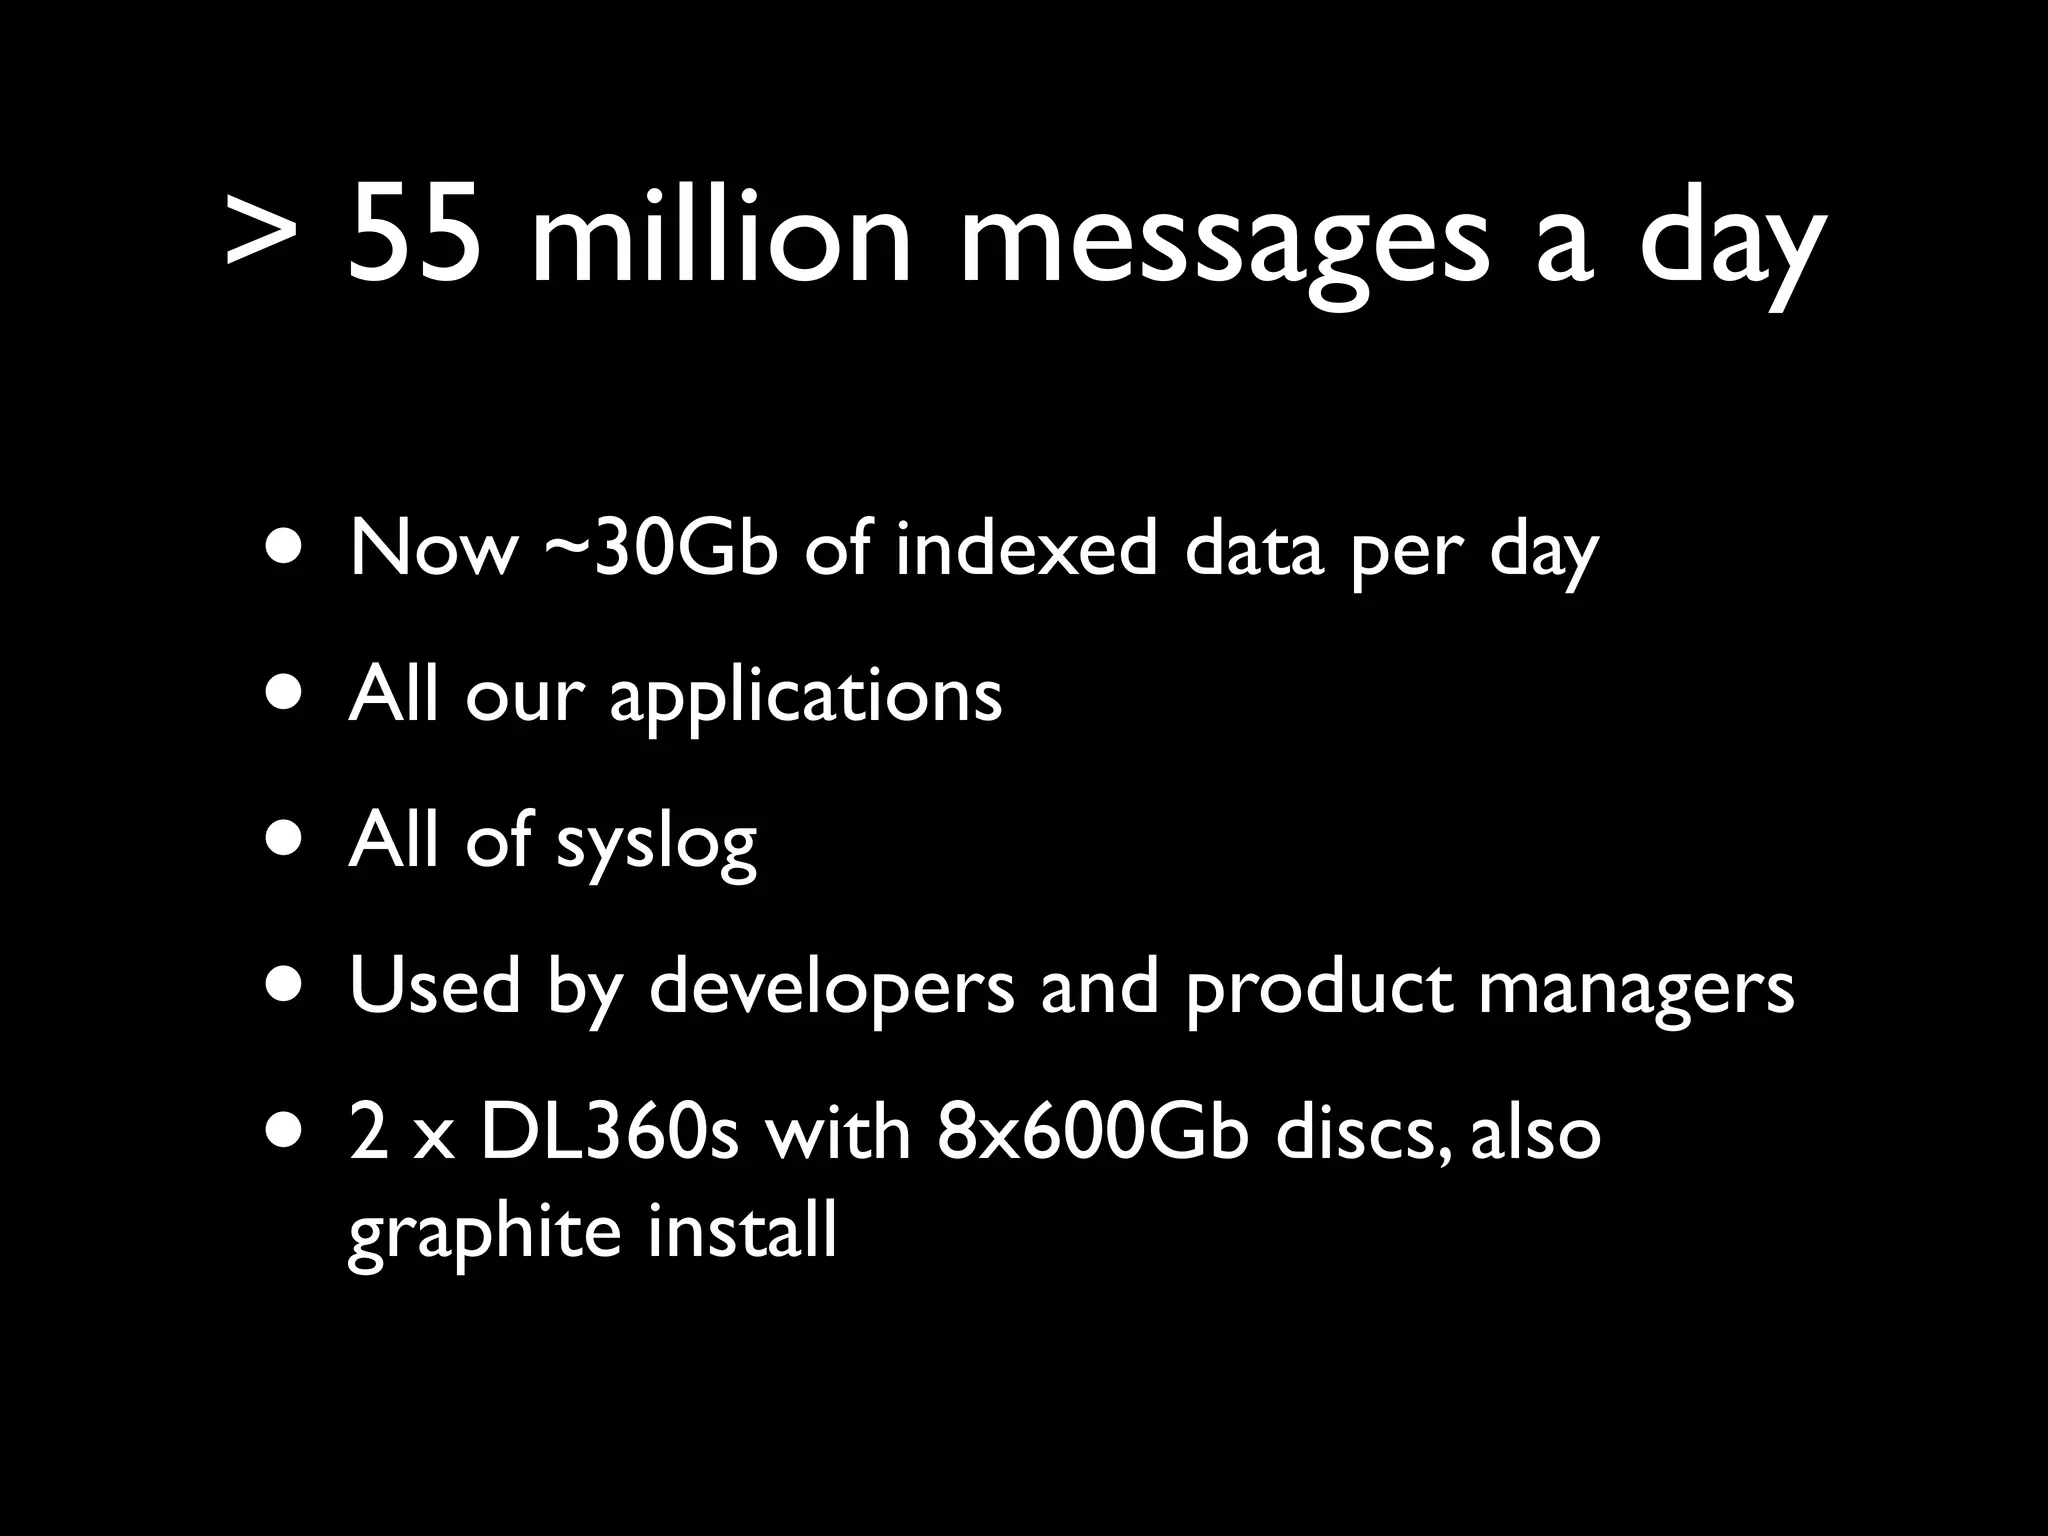

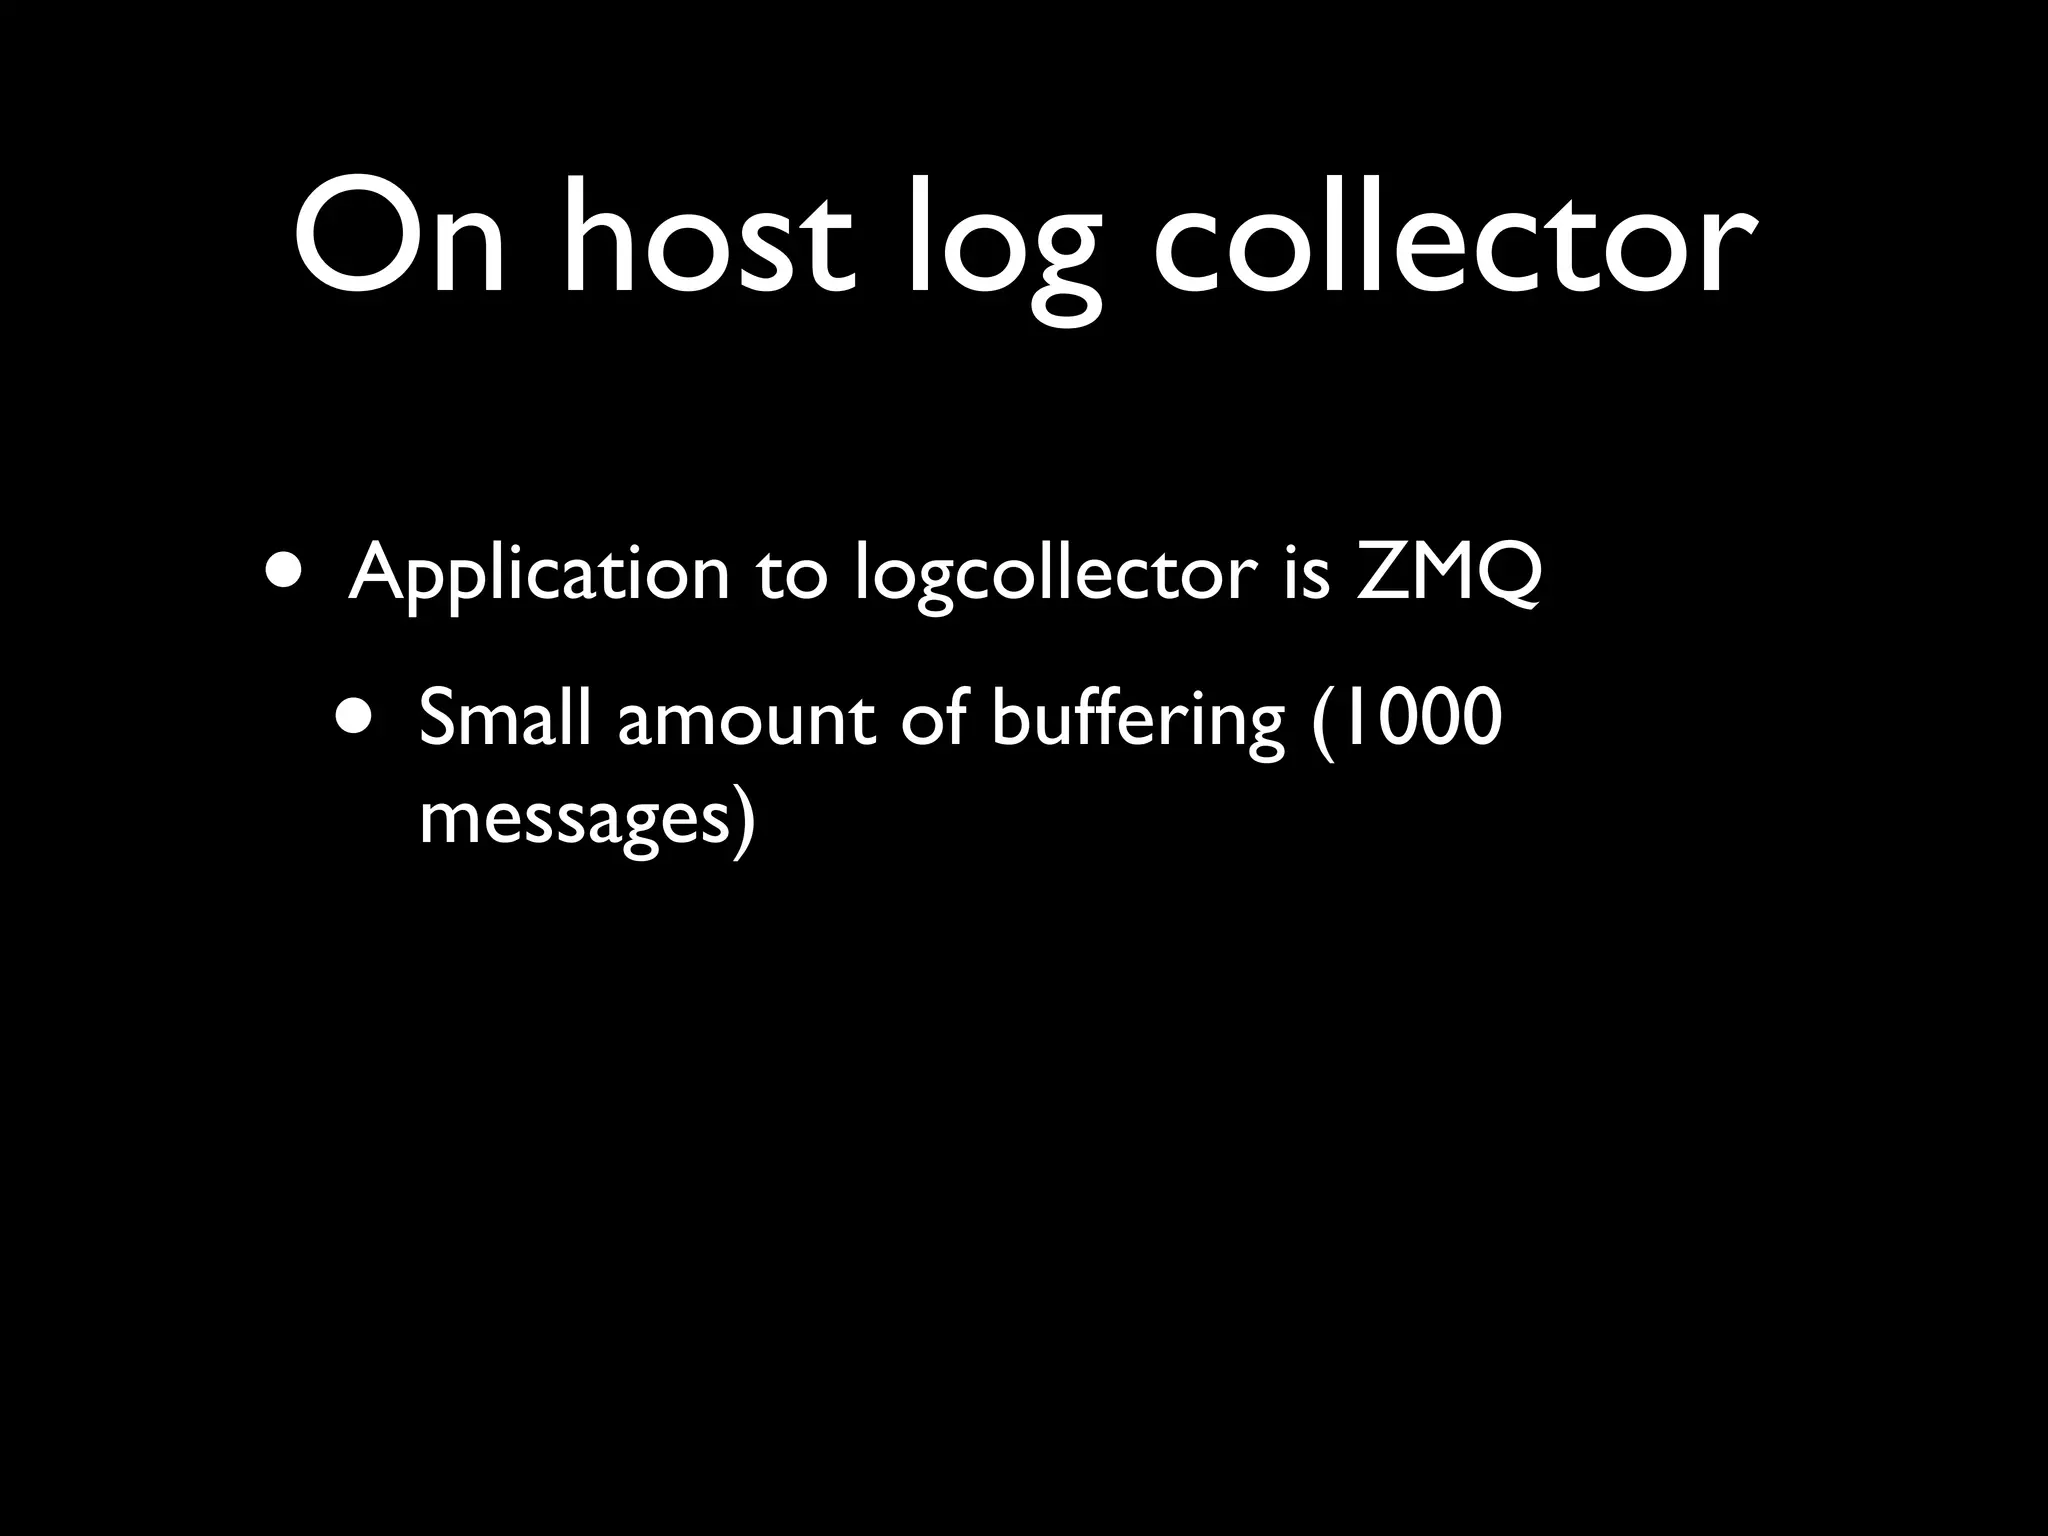
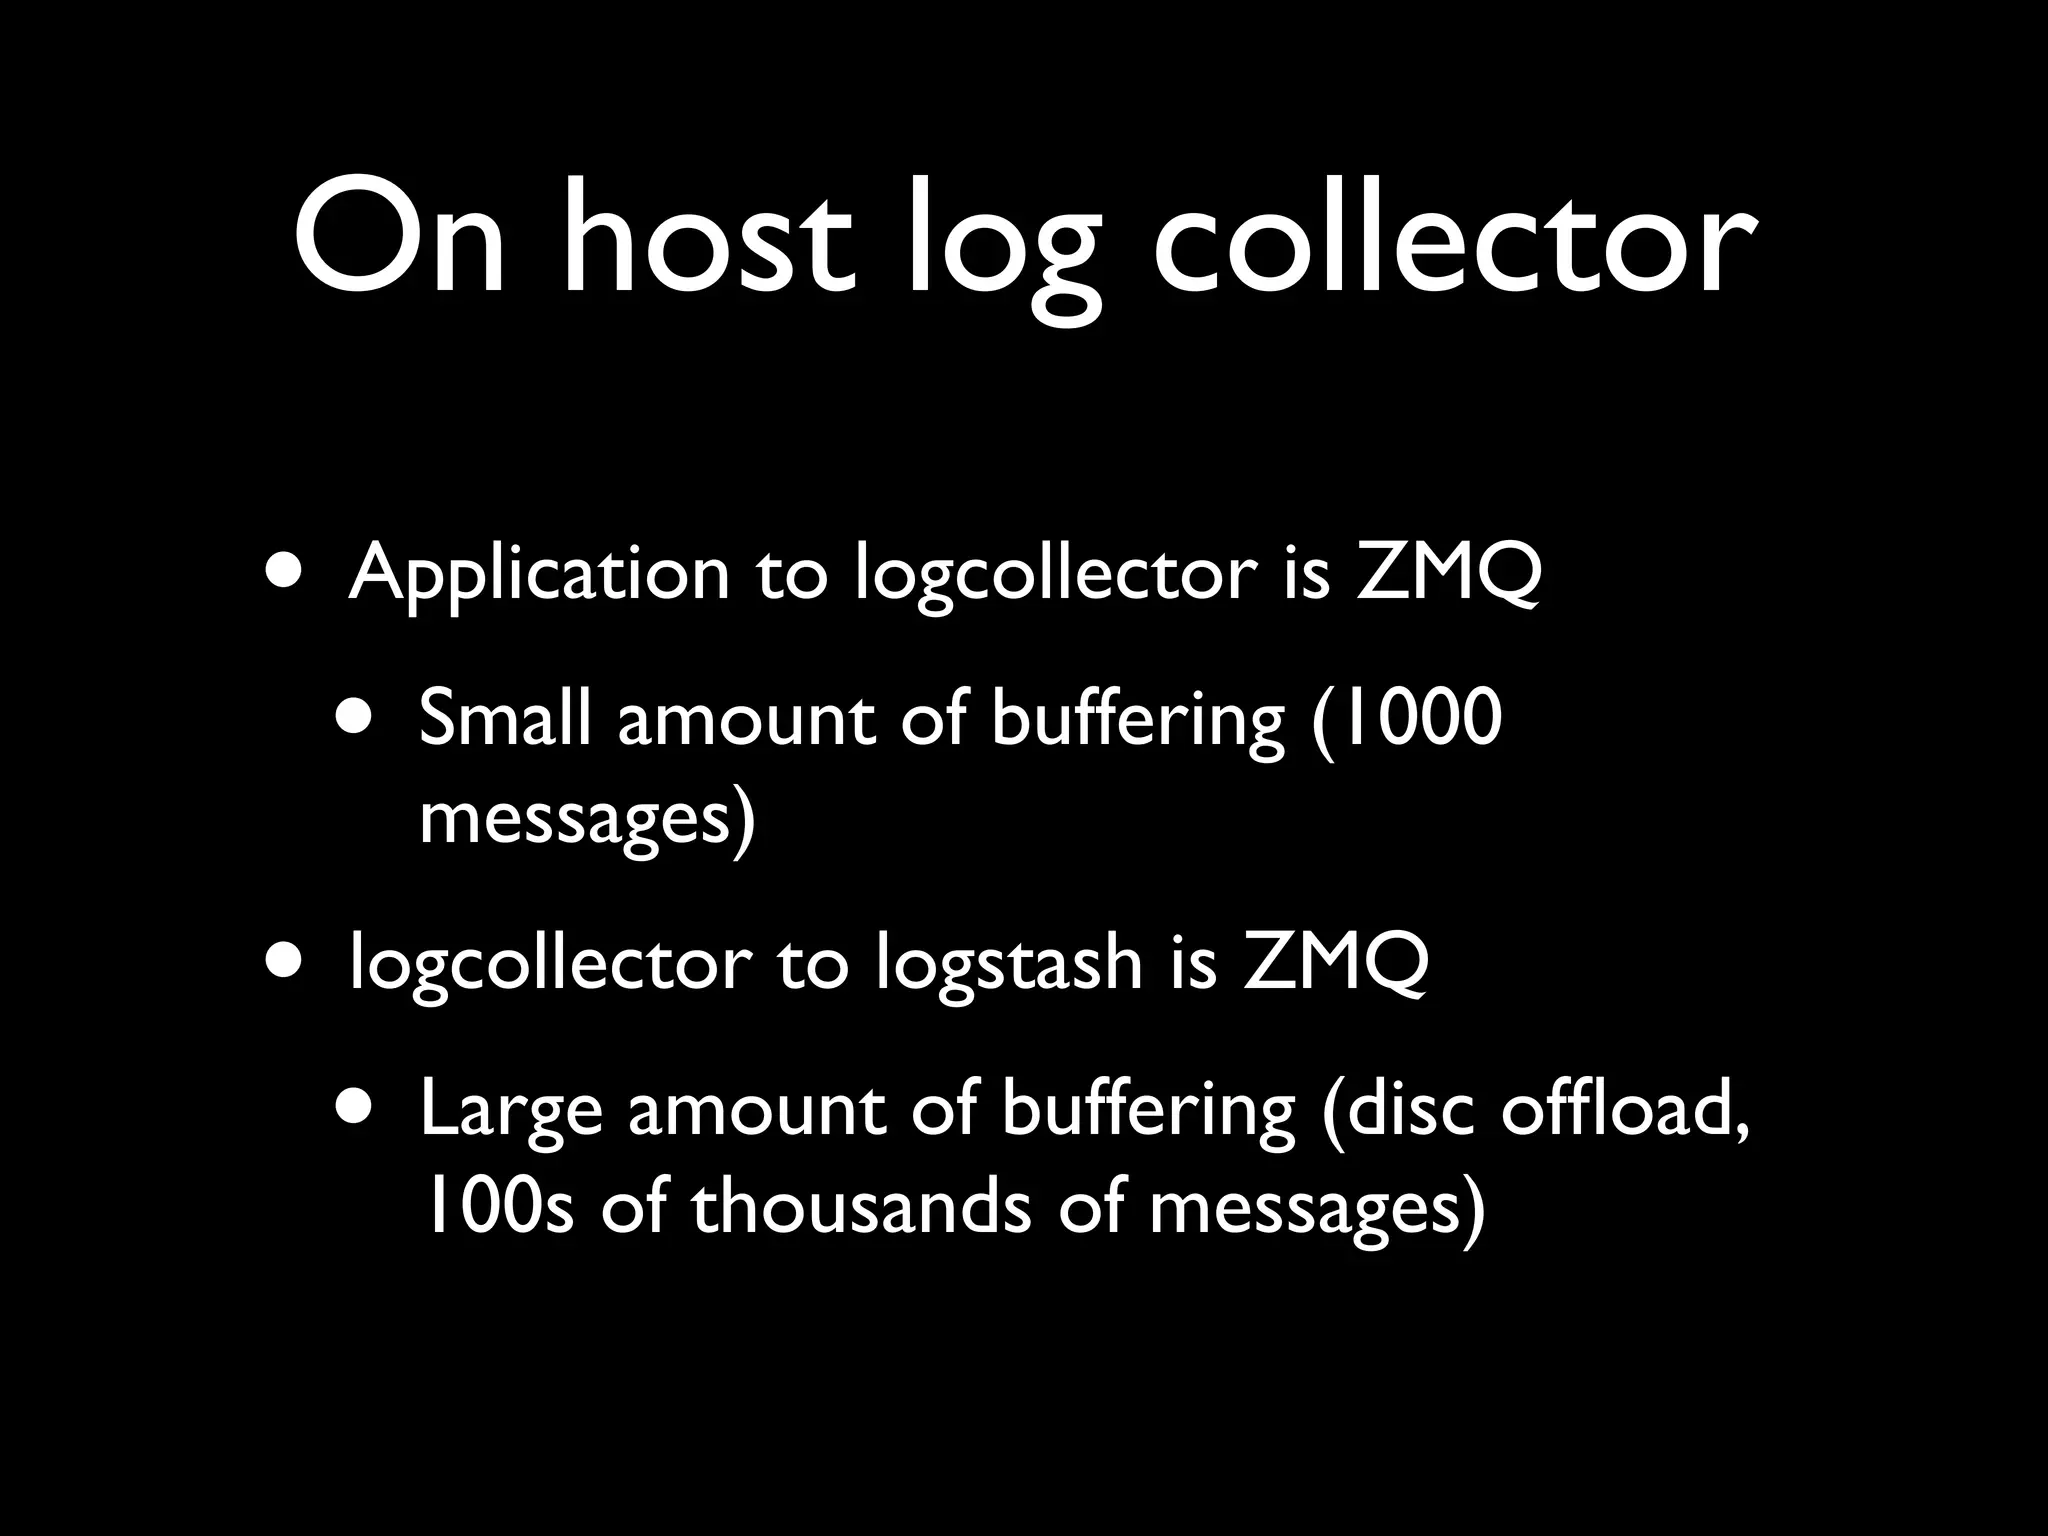
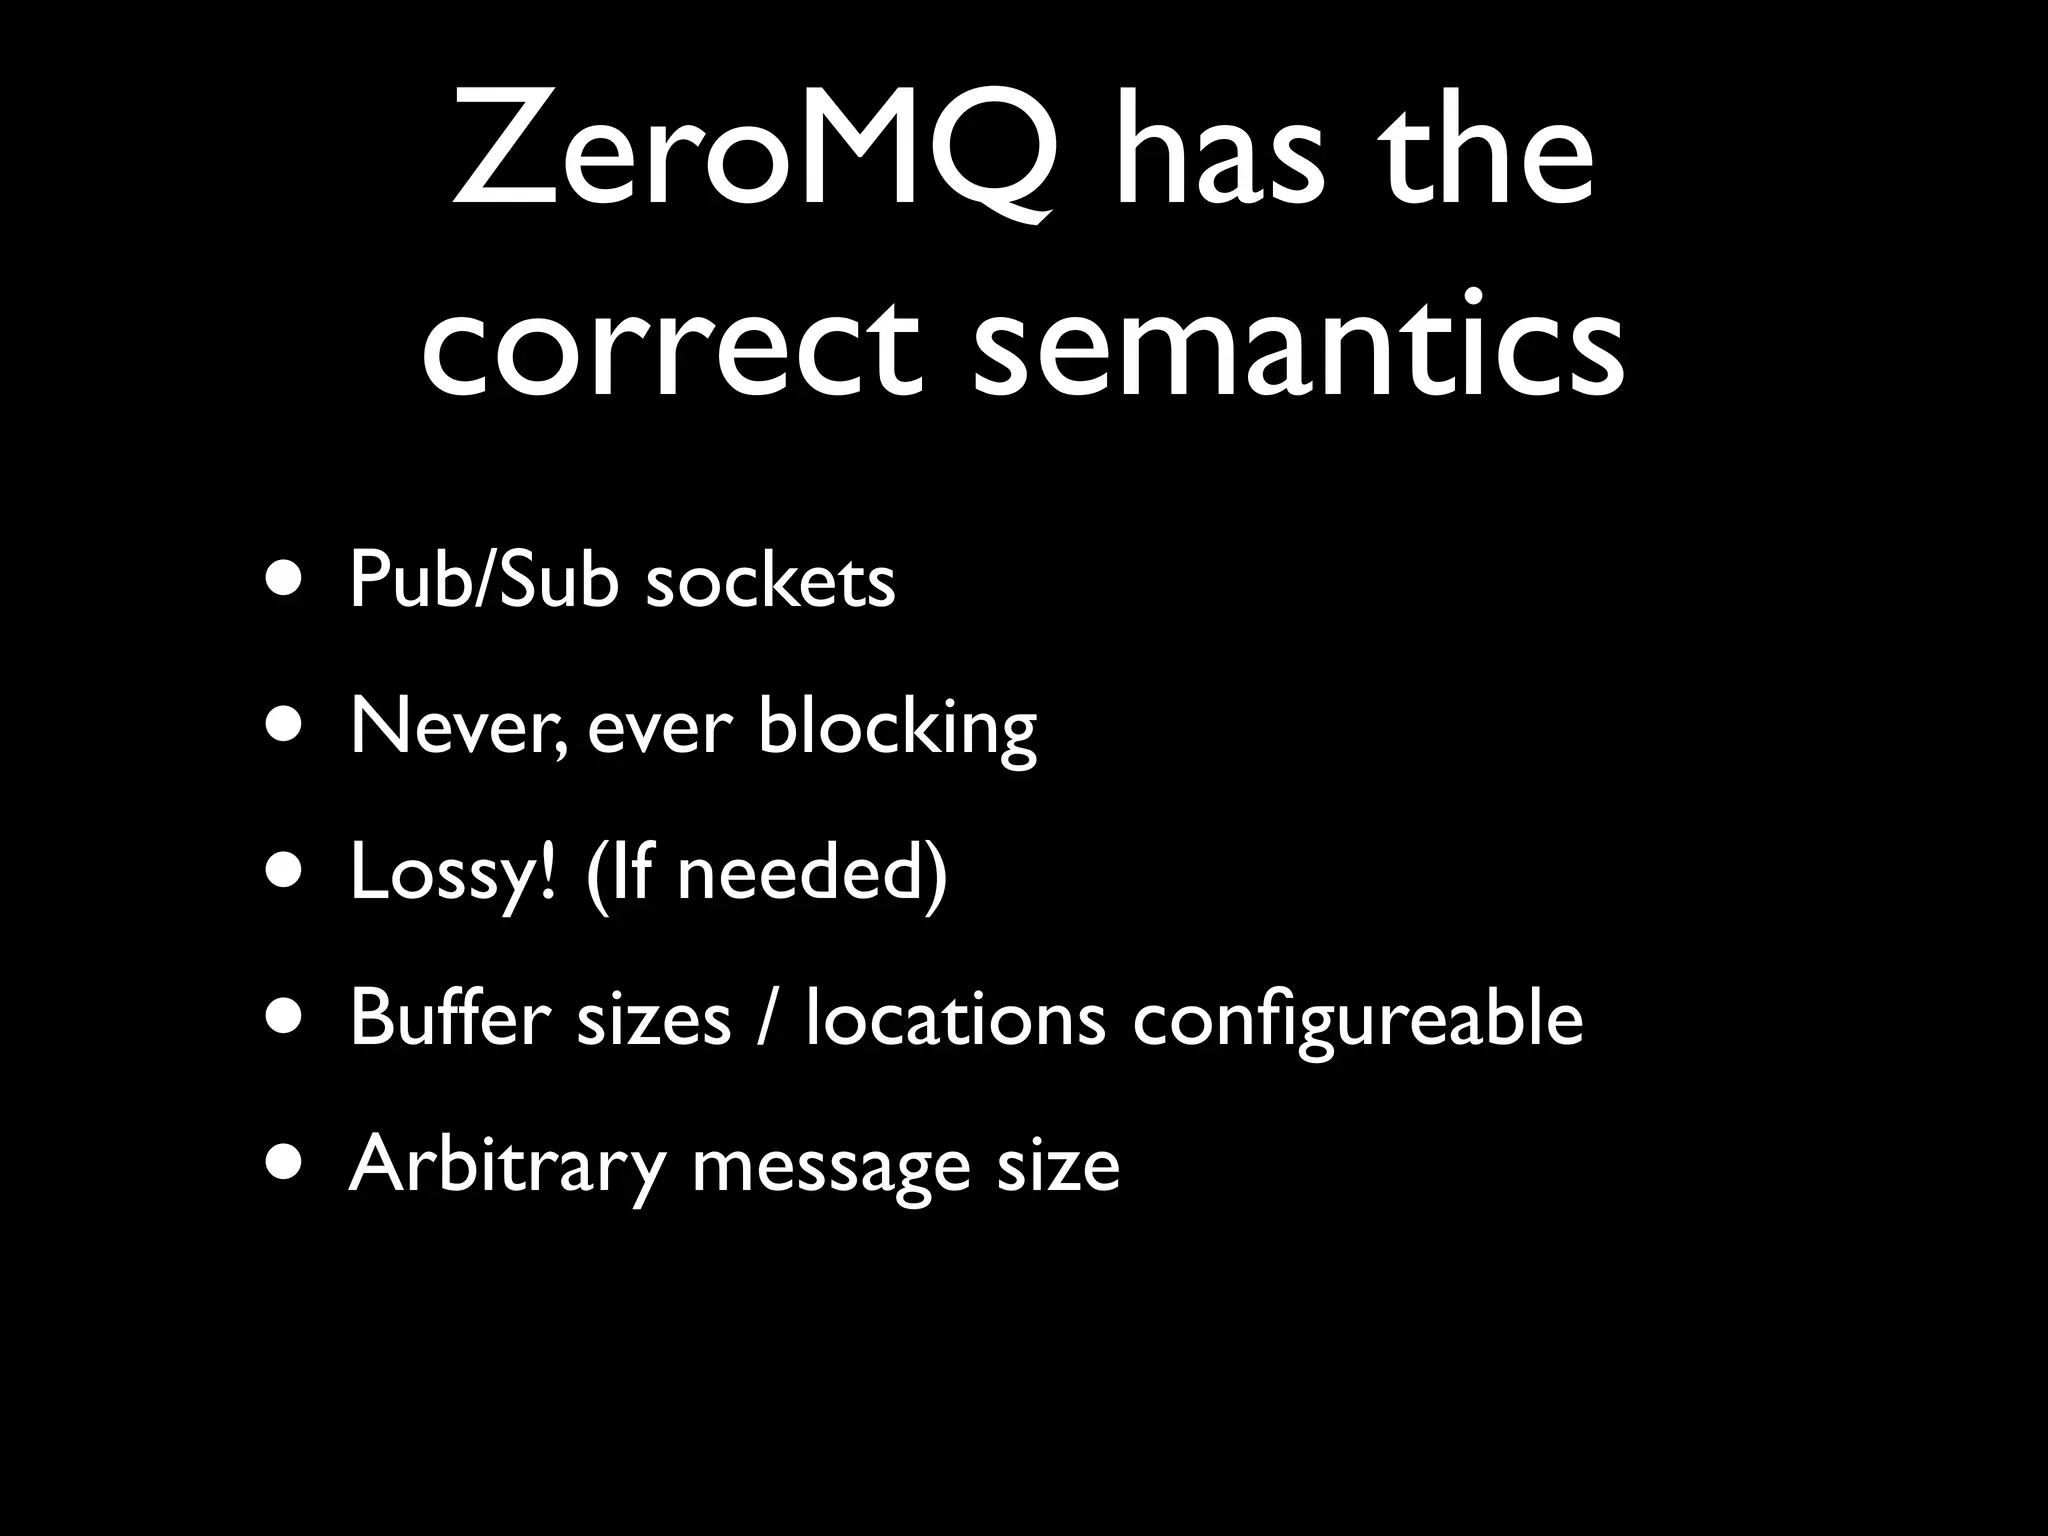
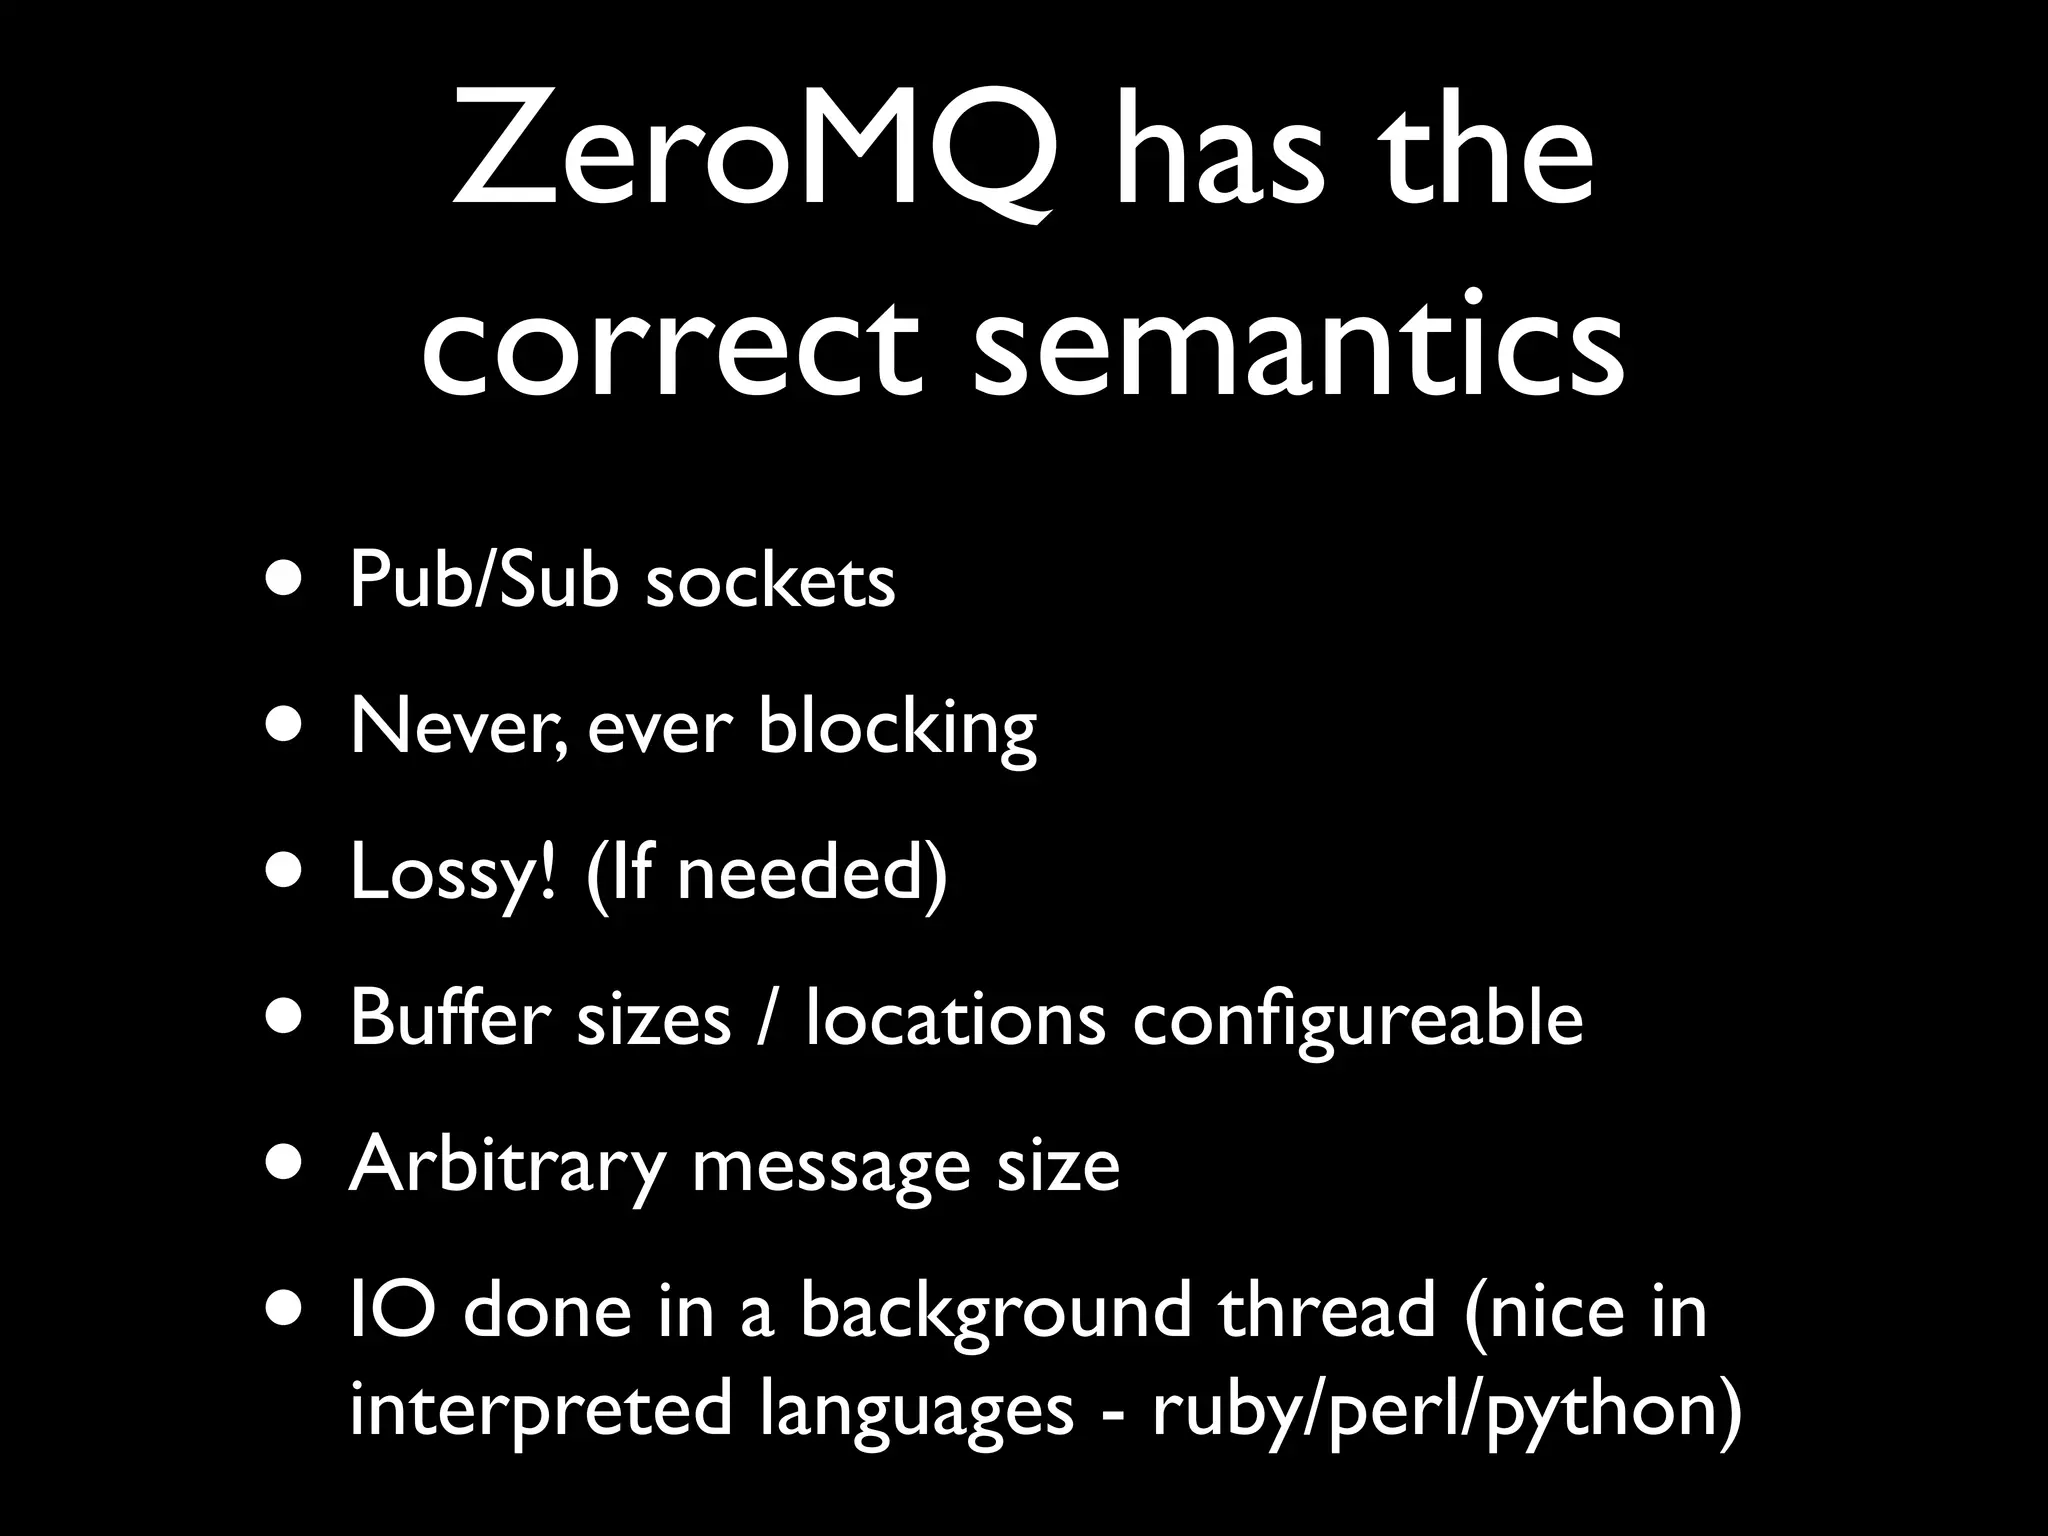
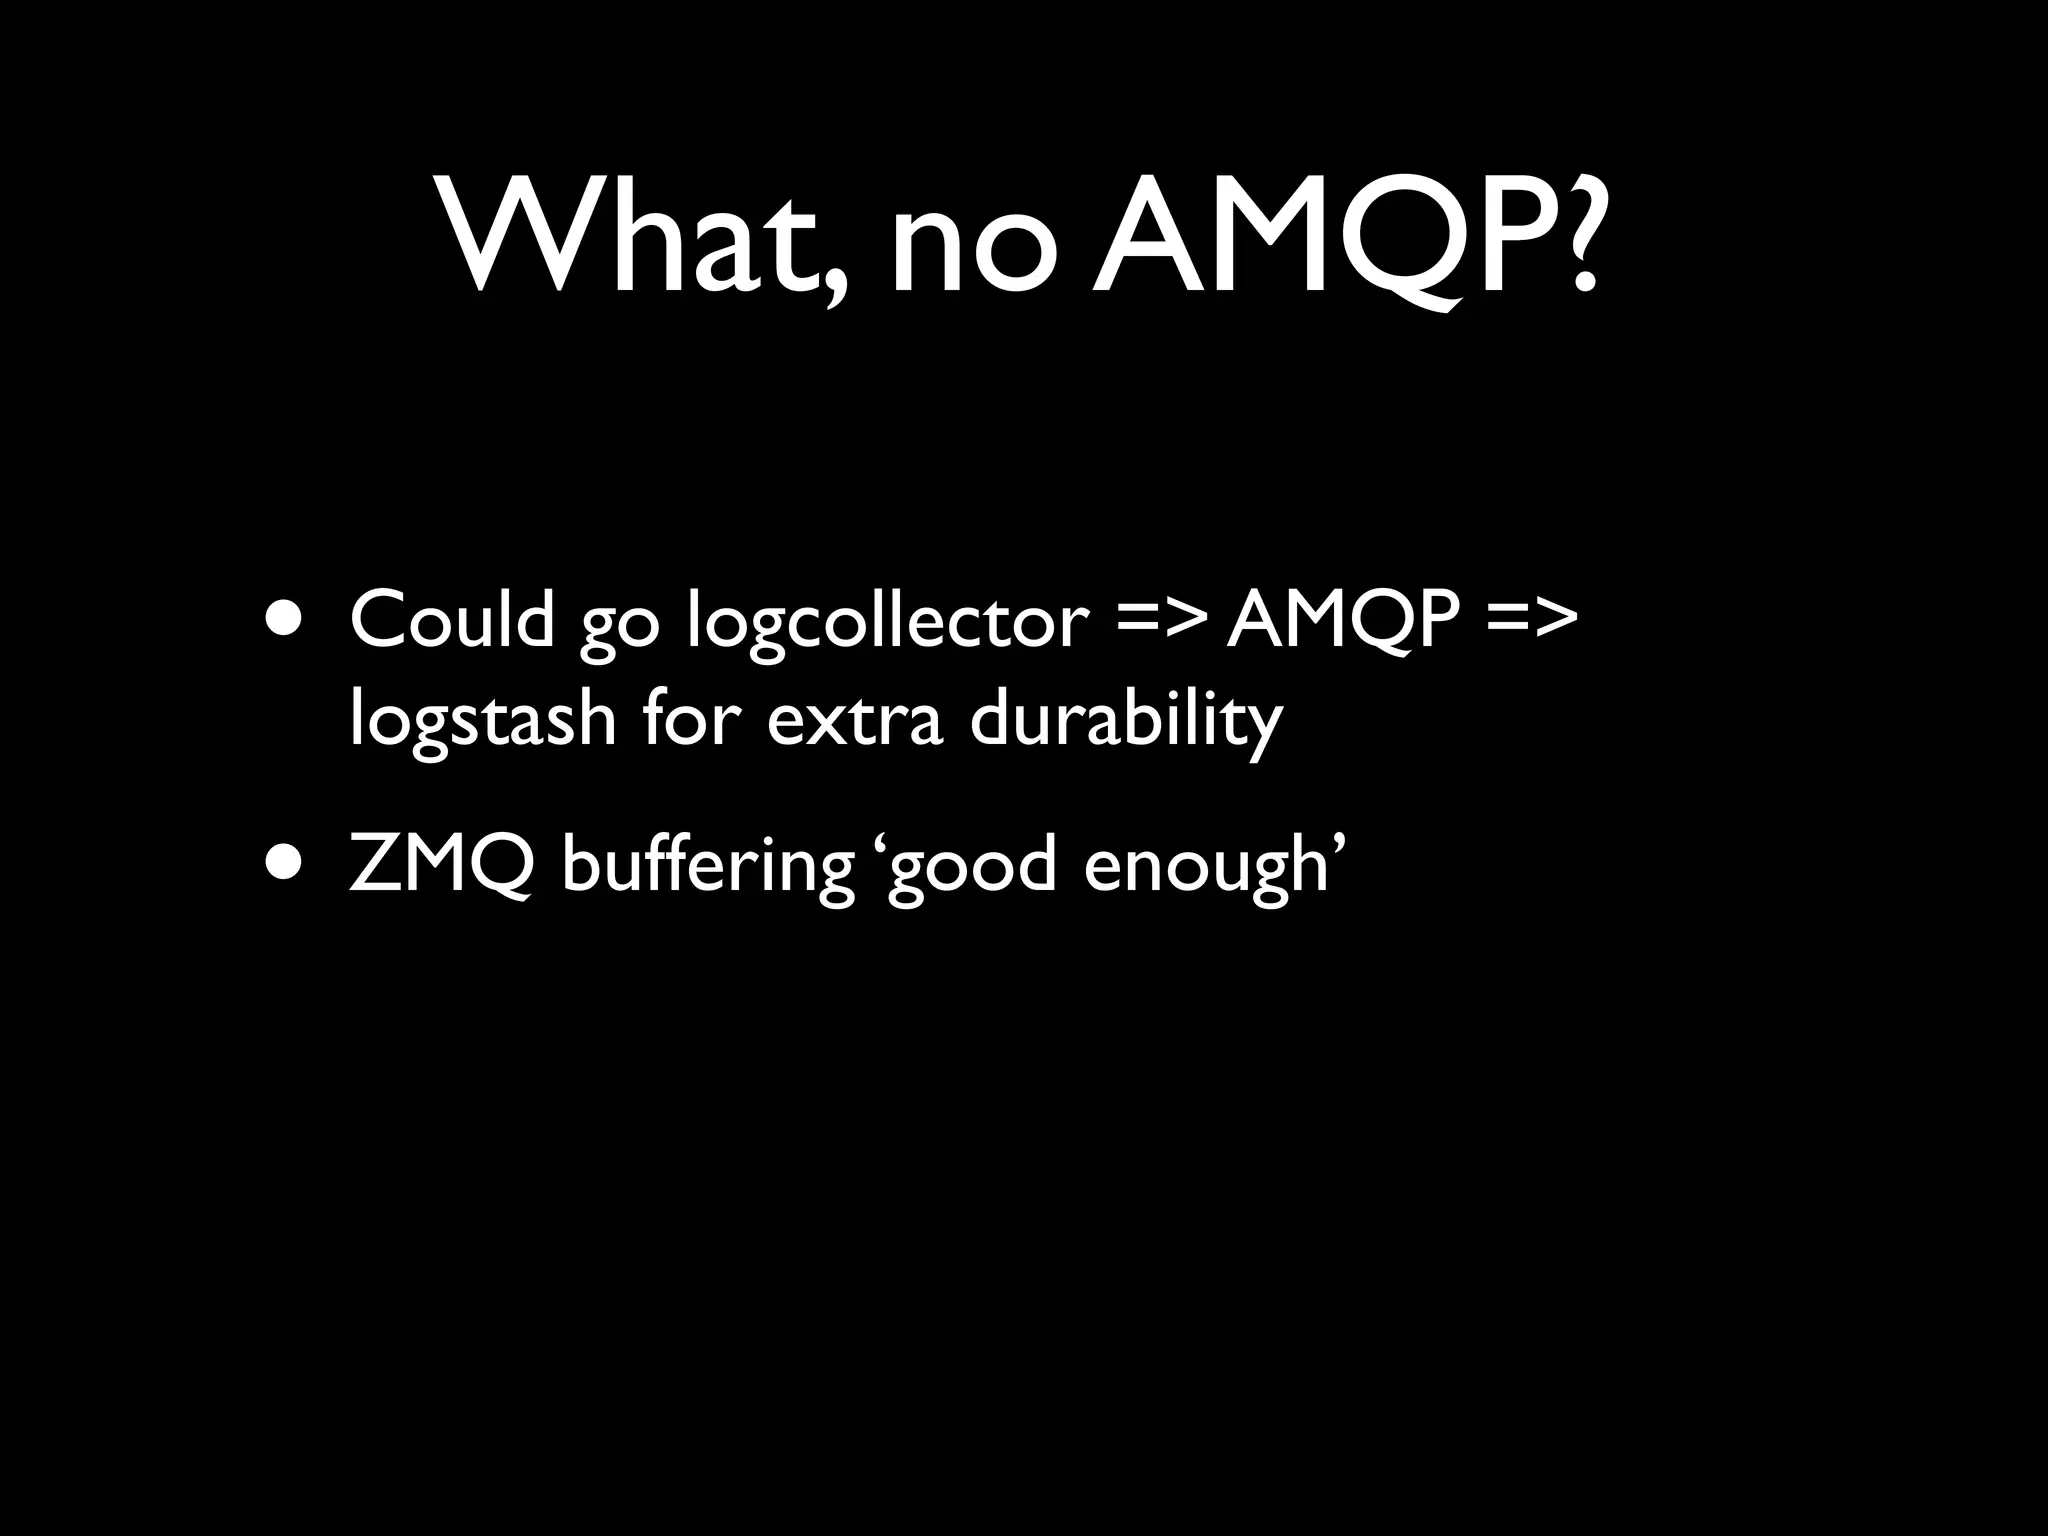
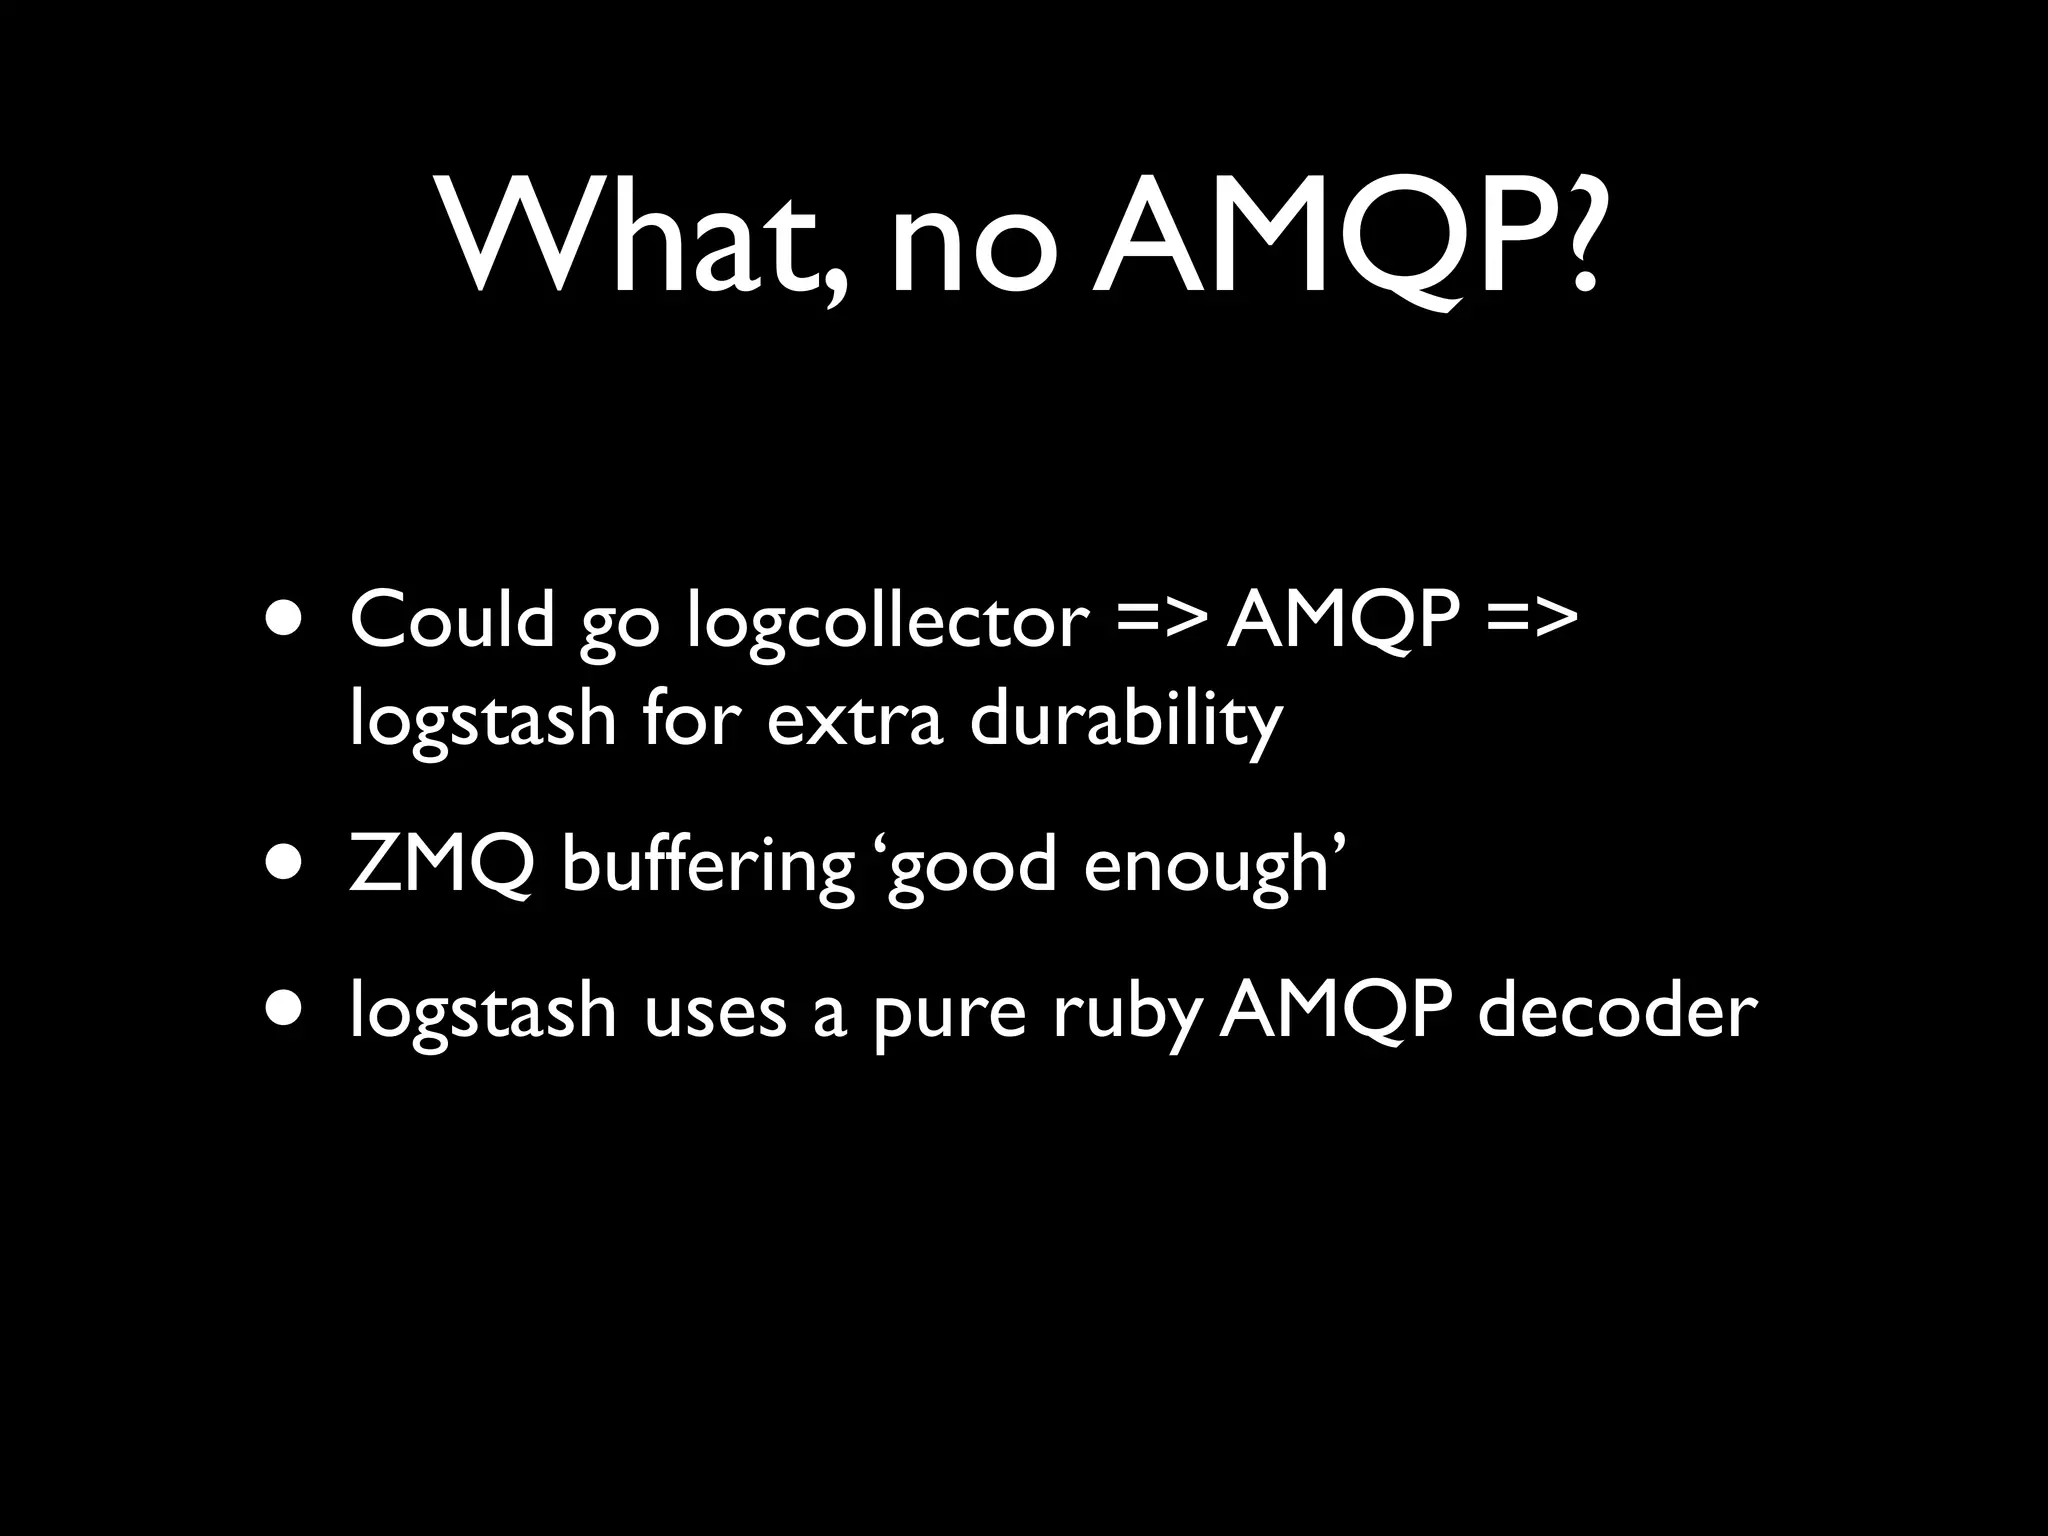
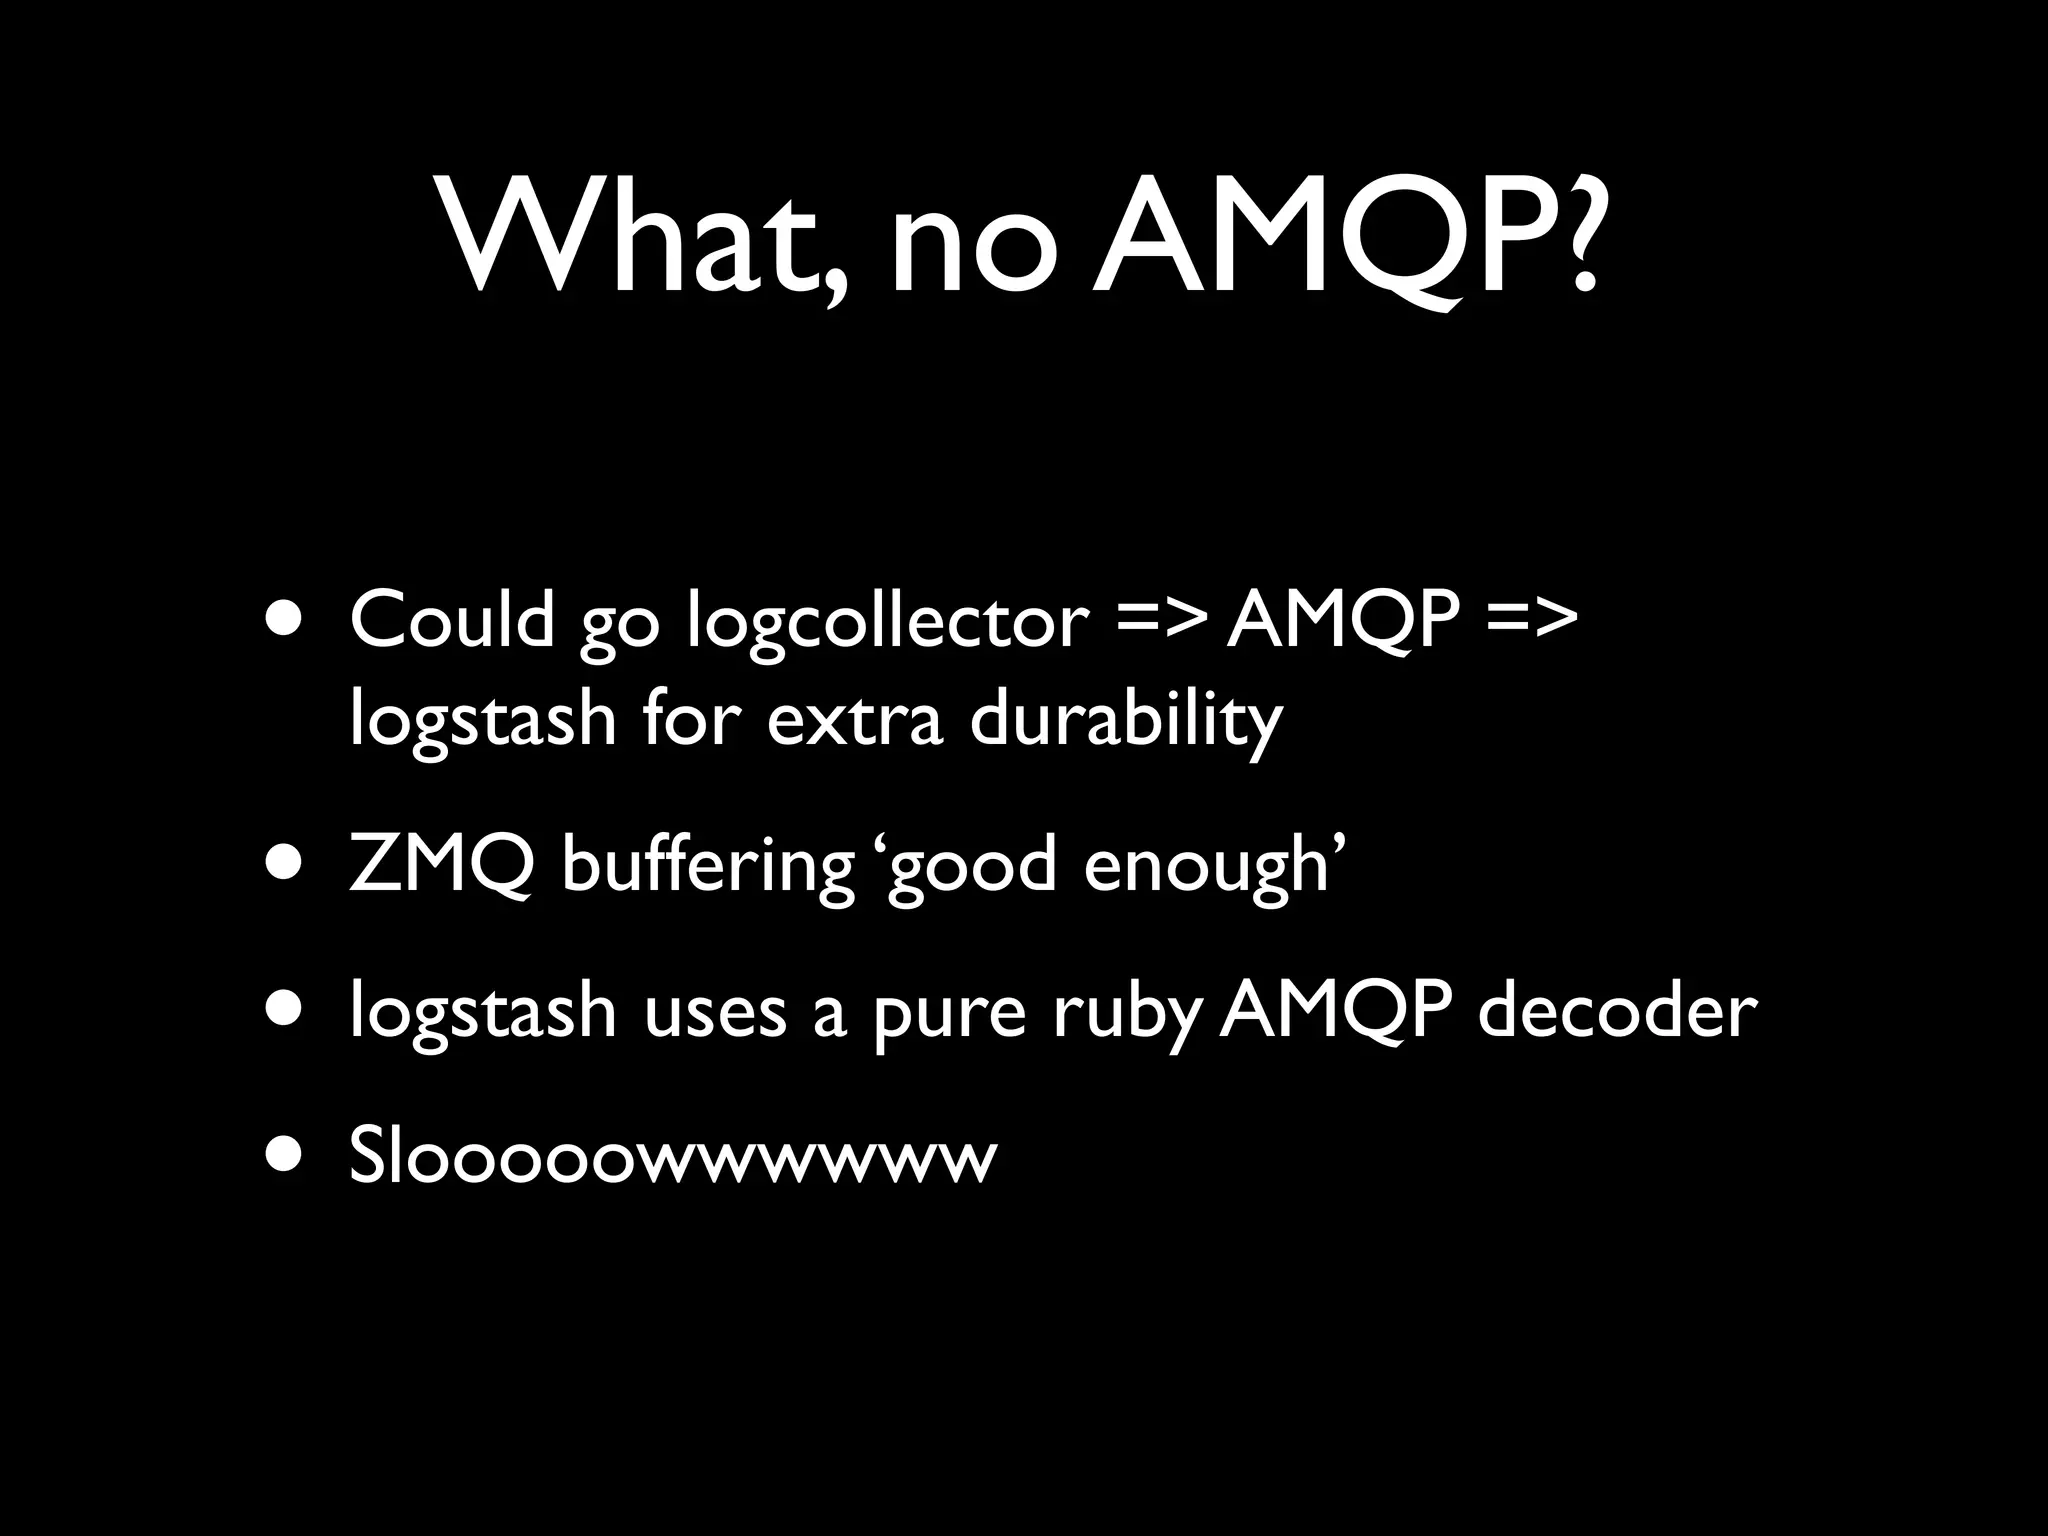

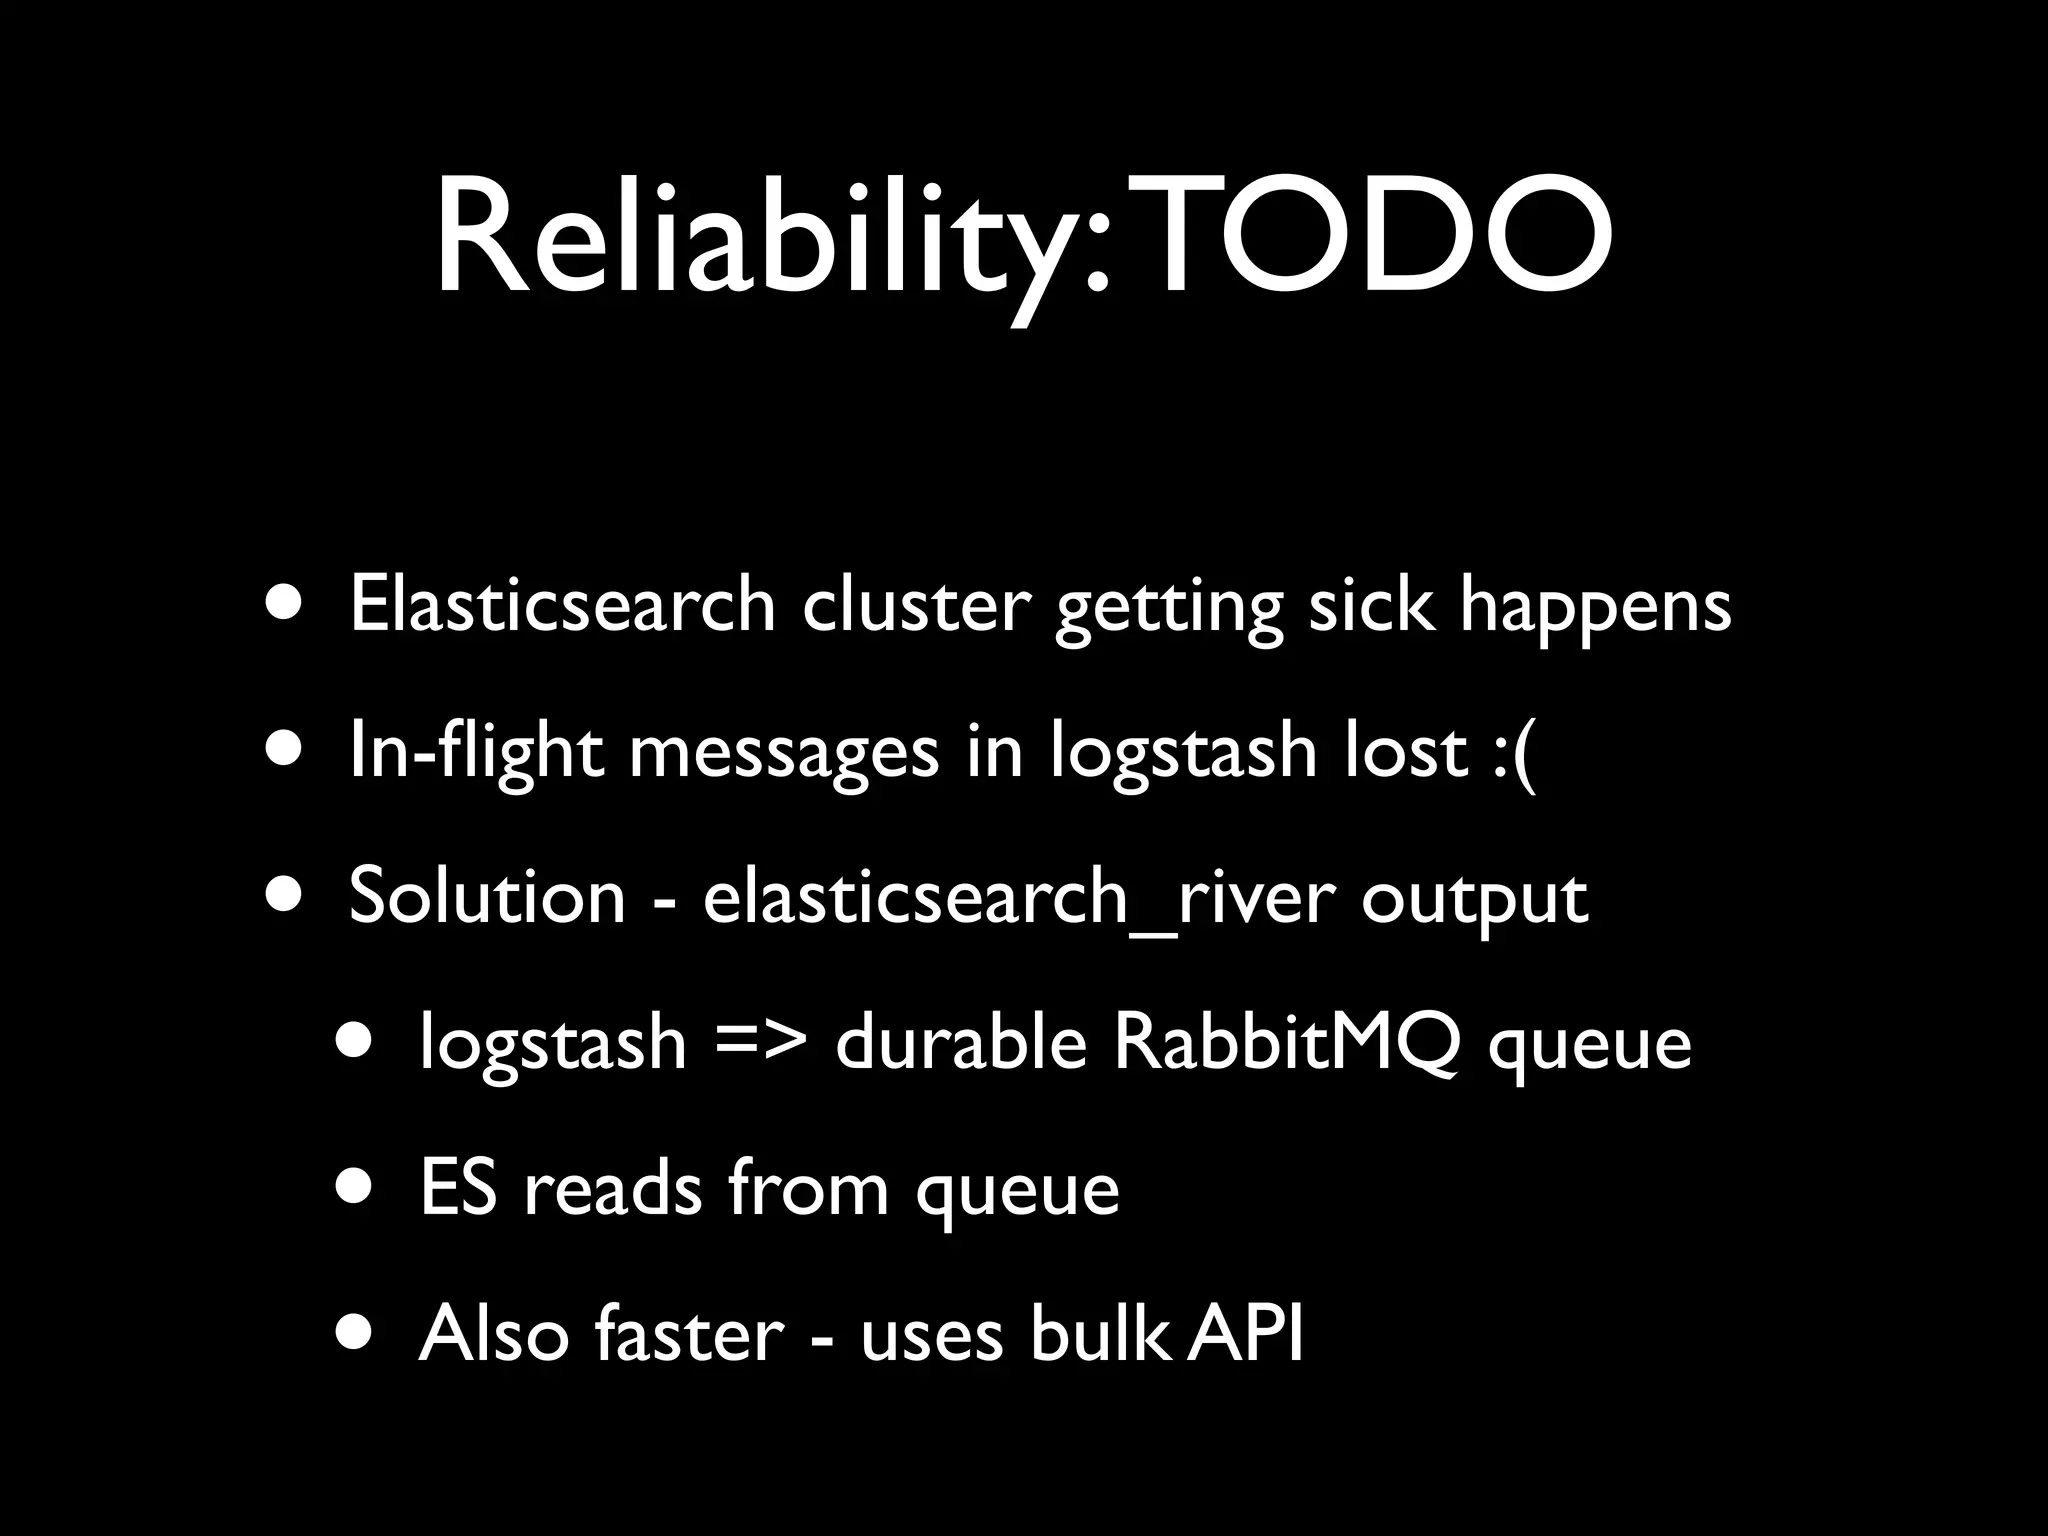
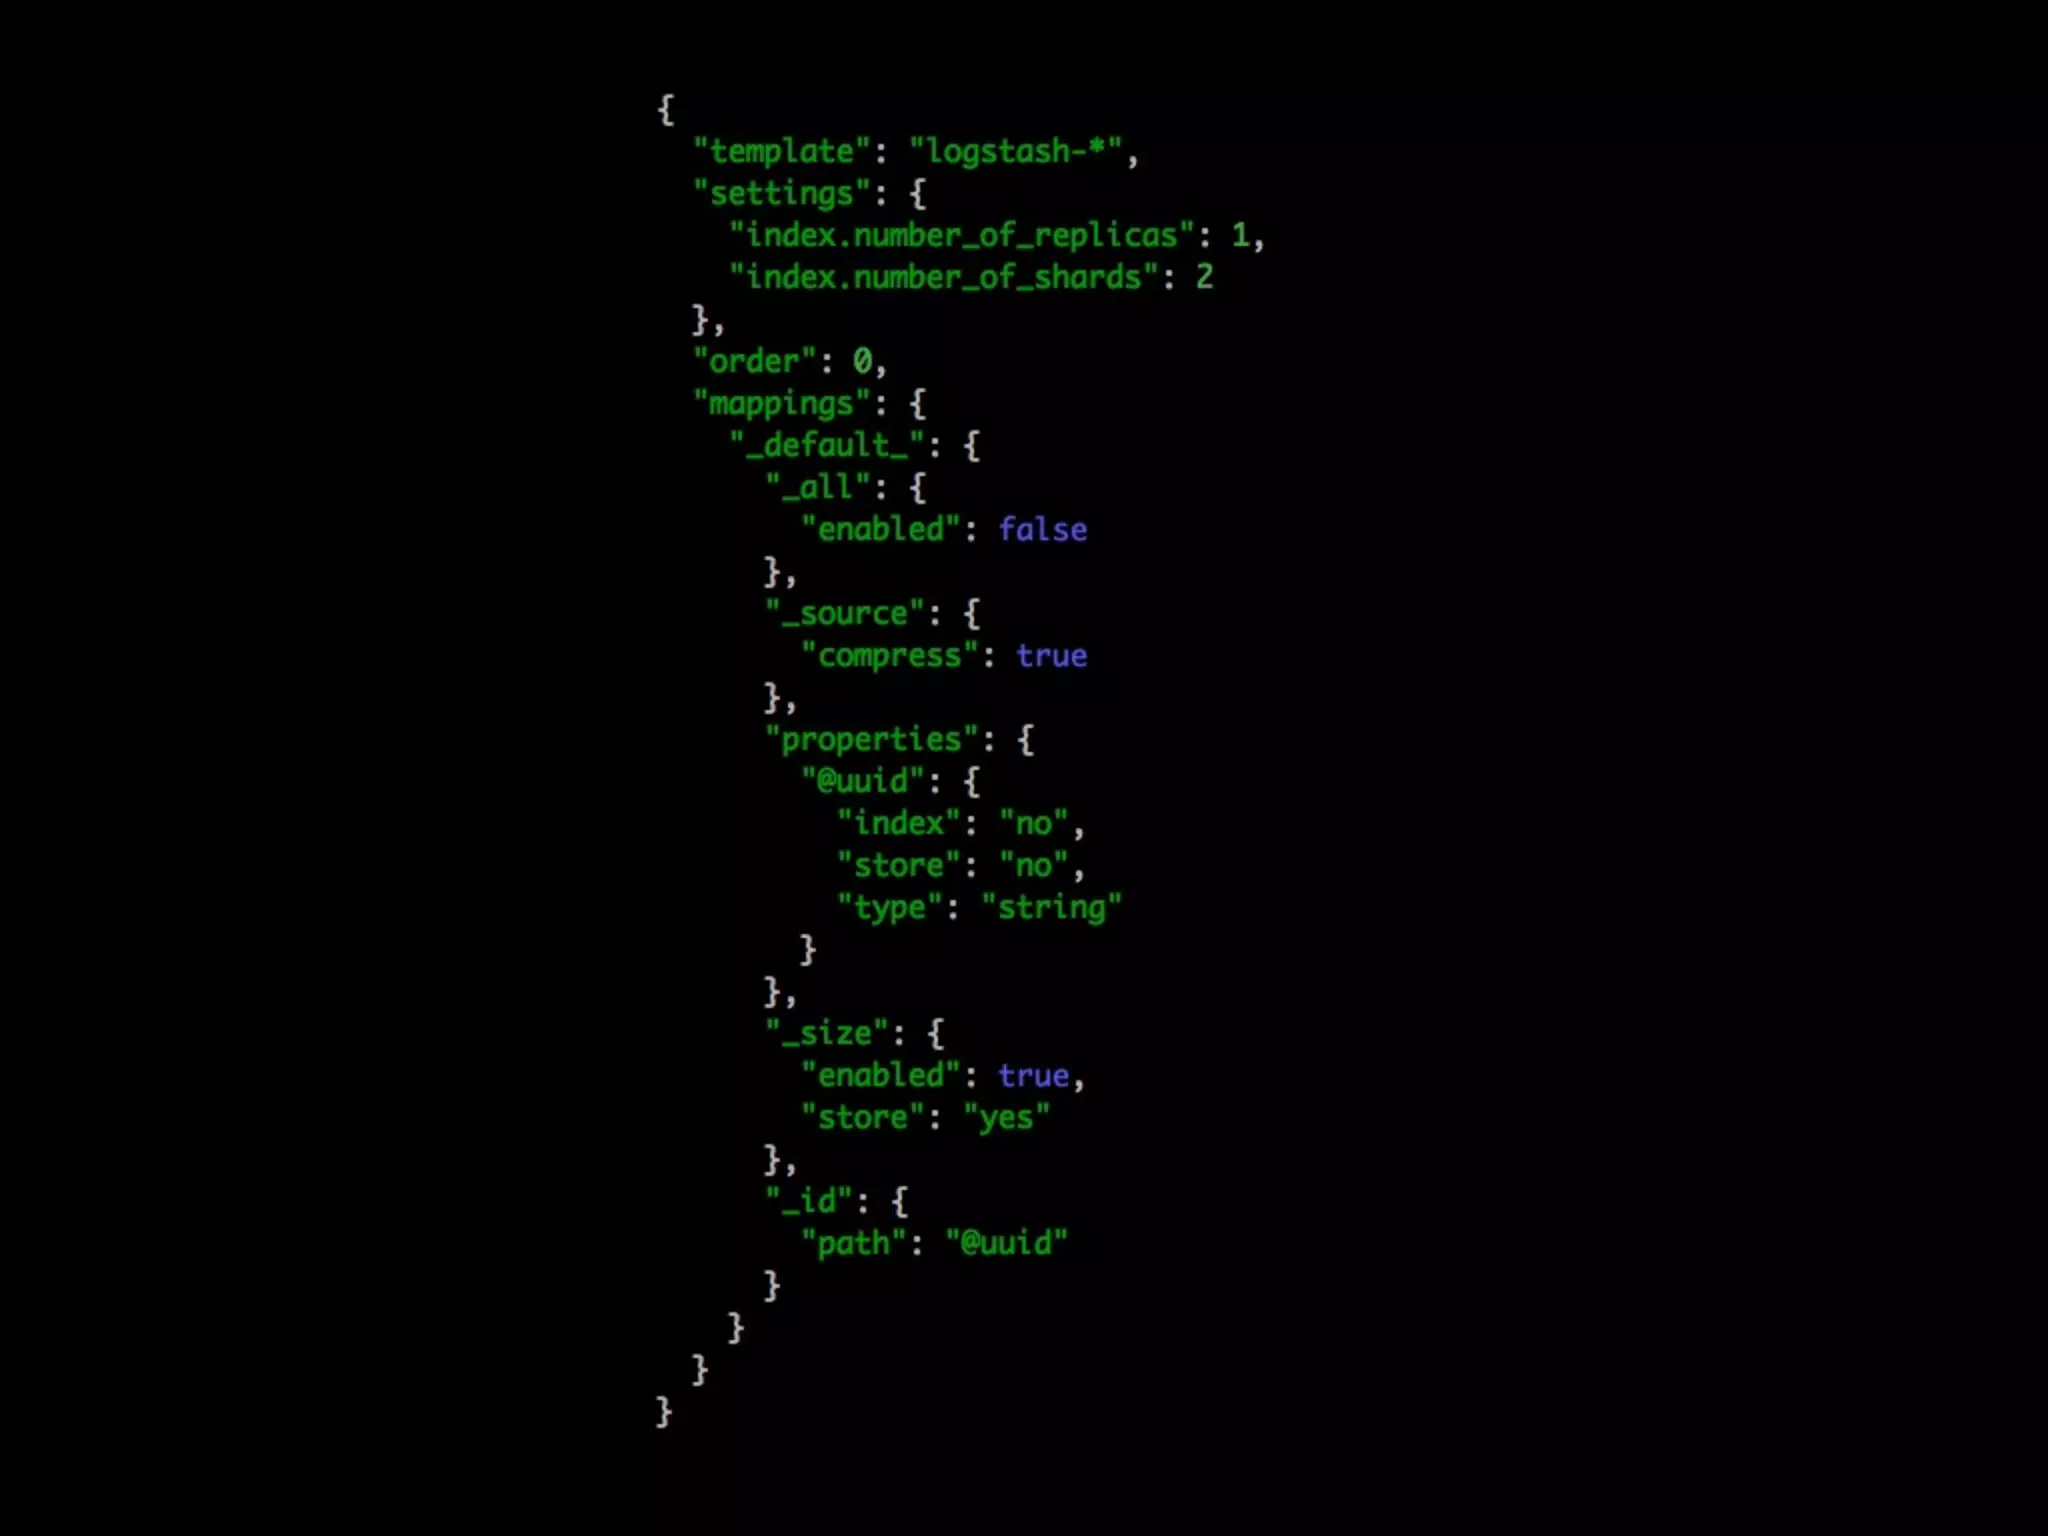

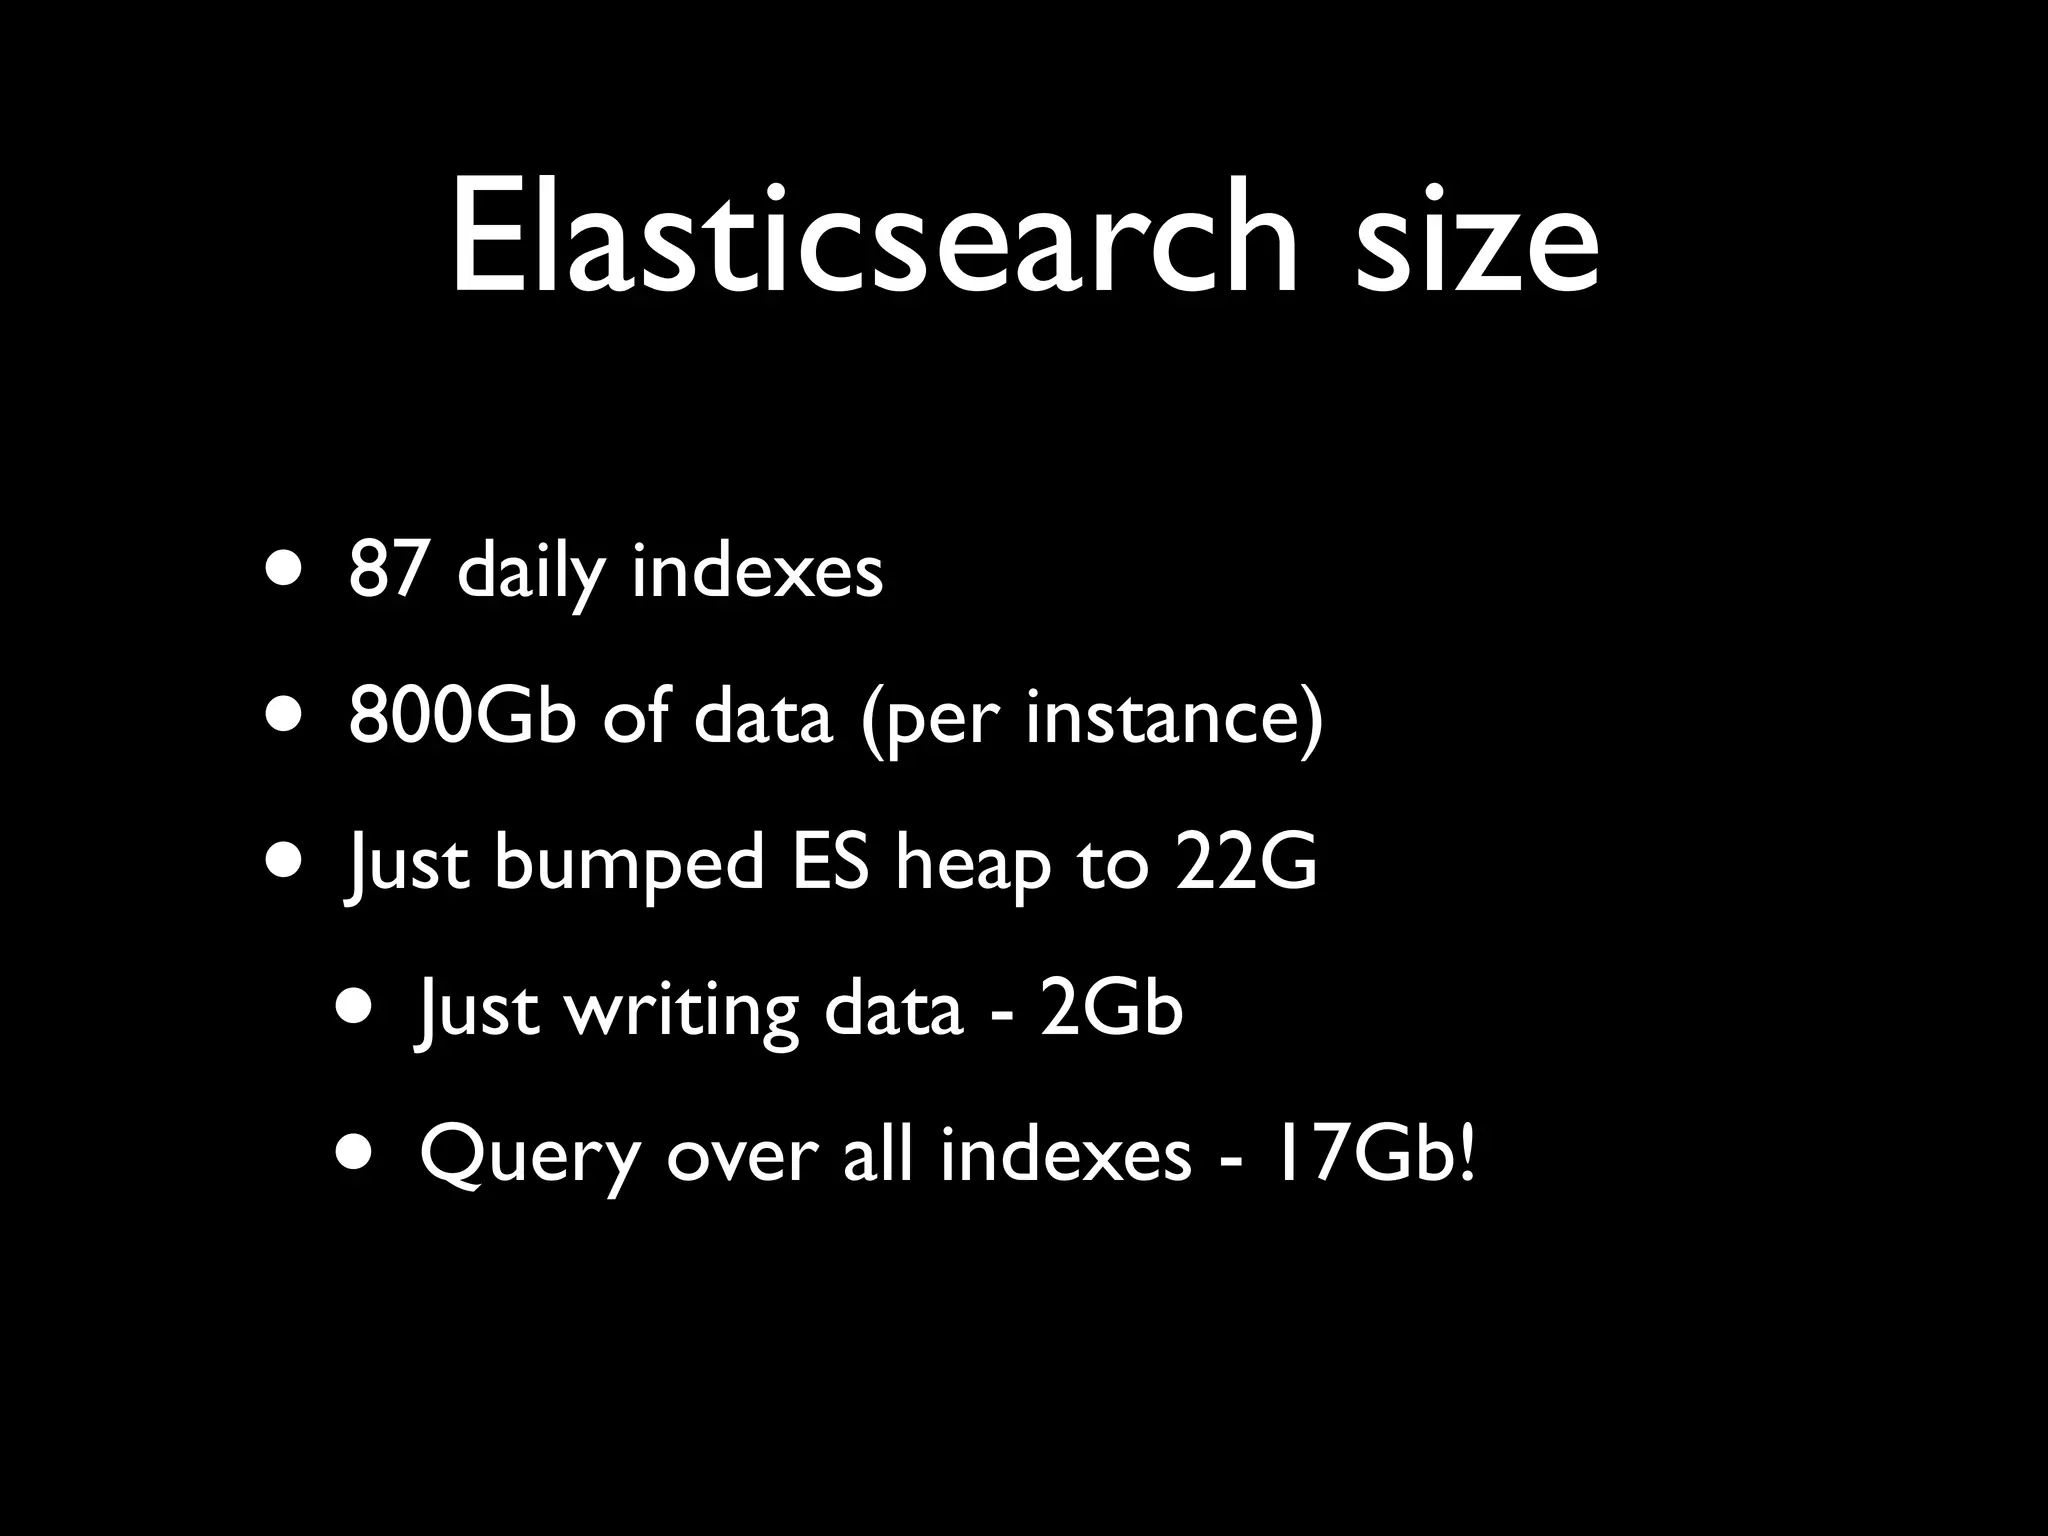
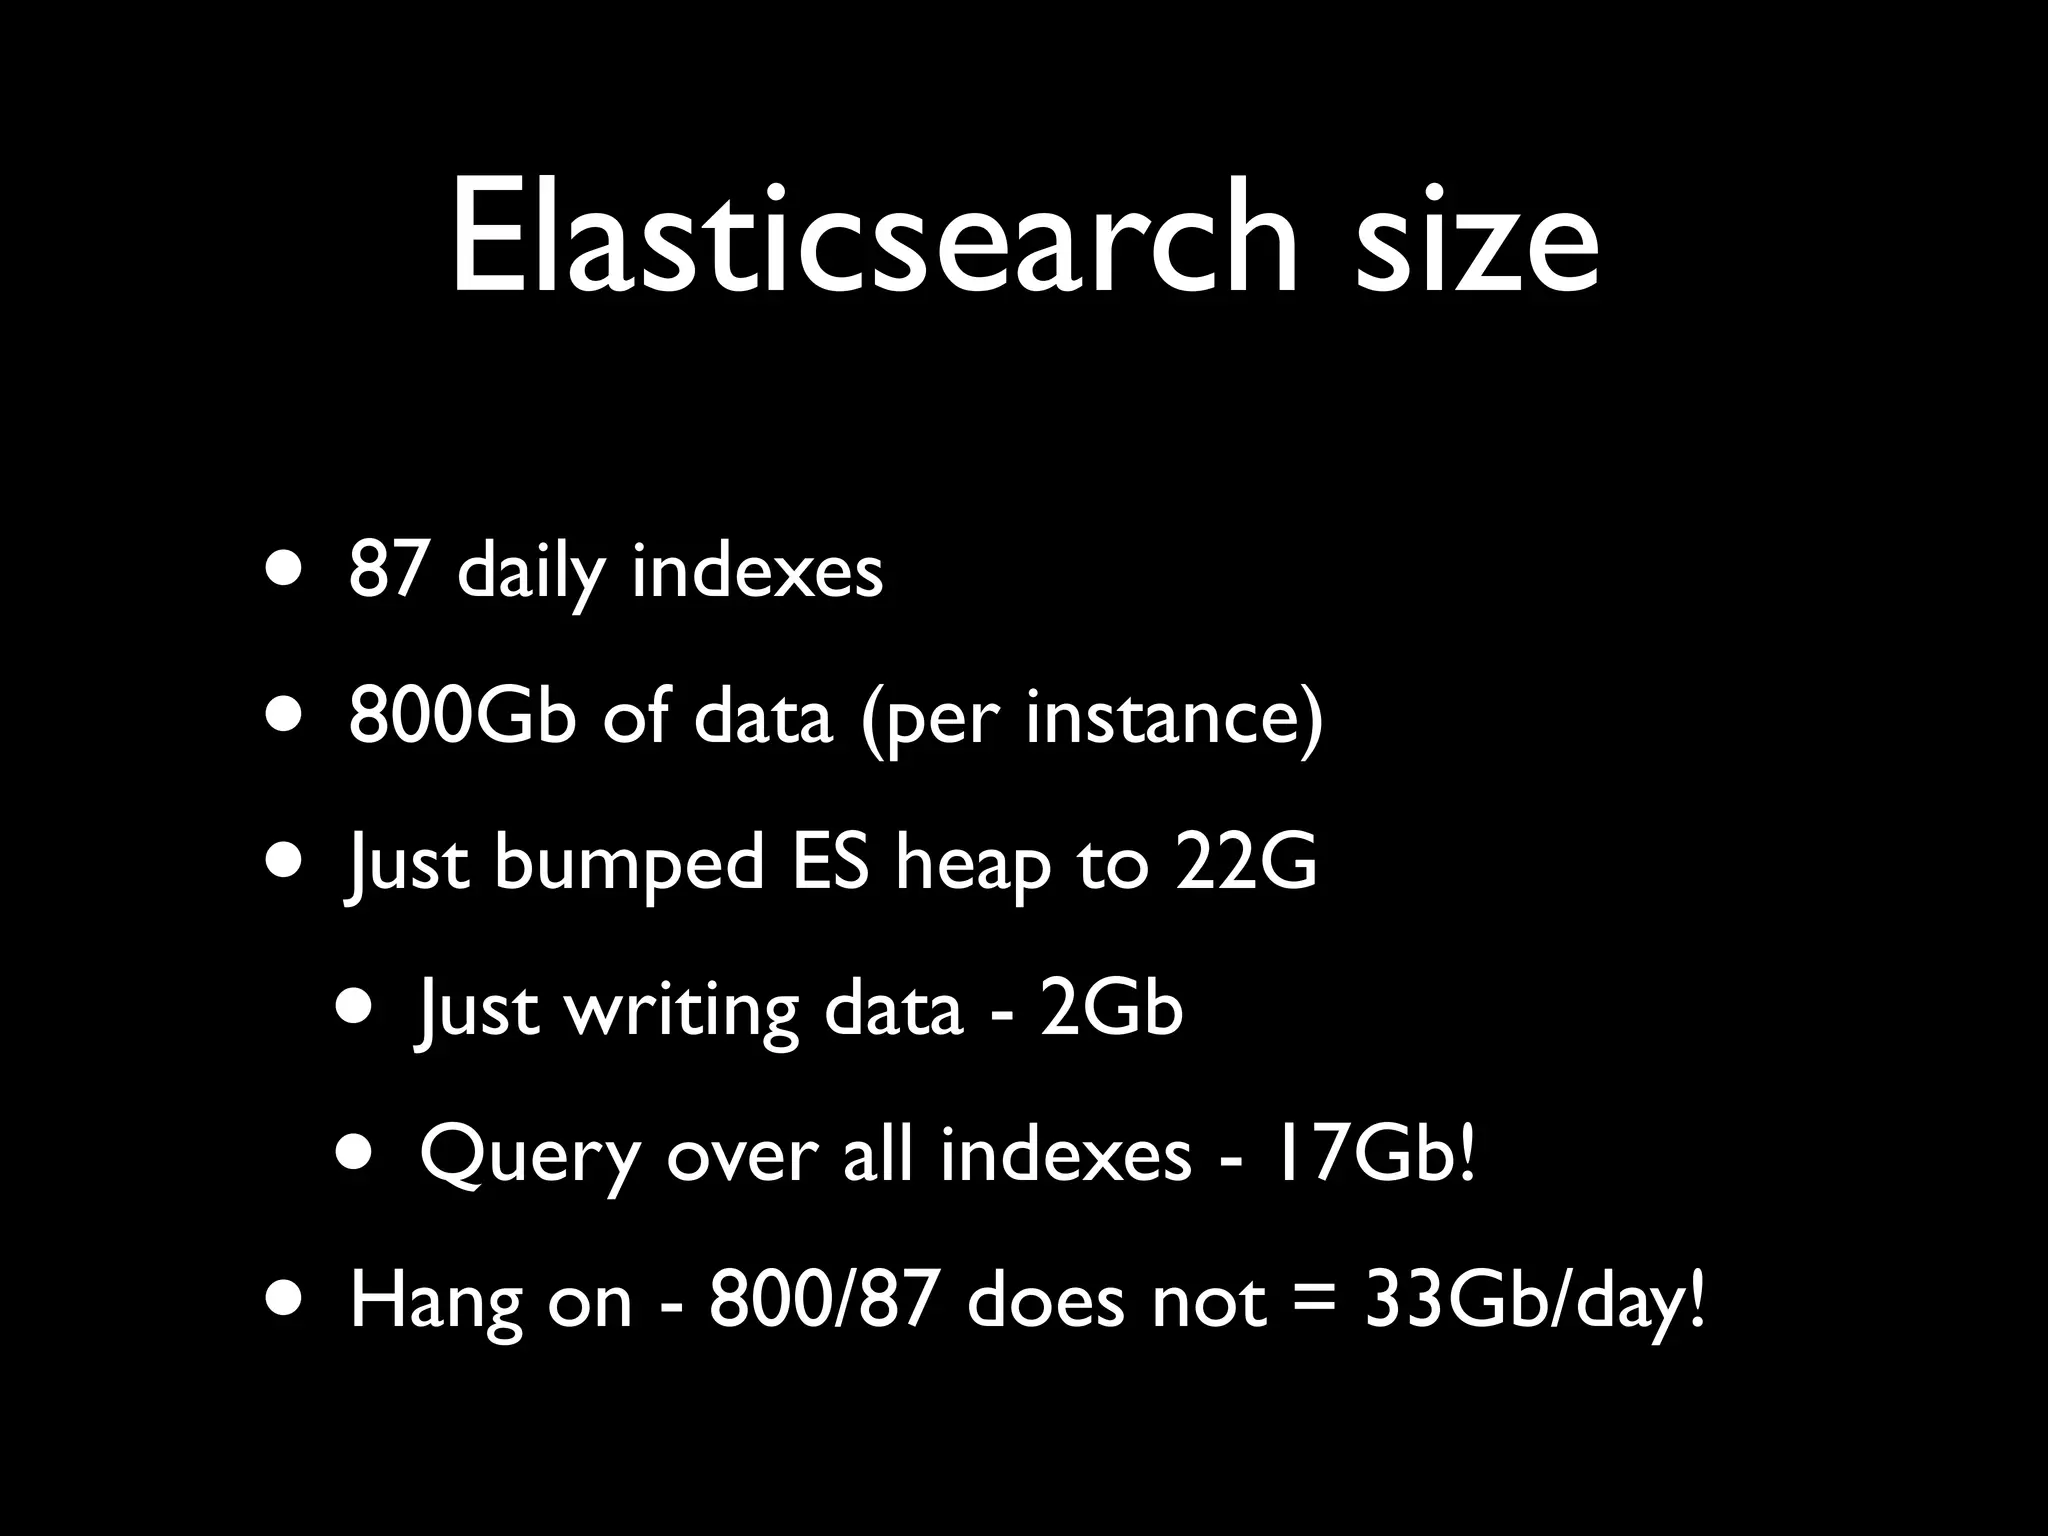
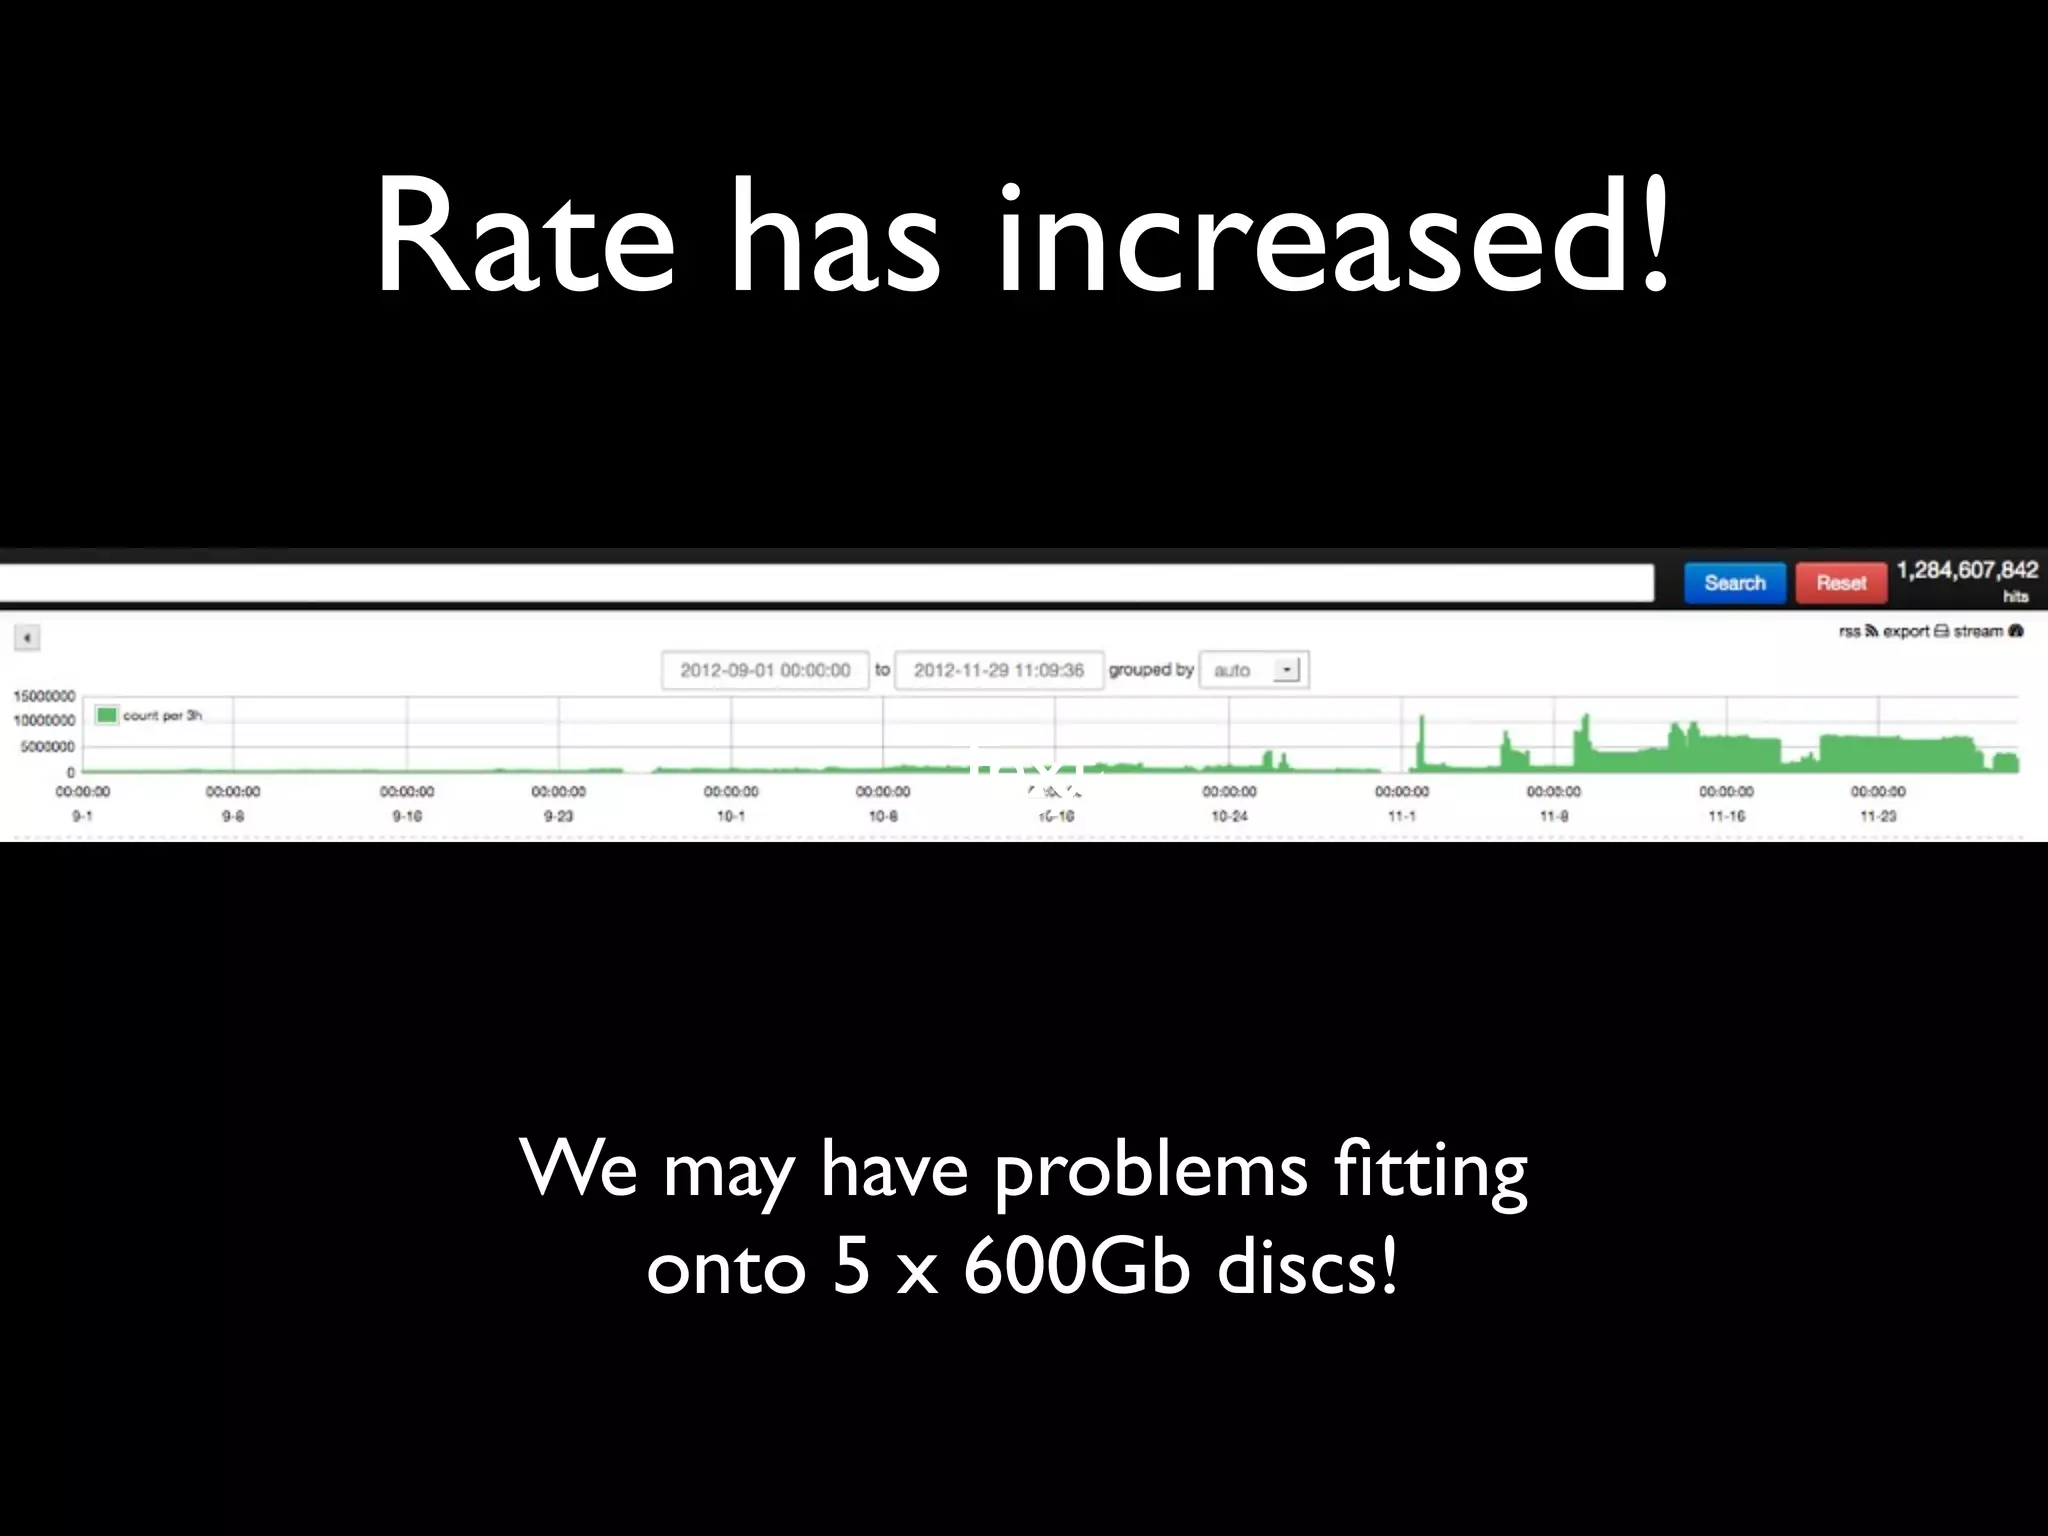
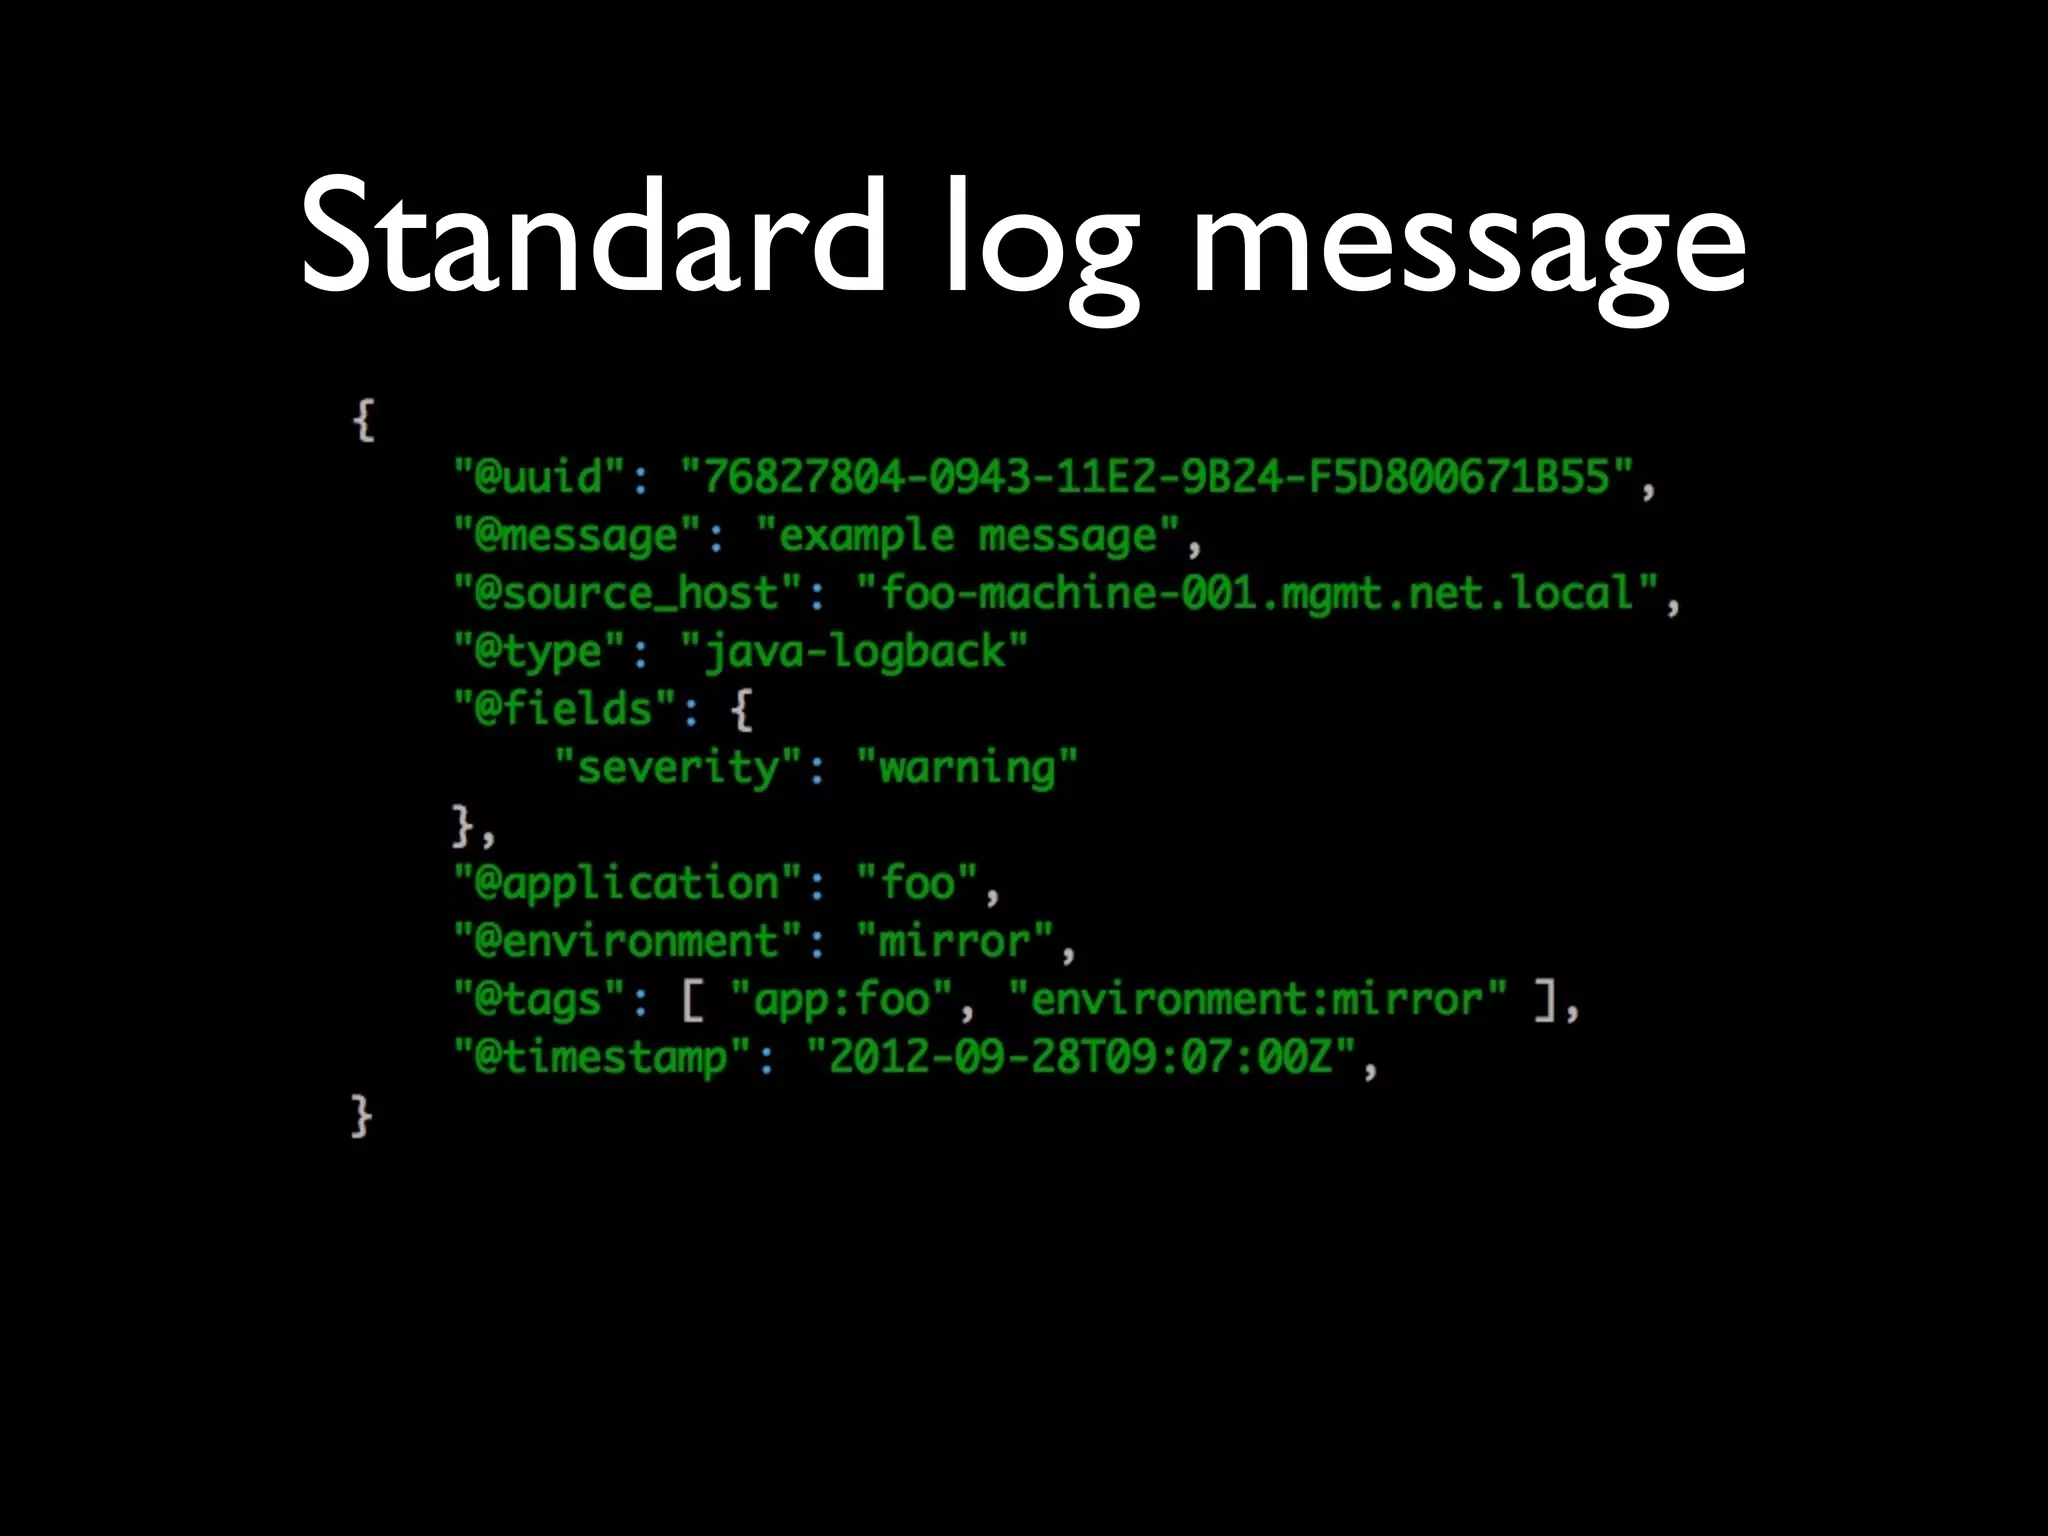
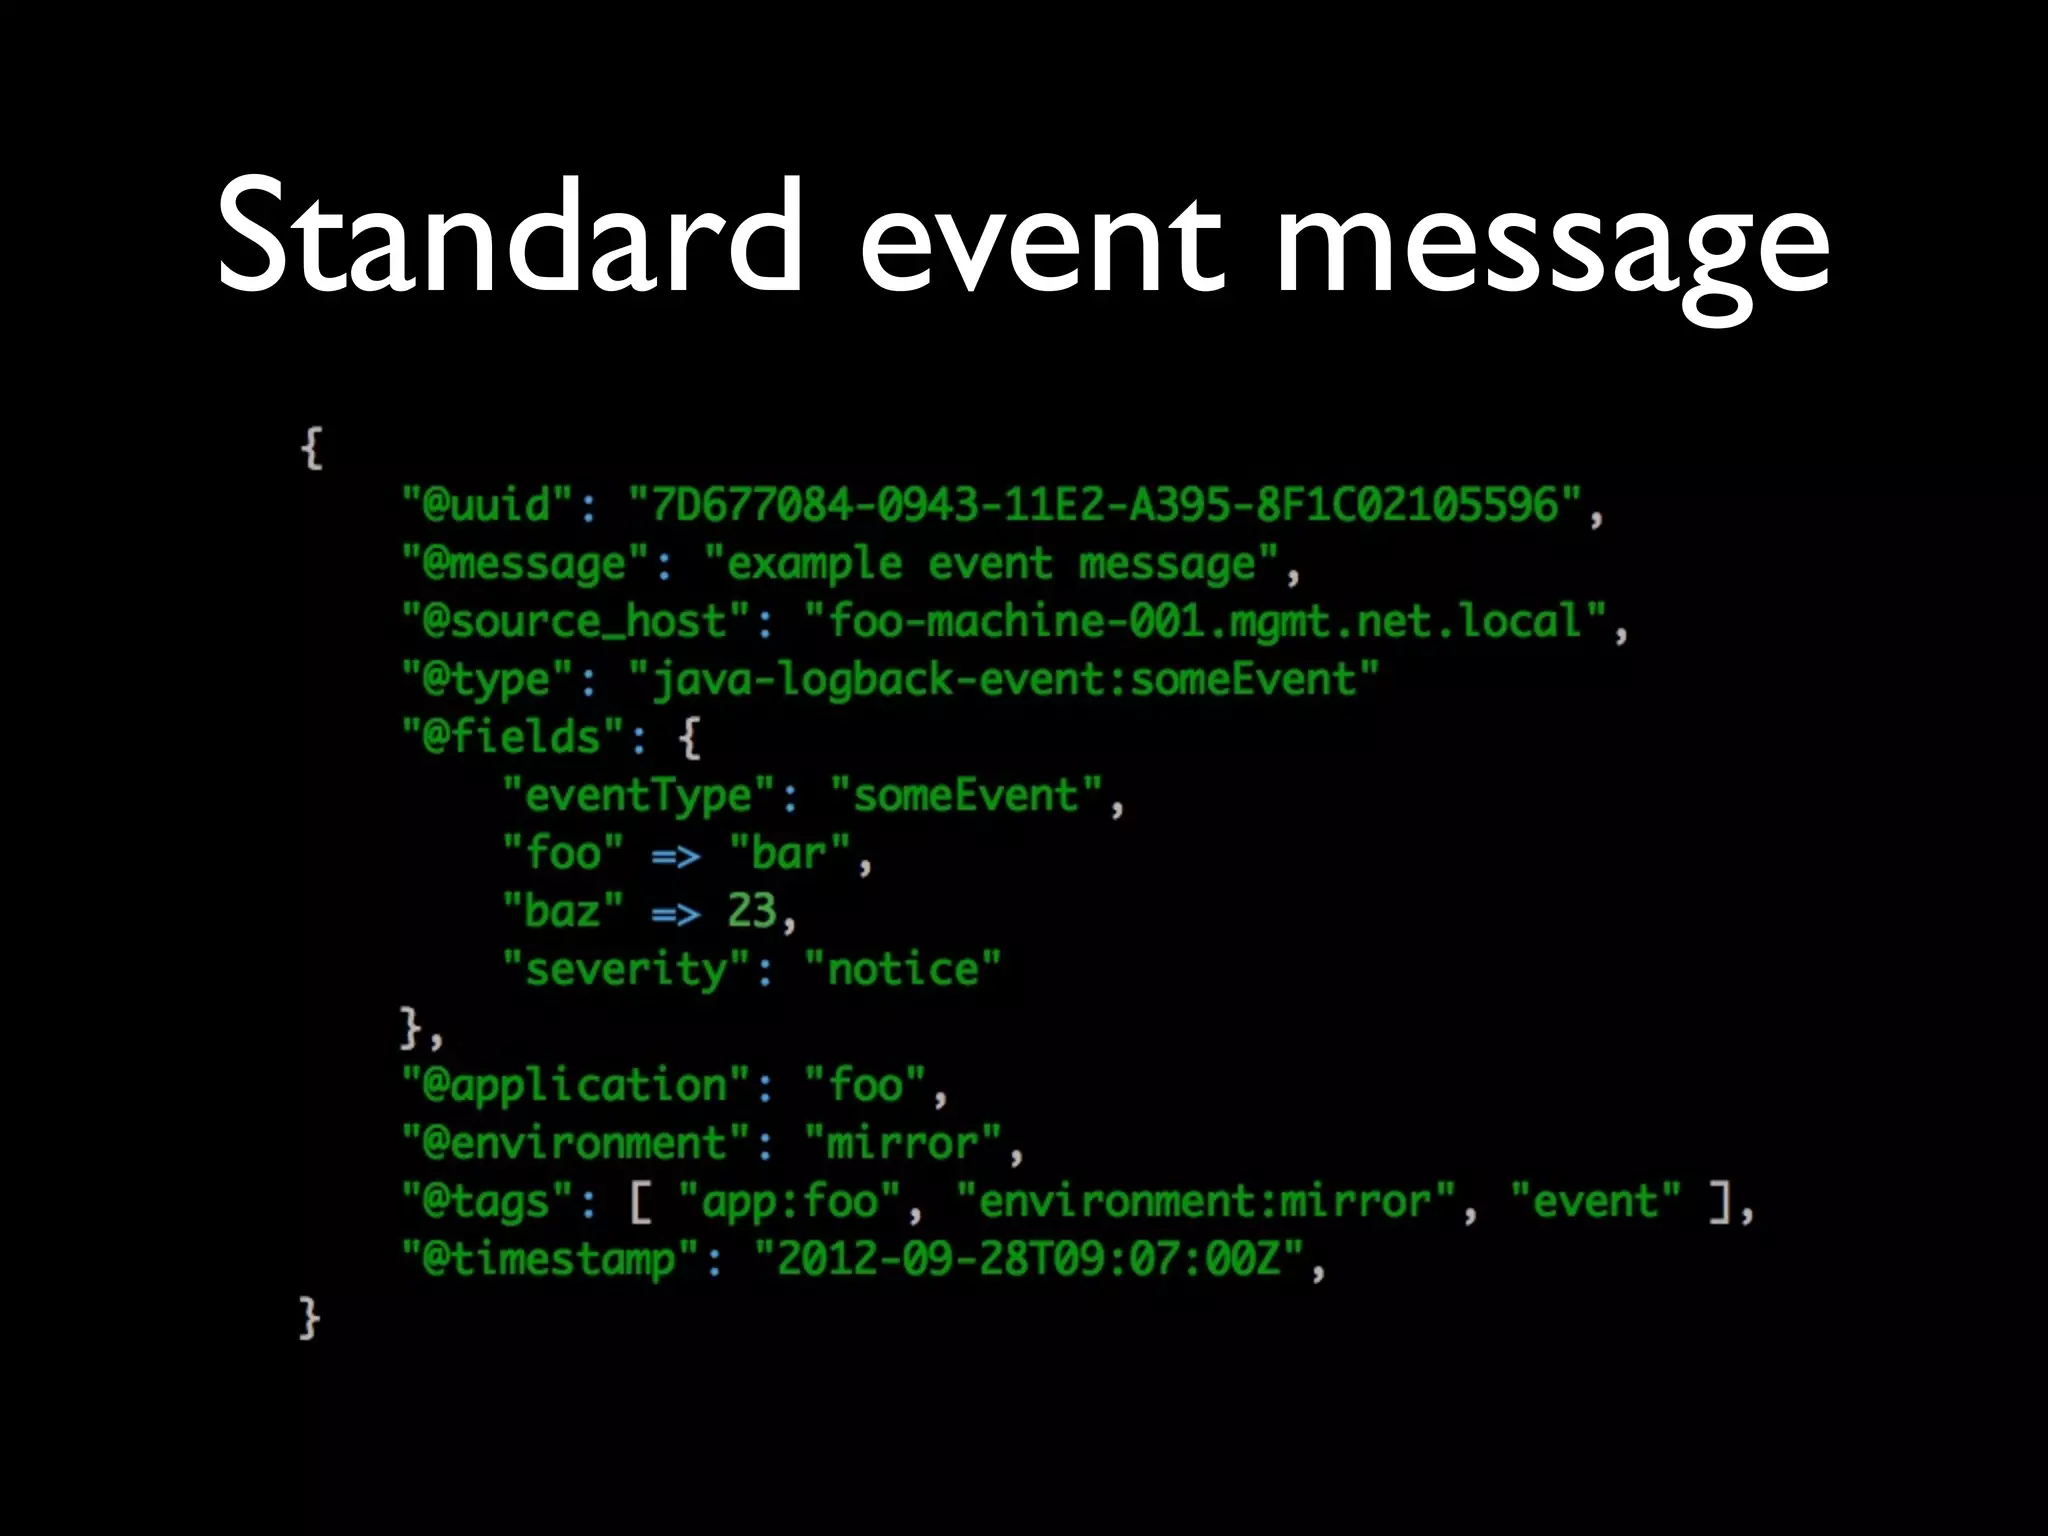
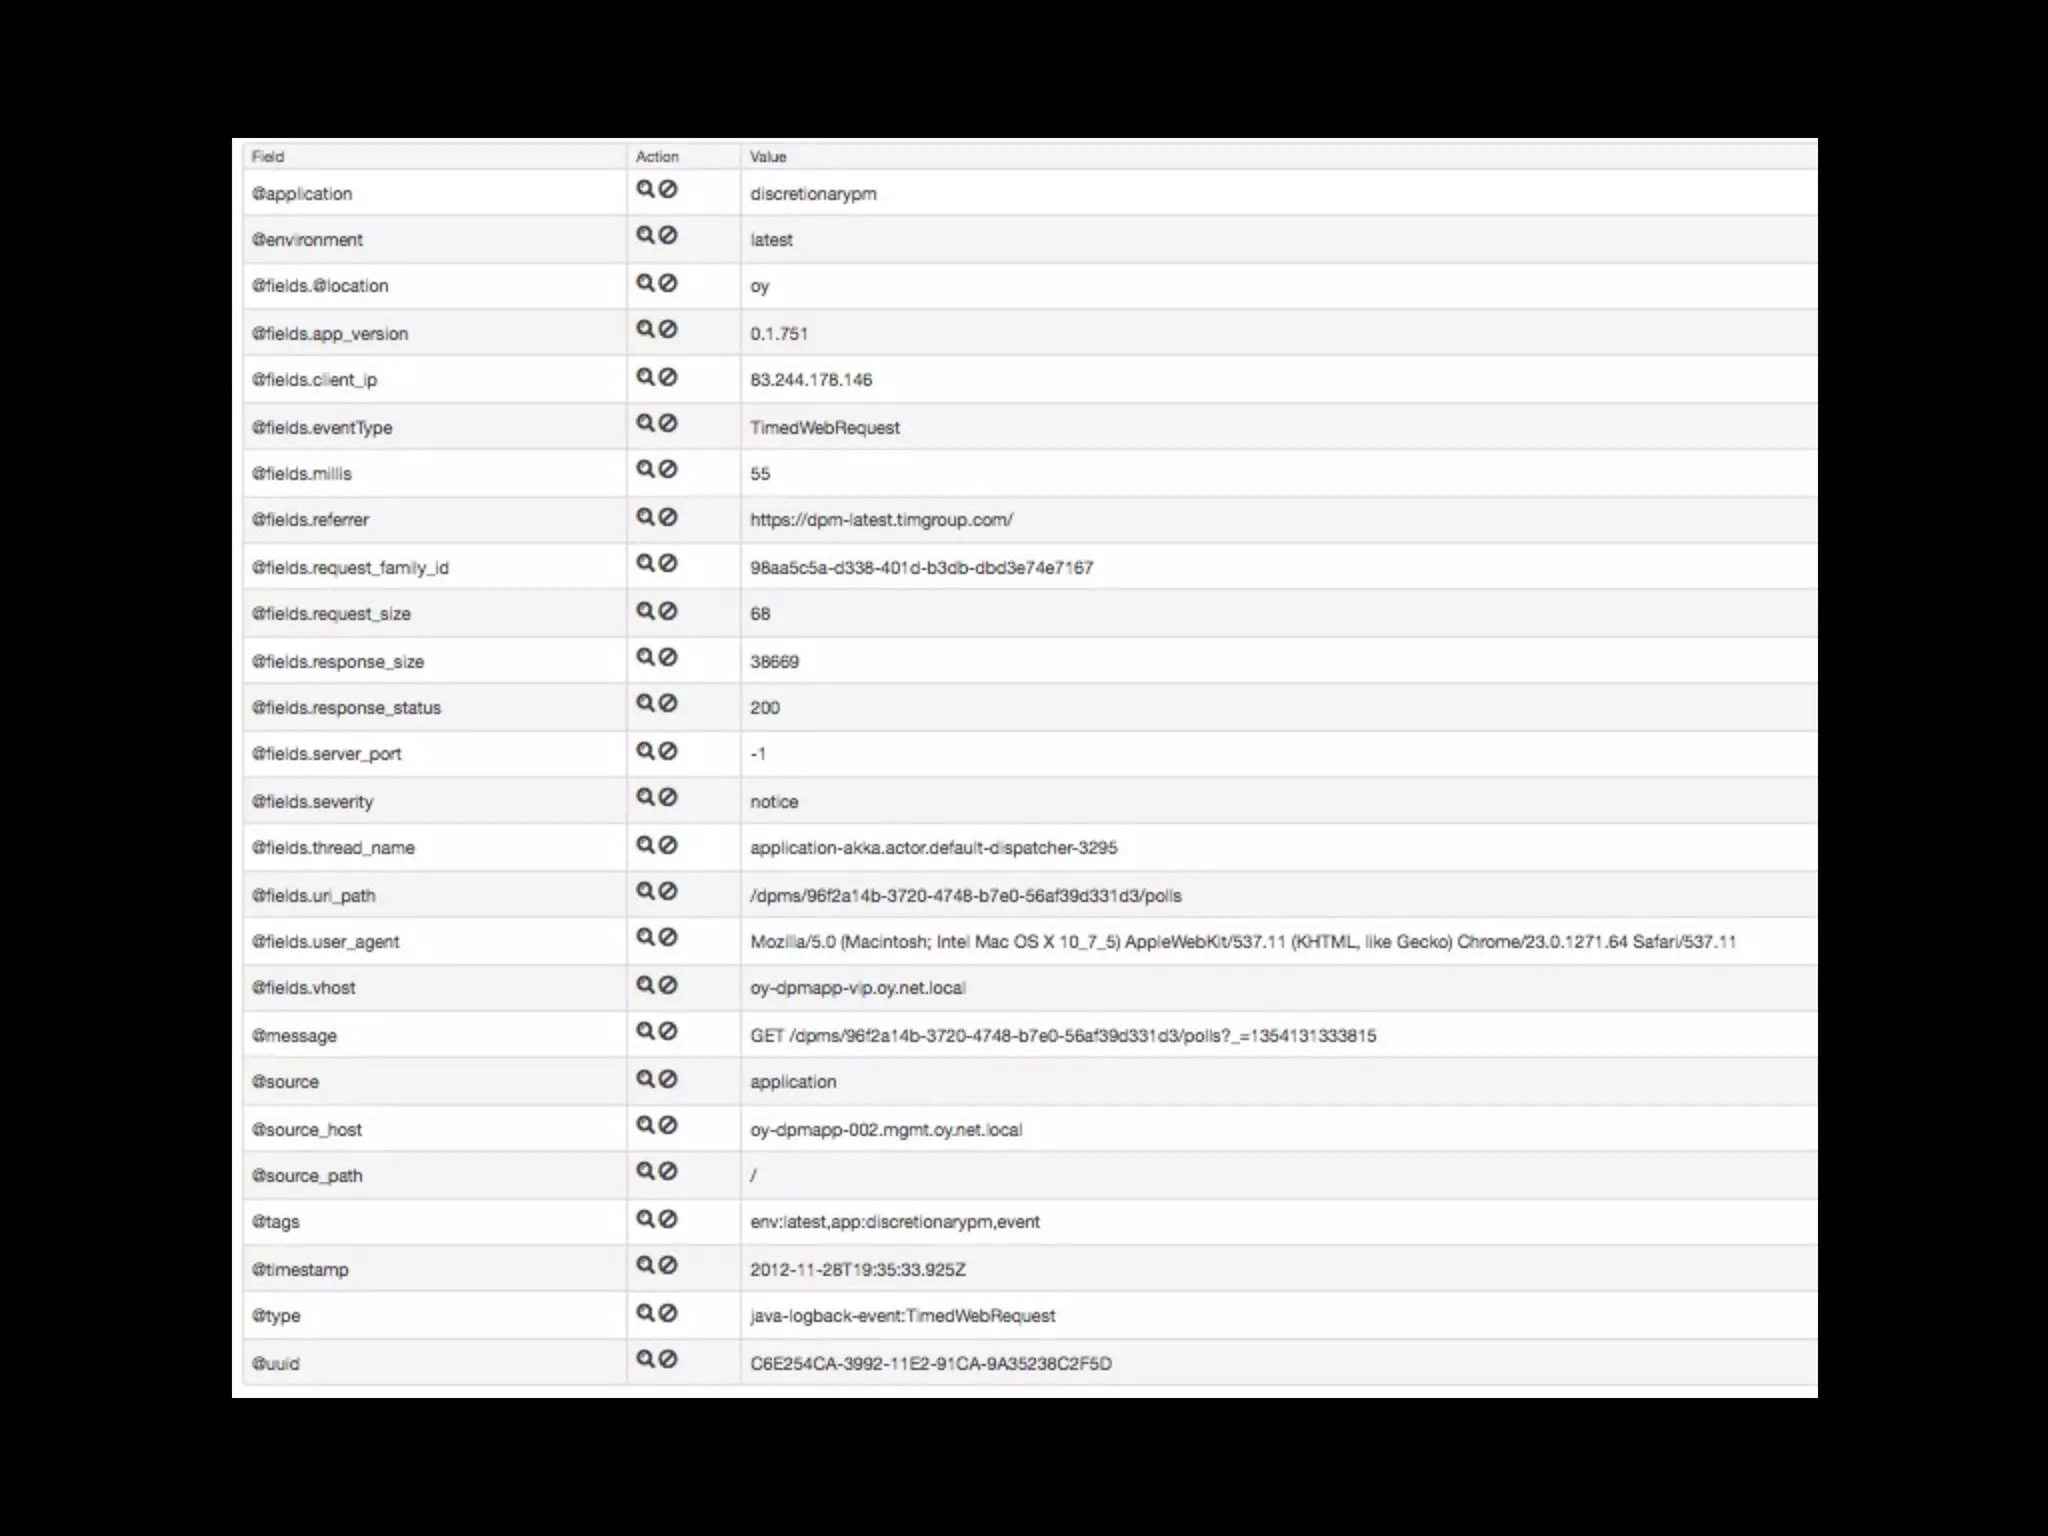
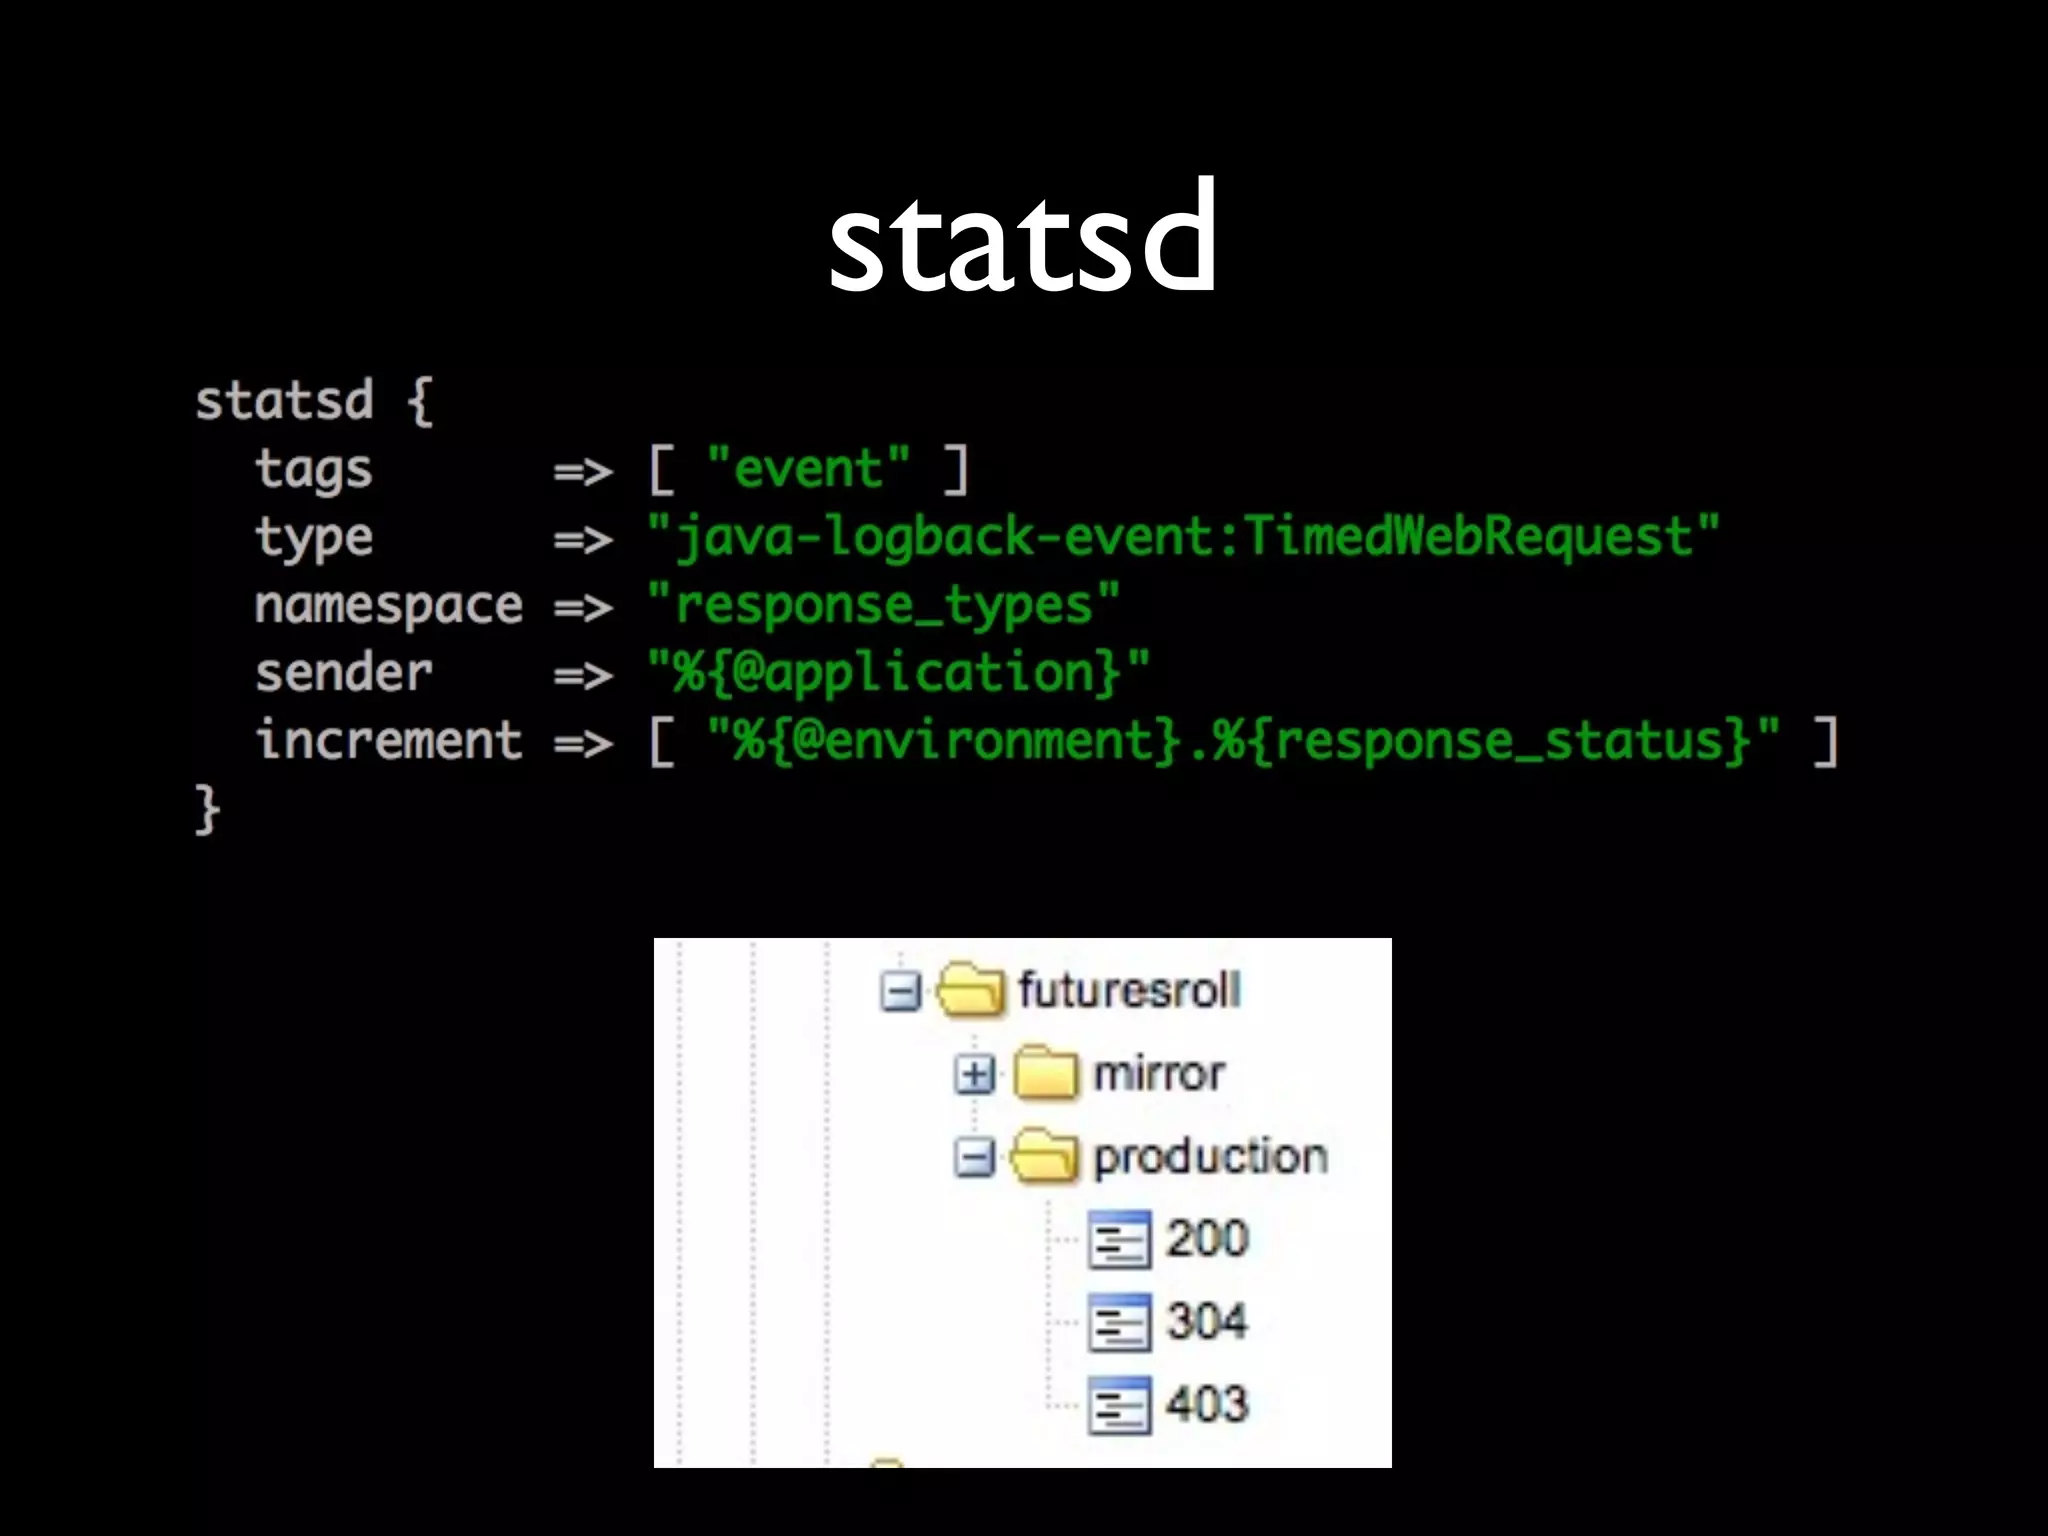
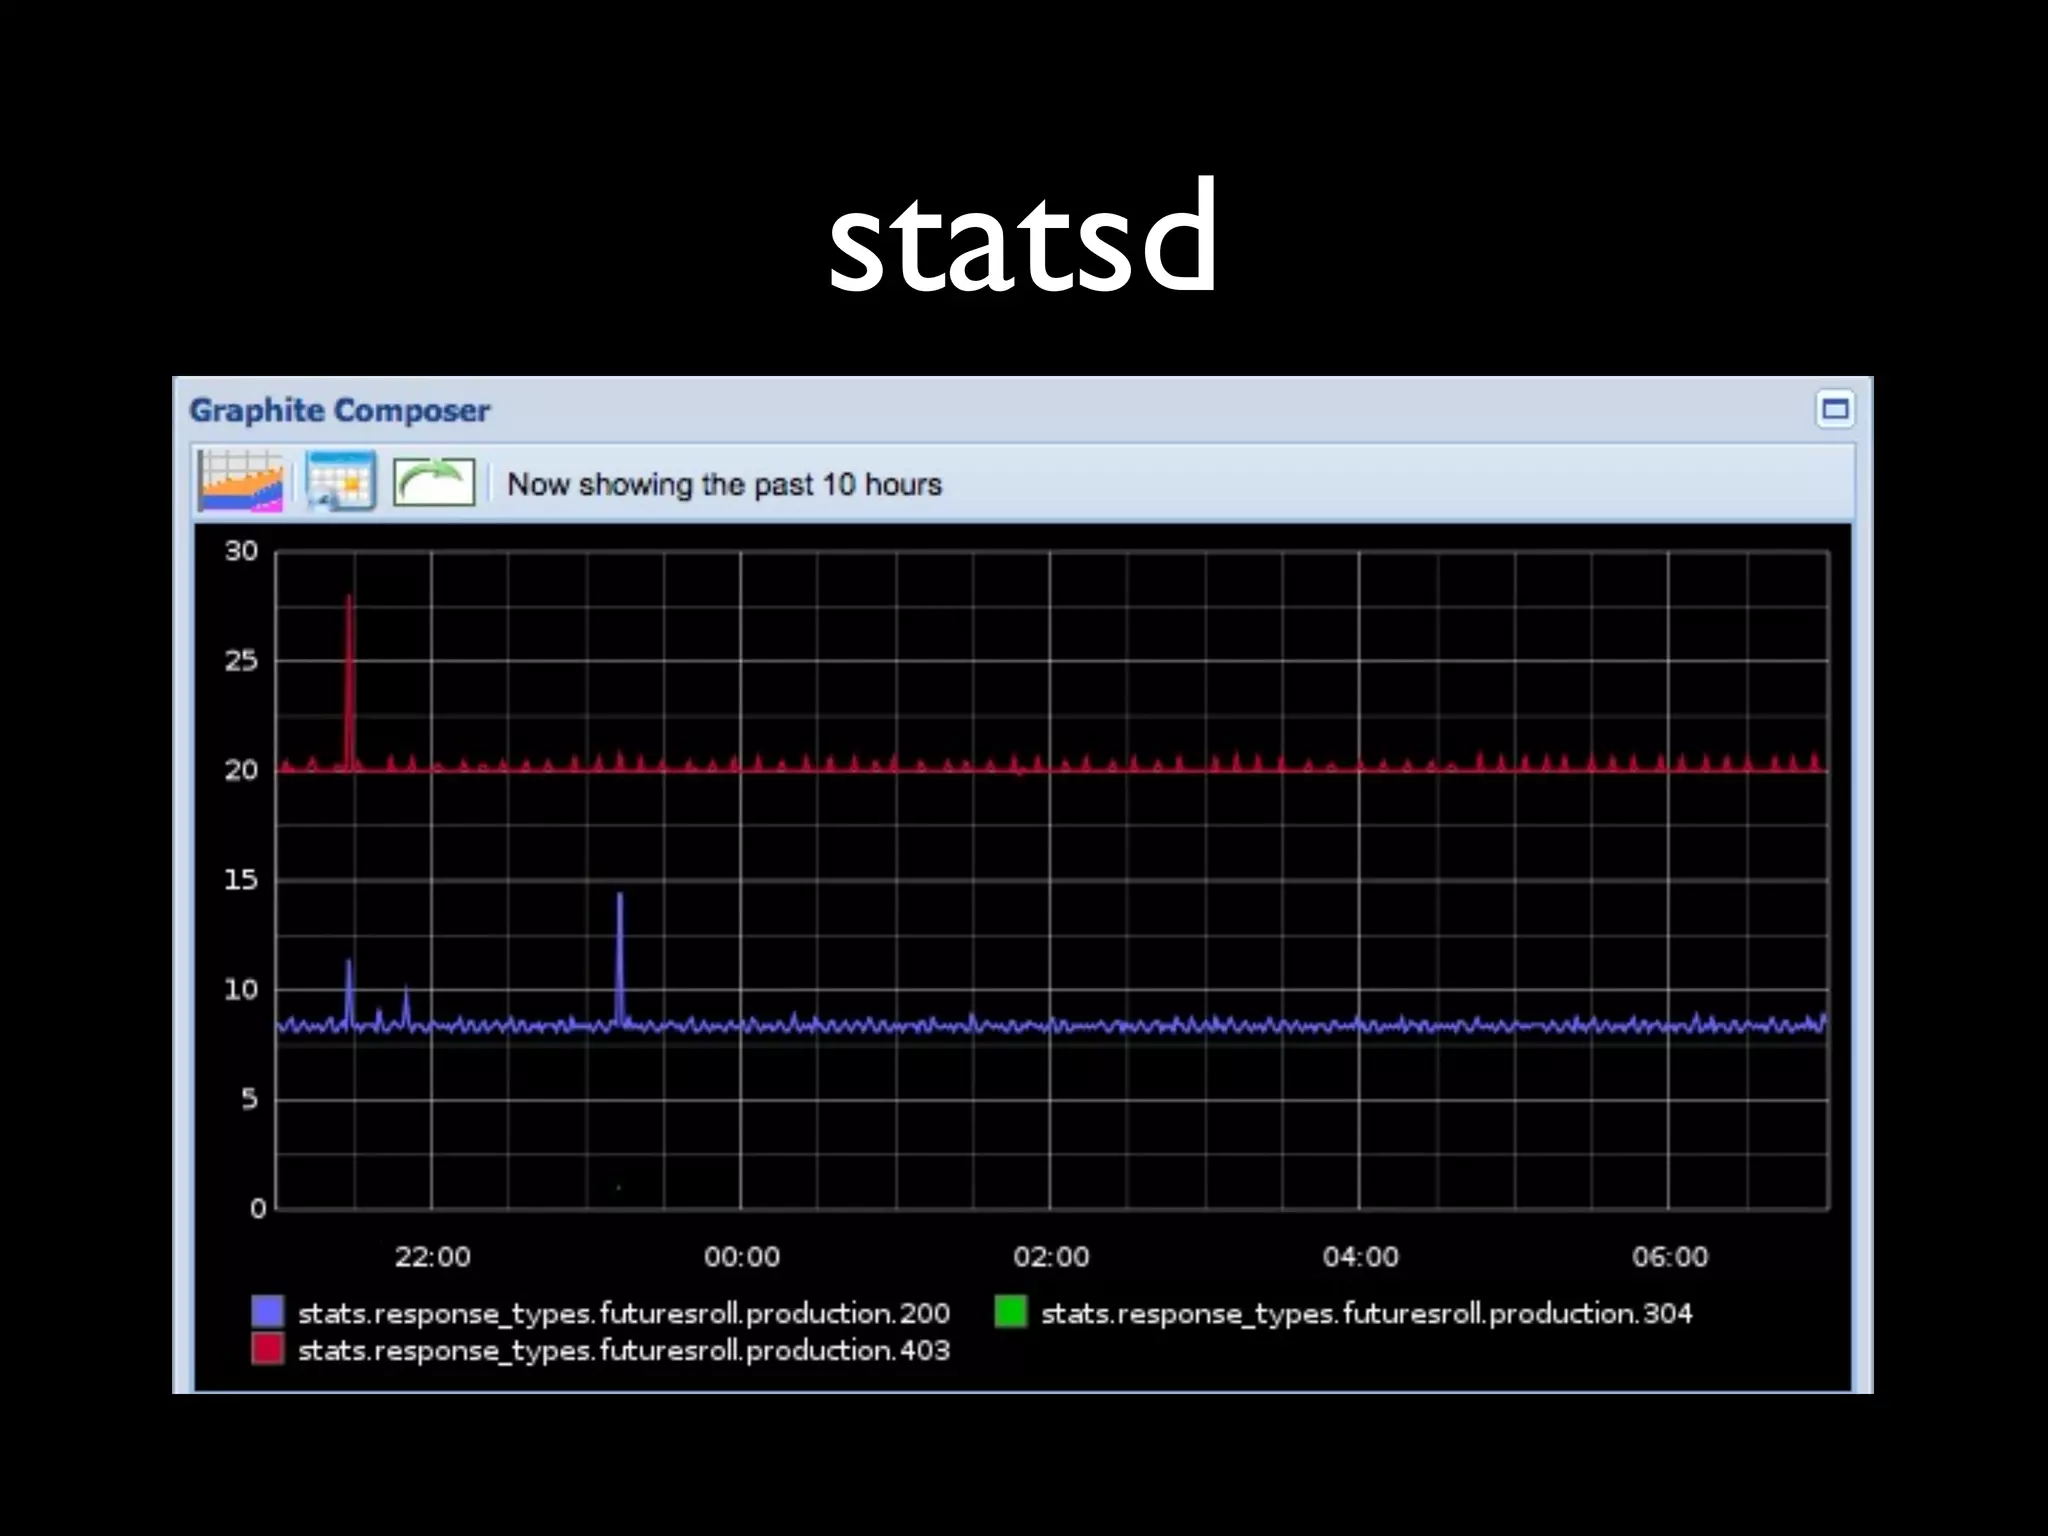
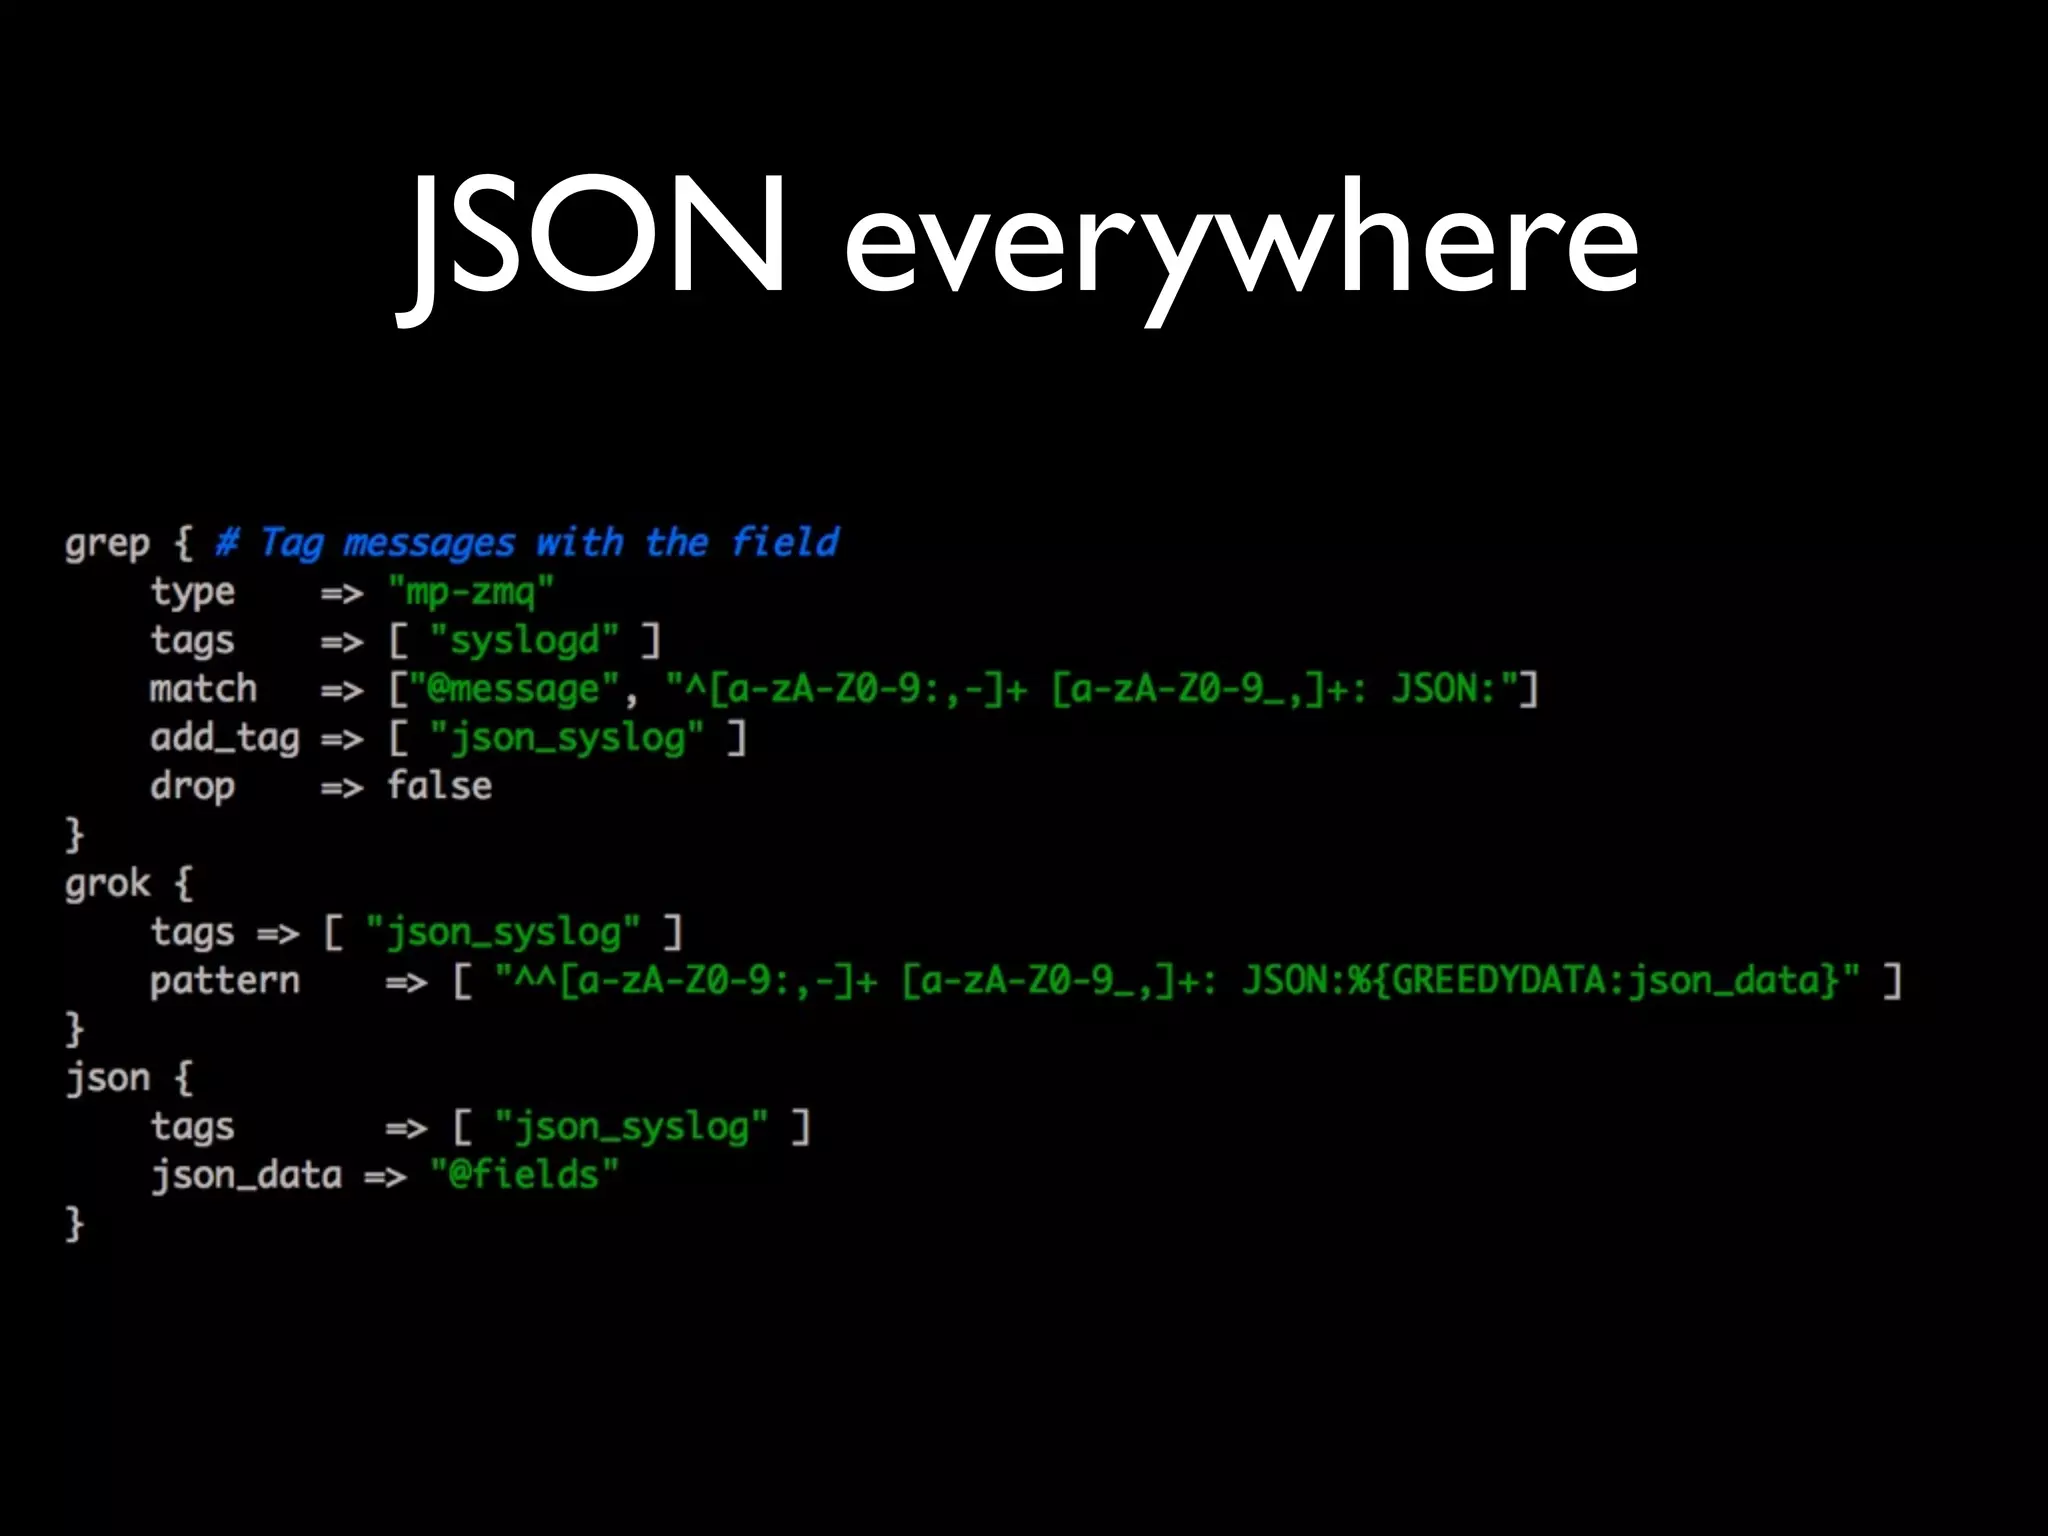
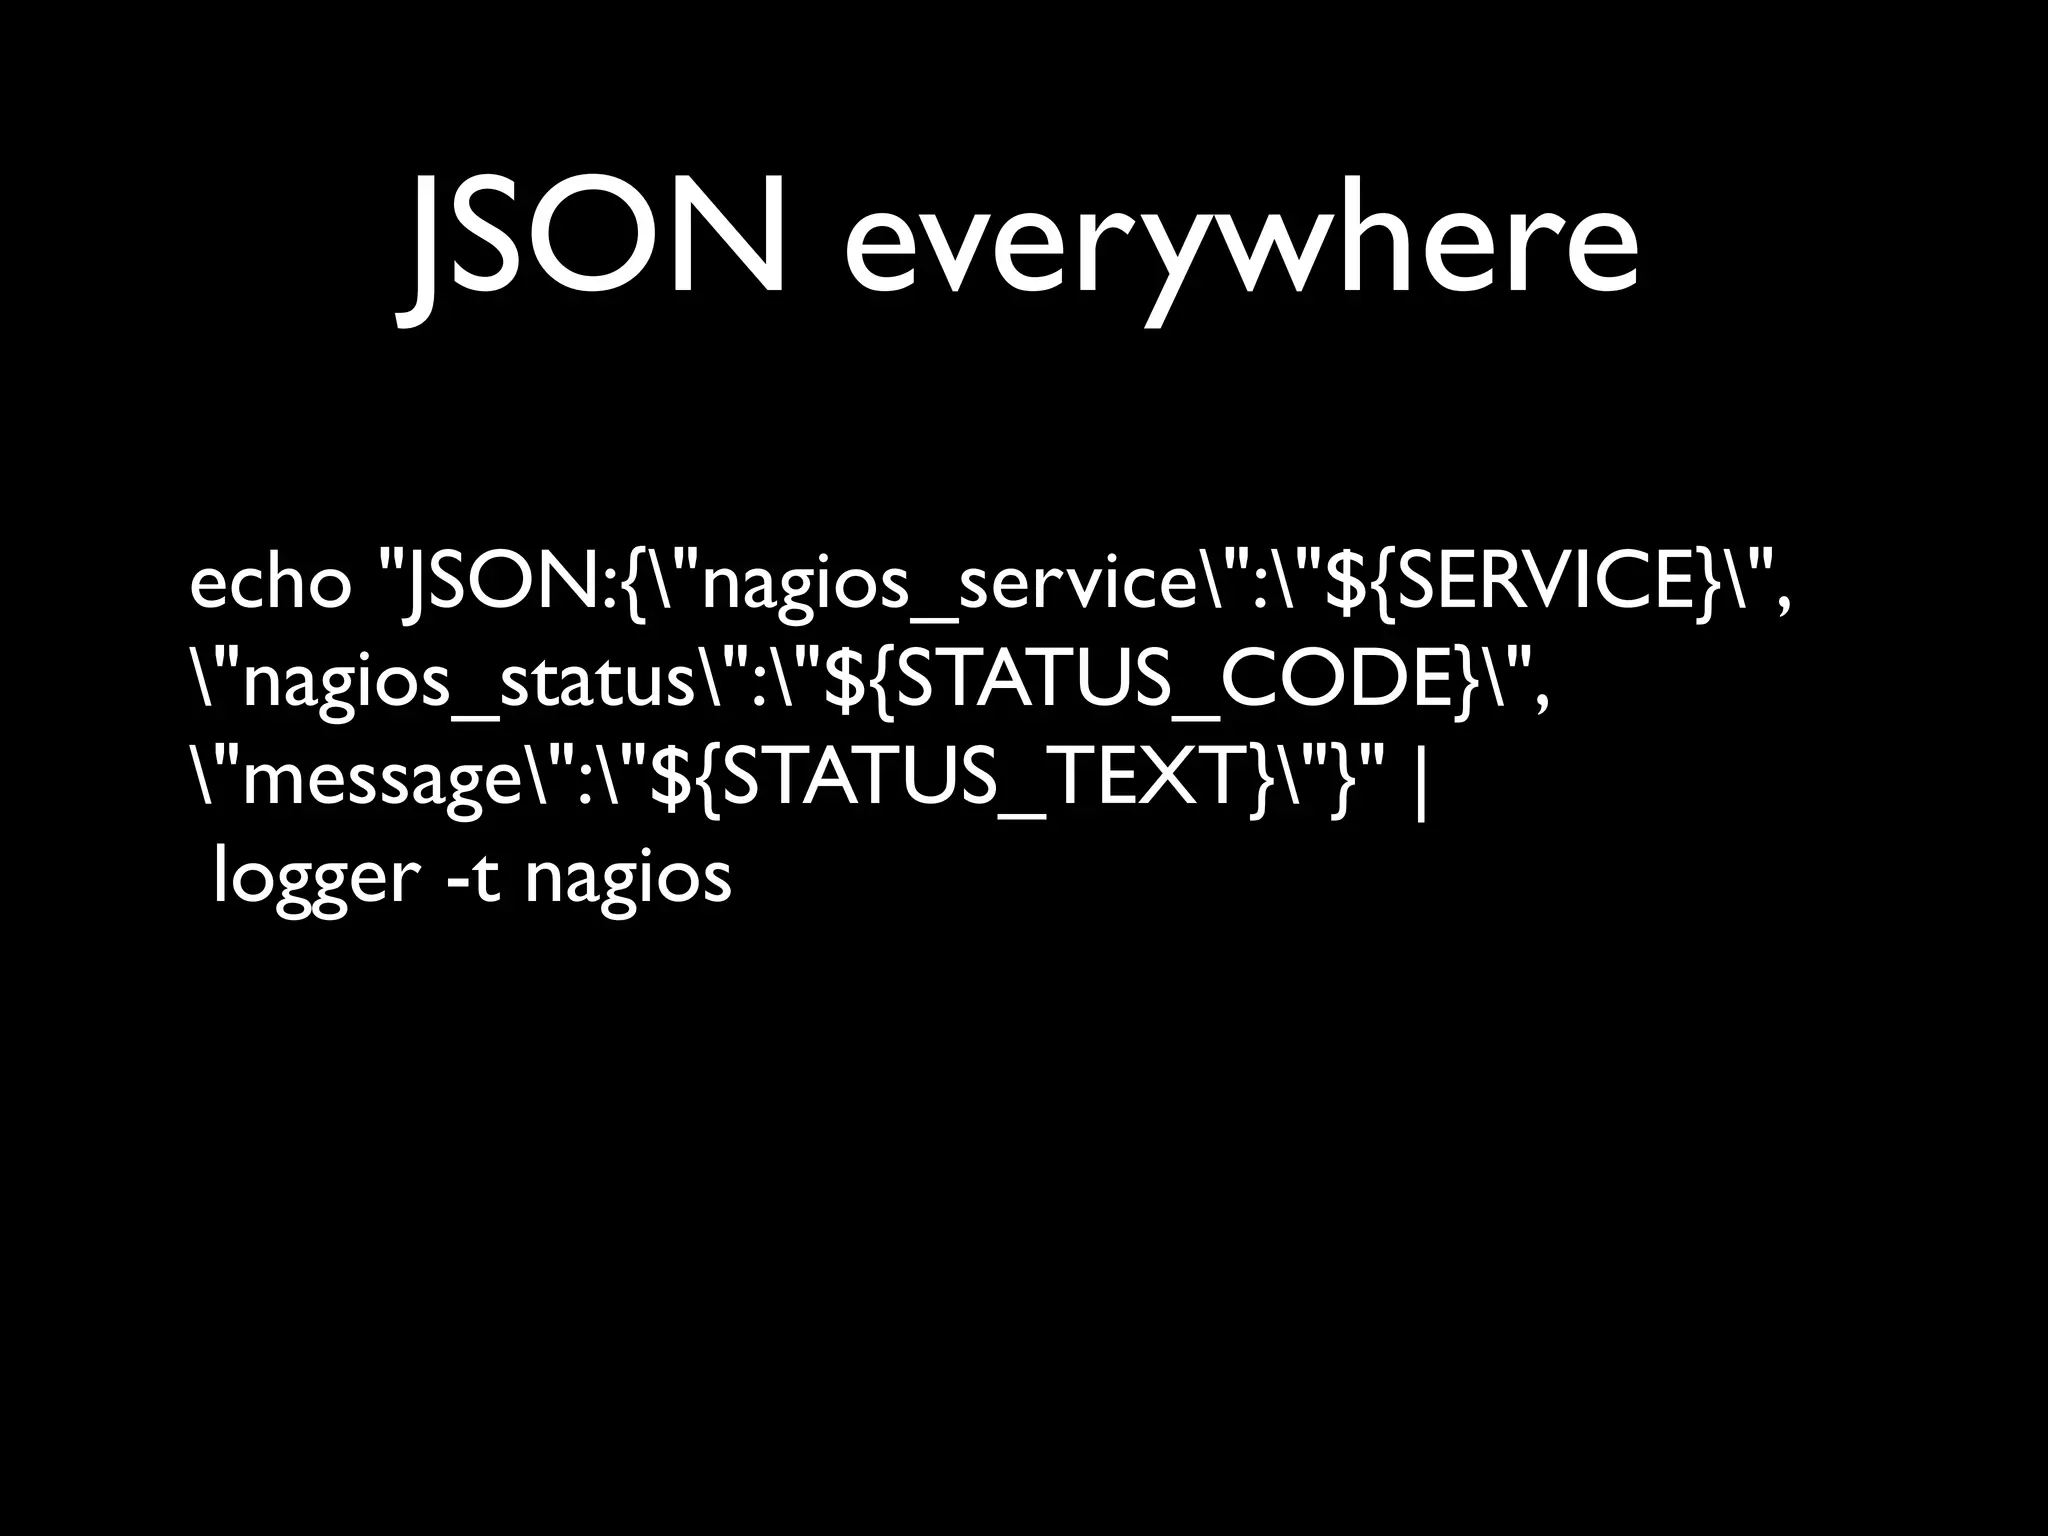
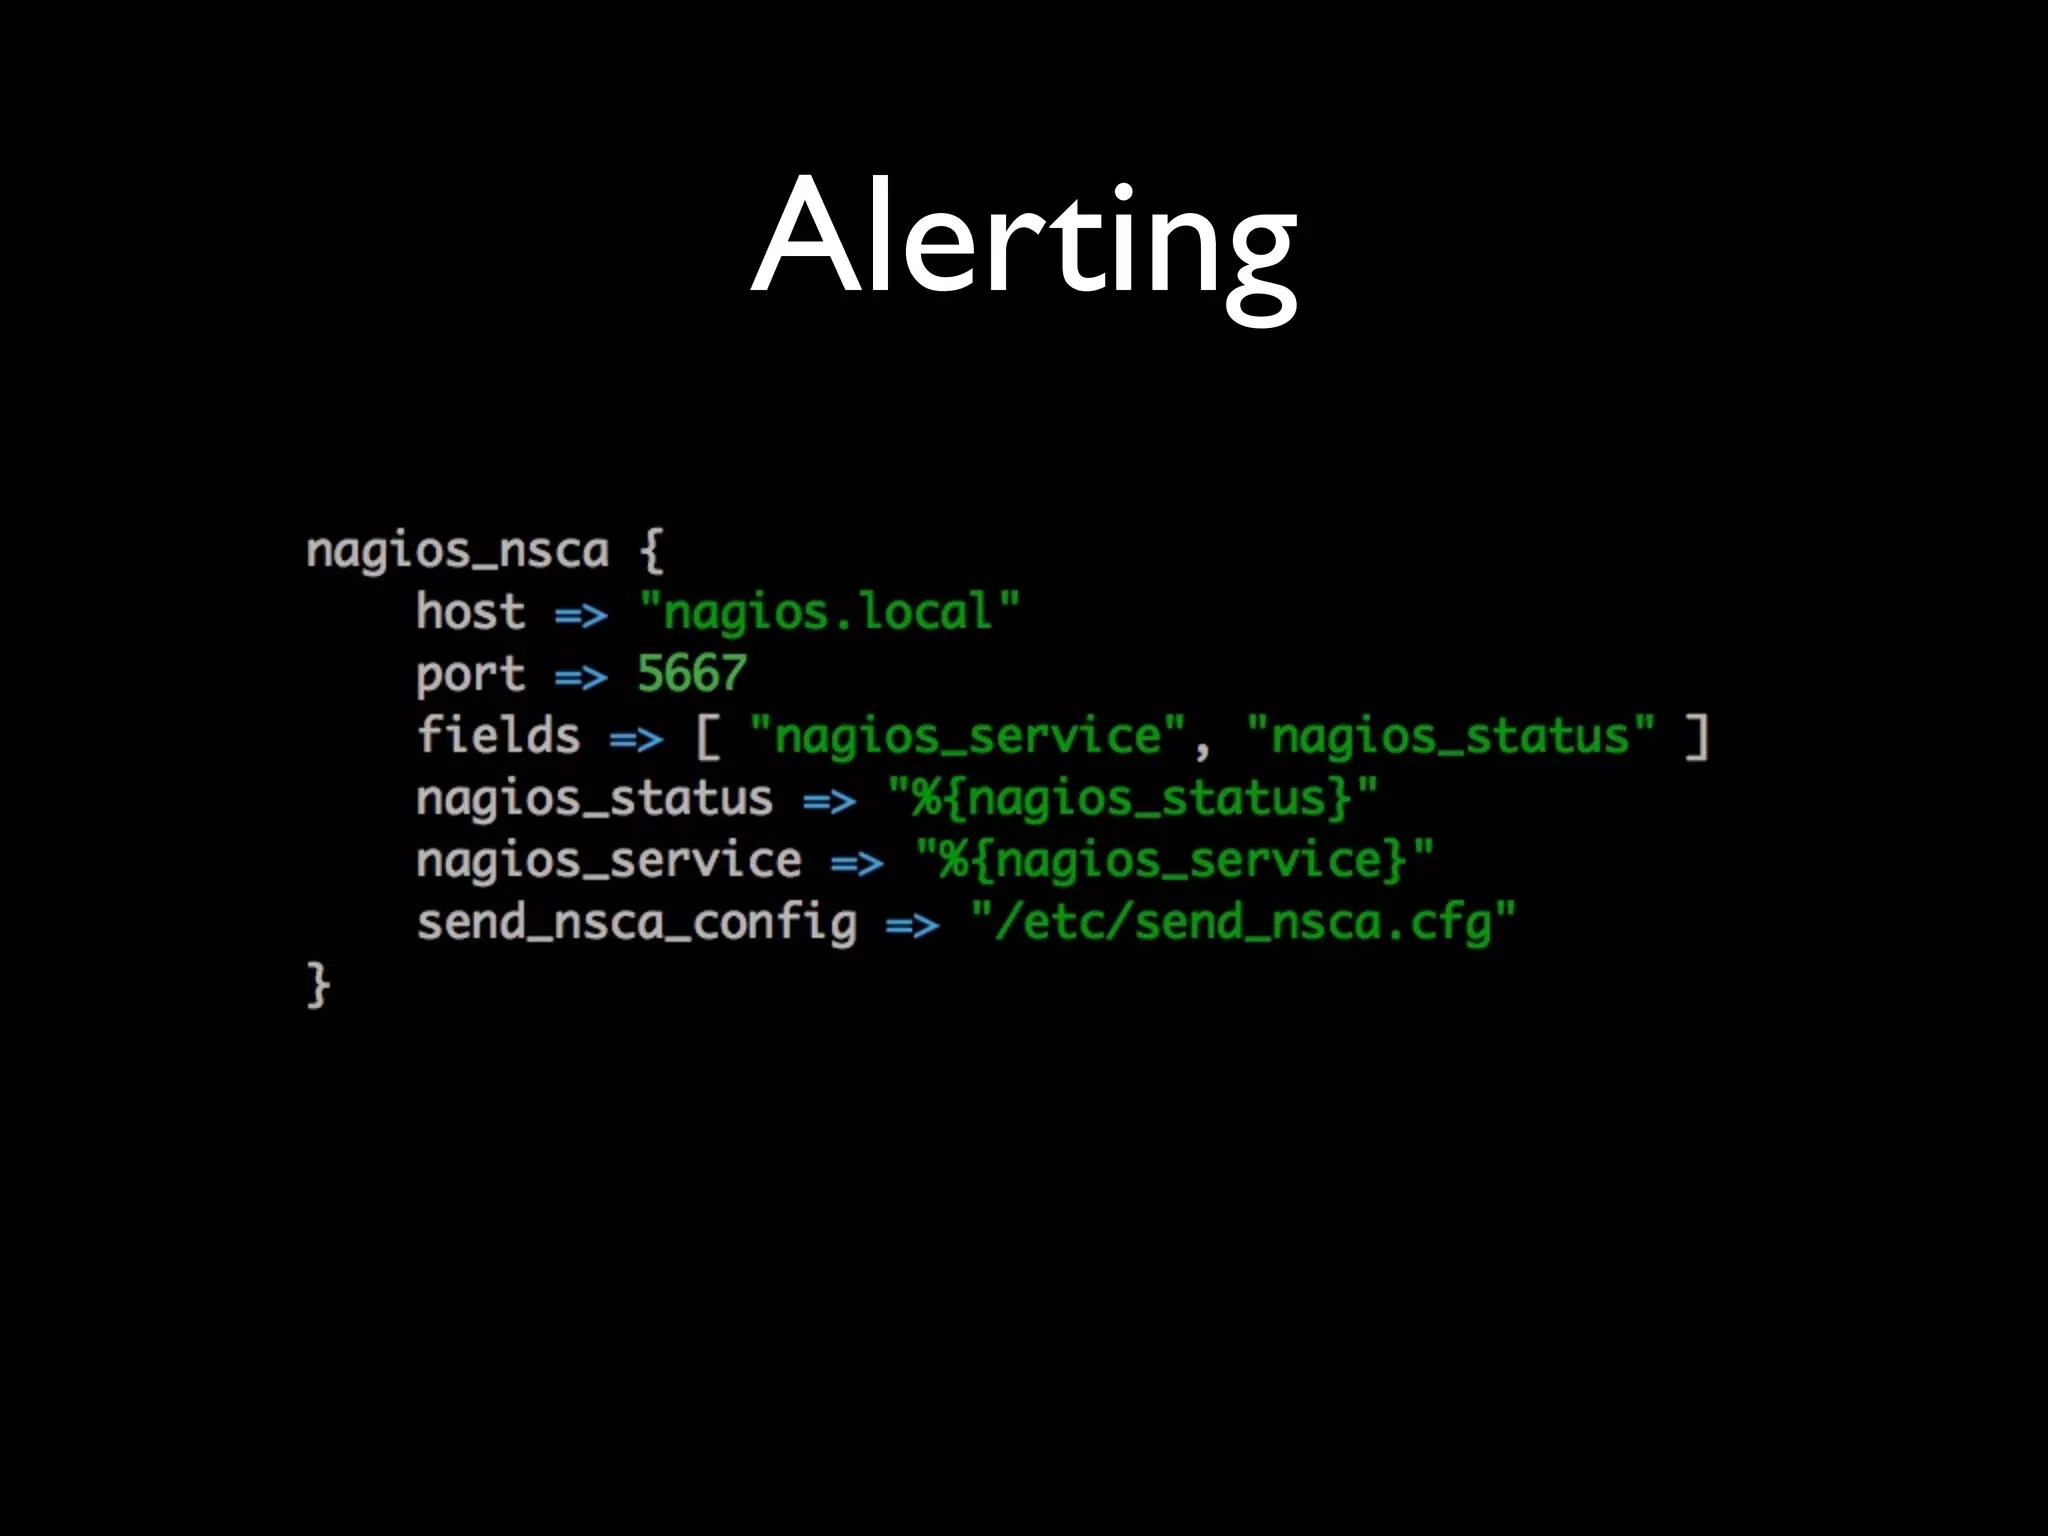
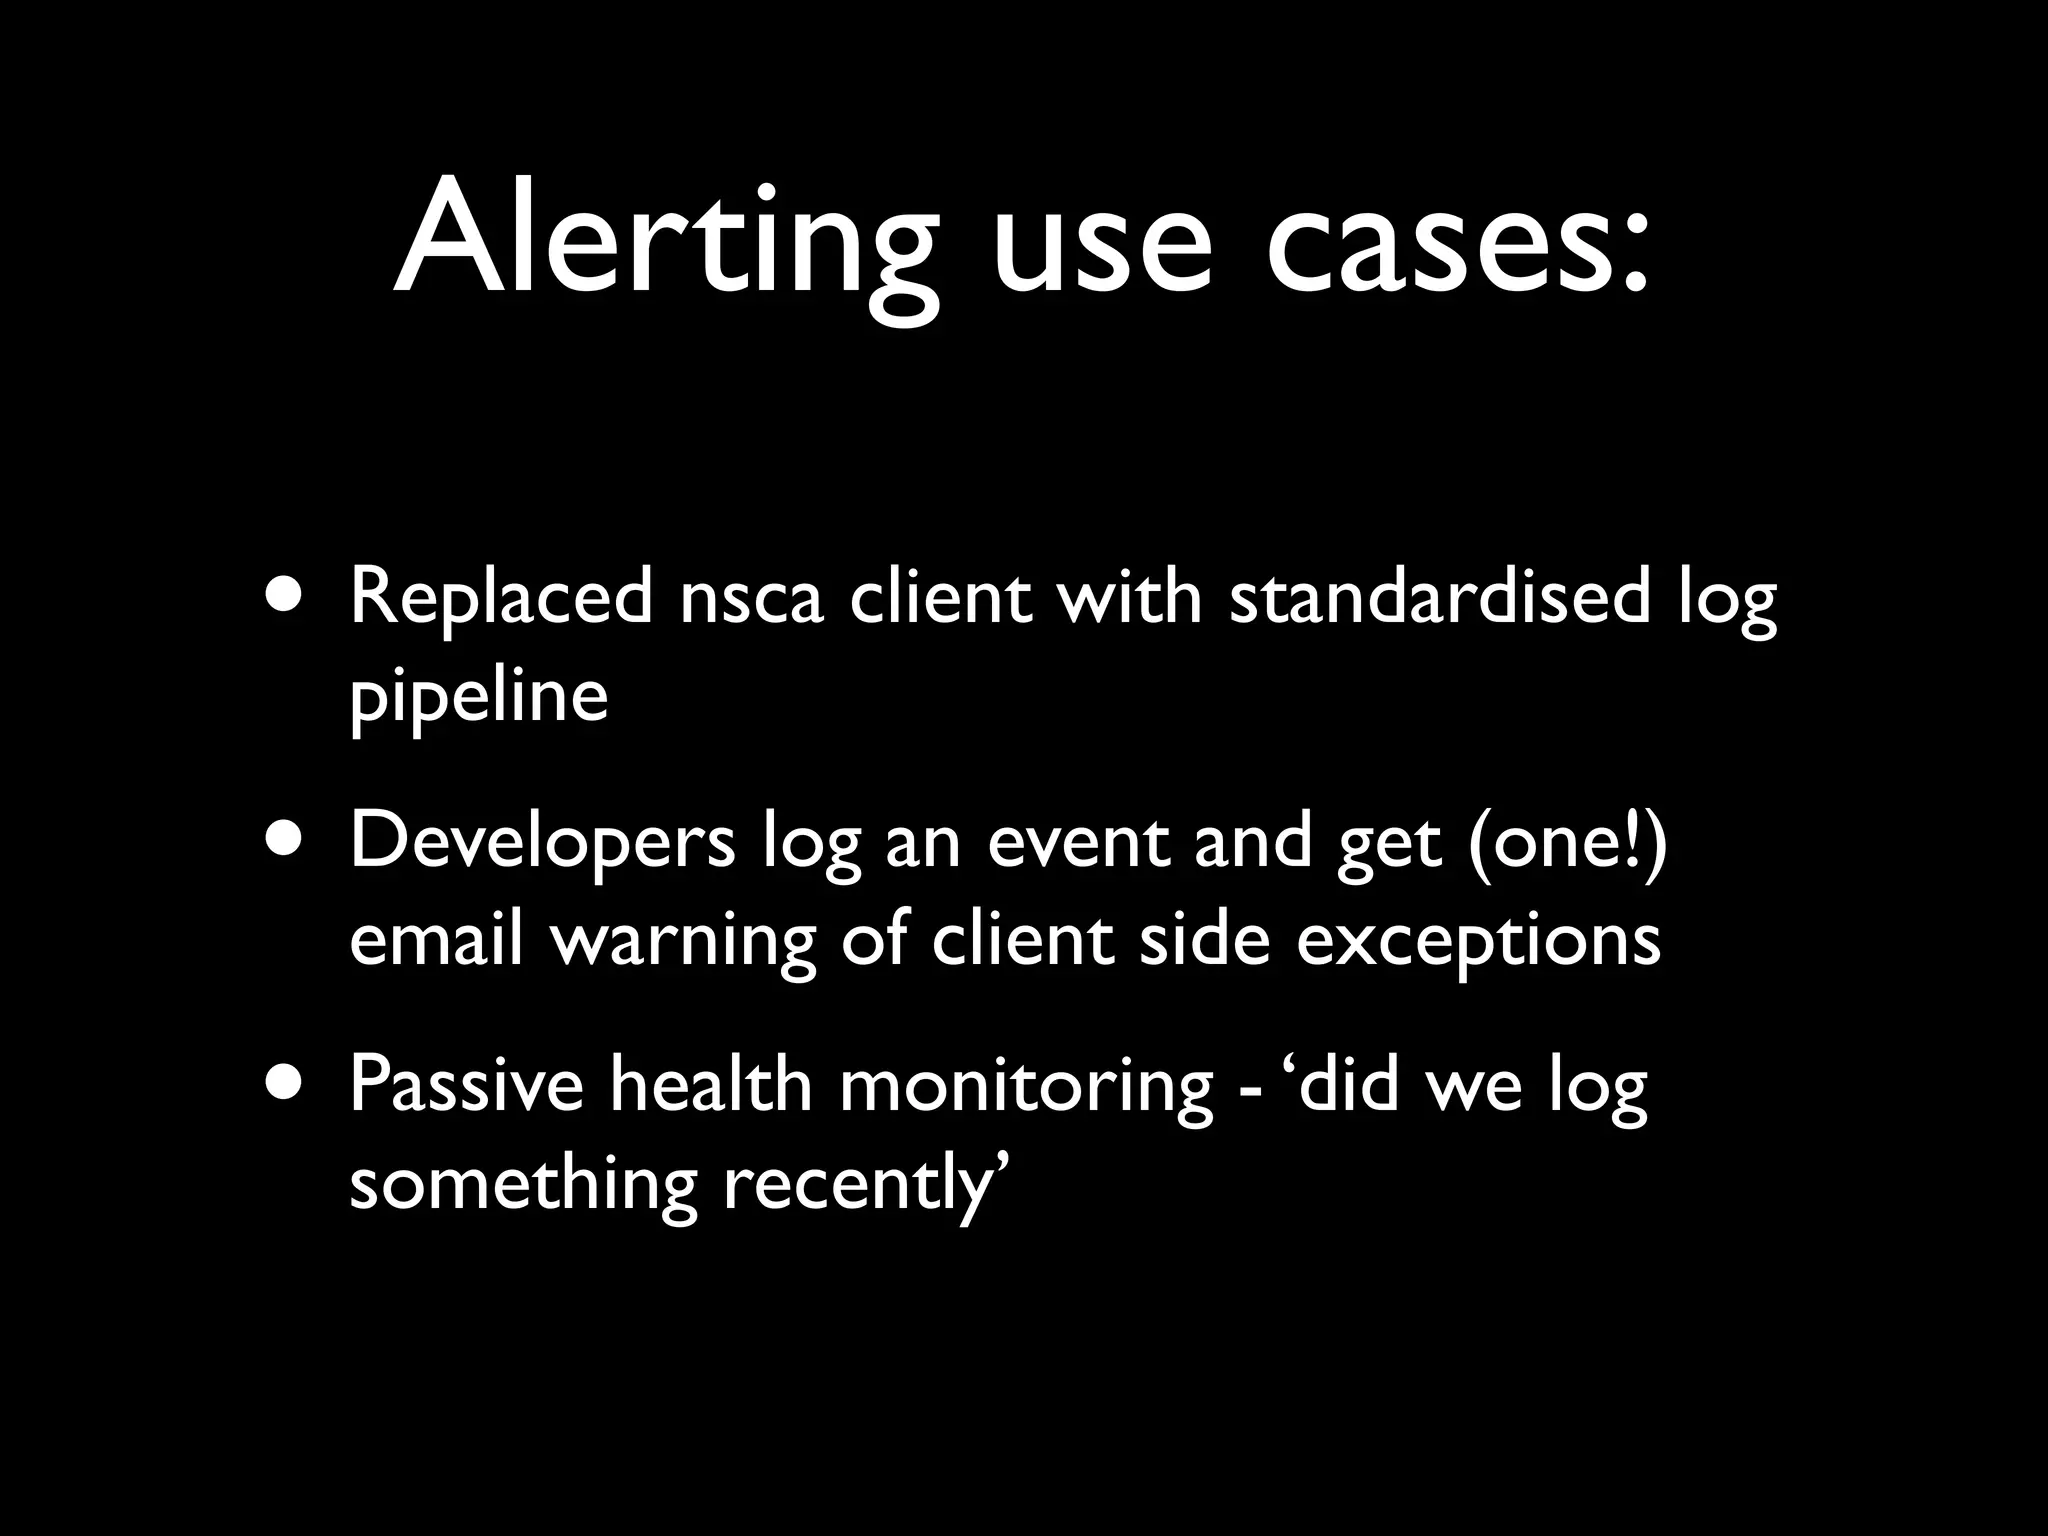


Tomas Doran presented on their implementation of Logstash at TIM Group to process over 55 million messages per day. Their applications are all Java/Scala/Clojure and they developed their own library to send structured log events as JSON to Logstash using ZeroMQ for reliability. They index data in Elasticsearch and use it for metrics, alerts and dashboards but face challenges with data growth.


![8th grade founding father project[1]](https://cdn.slidesharecdn.com/ss_thumbnails/8thgradefoundingfatherproject1-111129094456-phpapp02-thumbnail.jpg?width=640&height=640&fit=bounds)