Download to read offline


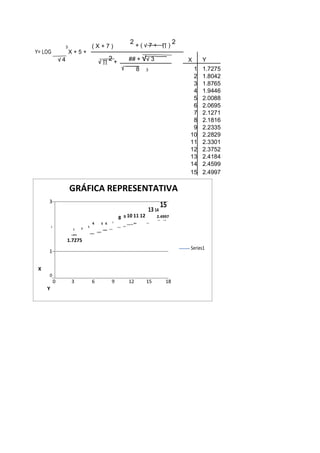

This document contains a mathematical equation, a table of x and y values, and a statement about a representative graph. The table lists x values from 1 to 15 in the first column and corresponding y values in the second column. The representative graph is said to plot the series of x and y values from the table, with y on the vertical axis and x on the horizontal axis.


