Download to read offline

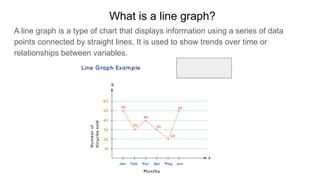
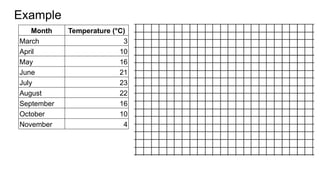
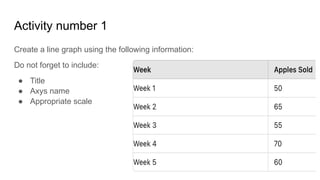
The document provides an overview of line graphs, explaining their purpose in displaying information and trends over time through connected data points. It includes examples and two related activities: creating a line graph based on given data and measuring heart rates post-exercise to analyze the effect of intensity. These activities aim to enhance understanding of data representation and analysis.


