Download to read offline
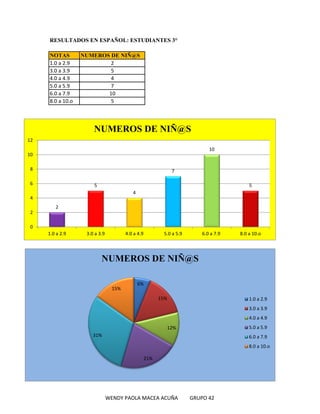
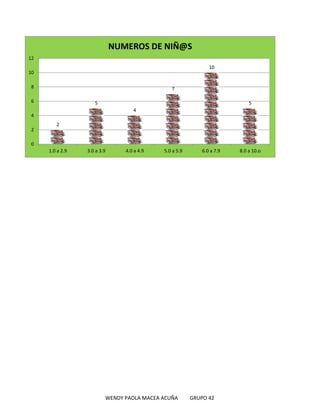

The document summarizes the test results of third grade students. It shows the number of students who scored within different point ranges on a test scaled from 1.0 to 10.0. The majority of students, 31%, scored between 6.0 to 7.9, while the fewest, 6%, scored between 1.0 to 2.9. The document lists the number of students in each point range and calculates their percentages of the total students tested.


![Presentation Of My Blog[1]](https://cdn.slidesharecdn.com/ss_thumbnails/presentationofmyblog1-091014174709-phpapp02-thumbnail.jpg?width=640&height=640&fit=bounds)


