Leveraging Machine Learning for Accelerated Material Design.pptx
Material Design with Machine Learning is an emerging interdisciplinary field that integrates materials science and artificial intelligence to accelerate the discovery and optimization of materials.
Leveraging Machine Learning for Accelerated Material Design.pptx
1.
National Institute ofTechnology, Jamshedpur
Machine Learning Approach for Materials Design
2.
02.09.2021
Contents
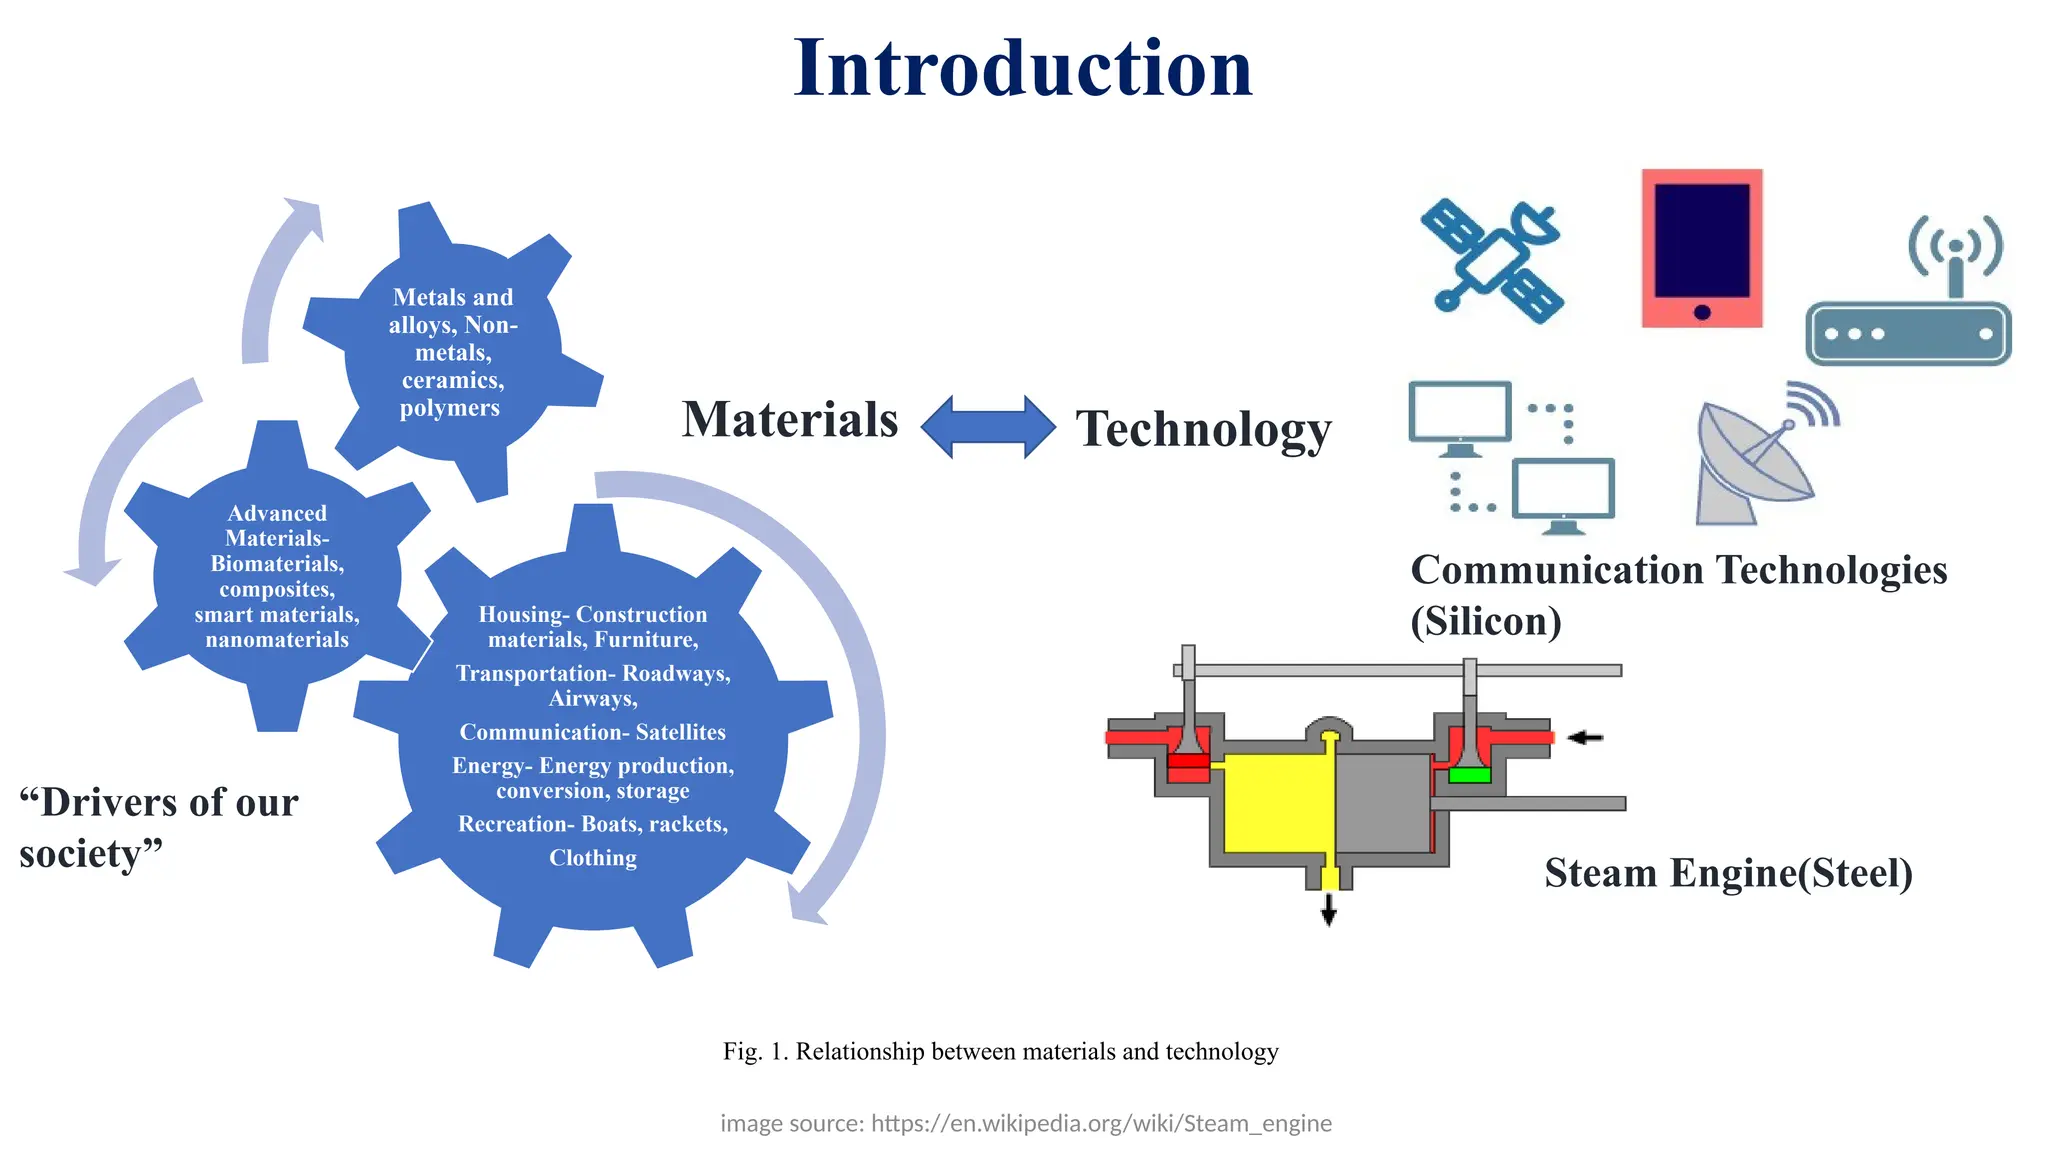
Introduction
Housing- Construction
materials, Furniture,
Transportation-Roadways,
Airways,
Communication- Satellites
Energy- Energy production,
conversion, storage
Recreation- Boats, rackets,
Clothing
Advanced
Materials-
Biomaterials,
composites,
smart materials,
nanomaterials
Materials Technology
Communication Technologies
(Silicon)
Steam Engine(Steel)
Fig. 1. Relationship between materials and technology
“Drivers of our
society”
image source: https://en.wikipedia.org/wiki/Steam_engine
3.
02.09.2021
Contents
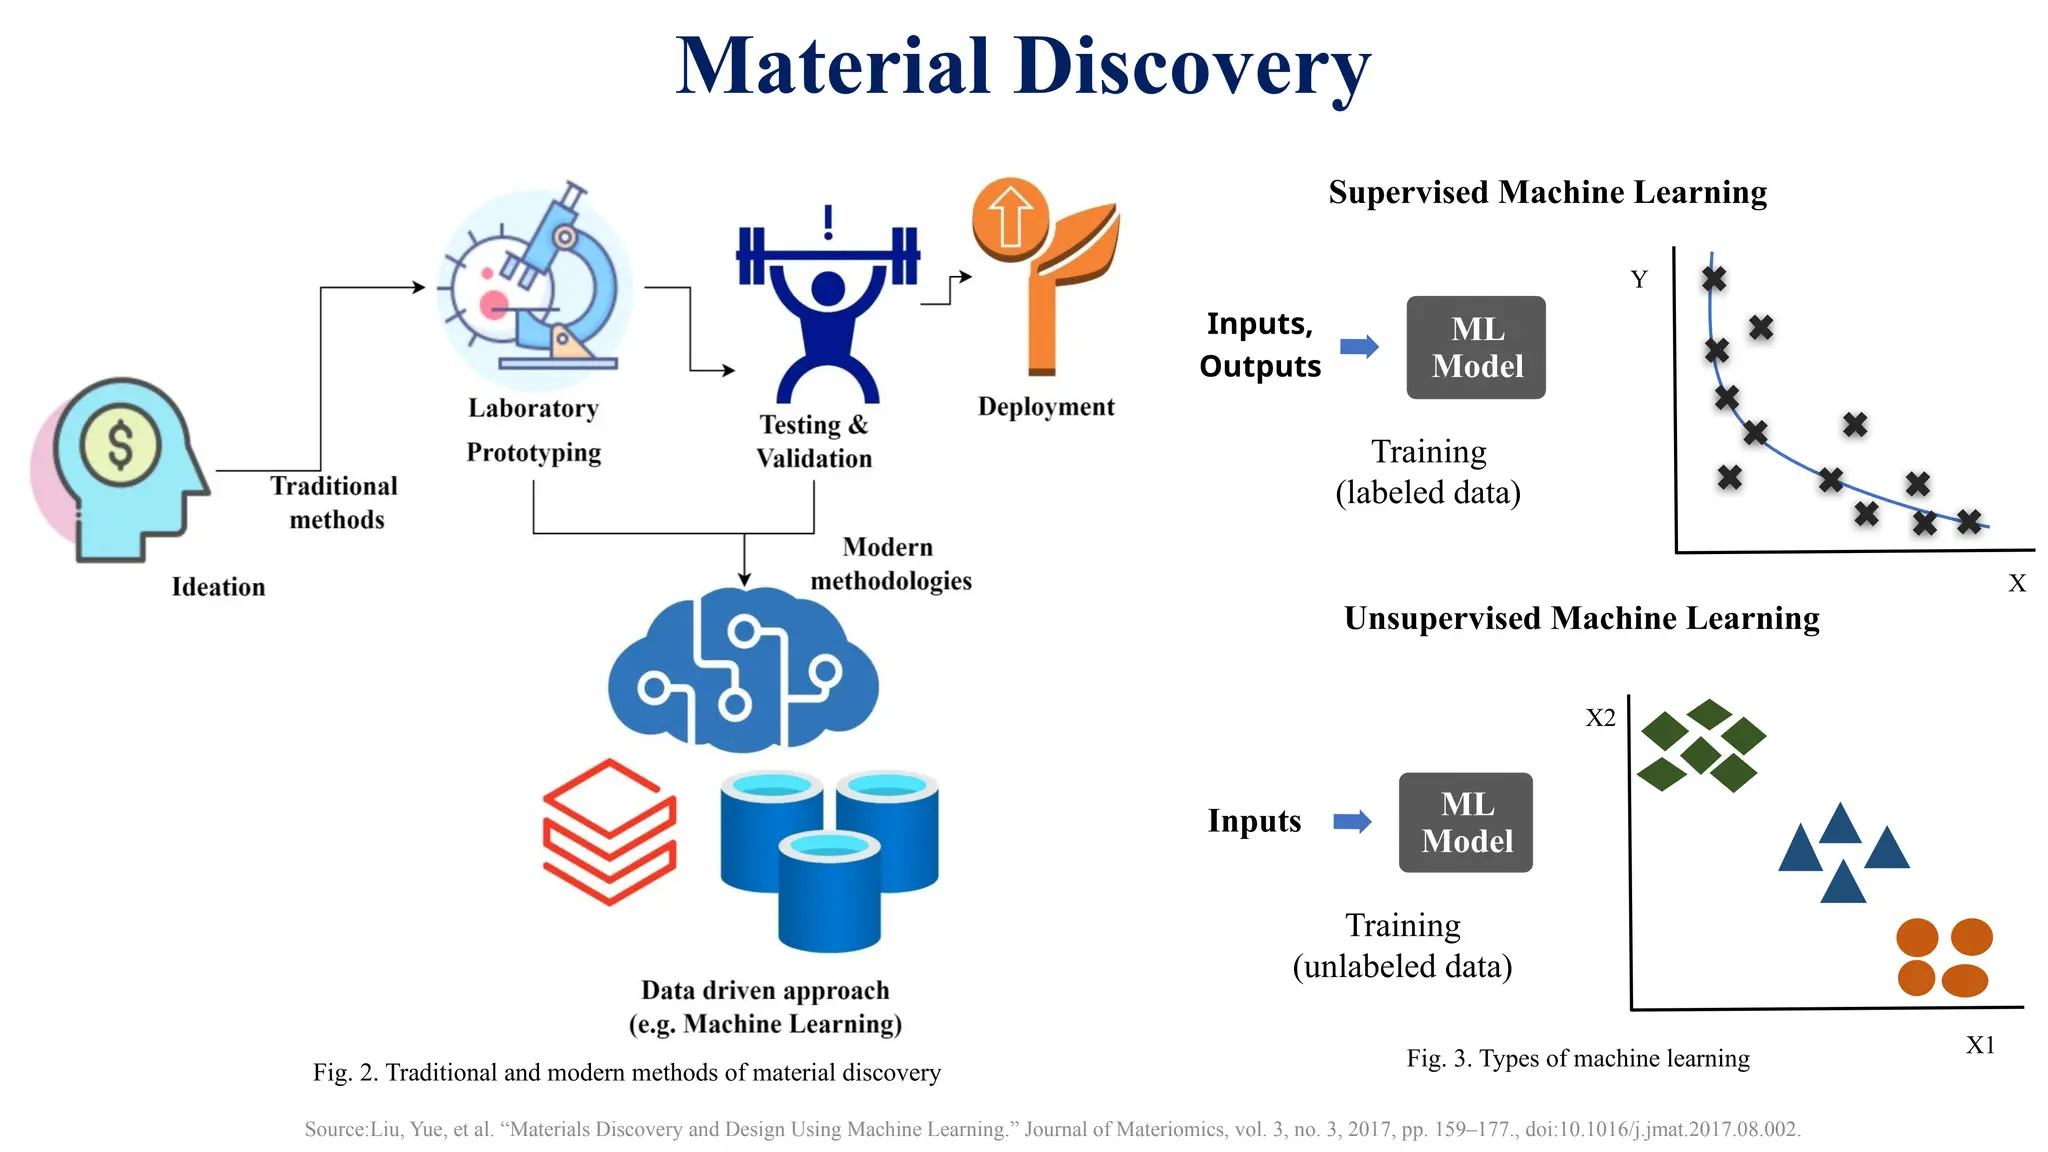
Material Discovery
Supervised MachineLearning
Unsupervised Machine Learning
Fig. 2. Traditional and modern methods of material discovery
Inputs,
Outputs
ML
Model
X
Y
Training
(labeled data)
Inputs ML
Model
Training
(unlabeled data)
X1
X2
Fig. 3. Types of machine learning
Source:Liu, Yue, et al. “Materials Discovery and Design Using Machine Learning.” Journal of Materiomics, vol. 3, no. 3, 2017, pp. 159–177., doi:10.1016/j.jmat.2017.08.002.
4.
Objectives
To createML models using online data repository for carbon containing compounds and evaluate
their performances
Prediction of mechanical properties of carbon fiber reinforced plastics(CFRP) based on cross-scale
finite element simulation using ABAQUS
Extracting database from above FE model, creating ML model for the same, making predictions
and validating the results
5.
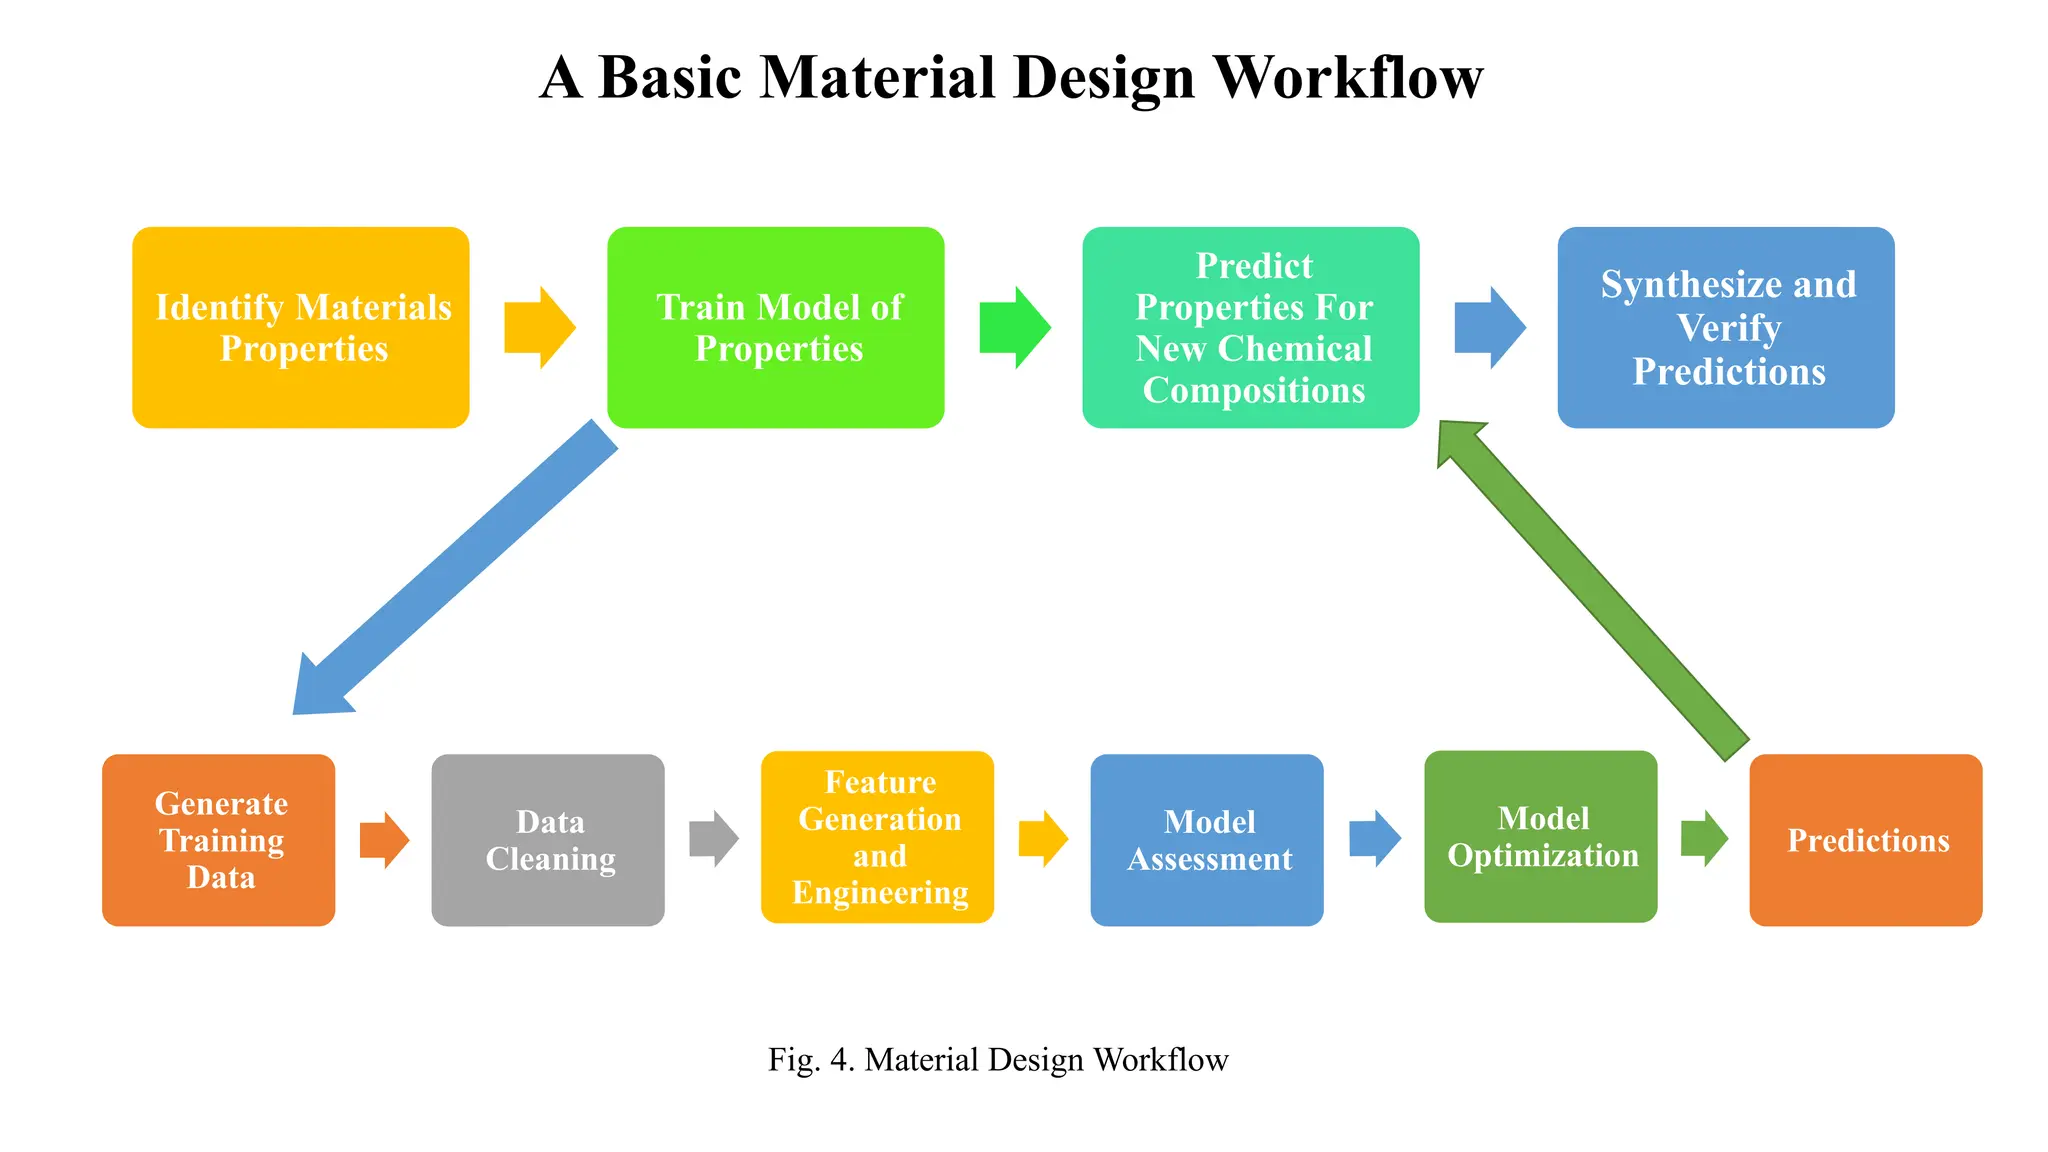
A Basic MaterialDesign Workflow
Identify Materials
Properties
Train Model of
Properties
Predict
Properties For
New Chemical
Compositions
Synthesize and
Verify
Predictions
Generate
Training
Data
Data
Cleaning
Feature
Generation
and
Engineering
Model
Assessment
Model
Optimization Predictions
Fig. 4. Material Design Workflow
6.
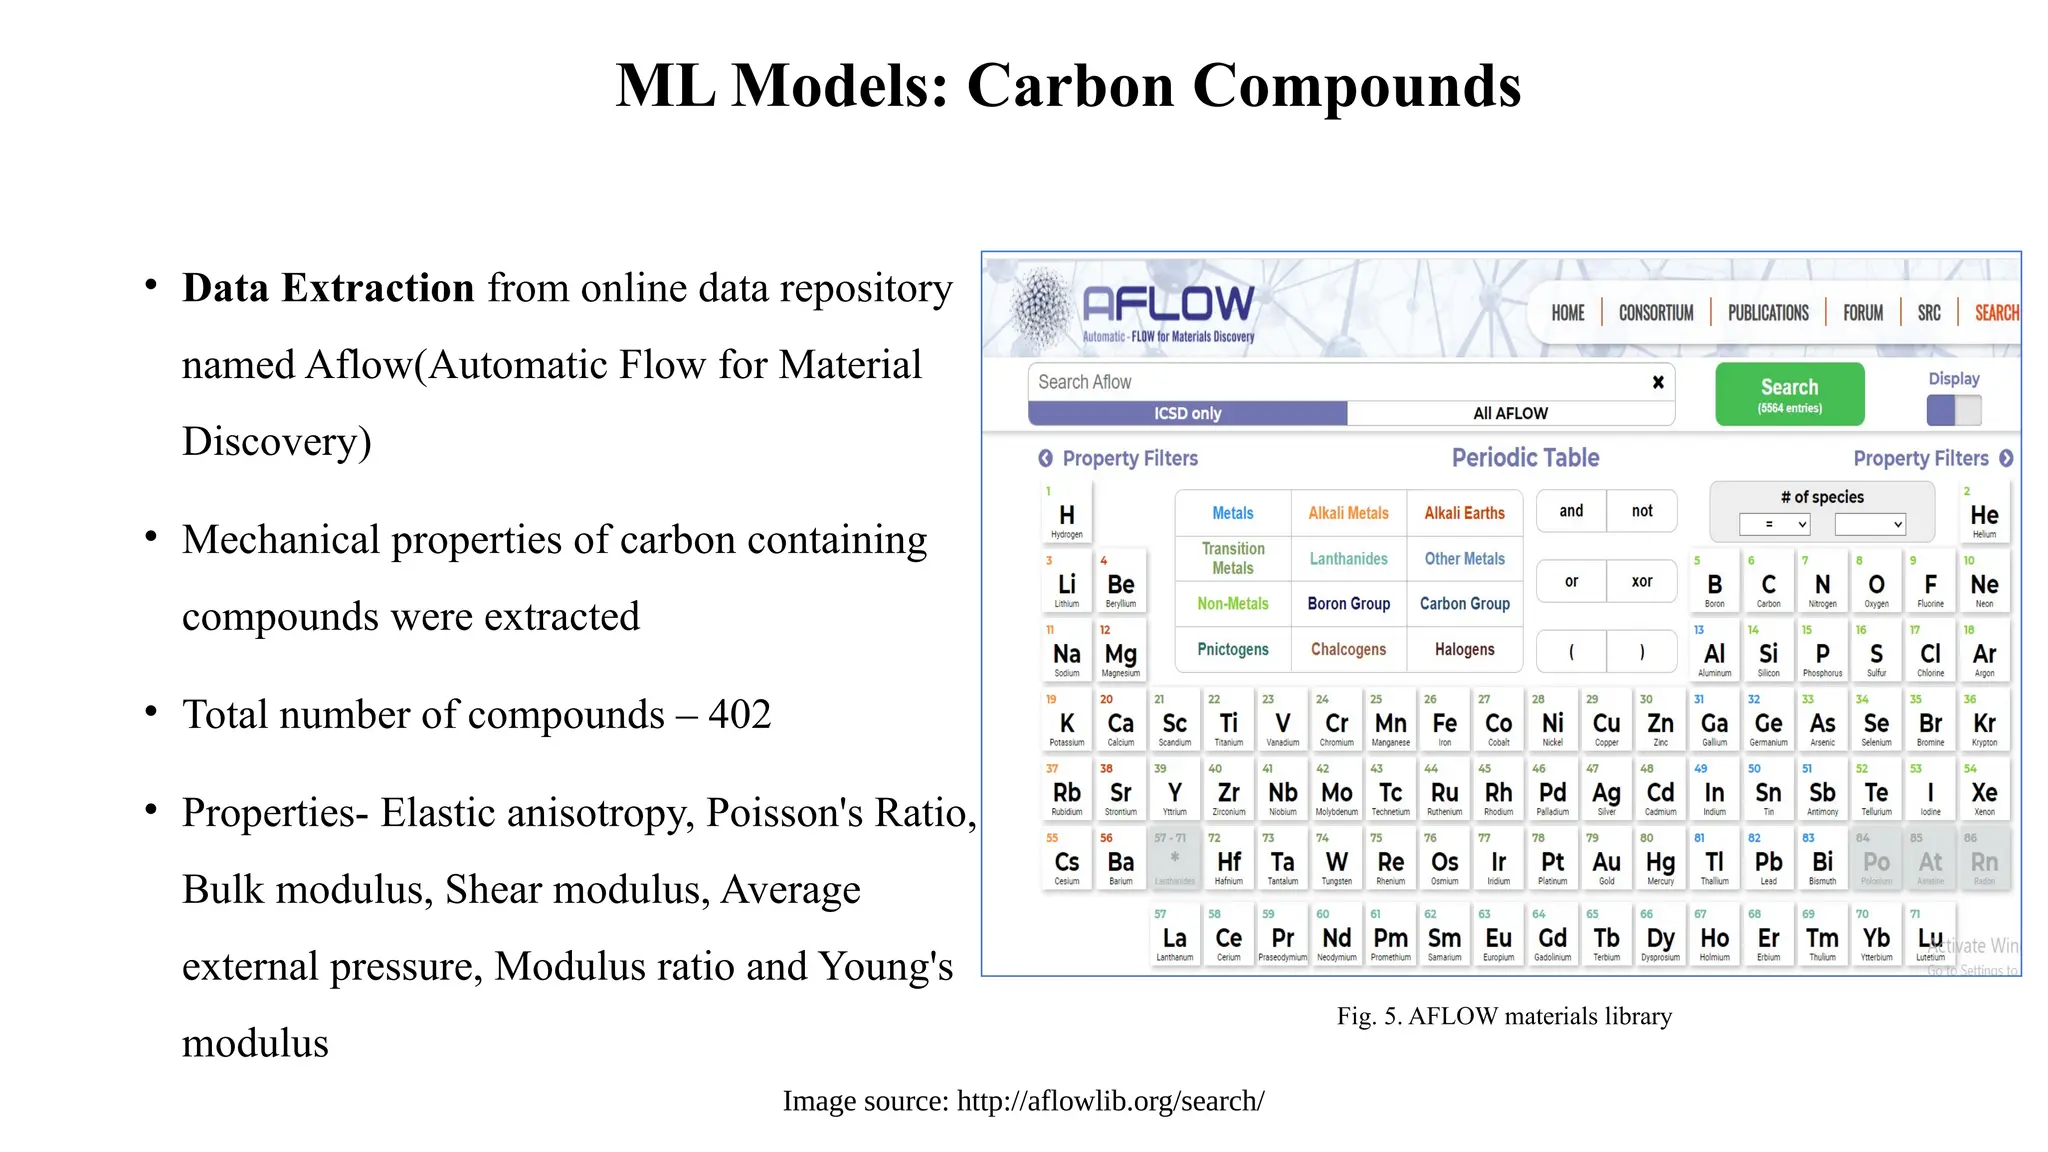
Image source: http://aflowlib.org/search/
MLModels: Carbon Compounds
• Data Extraction from online data repository
named Aflow(Automatic Flow for Material
Discovery)
• Mechanical properties of carbon containing
compounds were extracted
• Total number of compounds – 402
• Properties- Elastic anisotropy, Poisson's Ratio,
Bulk modulus, Shear modulus, Average
external pressure, Modulus ratio and Young's
modulus
Fig. 5. AFLOW materials library
7.
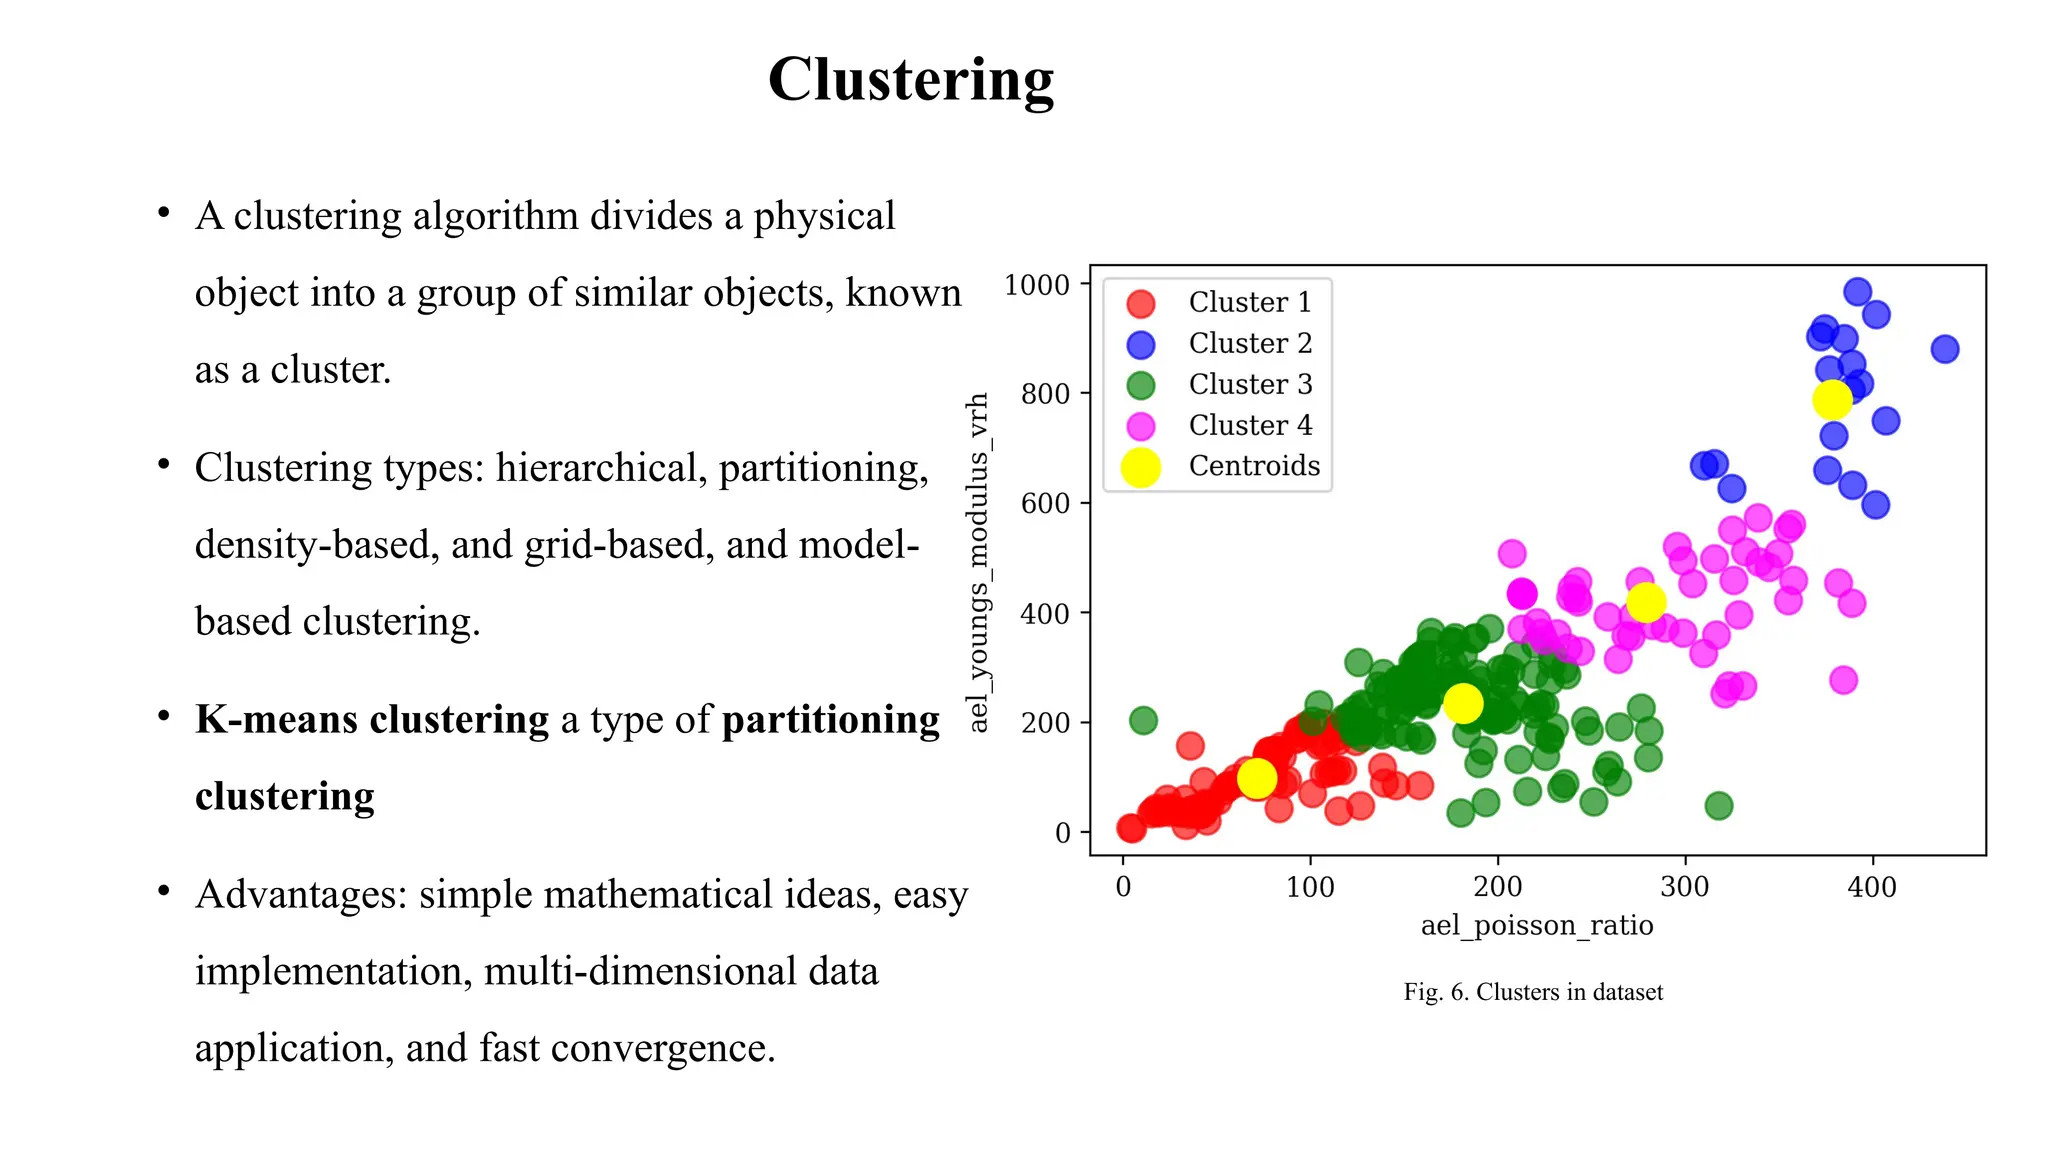
Clustering
• A clusteringalgorithm divides a physical
object into a group of similar objects, known
as a cluster.
• Clustering types: hierarchical, partitioning,
density-based, and grid-based, and model-
based clustering.
• K-means clustering a type of partitioning
clustering
• Advantages: simple mathematical ideas, easy
implementation, multi-dimensional data
application, and fast convergence.
Fig. 6. Clusters in dataset
8.
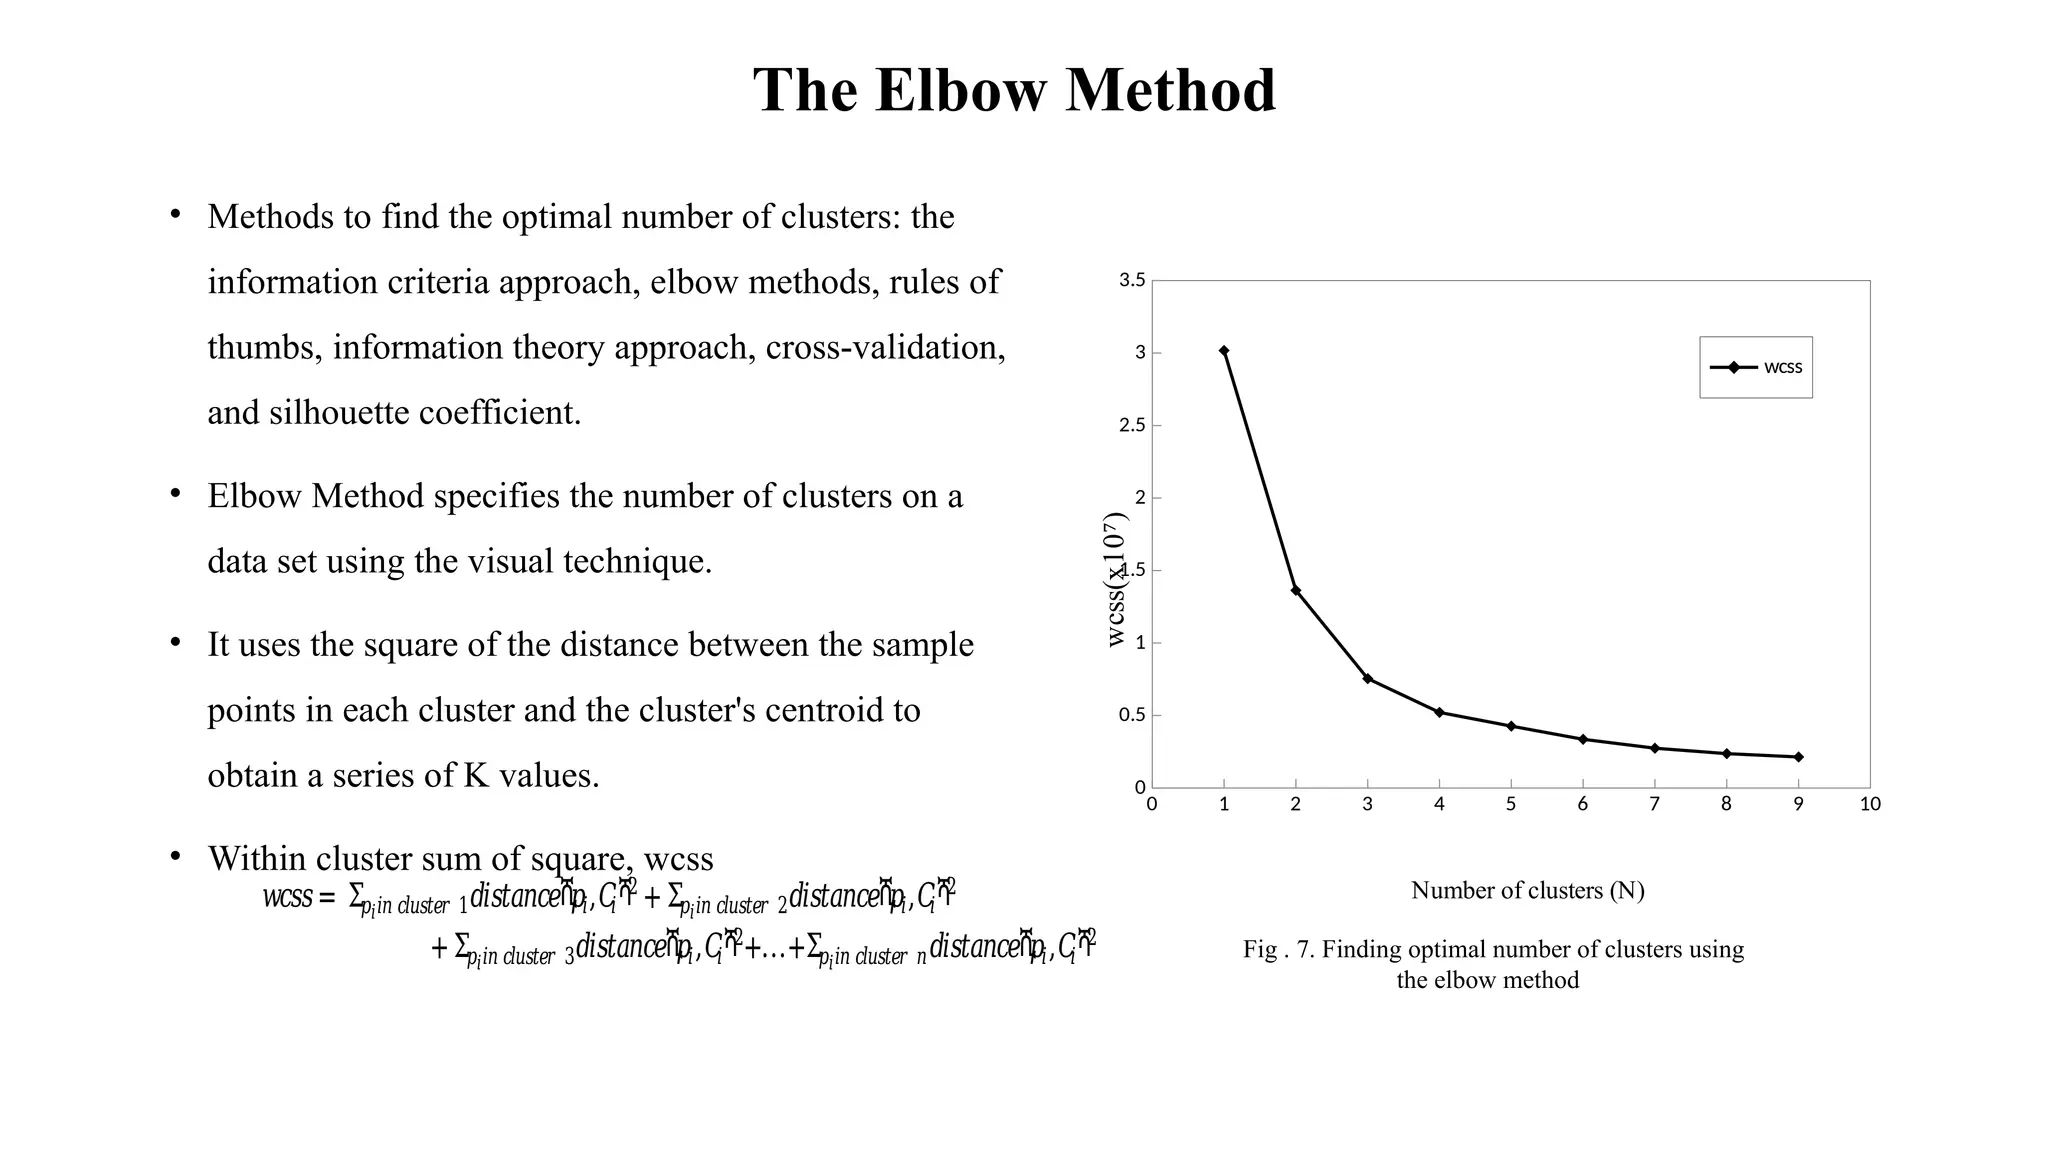
The Elbow Method
•Methods to find the optimal number of clusters: the
information criteria approach, elbow methods, rules of
thumbs, information theory approach, cross-validation,
and silhouette coefficient.
• Elbow Method specifies the number of clusters on a
data set using the visual technique.
• It uses the square of the distance between the sample
points in each cluster and the cluster's centroid to
obtain a series of K values.
• Within cluster sum of square, wcss
Fig . 7. Finding optimal number of clusters using
the elbow method
0 1 2 3 4 5 6 7 8 9 10
0
0.5
1
1.5
2
2.5
3
3.5
wcss
wcss(x10
)
⁷
Number of clusters (N)
𝑤𝑐𝑠𝑠= Σ𝑝𝑖𝑖𝑛 𝑐𝑙𝑢𝑠𝑡𝑒𝑟 1𝑑𝑖𝑠𝑡𝑎𝑛𝑐𝑒ሺ
𝑝𝑖,𝐶
𝑖ሻ2
+Σ𝑝𝑖𝑖𝑛 𝑐𝑙𝑢𝑠𝑡𝑒𝑟 2𝑑𝑖𝑠𝑡𝑎𝑛𝑐𝑒ሺ
𝑝𝑖,𝐶
𝑖ሻ2
+Σ𝑝𝑖𝑖𝑛 𝑐𝑙𝑢𝑠𝑡𝑒𝑟 3𝑑𝑖𝑠𝑡𝑎𝑛𝑐𝑒ሺ
𝑝𝑖,𝐶
𝑖ሻ2
+...+Σ𝑝𝑖𝑖𝑛 𝑐𝑙𝑢𝑠𝑡𝑒𝑟 𝑛𝑑𝑖𝑠𝑡𝑎𝑛𝑐𝑒ሺ
𝑝𝑖,𝐶
𝑖ሻ2
9.
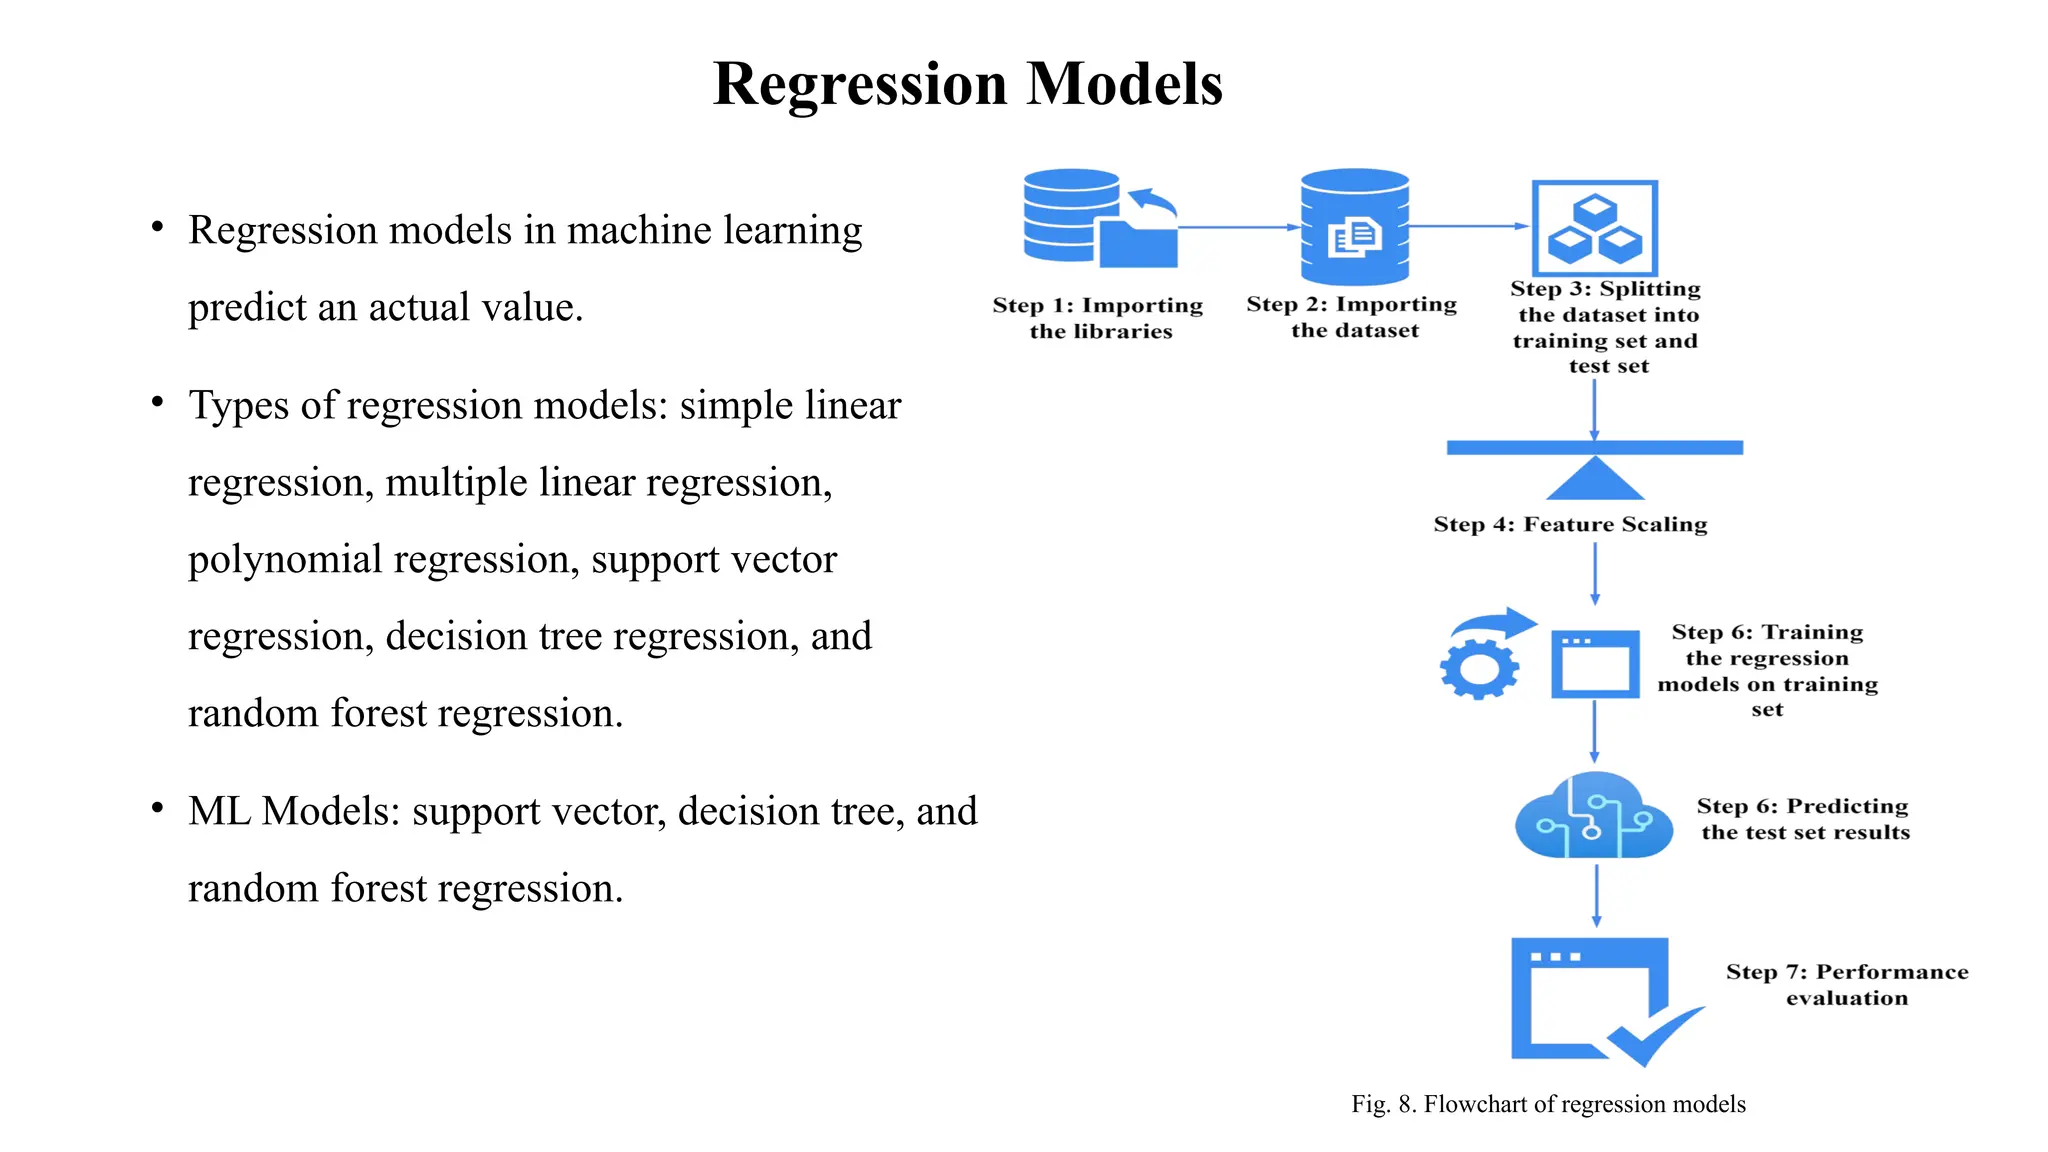
Regression Models
• Regressionmodels in machine learning
predict an actual value.
• Types of regression models: simple linear
regression, multiple linear regression,
polynomial regression, support vector
regression, decision tree regression, and
random forest regression.
• ML Models: support vector, decision tree, and
random forest regression.
Fig. 8. Flowchart of regression models
10.
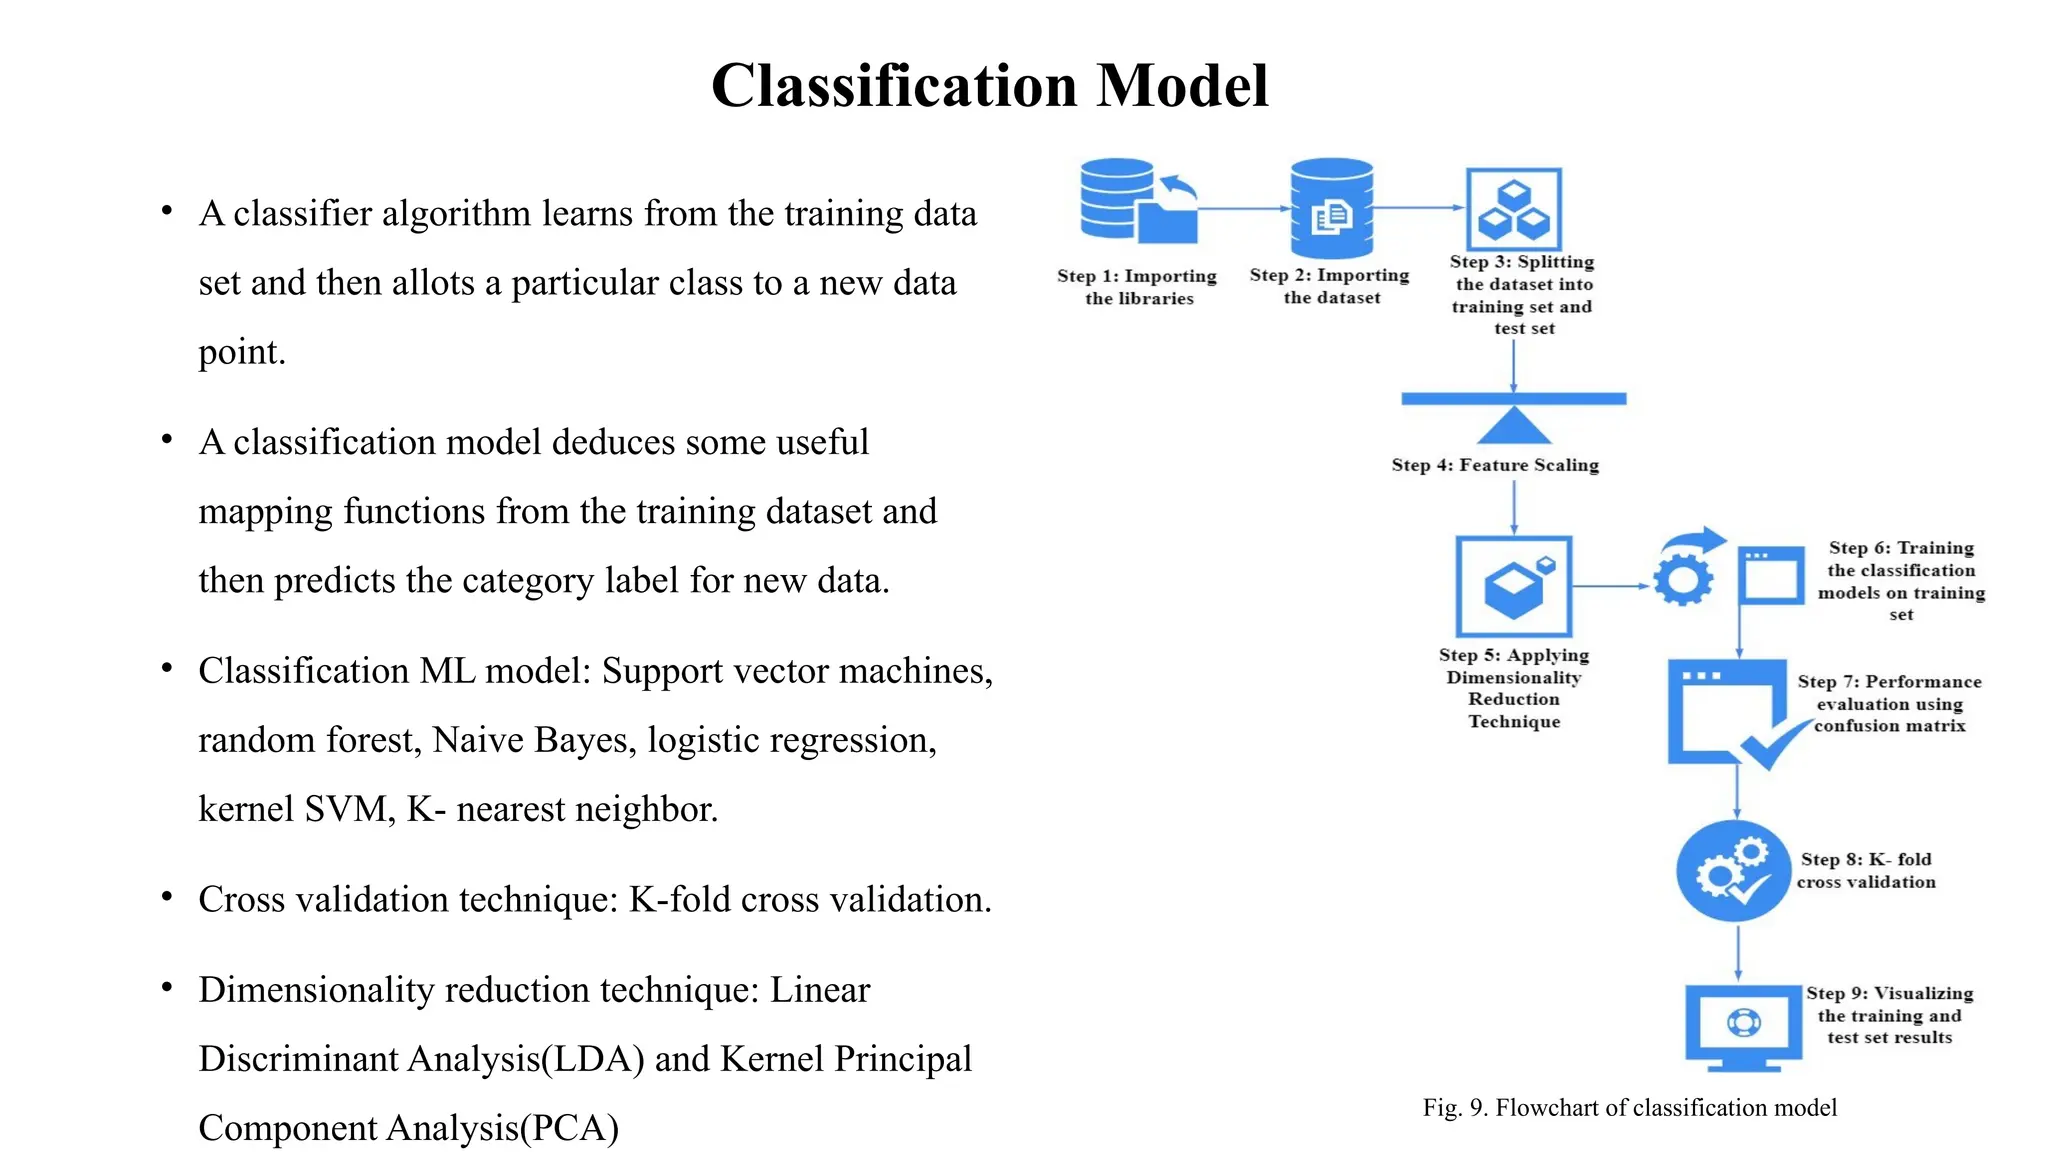
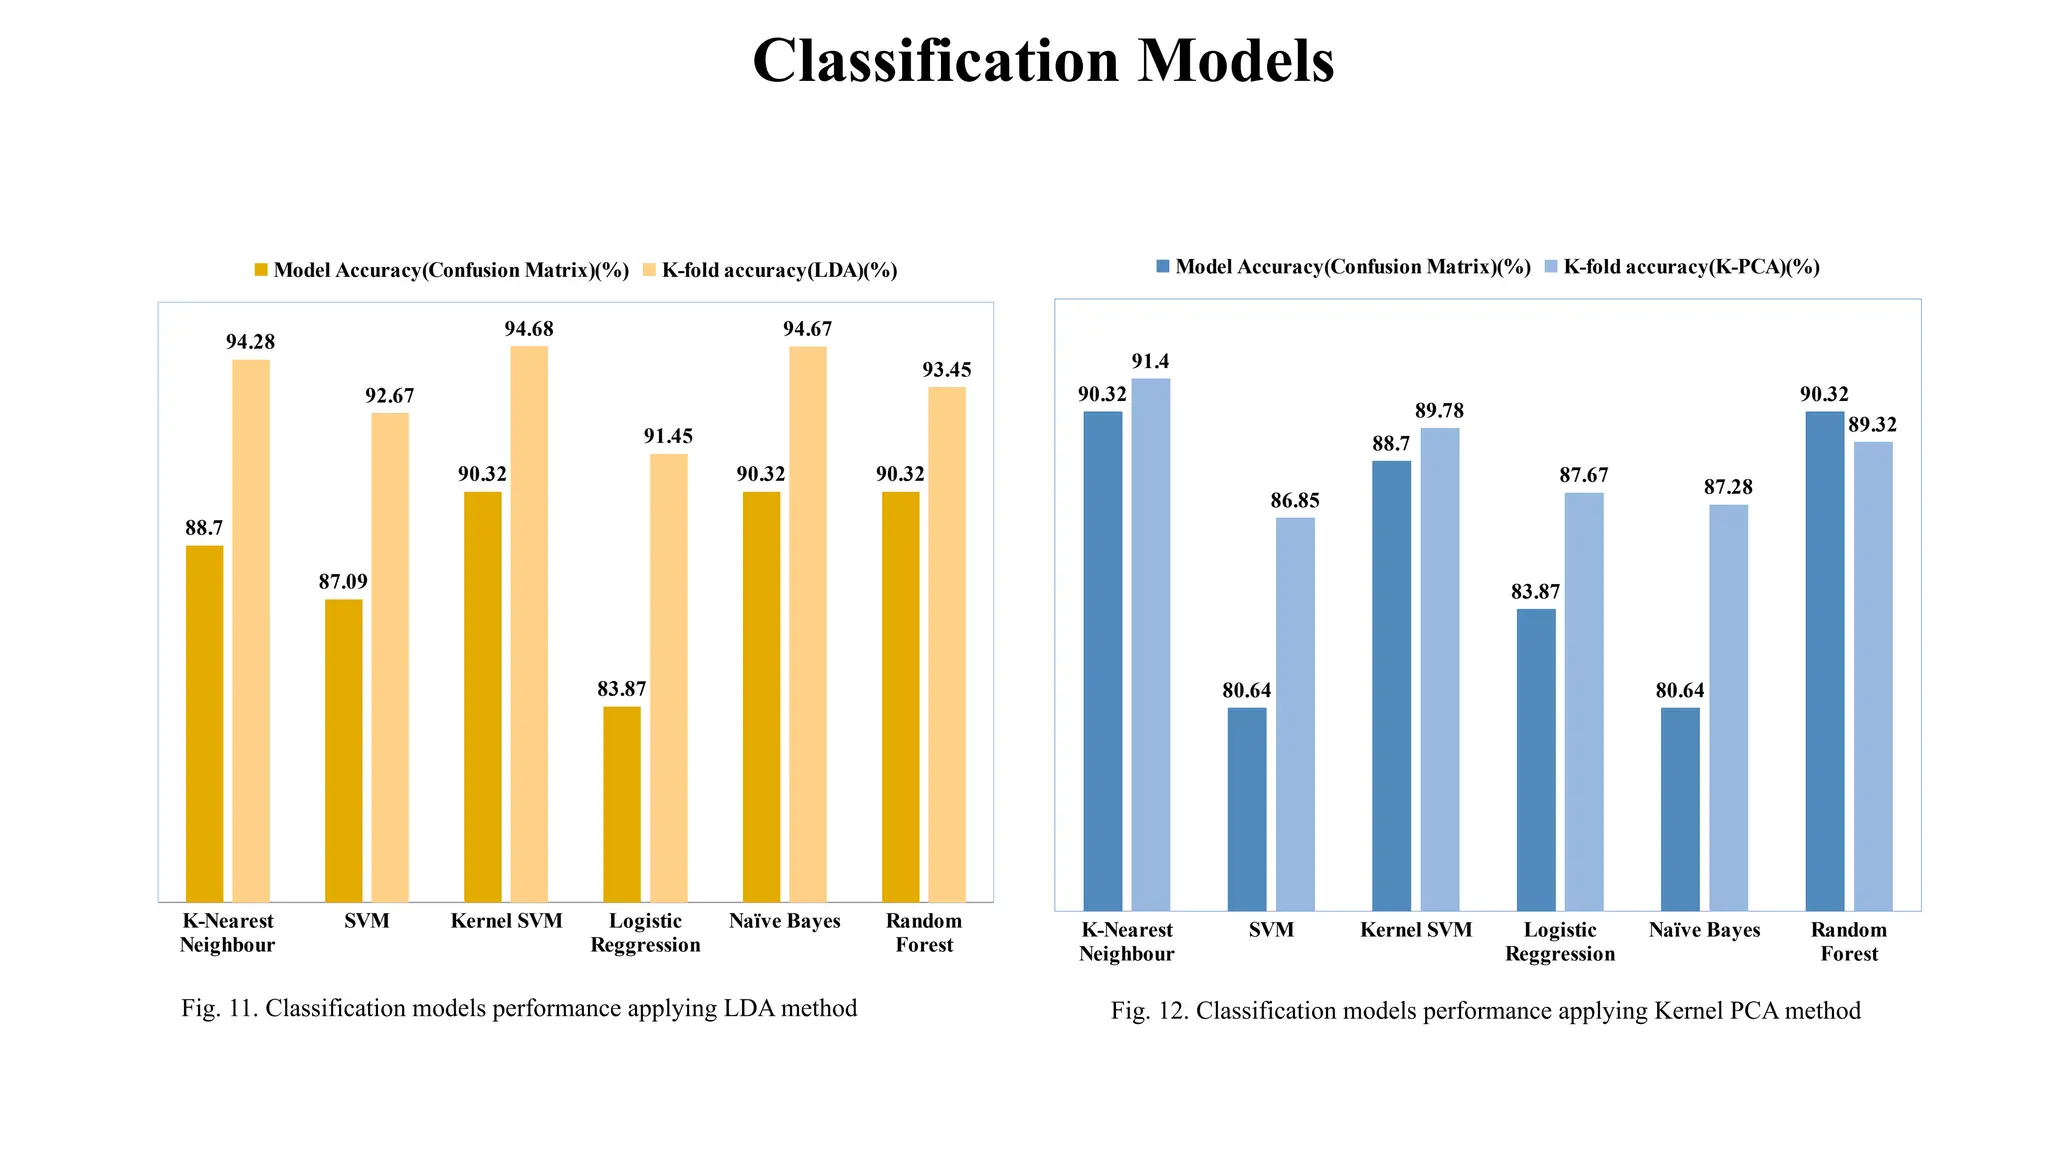
Classification Model
• Aclassifier algorithm learns from the training data
set and then allots a particular class to a new data
point.
• A classification model deduces some useful
mapping functions from the training dataset and
then predicts the category label for new data.
• Classification ML model: Support vector machines,
random forest, Naive Bayes, logistic regression,
kernel SVM, K- nearest neighbor.
• Cross validation technique: K-fold cross validation.
• Dimensionality reduction technique: Linear
Discriminant Analysis(LDA) and Kernel Principal
Component Analysis(PCA)
Fig. 9. Flowchart of classification model
11.
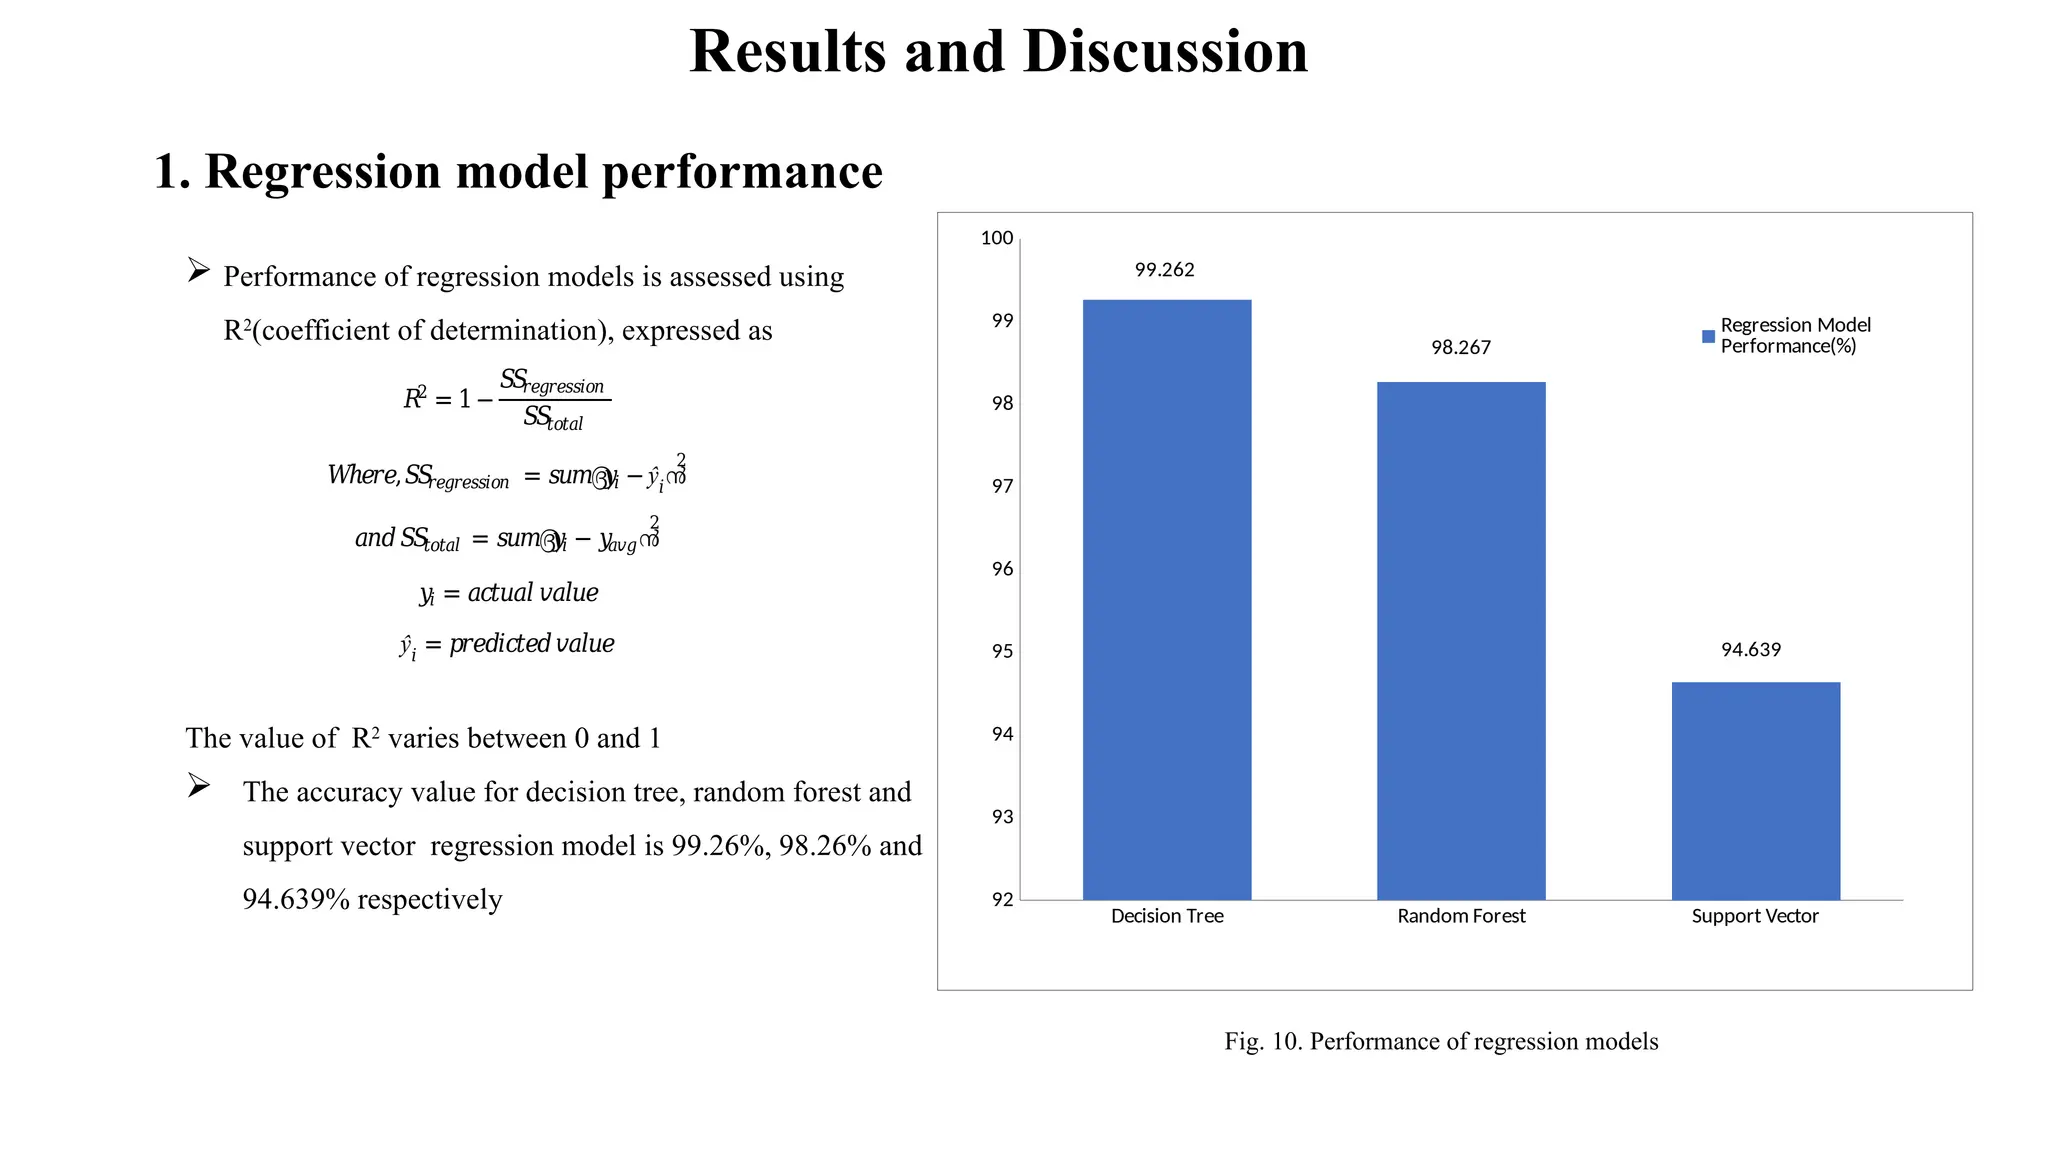
Results and Discussion
1.Regression model performance
Decision Tree Random Forest Support Vector
92
93
94
95
96
97
98
99
100
99.262
98.267
94.639
Regression Model
Performance(%)
Fig. 10. Performance of regression models
Performance of regression models is assessed using
R2
(coefficient of determination), expressed as
The value of R2
varies between 0 and 1
The accuracy value for decision tree, random forest and
support vector regression model is 99.26%, 98.26% and
94.639% respectively
𝑅2
= 1−
𝑆
𝑆
𝑟𝑒𝑔𝑟𝑒𝑠𝑠𝑖𝑜𝑛
𝑆𝑆
𝑡𝑜𝑡𝑎𝑙
𝑊
ℎ𝑒𝑟𝑒,𝑆𝑆
𝑟𝑒𝑔𝑟𝑒𝑠𝑠𝑖𝑜𝑛 = 𝑠𝑢𝑚൫
𝑦
𝑖 − ŷ𝑖
൯
2
𝑎𝑛𝑑𝑆𝑆
𝑡𝑜𝑡𝑎𝑙 = 𝑠𝑢𝑚൫
𝑦
𝑖 − 𝑦
𝑎𝑣𝑔൯
2
𝑦
𝑖 = 𝑎𝑐𝑡𝑢𝑎𝑙 𝑣𝑎𝑙𝑢𝑒
ŷ𝑖
= 𝑝𝑟𝑒𝑑𝑖𝑐𝑡𝑒𝑑𝑣𝑎𝑙𝑢𝑒
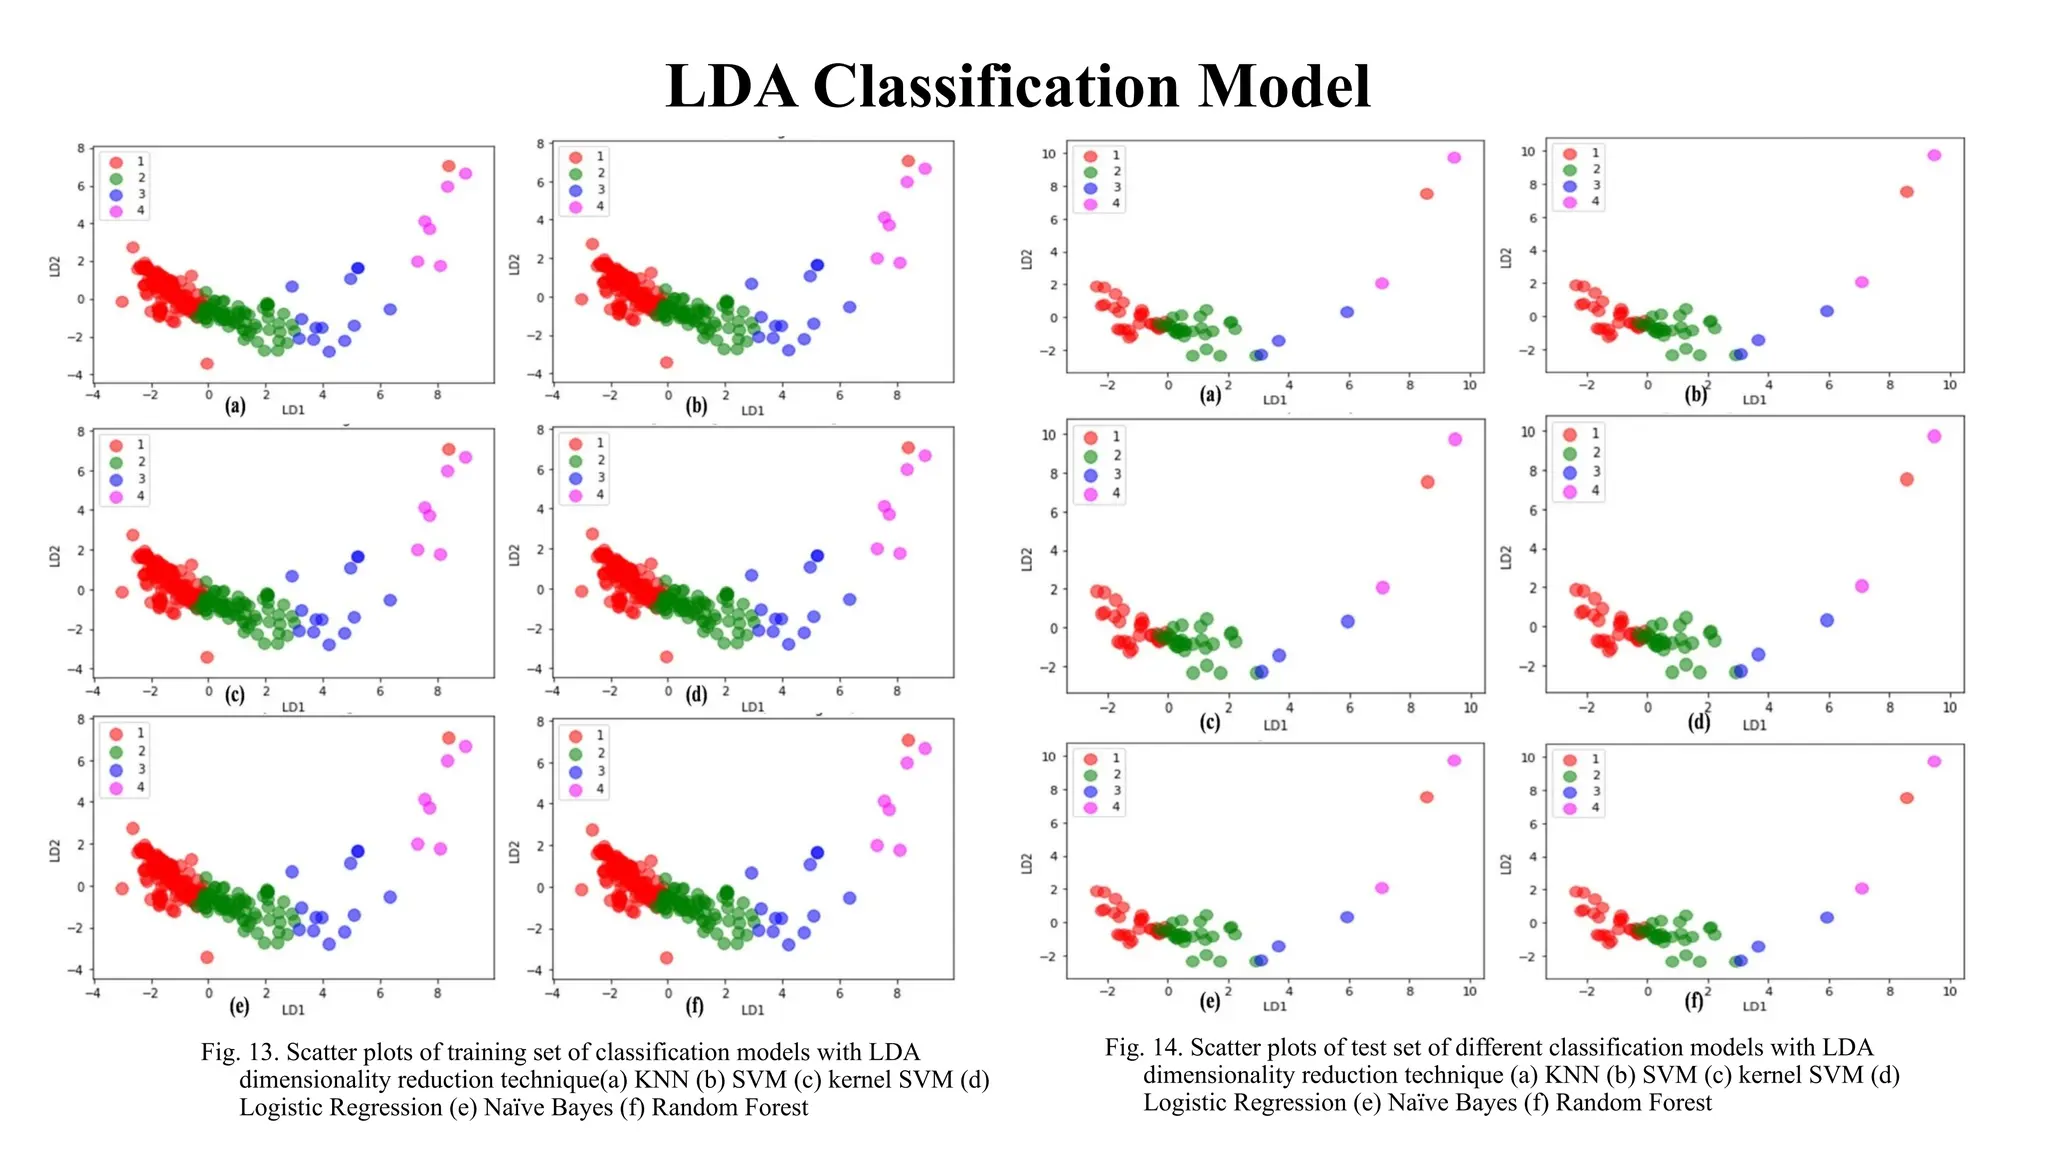
LDA Classification Model
Fig.13. Scatter plots of training set of classification models with LDA
dimensionality reduction technique(a) KNN (b) SVM (c) kernel SVM (d)
Logistic Regression (e) Naïve Bayes (f) Random Forest
Fig. 14. Scatter plots of test set of different classification models with LDA
dimensionality reduction technique (a) KNN (b) SVM (c) kernel SVM (d)
Logistic Regression (e) Naïve Bayes (f) Random Forest
14.
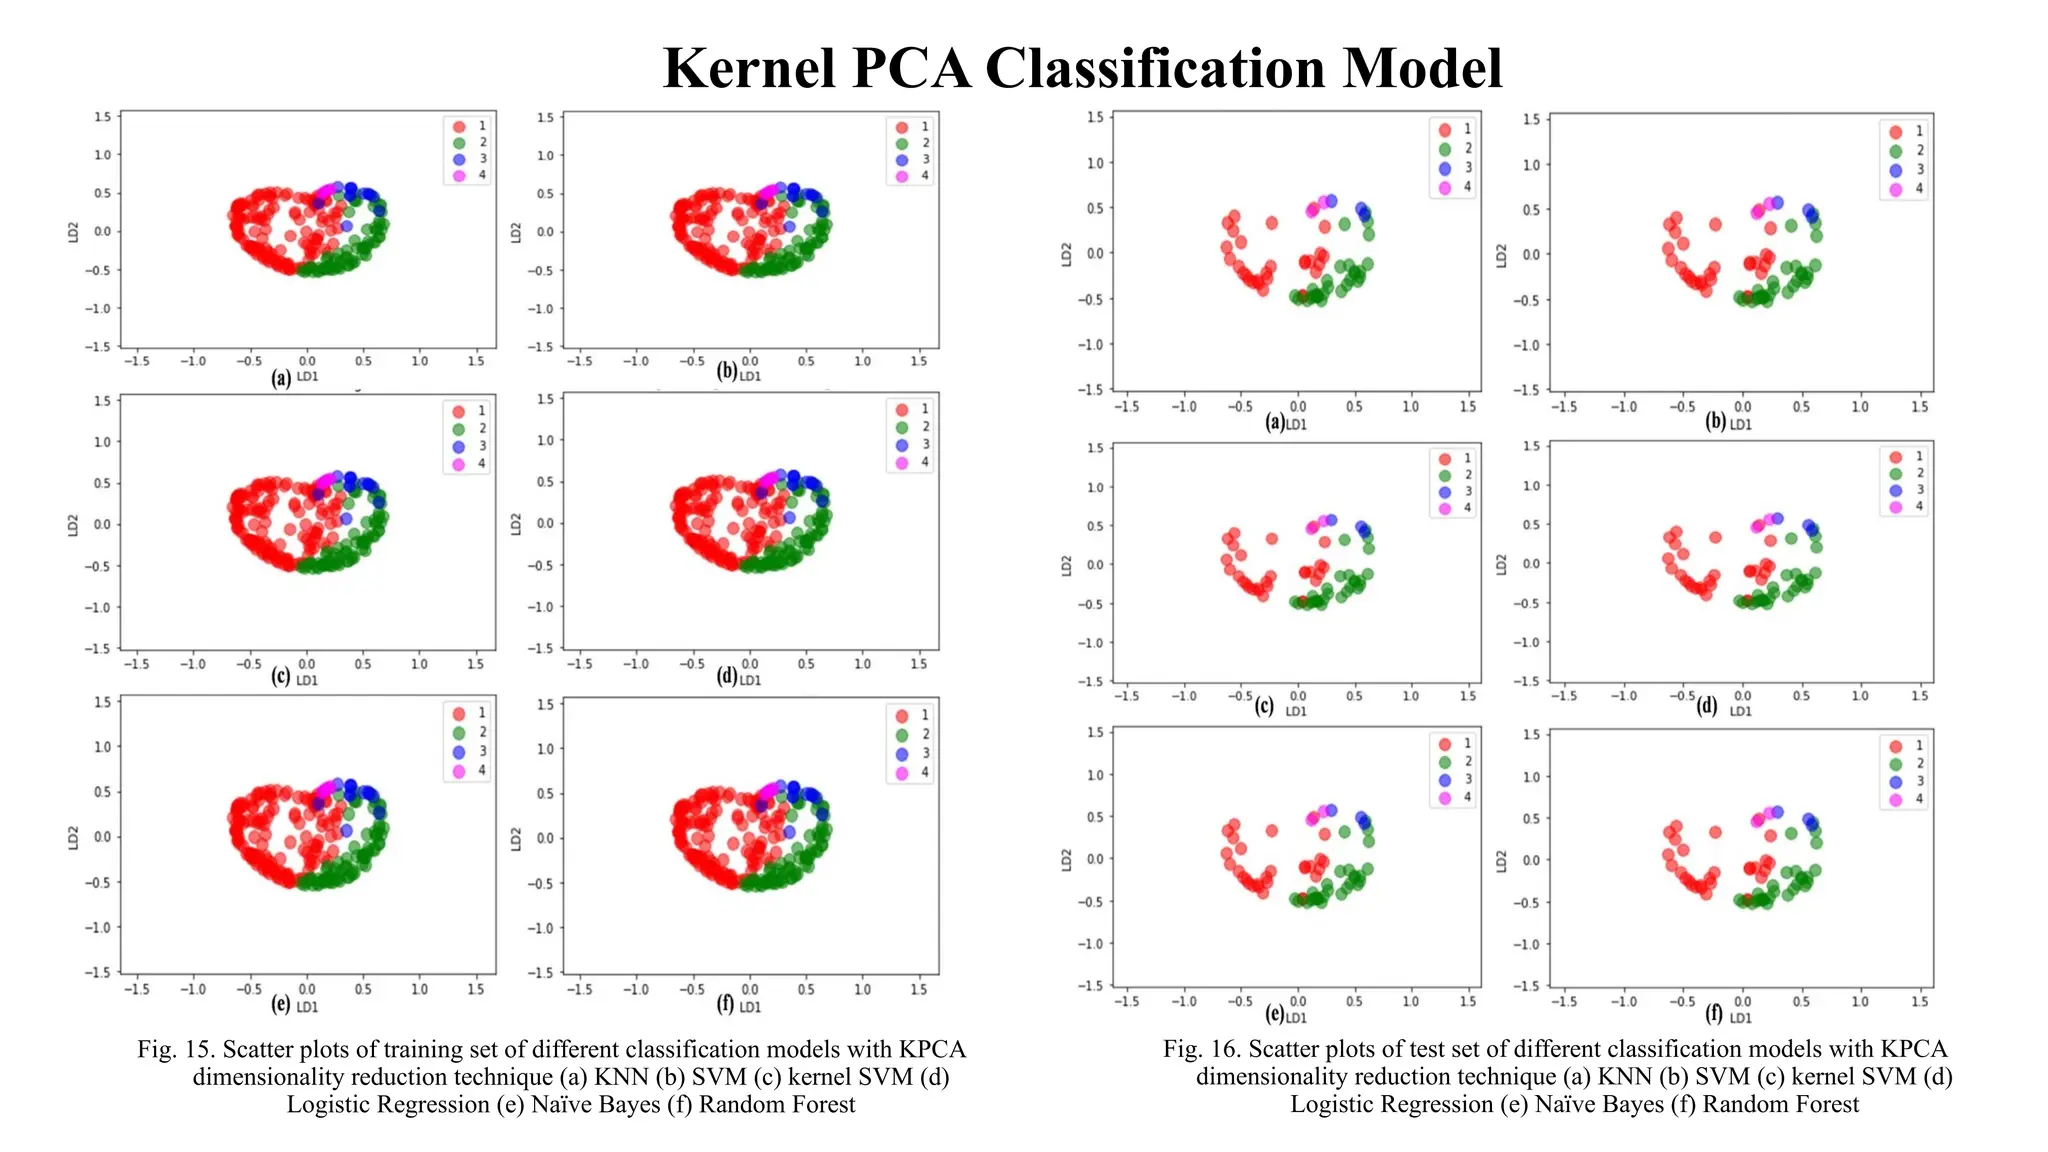
Kernel PCA ClassificationModel
Fig. 15. Scatter plots of training set of different classification models with KPCA
dimensionality reduction technique (a) KNN (b) SVM (c) kernel SVM (d)
Logistic Regression (e) Naïve Bayes (f) Random Forest
Fig. 16. Scatter plots of test set of different classification models with KPCA
dimensionality reduction technique (a) KNN (b) SVM (c) kernel SVM (d)
Logistic Regression (e) Naïve Bayes (f) Random Forest
15.
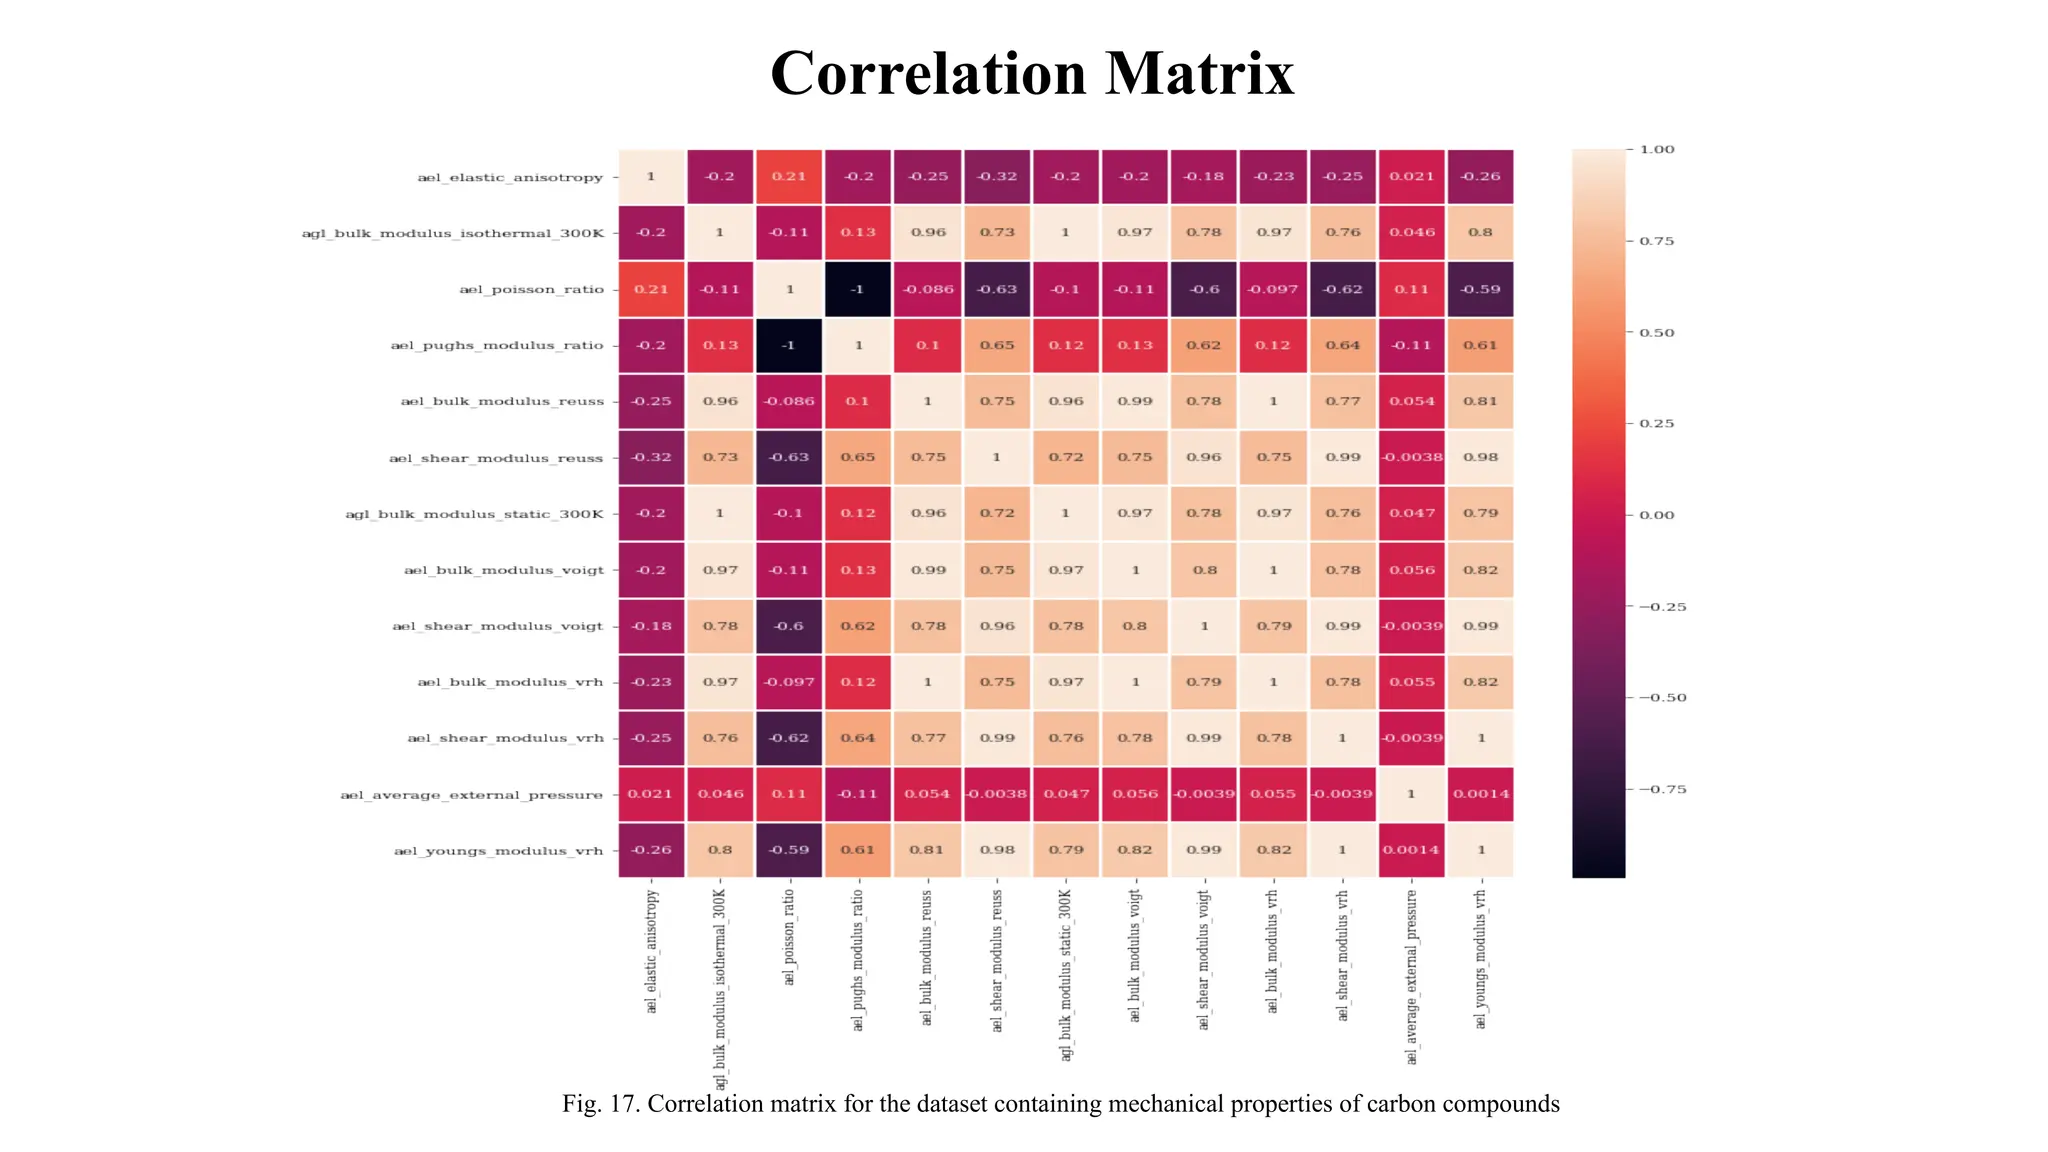
Correlation Matrix
Fig. 17.Correlation matrix for the dataset containing mechanical properties of carbon compounds
16.
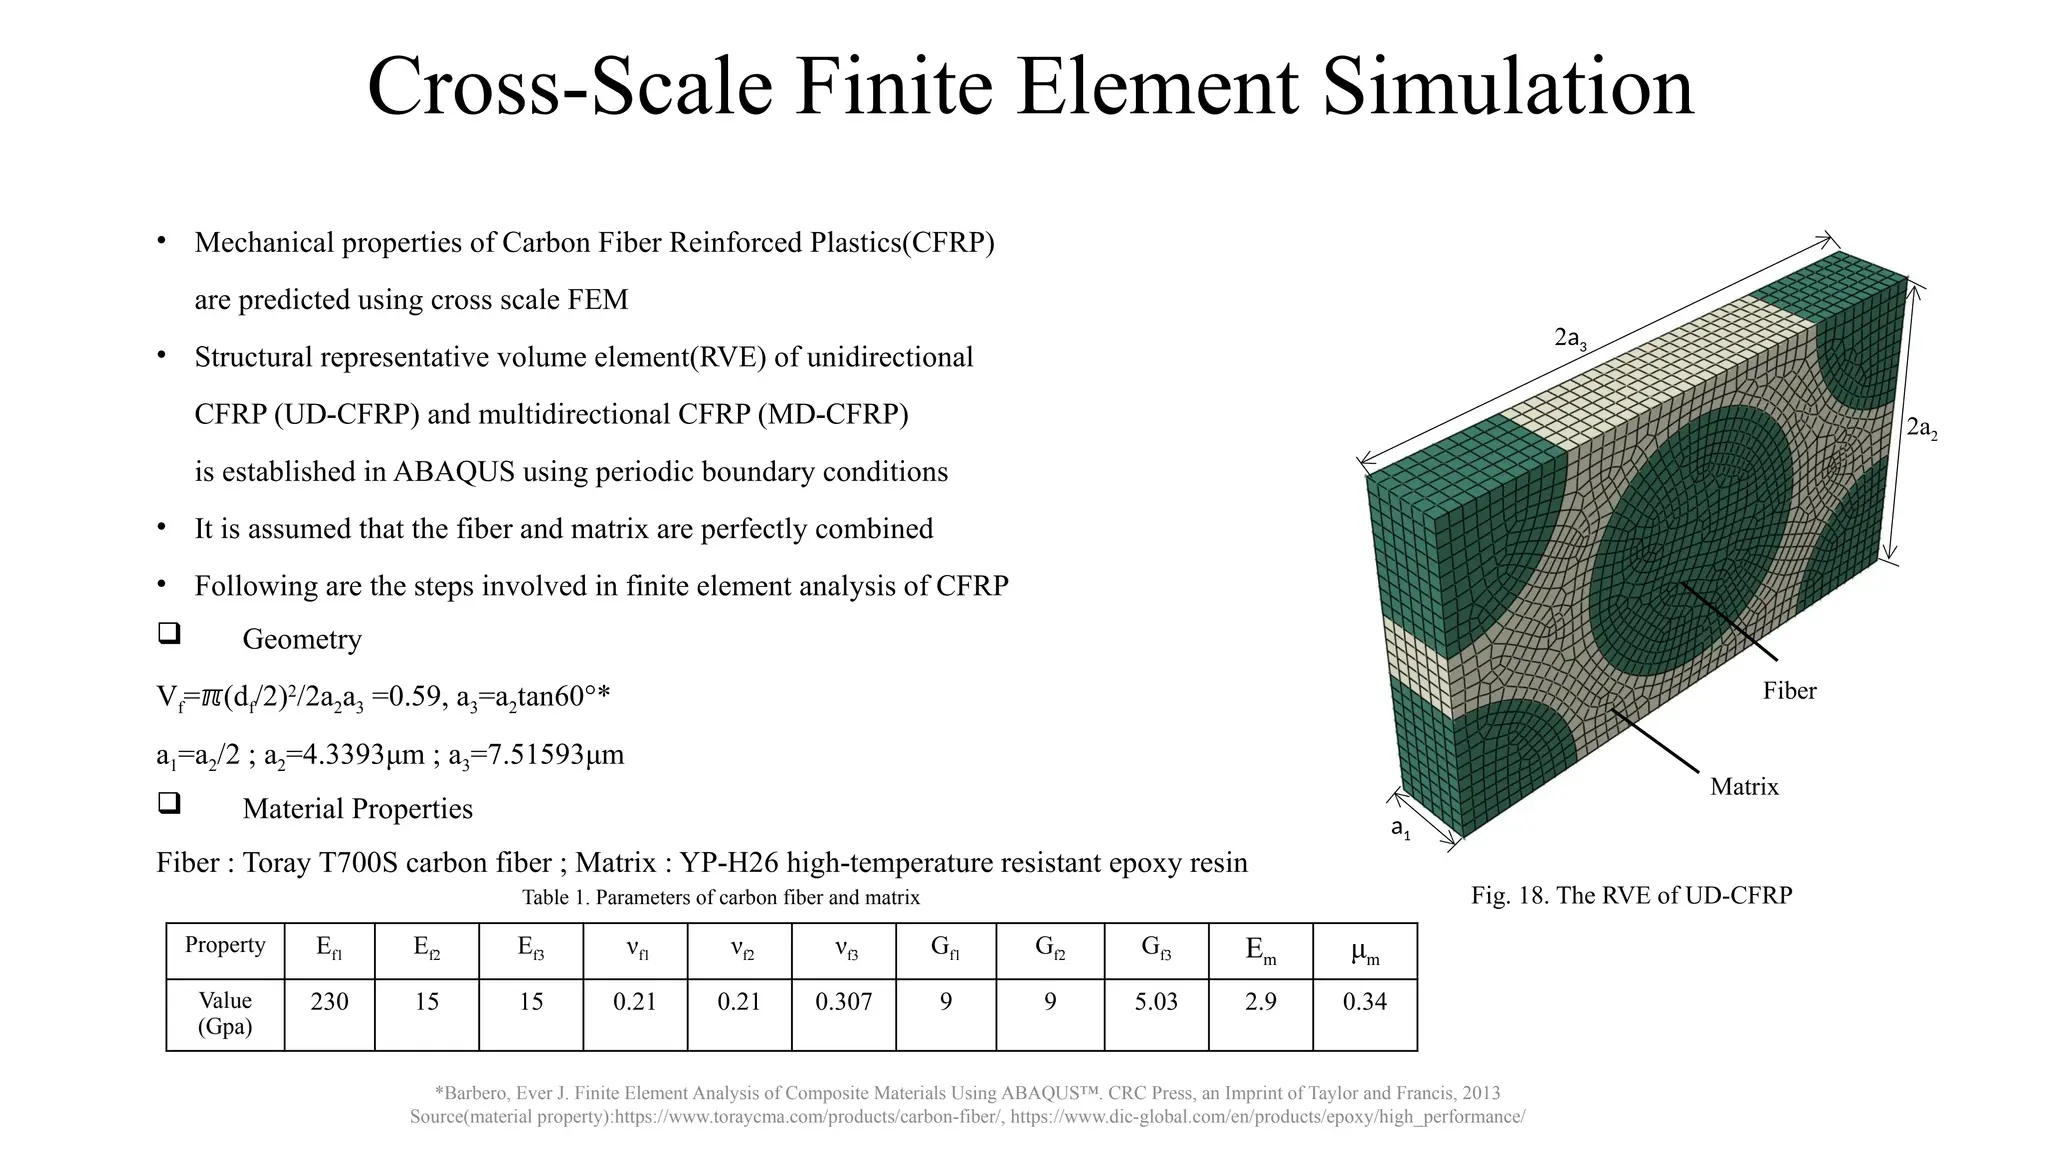
Cross-Scale Finite ElementSimulation
• Mechanical properties of Carbon Fiber Reinforced Plastics(CFRP)
are predicted using cross scale FEM
• Structural representative volume element(RVE) of unidirectional
CFRP (UD-CFRP) and multidirectional CFRP (MD-CFRP)
is established in ABAQUS using periodic boundary conditions
• It is assumed that the fiber and matrix are perfectly combined
• Following are the steps involved in finite element analysis of CFRP
Geometry
Vf= (d
ℼ f/2)2
/2a2a3 =0.59, a3=a2tan60°*
a1=a2/2 ; a2=4.3393μm ; a3=7.51593μm
Material Properties
Fiber : Toray T700S carbon fiber ; Matrix : YP-H26 high-temperature resistant epoxy resin
a1
2a3
2a2
Property Ef1 Ef2 Ef3 νf1 νf2 νf3 Gf1 Gf2 Gf3 Em μm
Value
(Gpa)
230 15 15 0.21 0.21 0.307 9 9 5.03 2.9 0.34
*Barbero, Ever J. Finite Element Analysis of Composite Materials Using ABAQUS™. CRC Press, an Imprint of Taylor and Francis, 2013
Source(material property):https://www.toraycma.com/products/carbon-fiber/, https://www.dic-global.com/en/products/epoxy/high_performance/
Fig. 18. The RVE of UD-CFRP
Table 1. Parameters of carbon fiber and matrix
Fiber
Matrix
17.
Cont…
Meshing
Boundaryconditions*:
ui(0,y,z) - ui(l,y,z) = ε̅ij[l,0,0]j (1)
ui(x,0,z) - ui(x,w,z) = ε̅ij[0,w,0]j (2)
ui(x,y,0) - ui(x,y,t) = ε̅ij[0,0,t]j (3)
where, i,j = 1,2,3; 0≤x≤l ; 0≤y≤w ; 0≤z≤t ;
ui denotes the displacement along the i direction;
ε̅ij denotes the global strain;
l,w, and t, respectively denotes the thickness, width and height of RVE
CFRP Number of
nodes
Number of
elements
Element type
UD 9891 8064 C3D8R
MD[0°/90°] 10544 9195 C3D8R
MD[0°/90°](simplified) 7936 6750 C3D8R
MD[0°/90°/45°/-45°] 15616 13500 C3D8R
MD[-45°/0°/45°/90°] 15616 13500 C3D8R
Fig. 19. Boundary conditions in (a) x-direction (b) y-direction and (c) z-direction for UD-CFRP
*Barbero, Ever J. Finite Element Analysis of Composite Materials Using ABAQUS™. CRC Press, an Imprint of Taylor and Francis, 2013
Table 2. Meshing details of different CFRP models
ux(0,y,z)=0
ux(l,y,z)=a1
uy(x,0,z)=0
uy(x,w,z)=2a2
uz(x,y,0)=0
uz(x,y,t)=2a3
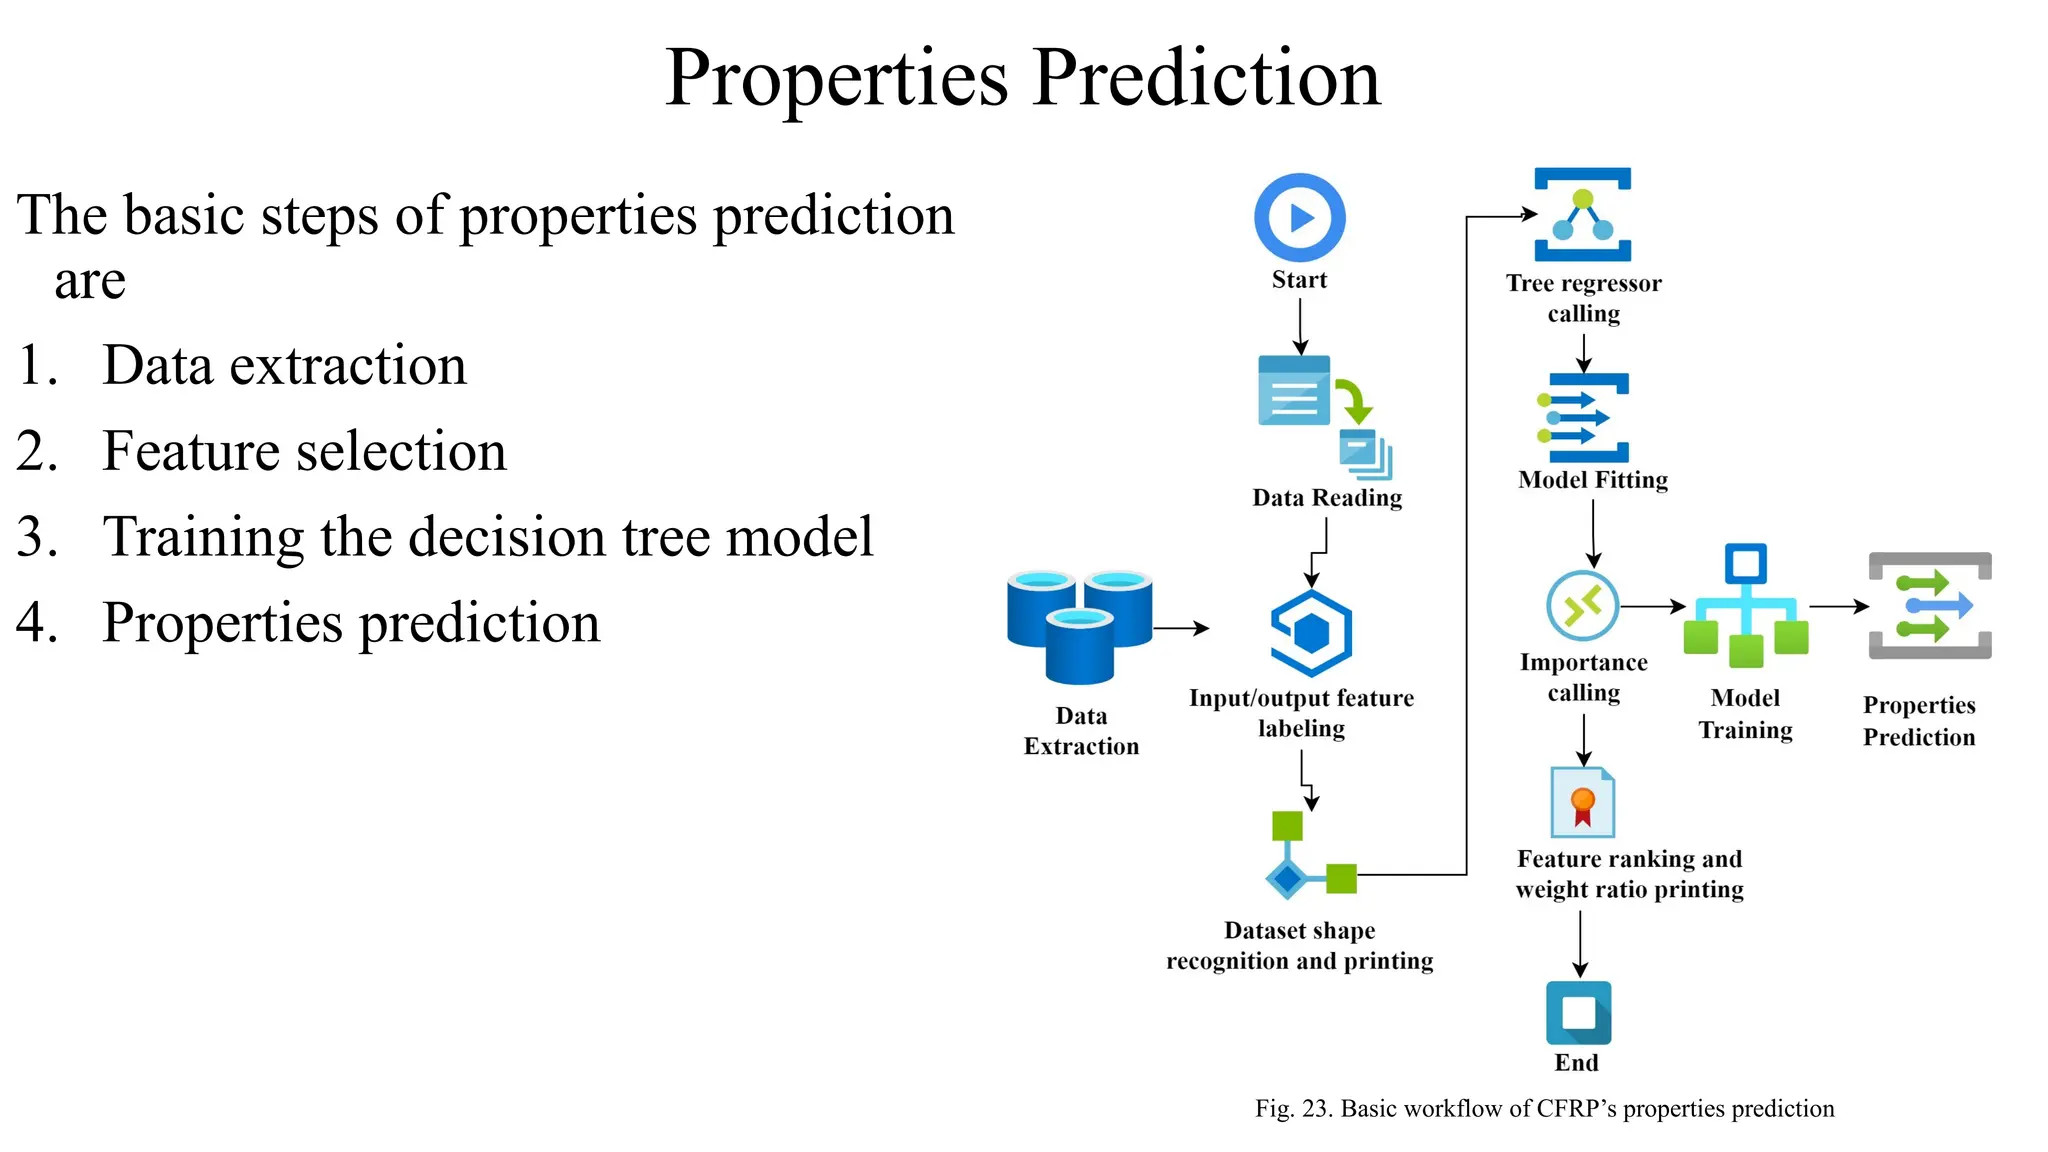
Properties Prediction
The basicsteps of properties prediction
are
1. Data extraction
2. Feature selection
3. Training the decision tree model
4. Properties prediction
Fig. 23. Basic workflow of CFRP’s properties prediction
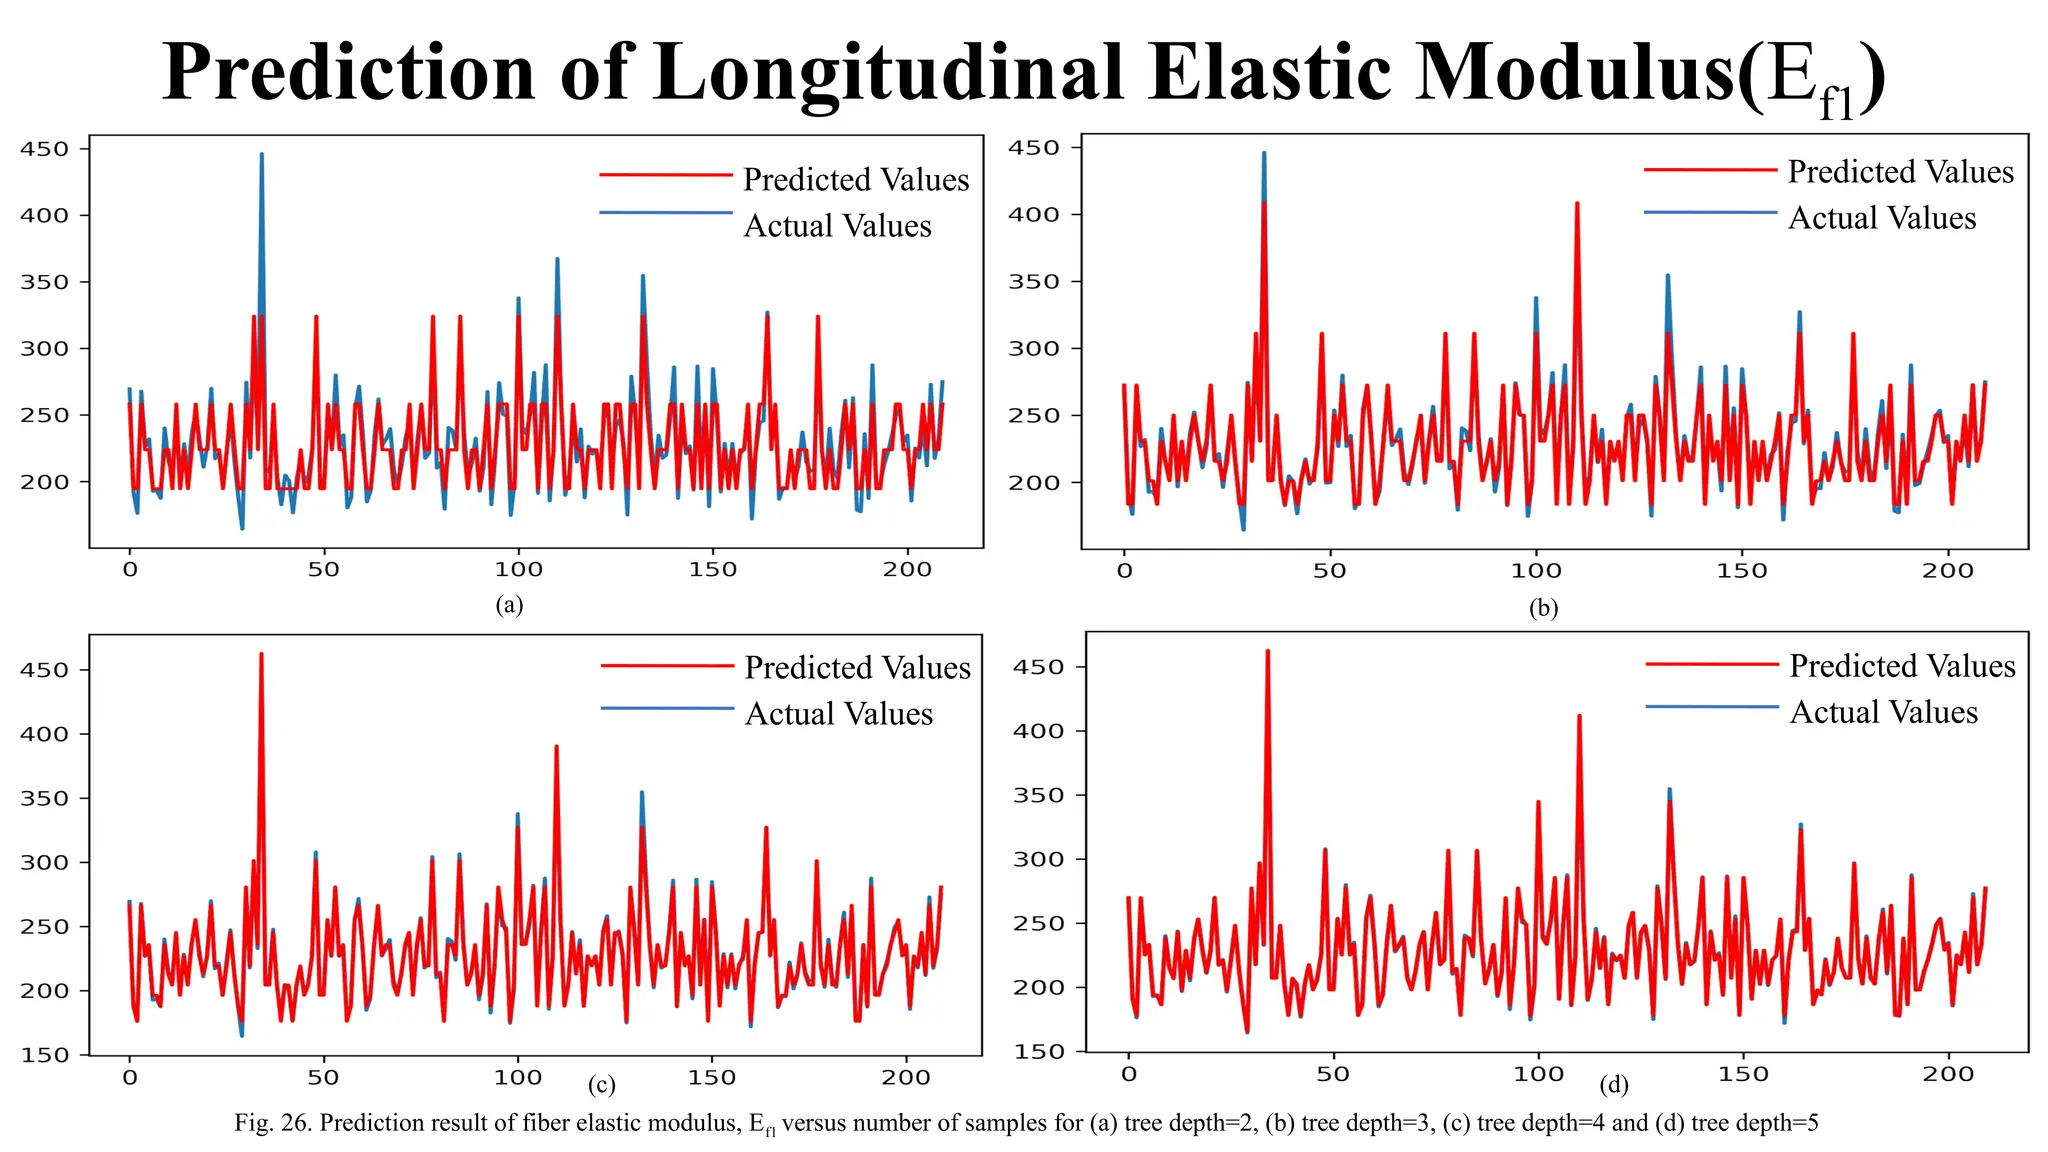
Prediction of LongitudinalElastic Modulus(Ef1)
(a) (b)
Fig. 26. Prediction result of fiber elastic modulus, Ef1 versus number of samples for (a) tree depth=2, (b) tree depth=3, (c) tree depth=4 and (d) tree depth=5
(c) (d)
Predicted Values
Actual Values
Predicted Values
Actual Values
Predicted Values
Actual Values
Predicted Values
Actual Values
25.
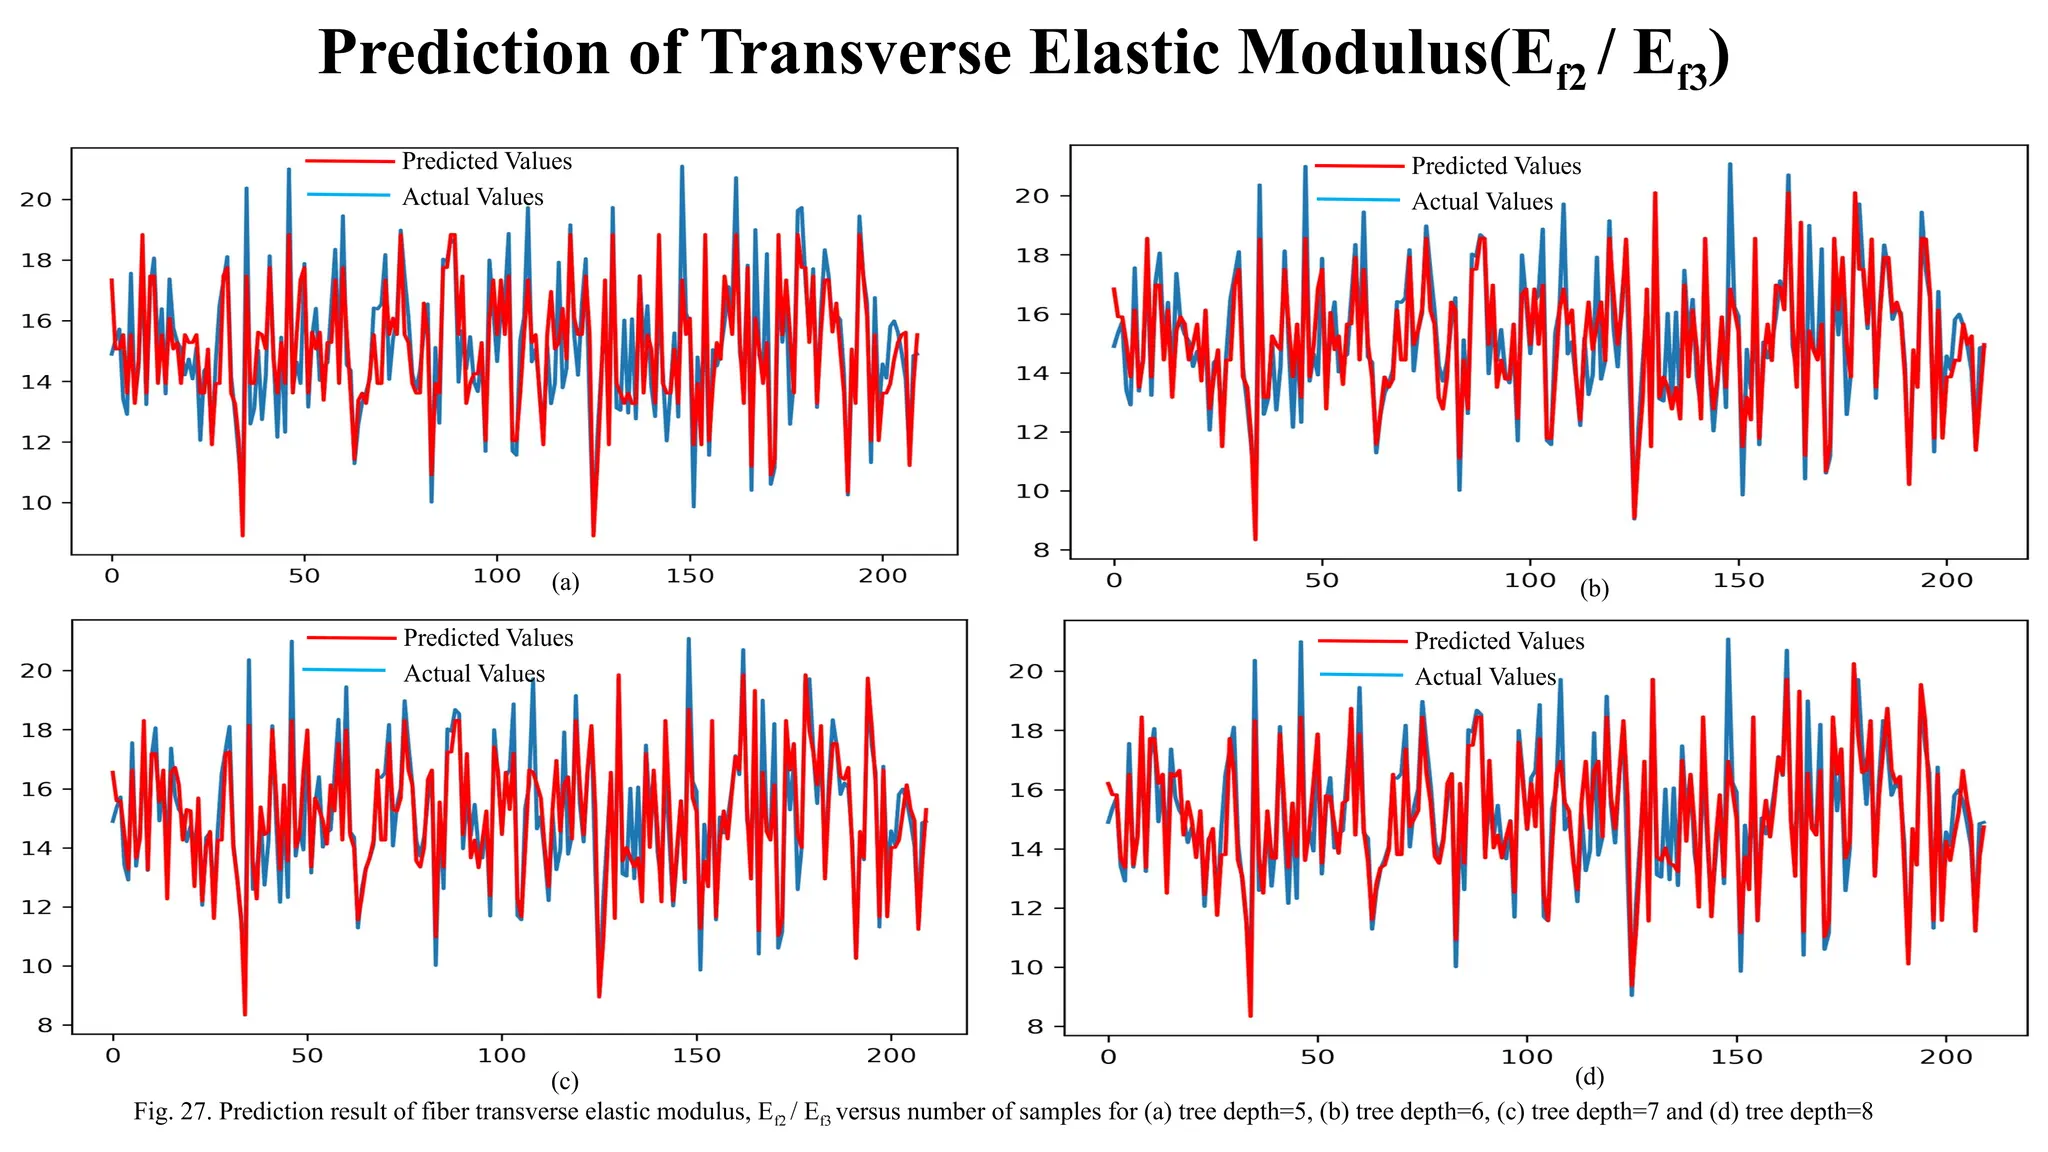
Prediction of TransverseElastic Modulus(Ef2 / Ef3)
(a) (b)
(c) (d)
Fig. 27. Prediction result of fiber transverse elastic modulus, Ef2 / Ef3 versus number of samples for (a) tree depth=5, (b) tree depth=6, (c) tree depth=7 and (d) tree depth=8
Predicted Values
Actual Values
Predicted Values
Actual Values
Predicted Values
Actual Values
Predicted Values
Actual Values
26.
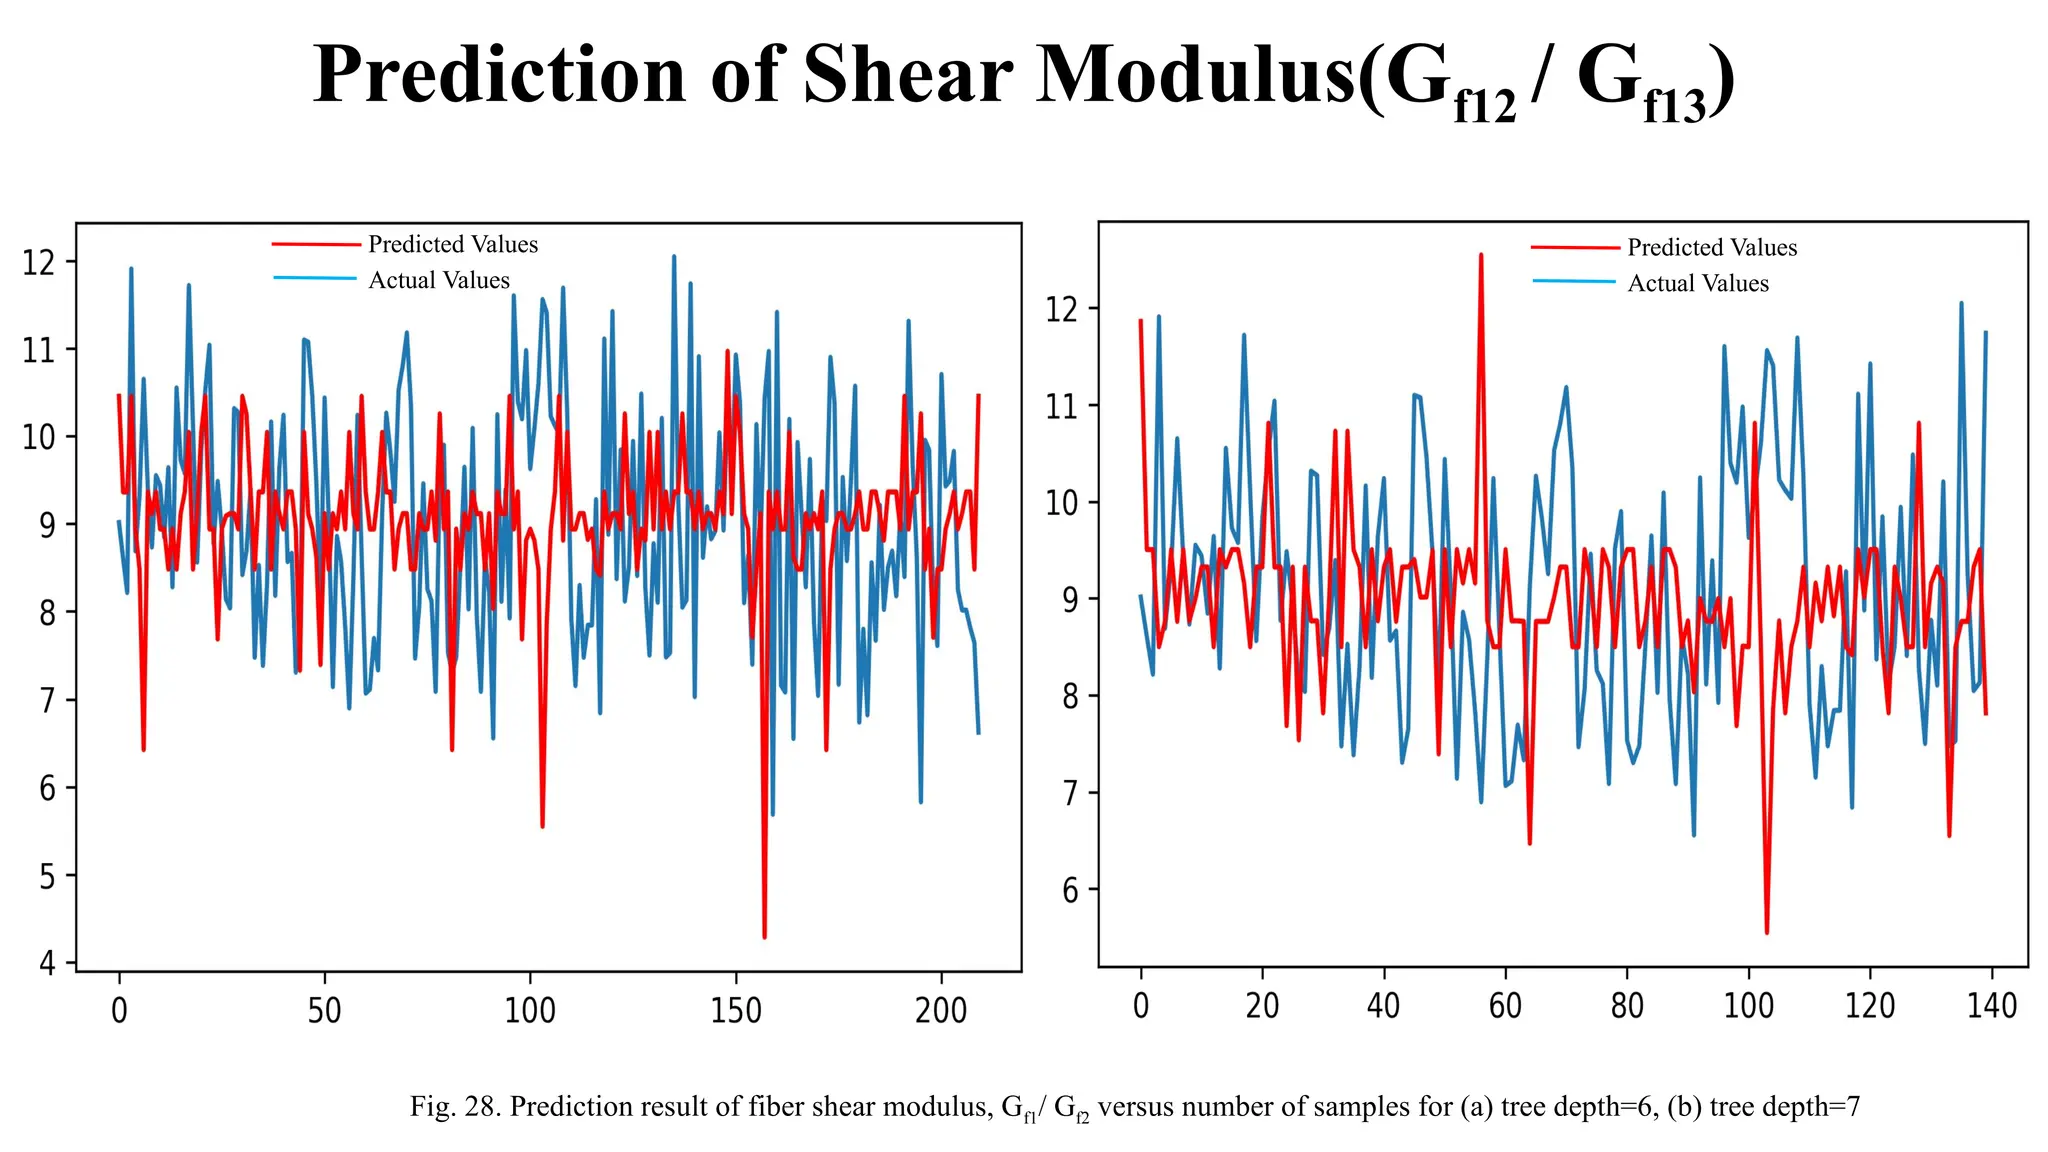
Prediction of ShearModulus(Gf12 / Gf13)
Fig. 28. Prediction result of fiber shear modulus, Gf1/ Gf2 versus number of samples for (a) tree depth=6, (b) tree depth=7
Predicted Values
Actual Values
Predicted Values
Actual Values
27.
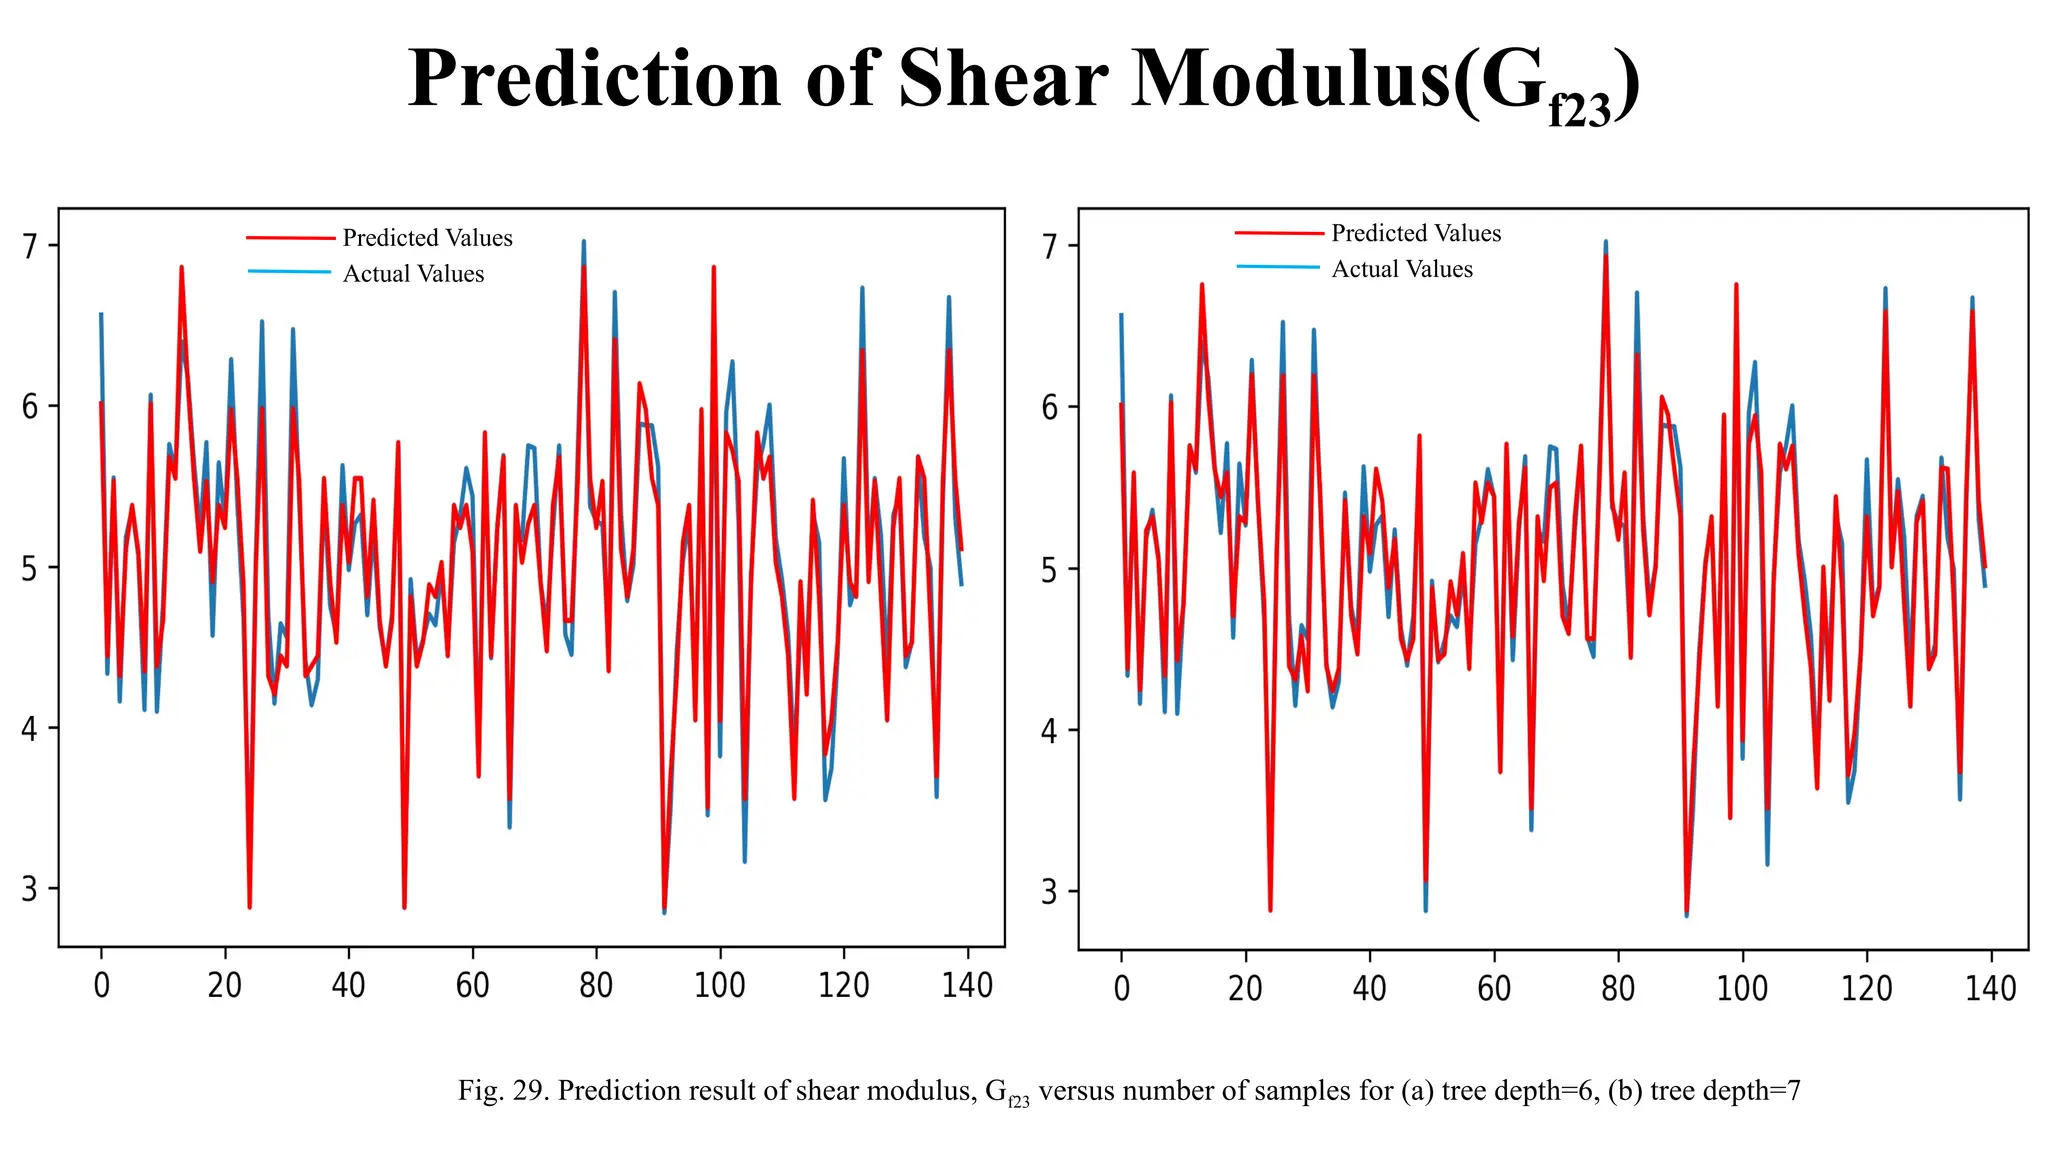
Prediction of ShearModulus(Gf23)
Fig. 29. Prediction result of shear modulus, Gf23 versus number of samples for (a) tree depth=6, (b) tree depth=7
Predicted Values
Actual Values
Predicted Values
Actual Values
28.
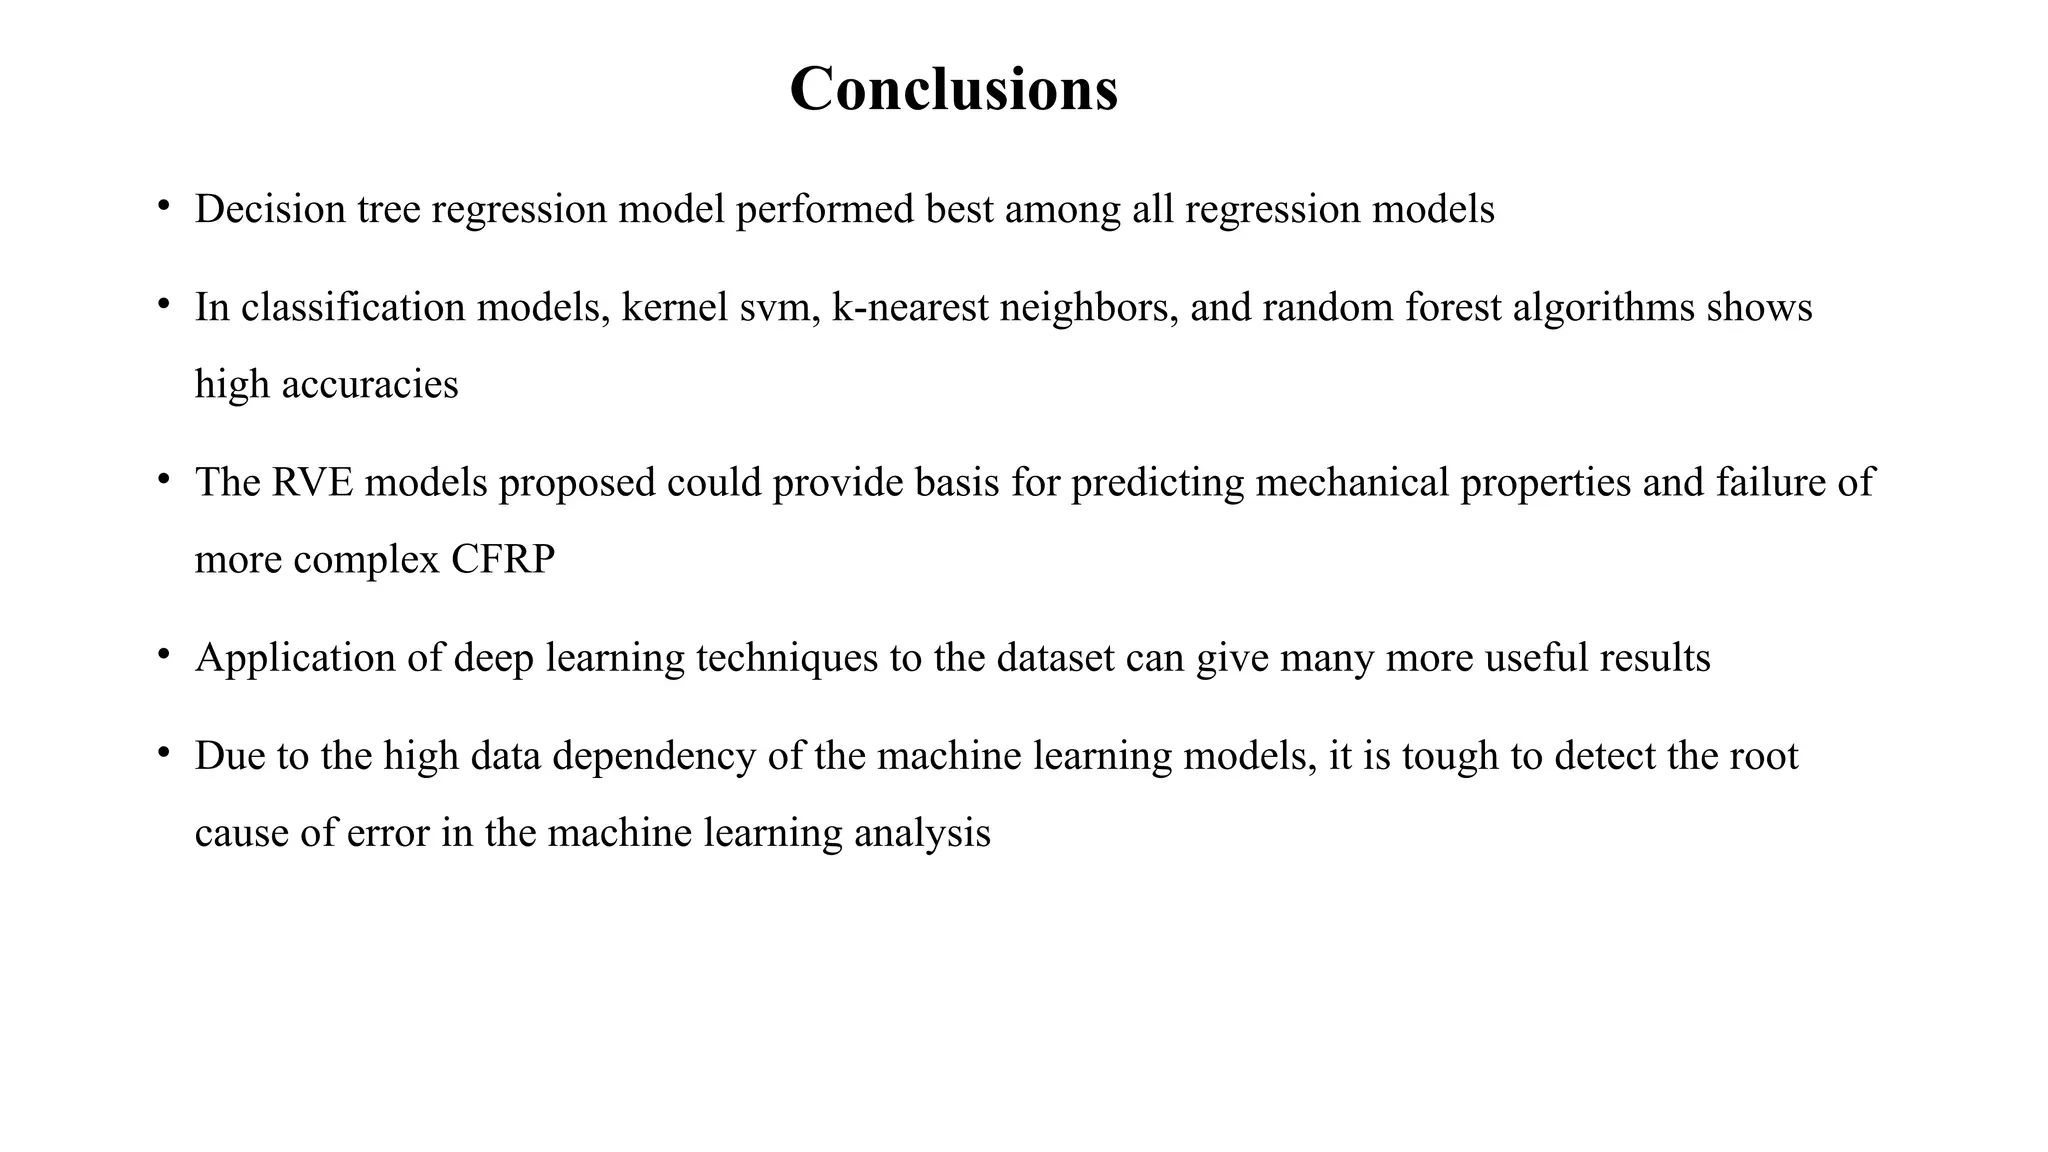
Conclusions
• Decision treeregression model performed best among all regression models
• In classification models, kernel svm, k-nearest neighbors, and random forest algorithms shows
high accuracies
• The RVE models proposed could provide basis for predicting mechanical properties and failure of
more complex CFRP
• Application of deep learning techniques to the dataset can give many more useful results
• Due to the high data dependency of the machine learning models, it is tough to detect the root
cause of error in the machine learning analysis
29.
References
Guo, Kai,et al. “Artificial Intelligence and Machine Learning in Design of Mechanical Materials.” Materials Horizons, vol. 8, no. 4, 2021, pp. 1153–1172.,
doi:10.1039/d0mh01451f.
Schmidt, Jonathan, et al. “Recent Advances and Applications of Machine Learning in Solid-State Materials Science.” Npj Computational Materials, vol. 5, no. 1,
2019, doi:10.1038/s41524-019-0221-0.
Liu, Yue, et al. “Materials Discovery and Design Using Machine Learning.” Journal of Materiomics, vol. 3, no. 3, 2017, pp. 159–177.,
doi:10.1016/j.jmat.2017.08.002.
Chen, Chun-Teh, and Grace X. Gu. “Machine Learning for Composite Materials.” MRS Communications, vol. 9, no. 2, 2019, pp. 556–566.,
doi:10.1557/mrc.2019.32.
Gu, Grace X., et al. “Optimization of Composite Fracture Properties: Method, Validation, and Applications.” Journal of Applied Mechanics, vol. 83, no. 7, 2016,
doi:10.1115/1.4033381.
Pathan, M.v., et al. “A New Algorithm to Generate Representative Volume Elements of Composites with Cylindrical or Spherical Fillers.” Composites Part B:
Engineering, vol. 110, 2017, pp. 267–278., doi:10.1016/j.compositesb.2016.10.078.
Gu, Grace X., et al. “De Novo Composite Design Based on Machine Learning Algorithm.” Extreme Mechanics Letters, vol. 18, 2018, pp. 19–28.,
doi:10.1016/j.eml.2017.10.001.
Qi, Zhenchao, et al. “Prediction of Mechanical Properties of Carbon Fiber Based on Cross-Scale FEM and Machine Learning.” Composite Structures, vol. 212, 2019,
pp. 199–206., doi:10.1016/j.compstruct.2019.01.042.
30.
Cont…
• Exabyte.io -Materials Discovery Cloud, exabyte.io/#case-study.
• “DocSend Document.” DocSend, exabyte.docsend.com/view/q7kbxab.
• “DocSend Document.” DocSend, exabyte.docsend.com/view/syitiek.
• Aflow Advanced Search, aflowlib.org/search/?lib=mechanical,crystal.
• Yuan, Chunhui, and Haitao Yang. “Research on K-Value Selection Method of K-Means Clustering Algorithm.” J, vol. 2, no. 2, 2019, pp. 226–235.,
doi:10.3390/j2020016.
• Fraley, C. “How Many Clusters? Which Clustering Method? Answers Via Model-Based Cluster Analysis.” The Computer Journal, vol. 41, no. 8, 1998, pp. 578–
588., doi:10.1093/comjnl/41.8.578.
• Han, Jiawei. "Spatial clustering methods in data mining: A survey." Geographic data mining and knowledge discovery (2001): 188-217.
• Kodinariya, Trupti M., and Prashant R. Makwana. "Review on determining number of Cluster in K-Means Clustering." International Journal 1.6 (2013): 90-95.
• Bakhtiar, Bakharudin Yusuf, Antonius Bima Murti Wijaya, and Hasan Dwi Cahyono. "PENGEMBANGAN SISTEM ANALISIS AKADEMIS
MENGGUNAKAN OLAP DAN DATA CLUSTERING STUDI KASUS: AKADEMIK UNIVERSITAS SEBELAS MARET SURAKARTA." ITSMART: Jurnal
Teknologi dan Informasi 4.1: 01-11.
• Yuan, Chunhui, and Haitao Yang. “Research on K-Value Selection Method of K-Means Clustering Algorithm.” J, vol. 2, no. 2, 2019, pp. 226–235.,
doi:10.3390/j2020016.
31.
cont…
• Shah, Kanish,et al. “A Comparative Analysis of Logistic Regression, Random Forest and KNN Models for the Text Classification.” Augmented Human
Research, vol. 5, no. 1, 2020, doi:10.1007/s41133-020-00032-0.
• Guo, Gongde, et al. “KNN Model-Based Approach in Classification.” On The Move to Meaningful Internet Systems 2003: CoopIS, DOA, and ODBASE Lecture
Notes in Computer Science, 2003, pp. 986–996., doi:10.1007/978-3-540-39964-3_62.
• Van Der Maaten, Laurens, Eric Postma, and Jaap Van den Herik. "Dimensionality reduction: a comparative." J Mach Learn Res 10.66-71 (2009): 13.
• Tang, E. Ke, et al. "Linear dimensionality reduction using relevance weighted LDA." Pattern recognition 38.4 (2005): 485-493.
• “Introduction to Dimensionality Reduction.” GeeksforGeeks, 8 Feb. 2018, www.geeksforgeeks.org/dimensionality-reduction/.
• Schaffer, Cullen. "Selecting a classification method by cross-validation." Machine Learning 13.1 (1993): 135-143.
• “1.4. Support Vector Machines.” Scikit, scikit-learn.org/stable/modules/svm.html.
• Huang, J.s., et al. “Data-Driven Machine Learning Approach for Exploring and Assessing Mechanical Properties of Carbon Nanotube-Reinforced Cement
Composites.” Composite Structures, vol. 267, 2021, p. 113917., doi:10.1016/j.compstruct.2021.113917.
• Le, Tien-Thinh. “Prediction of Tensile Strength of Polymer Carbon Nanotube Composites Using Practical Machine Learning Method.” Journal of Composite
Materials, vol. 55, no. 6, 2020, pp. 787–811., doi:10.1177/0021998320953540.
32.
cont…
• Nainggolan, Rena,et al. “Improved the Performance of the K-Means Cluster Using the Sum of Squared Error (SSE) Optimized by Using the Elbow Method.”
Journal of Physics: Conference Series, vol. 1361, no. 1, 2019, p. 012015., doi:10.1088/1742-6596/1361/1/012015.
• Guo, Kai, et al. “Artificial Intelligence and Machine Learning in Design of Mechanical Materials.” Materials Horizons, vol. 8, no. 4, 2021, pp. 1153–1172.,
doi:10.1039/d0mh01451f.
• Sen, Pratap Chandra, et al. “Supervised Classification Algorithms in Machine Learning: A Survey and Review.” Advances in Intelligent Systems and Computing
Emerging Technology in Modelling and Graphics, 2019, pp. 99–111., doi:10.1007/978-981-13-7403-6_11.
33.
Publication
• “Accuracy Predictionusing Data-Driven Algorithm for Carbon Containing Compounds”
• 4th
International Conference in Advances in Mechanical Engineering (ICAME 2022)
• “Best Paper Award ”
• Submitted in “Materials Today : Proceedings”, Elsevier publication, Scopus indexed

![Cont…
Meshing
Boundary conditions*:
ui(0,y,z) - ui(l,y,z) = ε̅ij[l,0,0]j (1)
ui(x,0,z) - ui(x,w,z) = ε̅ij[0,w,0]j (2)
ui(x,y,0) - ui(x,y,t) = ε̅ij[0,0,t]j (3)
where, i,j = 1,2,3; 0≤x≤l ; 0≤y≤w ; 0≤z≤t ;
ui denotes the displacement along the i direction;
ε̅ij denotes the global strain;
l,w, and t, respectively denotes the thickness, width and height of RVE
CFRP Number of
nodes
Number of
elements
Element type
UD 9891 8064 C3D8R
MD[0°/90°] 10544 9195 C3D8R
MD[0°/90°](simplified) 7936 6750 C3D8R
MD[0°/90°/45°/-45°] 15616 13500 C3D8R
MD[-45°/0°/45°/90°] 15616 13500 C3D8R
Fig. 19. Boundary conditions in (a) x-direction (b) y-direction and (c) z-direction for UD-CFRP
*Barbero, Ever J. Finite Element Analysis of Composite Materials Using ABAQUS™. CRC Press, an Imprint of Taylor and Francis, 2013
Table 2. Meshing details of different CFRP models
ux(0,y,z)=0
ux(l,y,z)=a1
uy(x,0,z)=0
uy(x,w,z)=2a2
uz(x,y,0)=0
uz(x,y,t)=2a3](https://image.slidesharecdn.com/materialdesign-250424183000-671702c7/75/Leveraging-Machine-Learning-for-Accelerated-Material-Design-pptx-17-2048.jpg)
![Cont…
2. MD-CFRP[0°/90°]
Parameters
(Gpa)
[0°/90°] [0°/90°]
(simplified)
E11 78.6514 73.5403
E22 78.6514 73.5240
E33 5.3963 7.7602
G12 2.9930 3.0238
G13 2.1626 3.7739
G23 2.1626 3.7671 Fig. 21. The RVE of [0°/90°] and simplified [0°/90°] CFRP
Matrix
Fiber
a3
a3
2a3
90°
0°](https://image.slidesharecdn.com/materialdesign-250424183000-671702c7/75/Leveraging-Machine-Learning-for-Accelerated-Material-Design-pptx-19-2048.jpg)
![Cont…
3. MD-CFRP
Parameters
(GPa)
MDC
[0°/90°/45°/-45°]
MDC
[-45°/0°/45°/90°]
E11 43.5482 43.4646
E22 44.3627 44.2384
E33 7.7597 7.7596
G12 17.8145 17.5311
G13 3.4099 3.4190
G23 3.4099 3.4190
Fig. 22. The simplified RVE model of MD-CFRP
0°
90°
45°
-45°
90°
-45°
45°
0°](https://image.slidesharecdn.com/materialdesign-250424183000-671702c7/75/Leveraging-Machine-Learning-for-Accelerated-Material-Design-pptx-20-2048.jpg)