Lenovo ThinkServer RD650: Continuous performance in extreme temperatures
•
1 like•720 views

Servers that are designed to operate at higher inlet temperatures allow for significant energy reductions in your data center. The Lenovo ThinkServer RD650, with its dynamic environmental design, lets you take advantage of these cost reductions. Lenovo has specifically enhanced the ThinkServer RD650 architecture to plan for higher temperatures and maximize data center efficiency. In our labs, this server ran two concurrent workloads, exercising CPU, disk, and memory subsystems, continuously at temperatures ranging from 40 to 45° C, with the temperature staying at or above 43° C for more than half the time for eight days—and did so without significantly varying in performance levels during the test period.

Recommended
Recommended
More Related Content
What's hot
What's hot (20)
Similar to Lenovo ThinkServer RD650: Continuous performance in extreme temperatures
Similar to Lenovo ThinkServer RD650: Continuous performance in extreme temperatures (20)
More from Principled Technologies
More from Principled Technologies (20)
Recently uploaded
Recently uploaded (20)
Lenovo ThinkServer RD650: Continuous performance in extreme temperatures
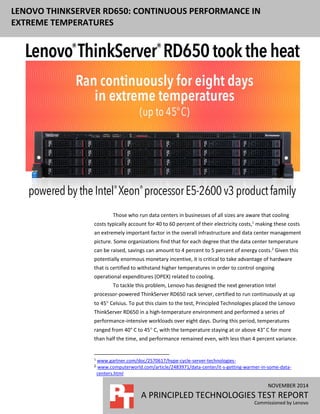
- 1. NOVEMBER 2014 A PRINCIPLED TECHNOLOGIES TEST REPORT Commissioned by Lenovo LENOVO THINKSERVER RD650: CONTINUOUS PERFORMANCE IN EXTREME TEMPERATURES Those who run data centers in businesses of all sizes are aware that cooling costs typically account for 40 to 60 percent of their electricity costs,1 making these costs an extremely important factor in the overall infrastructure and data center management picture. Some organizations find that for each degree that the data center temperature can be raised, savings can amount to 4 percent to 5 percent of energy costs.2 Given this potentially enormous monetary incentive, it is critical to take advantage of hardware that is certified to withstand higher temperatures in order to control ongoing operational expenditures (OPEX) related to cooling. To tackle this problem, Lenovo has designed the next generation Intel processor-powered ThinkServer RD650 rack server, certified to run continuously at up to 45 Celsius. To put this claim to the test, Principled Technologies placed the Lenovo ThinkServer RD650 in a high-temperature environment and performed a series of performance-intensive workloads over eight days. During this period, temperatures ranged from 40° C to 45 C, with the temperature staying at or above 43° C for more than half the time, and performance remained even, with less than 4 percent variance. 1 www.gartner.com/doc/2570617/hype-cycle-server-technologies- 2 www.computerworld.com/article/2483971/data-center/it-s-getting-warmer-in-some-data- centers.html
- 2. A Principled Technologies test report 2Lenovo ThinkServer RD650: Continuous performance in extreme temperatures The fact that the Lenovo ThinkServer RD650 can operate continuously at 45 C allows for enormous flexibility and significant economic benefits for your company. This proof of reliability makes the Lenovo ThinkServer RD650 attractive not only to those with large data centers; companies who deploy their servers in tight areas lacking ventilation can also benefit. By giving you the option to increase your server input temperature, the Lenovo ThinkServer RD650 can directly affect your overall cost picture. SERVER OPERATING TEMPERATURE—WHY IT MATTERS The growth of data center infrastructure and cloud environments has ballooned in recent years, with data center electricity costs contributing to between 1 percent and 3 percent of the total regional electricity use, depending on the region.3 This huge energy impact shows no signs of slowing down, and pressure is constant on all data centers to reduce costs, particularly in the area of energy usage. In fact, between 50 percent and 71 percent of respondents to a recent industry survey answered that it was “very important” to reduce their overall data center energy consumption.4 Given that cooling the IT infrastructure accounts for approximately half of the energy costs of a data center, the ability of an organization to drive down cooling costs is vital. To do so, either the cost of energy must go down, which is unlikely, or the threshold to which servers must be cooled has to go up. This threshold is referred to as the inlet temperature. In the same industry survey, 64 percent of respondents in the 5,000 server+ category responded that raising the server inlet temperature was key in their roadmap for lowering cooling costs. In the 1,000 servers or less category, 39 percent responded similarly. One final piece of evidence that customers are looking to raise inlet temperature was the year-over-year percentage increase of respondents who used an inlet temperature of greater than 75 F (24° C). In this particular survey, the percentage increased from 3 percent in 2012 to 7 percent in 2013. In 2011, the American Society of Heating, Refrigerating and Air-Conditioning Engineers (ASHRAE) set forth guidelines recommending that data center operators maintain temperatures between 18 C and 27 C. Server manufacturers have taken some steps to ensure their equipment can handle temperatures above this extreme, some up to 35 C, well above the ASHRAE recommendations. Some vendors then go so far as to suggest that data centers stay within the ASHRAE range at all times, while others allow brief periods of operation at temperatures as high as 45 C. In response to these conflicting messages, cautious data center managers have generally kept temperatures below 27 C, resulting in unnecessarily high energy costs for cooling. 3 www.analyticspress.com/datacenters.html 4 uptimeinstitute.com/images/stories/DataCenterSurvey_assets/uptime-institute-2013-data- center-survey.pdf
- 3. A Principled Technologies test report 3Lenovo ThinkServer RD650: Continuous performance in extreme temperatures One area of innovation in data center cooling has been in alternative supporting infrastructure approaches such as fresh-air and chiller-less technologies. These approaches, while beneficial, can require an expensive retrofit of your current environment, or even a new data center build out altogether, both of which are likely cost prohibitive. One alternative to redesigning the cooling mechanisms of your environment is finding a way to let the temperatures safely rise to a new higher baseline. Some data center managers have been reluctant to do so, however, for fear of hardware failure. But this fear may be unproven. In a recent study, Intel measured the impact of using only outside air to cool a data center, and found that 450 high-density servers operating at temperatures as high as 33 C failed no more frequently than those operating at cooler temperatures.5 Lenovo has brought this concept to the next level by building high-temperature resiliency directly into the ThinkServer RD650 architecture. THE LENOVO THINKSERVER RD650—DESIGNED TO TAKE THE HEAT Lenovo has designed the ThinkServer RD650 specifically to operate continuously at extremely high temperatures. Their approach includes the following: Stringent component temperature and voltage de-rating requirements insure reliable operation across all supported environments. Positioning of components in the system optimizes airflow. Advanced thermal controls allow the temperature of critical components to often be lower at higher ambient temperatures than in normal environments. The system design was thoroughly tested across the entire A4 temperature range. In addition to the extra reliability that comes from its ability to operate continuously at very high temperatures, the Lenovo ThinkServer RD650 also boasts outstanding storage density and a highly flexible design. It has up to 26 drive bays and 74.4 TB of internal storage capacity, making it well suited for applications with large storage needs, such as databases, data analytics clusters, and video streaming. With the latest Intel Xeon processors, large memory capacity, multiple chassis types, RAID choices, and I/O options, you can easily create the right RD650 configuration for your specific business needs. Learn more at shop.lenovo.com/us/en/servers/thinkserver/racks/rd650/. 5 www.intel.com/content/www/us/en/data-center-efficiency/data-center-efficiency-xeon- reducing-data-center-cost-with-air-economizer-brief.html
- 4. A Principled Technologies test report 4Lenovo ThinkServer RD650: Continuous performance in extreme temperatures TEST APPROACH AND RESULTS For testing, we used two concurrent performance-intensive workloads to stress the server continuously over the eight-day period. We used SPECjbb2005, an industry- standard benchmark designed to simulate middleware software, to maintain approximately 50 percent CPU utilization. This simulates a real-world workload of constant processor and memory activity. We also used Iometer, a standard IO benchmarking tool, to exercise the disk subsystem for the duration of the test. We did not design the workload for maximum IO performance, but rather to ensure constant disk activity. For full details on each of the workload parameters, see Appendix B. To control the server inlet temperature, we installed the Lenovo ThinkServer RD650 into a temperature-controlled server rack assembly. The test fixture was designed to run the server at as close to the maximum 45° C without going over. The assembly temperature ranged from 40° C to 45° C throughout the duration of testing, staying at or above 43° C for more than half the time. The results showed the ThinkServer RD650 handled the heat, operated without interruption, and maintained consistent performance in our two workloads across the eight-day period. In Figure 1, we show the BOPS (SPECjbb2005) and IOPS (Iometer) outputs across the test window. The important thing to note is that variance was very small, less than 4 percent, showing that the high temperature conditions had no impact on performance. Given the large amount of data, we selected approximately five data points per day, for a total of 40 data points, for this depiction. Figure 1: Performance of the Lenovo ThinkServer RD650 over eight days, measured with SPECjbb2005 and Iometer workloads. 200 205 210 215 220 225 230 235 240 245 250 0 100,000 200,000 300,000 400,000 500,000 600,000 700,000 800,000 900,000 1,000,000 IOPS BOPS Extreme temperature server performance SPECjbb2005 Iometer
- 5. A Principled Technologies test report 5Lenovo ThinkServer RD650: Continuous performance in extreme temperatures About the Intel Xeon processor E5-2600 v3 product family According to Intel, the Intel Xeon processor E5-2600 v3 product family “helps IT address the growing demands placed on infrastructure, from supporting business growth to enabling new services faster, delivering new applications in the enterprise, technical computing, communications, storage, and cloud.” It also delivers benefits in performance, power efficiency, virtualization, and security. The E5-2600 v3 product family has up to 50 percent more cores and cache than processors from the previous generation. Other features include the following: Intel Advanced Vector Extensions 2 (AVX2) Intel Quick Path Interconnect link Up to 18 cores and 36 threads per socket Up to 45MB of last level cache Next-generation DDR4 memory support Intel Integrated I/O providing up to 80 PCIe lanes per two-socket server Intel AES-NI data encryption/decryption The Intel Xeon processor E5-2600 v3 product family also uses Intel Intelligent Power technology and Per-core P states to maximize energy efficiency. Learn more at www.intel.com/content/www/us/en/processors/xeon/xeon-e5-brief.html. Middleware workload SPECjbb2005 is an industry-standard benchmark created by the Standard Performance Evaluation Corp. (SPEC®) to measure a server’s Java performance. (Note: SPEC and the SPECjbb2005 are trademarks of the Standard Performance Evaluation Corporation.) SPEC modeled SPECjbb2005 on the three-tier client/server architecture, with the middle layer as the primary focus. According to SPEC, “Random input selection represents the first (user) tier. SPECjbb2005 fully implements the middle-tier business logic. The third tier is represented by tables of objects, implemented by Java Collections, rather than a separate database.”6 SPECjbb2005 utilizes multiple special data groups and multiple threads as it runs. Each data unit is a “warehouse,” a roughly 25MB collection of data objects. Each thread represents an active user posting transaction requests within a warehouse. The benchmark run begins with one warehouse and then increases the number of warehouses; its goal is to saturate the server’s processor capacity. As the number of warehouses increases, so does the number of threads. The benchmark’s metric portrays the server’s throughput in business operations per second or SPECjbb2005 BOPS. A higher number of SPECjbb2005 BOPS is better. Note that our tests were not for the 6 www.spec.org/jbb2005
- 6. A Principled Technologies test report 6Lenovo ThinkServer RD650: Continuous performance in extreme temperatures purposes of high scores but rather constant performance. For more information on SPECjbb2005, go to www.spec.org. Disk workload To exercise the disk subsystem, we used the Iometer tool, which measures IOPS and throughput on both single and clustered systems. Iometer performs I/O operations to stress a system, and then records the performance of these I/O operations and the system stress they create. We used Iometer 1.1.0 to exercise the disk subsystem. For more details about Iometer, see www.iometer.org. CONCLUSION Servers that are designed to operate at higher inlet temperatures allow for significant energy reductions in your data center. The Lenovo ThinkServer RD650, with its dynamic environmental design, lets you take advantage of these cost reductions. Lenovo has specifically enhanced the ThinkServer RD650 architecture to plan for higher temperatures and maximize data center efficiency. In our labs, this server ran two concurrent workloads, exercising CPU, disk, and memory subsystems, continuously at temperatures ranging from 40 to 45° C, with the temperature staying at or above 43° C for more than half the time for eight days—and did so without significantly varying in performance levels during the test period.
- 7. A Principled Technologies test report 7Lenovo ThinkServer RD650: Continuous performance in extreme temperatures APPENDIX A – SYSTEM CONFIGURATION INFORMATION Figure 2 provides detailed configuration information for the test server. System Lenovo ThinkServer RD650 Power supplies Total number 2 Vendor and model number Delta DPS-1100EB Wattage of each (W) 1,100 Cooling fans Total number 6 Vendor and model number PFR0612UHE Volts 12 Amps 1.50 General Number of processor packages 2 Number of cores per processor 12 Number of hardware threads per core 2 System power management policy Balanced CPU Vendor Intel Name Xeon Model number E5-2680 v3 Socket type LGA-2011-3 Core frequency (GHz) 2.50 Bus frequency 9.6 GT/s L1 cache 32 KB + 32 KB (per core) L2 cache 256 KB (per core) L3 cache 30 MB Platform Vendor and model number Lenovo ThinkServer RD650 BIOS name and version 1.10.0 BIOS settings Default Memory module(s) Total RAM in system (GB) 256 Vendor and model number Hynix HMA84GL7MMR4N Type PC4-2133 Speed (MHz) 2,133 Speed running in the system (MHz) 2,133 Timing/Latency (tCL-tRCD-tRP-tRASmin) 11-11-11-33 Size (GB) 32 Number of RAM module(s) 8 Chip organization Dual sided Rank Quad
- 8. A Principled Technologies test report 8Lenovo ThinkServer RD650: Continuous performance in extreme temperatures System Lenovo ThinkServer RD650 Operating system Name Windows Server® 2012 R2 Datacenter Build number 9200 File system NTFS Language English RAID controller Vendor and model number Lenovo ThinkServer RAID 720i AnyRAID Driver version 6.703.3.0 Hard drives First hard drive type Vendor and model number Lenovo ST9500620NS Number of drives 2 Size (GB) 500 RPM 7,200 Type SATA Second hard drive type Vendor and model number Lenovo ST3300657SS Number of drives 8 Size (GB) 300 RPM 15,000 Type SAS Ethernet adapters Vendor and model number Intel I350-T2 Server Adapter Type Integrated Driver 1211.97.0 Figure 2: Configuration information for the test server.
- 9. A Principled Technologies test report 9Lenovo ThinkServer RD650: Continuous performance in extreme temperatures APPENDIX B – HOW WE TESTED To stress the server, we ran SPECjbb2005 and Iometer at the same time on the ThinkServer RD650. The RD650 had two 500GB hard drives that we configured in a RIAD 1 for the OS. We configured eight 300GB hard drives in a RAID 10 which we used for Iometer testing. We configured SPECjbb2005 so it maintained a 50 percent processor utilization. We used batch files to run the test. We created a main batch file that executed a SPECjbb2005 and Iometer batch file. The main batch file was a loop, so it would start the test over as soon as both SPECjbb2005 and Iometer finished their runs. Each run was one hour long. SPECjbb2005 We used SPECjbb2005 version 1.07. We followed SPEC's run rules. (For more information about SPECjbb2005 and its run rules, see www.spec.org/jbb2005/docs/RunRules.html.) We installed SPECjbb2005 by copying the contents of the SPECjbb2005 CD to the directory C:SPECjbb2005 on the server's hard disk. SPECjbb2005 requires a Java Virtual Machine (JVM) on the system under test. We used Oracle Java SE Runtime Environment (build 1.7.0_67-b01). We installed the JVM into directory C:java using the default installation settings. After the installation we modified the SPECjbb.props file in the root SPECjbb2005 directory by changing the number of JVMs to four. We also changed the input.starting_number_warehouses to 14 and input.ending_number_warehouses to 28. This allowed us to keep a constant load on the server. We used the affinity switch in the batch file to set which processor cores to use for testing. We used half of the available threads so we had a sustained 50 percent processor utilization. The following are the contents of the SPECjbb2005 batch file we use for testing. @echo off set path="C:javabin";%path% set JVM=4 :: Set JAVA_HOME to Java.exe path. set JAVA_HOME="C:javabin" :stage1 set PROPFILE=SPECjbb.props set JAVAOPTIONS= -Xms256m -Xmx256m rem set JBBJARS=.jbb.jar;.check.jar set JBBJARS=.jbb.jar;.jbb_no_precompile.jar;.check.jar;.reporter.jar set CLASSPATH=%JBBJARS%;%CLASSPATH% :stage2 echo Using CLASSPATH entries: for %%c in ( %CLASSPATH% ) do echo %%c @echo on start /b C:javabinjava.exe %JAVAOPTIONS% spec.jbb.Controller -propfile %PROPFILE% @echo off @echo on start /AFFINITY 555 /B C:javabinjava.exe -Xmx60g -Xms60g -Xmn40g - XX:+UseParallelOldGC -XX:-UseBiasedLocking spec.jbb.JBBmain -propfile %PROPFILE% -id 1 > multi.1 @echo off
- 10. A Principled Technologies test report 10Lenovo ThinkServer RD650: Continuous performance in extreme temperatures @echo on start /AFFINITY 555000 /B C:javabinjava.exe -Xmx60g -Xms60g -Xmn40g - XX:+UseParallelOldGC -XX:-UseBiasedLocking spec.jbb.JBBmain -propfile %PROPFILE% -id 2 > multi.2 @echo off @echo on start /AFFINITY 555000000 /B C:javabinjava.exe -Xmx60g -Xms60g -Xmn40g - XX:+UseParallelOldGC -XX:-UseBiasedLocking spec.jbb.JBBmain -propfile %PROPFILE% -id 3 > multi.3 @echo off @echo on start /AFFINITY 555000000000 /B C:javabinjava.exe -Xmx60g -Xms60g -Xmn40g - XX:+UseParallelOldGC -XX:-UseBiasedLocking spec.jbb.JBBmain -propfile %PROPFILE% -id 4 > multi.4 @echo off :END Exit Iometer Iometer performs I/O operations to stress a system and then records the results in number of IOPS. Iometer can create and measure workloads on a single system's internal drives or on remote storage. We used Iometer version 1.1.0 for testing. More information about Iometer can be found at www.iometer.org/. We installed Iometer with the default installation options in the C:Iometer directory. We started Iometer using the following batch file we use for testing. The file.icf file stored our test settings. iometer /c File.icf /r results.csv exit Figure 3 details the Iometer access specifications we used for testing. Block size % of size % reads % random delay Burst Align Reply 512 10 80 100 0 1 4,096 0 1,024 5 80 100 0 1 4,096 0 2,048 5 80 100 0 1 4,096 0 4,096 60 80 100 0 1 4,096 0 8,192 2 80 100 0 1 4,096 0 16,384 4 80 100 0 1 4,096 0 32,768 4 80 100 0 1 4,096 0 65,536 10 80 100 0 1 4,096 0 Figure 3: Iometer access specifications.
- 11. A Principled Technologies test report 11Lenovo ThinkServer RD650: Continuous performance in extreme temperatures ABOUT PRINCIPLED TECHNOLOGIES Principled Technologies, Inc. 1007 Slater Road, Suite 300 Durham, NC, 27703 www.principledtechnologies.com We provide industry-leading technology assessment and fact-based marketing services. We bring to every assignment extensive experience with and expertise in all aspects of technology testing and analysis, from researching new technologies, to developing new methodologies, to testing with existing and new tools. When the assessment is complete, we know how to present the results to a broad range of target audiences. We provide our clients with the materials they need, from market-focused data to use in their own collateral to custom sales aids, such as test reports, performance assessments, and white papers. Every document reflects the results of our trusted independent analysis. We provide customized services that focus on our clients’ individual requirements. Whether the technology involves hardware, software, Web sites, or services, we offer the experience, expertise, and tools to help our clients assess how it will fare against its competition, its performance, its market readiness, and its quality and reliability. Our founders, Mark L. Van Name and Bill Catchings, have worked together in technology assessment for over 20 years. As journalists, they published over a thousand articles on a wide array of technology subjects. They created and led the Ziff-Davis Benchmark Operation, which developed such industry-standard benchmarks as Ziff Davis Media’s Winstone and WebBench. They founded and led eTesting Labs, and after the acquisition of that company by Lionbridge Technologies were the head and CTO of VeriTest. Principled Technologies is a registered trademark of Principled Technologies, Inc. All other product names are the trademarks of their respective owners. Disclaimer of Warranties; Limitation of Liability: PRINCIPLED TECHNOLOGIES, INC. HAS MADE REASONABLE EFFORTS TO ENSURE THE ACCURACY AND VALIDITY OF ITS TESTING, HOWEVER, PRINCIPLED TECHNOLOGIES, INC. SPECIFICALLY DISCLAIMS ANY WARRANTY, EXPRESSED OR IMPLIED, RELATING TO THE TEST RESULTS AND ANALYSIS, THEIR ACCURACY, COMPLETENESS OR QUALITY, INCLUDING ANY IMPLIED WARRANTY OF FITNESS FOR ANY PARTICULAR PURPOSE. ALL PERSONS OR ENTITIES RELYING ON THE RESULTS OF ANY TESTING DO SO AT THEIR OWN RISK, AND AGREE THAT PRINCIPLED TECHNOLOGIES, INC., ITS EMPLOYEES AND ITS SUBCONTRACTORS SHALL HAVE NO LIABILITY WHATSOEVER FROM ANY CLAIM OF LOSS OR DAMAGE ON ACCOUNT OF ANY ALLEGED ERROR OR DEFECT IN ANY TESTING PROCEDURE OR RESULT. IN NO EVENT SHALL PRINCIPLED TECHNOLOGIES, INC. BE LIABLE FOR INDIRECT, SPECIAL, INCIDENTAL, OR CONSEQUENTIAL DAMAGES IN CONNECTION WITH ITS TESTING, EVEN IF ADVISED OF THE POSSIBILITY OF SUCH DAMAGES. IN NO EVENT SHALL PRINCIPLED TECHNOLOGIES, INC.’S LIABILITY, INCLUDING FOR DIRECT DAMAGES, EXCEED THE AMOUNTS PAID IN CONNECTION WITH PRINCIPLED TECHNOLOGIES, INC.’S TESTING. CUSTOMER’S SOLE AND EXCLUSIVE REMEDIES ARE AS SET FORTH HEREIN.