The document summarizes a study using array tomography with an automated serial sectioning solution to generate high resolution 3D images of cellular structures in mouse lymph nodes. Array tomography involves imaging ordered arrays of ultrathin resin-embedded tissue sections with electron microscopy to reconstruct 3D images. The study found that using an automated ultramicrotome like the ARTOS 3D to collect uniform, high quality serial sections in an aligned array optimized the workflow by eliminating artifacts and saving time compared to manual sectioning. Reconstructions of T-cells and subcellular structures in mouse lymph node tissue demonstrated the capability of array tomography for elucidating 3D cellular organization at high resolution.
![Abstract
The optimization of high resolution 3-dimensional (3D) sub-cellular
structure analysis with array tomography using an automated serial
sectioning solution achieving a high section density on the carrier
substrate is described in this report.
Array tomography (AT) is a 3D image reconstruction technique for
biological specimens. It involves the imaging of ordered arrays
of ultrathin serial sections with scanning electron microscopy (SEM)
and enables high resolution, quantitative analysis of biological
structures. AT offers higher spatial resolution than conventional
confocal microscopy. The method can reveal additional information
of cellular and protein structures to clarify poorly understood or
unresolved features.
The workflow for array tomography is better optimized when using
an automated ultramicrotome that can achieve uniform, ultrathin
serial sections for orderly array image acquisition with the SEM.
A high section quality is preserved by the elimination of artifacts
that may occur during the section ribbon collection process due to
manual handling.
Introduction
Array tomography (AT) is a high resolution 3D image reconstruction
method for cellular and protein structure analysis (refer to figure 1).
It exploits the scanning electron microscopy (SEM) imaging of ordered
arrays of ultrathin (>20 nm), resin-embedded serial sections of biological
specimens collected on silicon substrate carriers [1]. AT allows for
quantitative, volumetric structural analysis of many different types of
tissues and proteins. As it has better lateral and spatial resolution than
conventional confocal microscopy, it can help to better visualize and
understand cellular and protein structure. In addition, AT allows cellular
and protein structure to be examined in a partially automated manner
leading to higher throughput.
Lymph nodes are kidney-shaped organs of the lymphatic system located
throughout an animal’s or a person’s body. They are linked by lymphatic
vessels and trap foreign bodies from surrounding tissues, helping to
initiate the immune response. Lymph nodes are ideal for studying
the interactions of immune cells (lymphocytes, dendritic cells, and
macrophages), as well as the spread of cancer (tumor metastasis) [2,3].
Precise examination of lymph nodes is critical for these types of immune
and cancer studies.
Lymph nodes from mice have been investigated with array tomography
using an automated serial sectioning solution.
Serial sectioning with an automated ultramicrotome capable of
producing uniform, ultrathin, high quality sections in an aligned
array makes the overall workflow for array tomography (3D image
data acquisition) more efficient (refer to figure 1). An example of
such a serial sectioning solution is the ARTOS 3D ultramicrotome
from Leica Microsystems. It automatically produces hundreds of
uniform serial sections and avoids wrinkling of the section ribbons
during collection due to a specially designed diamond knife.
Furthermore, the high section density achieved during collection onto
the substrate carrier allows time to be saved during SEM setup.
Additionally, AT offers time-saving advantages for specimen preparation
when doing correlative light and electron microscopy (CLEM) [4] studies
with a transparent section carrier made out of a glass substrate.
Array tomography image of T-cells in mouse lymph nodes.
2 HIGH RESOLUTION ARRAY TOMOGRAPHY WITH AUTOMATED SERIAL SECTIONING](https://image.slidesharecdn.com/artos3dapplicationnote1118-200408113844/85/Leica-ARTOS-3D-serial-sectioning-2-320.jpg)
![Materials and Methods
Lymph Node Isolation
Popliteal lymph nodes were harvested from 6-10 week old
C57BL/6 mice. Specimen preparation was done following the OTO
(osmium-thiocarbohydrazide-osmium) and ferrocyanide reduced osmium
tetroxide fixation protocol of Deerinck et al. [5,6] to enhance the contrast
of the tissue for SEM imaging.
The mice were anesthetized with an intraperitoneal injection
of 100 mg/kg (wt/wt) ketamin, 10 mg/kg (wt/wt) xylazine, and
3mg/kg (wt/wt) acepromazin. They were then perfused transcardially
with phosphate buffered saline (PBS) [0.025 M phosphate buffer,
0.9% (wt/vol) NaCl, pH 7.4] for 2 min. Afterwards, the PBS was replaced
via perfusion for 5-10 min with a fixative 0.1 M phosphate buffer (PB)
solution having 2% (vol/vol) paraformaldehyde and 2.5% (vol/vol)
glutaraldehyde. Immediately after perfusion, the lymph nodes were
harvested and post-fixed for another 2h at room temperature (RT).
Specimen Preparation
Fixation and Contrast Enhancement
After harvesting and post-fixation, the lymph node specimens were
washed in 0.1 M PB (pH 7.4). Then, to enhance contrast during array
tomography (AT), the specimens were immersed for 1 hour in 0.1 M
PB with 2% (wt/vol) osmium tetroxide (aqueous) and 1.5% (wt/vol)
potassium ferrocyanide on ice and in the dark. Afterwards, they were
washed with MilliQ water (5 x 3 min at RT), transferred into filtered
thiocarbohydrazide for 20 min at RT, and then again washed with MilliQ
water (5 x 3 min at RT).
The specimens were placed in 2% (wt/vol) osmium tetroxide (aqueous)
for 30 min at RT in the dark and then again washed with MilliQ water
(5 x 3 min at RT). They were incubated in 1% (wt/vol) uranyl acetate
(aqueous) and placed in the refrigerator at 4°C overnight. The next day,
the specimens were washed in MilliQ water (5 x 3 min at RT), incubated
in a Walton’s lead aspartate solution at 60°C for 30 min, and washed
in MilliQ water (5 x 3 min at RT). They were dehydrated using a graded
ethanol series (50%, 70%, 90%, 96%, and 100%) for 5-10 min each and
then washed in anhydrous acetone (2 x 10 min at RT).
Resin Embedding
The specimens were infiltrated with resin by immersing them in a
graded series of DurcupanTM ACM hard resins dissolved in acetone
(25%, 50%, and 75%) for 1-2 hours each. Then, they were placed in
100% Durcupan resin overnight and transferred to BEEM capsules
filled with fresh resin. The recipe used for the DurcupanTM ACM
resin (Sigma-Aldrich) in terms of its 4 components (A-D) was: A)
11.4 g, B) 10 g, C) 0.3 g, and D) 0.1 g. Finally, for polymerization of
the resin-embedded specimens, they were kept in an oven at 60°
C for
3 days.
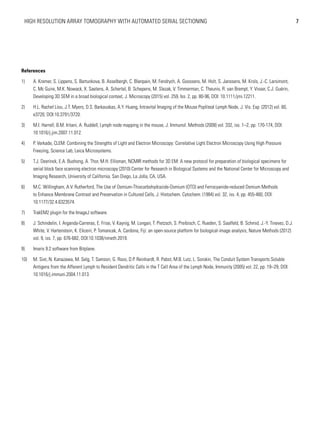
Specimen Trimming
The resin-embedded mouse lymph node specimens were trimmed
with the EM TRIM2 trimming device from Leica Microsystems
(refer to figure 2A). For straight ribbon formation to occur during
the sectioning process, the specimen must have parallel edges.
Normally, the specimen is trimmed to this shape with a high-speed
milling system, such as the EM TRIM2 or EM Rapid solution.
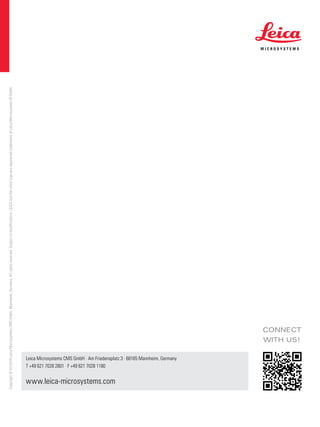
Serial sectioning and
ribbon collection
Tissue fixation
Staining for imaging
(if needed)
Fluorescence
microscope imaging
Electron microscope imaging
= Step where you save time with the Artos 3D Ultramicrotome
Merging array for 3D image
reconstruction and analysis
Specimen extraction and
resin embedding
Figure 1: A typical workflow for the array tomography (AT) method. The work steps where the ARTOS 3D solution helps users to save time obtaining excellent AT
results are indicated.
3HIGH RESOLUTION ARRAY TOMOGRAPHY WITH AUTOMATED SERIAL SECTIONING](https://image.slidesharecdn.com/artos3dapplicationnote1118-200408113844/85/Leica-ARTOS-3D-serial-sectioning-3-320.jpg)
![Imaging/Array Tomography (AT)
After sectioning, the lymph node arrays were transferred to a silicon
substrate carrier. Then, AT was performed with SEM to study the
targeted proteins in-depth.
High resolution images of the lymph node sections were acquired
with AT using a field emission SEM (FE-SEM, Merlin compact VP,
Zeiss) equipped with the Atlas 5 Array Tomography system. Secondary
electron detection was performed at 5 kV.
Image Reconstruction
Image reconstructions in 3D were performed as follows:
>> Section image dataset was aligned and annotations marking the
sub-cellular structures manually made using the TrakEM2 software
plugin [7] for the FIJI platform [8] and
>> Binary exports of segmented cellular structures were imported into
the software Imaris (version 9 Bitplane) [9] for 3D reconstruction and
visualization of the iso-surfaces of the T-cells.
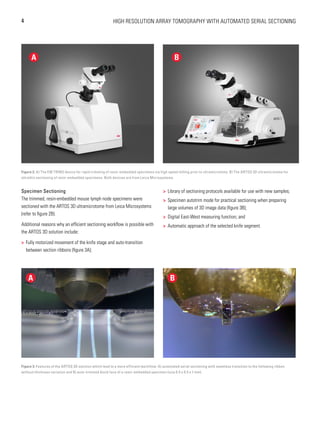
Results
The goal of the mouse lymph node study is to elucidate the complex
3D organization of its paracortical conduit system which transports
filtered lymph (containing small soluble antigens) from the periphery
towards the venous circulatory system [10]. High resolution 3D image
reconstruction of the lymph node ultimately should show how the
stromal, myeloid and lymphoid cells spatially interact and have access
to the lymph node conduit system.
Three-dimensional (3D) images of the paracortex of a mouse popliteal
lymph node were reconstructed using the array topography method
(refer to Fig. 5). The images show the 3D volume and shape of the
T-cells migrating within the lymph node cells, plus their sub-cellular
structures, such as the nucleus, mitochondria, and cytoplasm.
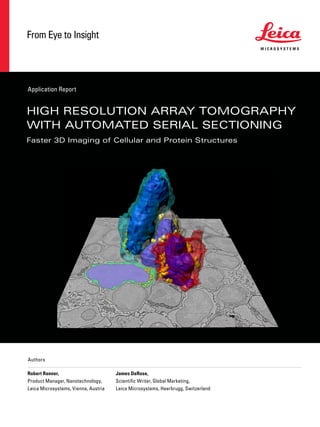
Figure 4: Differences in workflow for the ARTOS 3D and a conventional ultramicrotome, like the EM UC7.
ARTOS 3D Ultramicrotome Workflow
Conventional Ultramicrotome Workflow
Mount
specimen
in holder
Set up knife
edge and
section carrier
Program Artos
3D for
sectioning
Section
specimen
Remove
section
carrier
Image
section
array
Mount
specimen
in holder
Set up knife
edge and
substrate
Section
specimen
Remove
section
carrier
Image
section
array
Eliminated with ARTOS 3D solution
Manually align ribbon
sections with eyelash
Repeat sectioning and
alignment as many times as needed
Preparation Time for Array Tomography
Spend Less Time
The automation of serial sectioning achieved with the ARTOS 3D
solution enables greater workflow efficiency compared to a conventional
ultramicrotome. A comparison of the workflow for a conventional
ultramicrotome, such as the EM UC7 system, and the ARTOS 3D are
shown in figure 4. The work steps of conventional ultramicrotomy which
are eliminated with the ARTOS 3D solution are denoted.
5HIGH RESOLUTION ARRAY TOMOGRAPHY WITH AUTOMATED SERIAL SECTIONING](https://image.slidesharecdn.com/artos3dapplicationnote1118-200408113844/85/Leica-ARTOS-3D-serial-sectioning-5-320.jpg)
![Summary and Conclusions
The array tomography method has paved the way for high resolution,
reproducible 3D image reconstruction results which allow significant
advances in cell biology.
The ARTOS 3D ultramicrotome renders specimen preparation and
section alignment for array tomography (AT) more simple leading to
a more efficient overall workflow. It achieves this higher efficiency
thanks to a specially designed diamond knife, drain tray, and boat for
easy collection of wrinkle-free section ribbons on the section carrier.
Its wafer section carrier is capable of a high ribbon density and is
small enough for optimal loading of multiple carriers into a SEM at
the same time. Thus, hundreds of sections can be imaged via SEM
without reloading.
Transparent materials can also be used for the section carrier, so the
ARTOS 3D ultramicrotome is also excellently suited for correlative light
and electron microscopy (CLEM) [4].
Acknowledgments
We would like to thank Frank Assen, Ludek Lovicar, Vanessa Zheden,
and Michael Sixt of the Institute of Science and Technology (IST) Austria
for providing the array tomography image data.
Figure 5: 3D image reconstructions of mouse lymph nodes acquired with array topography: A) 3D SEM image stack of the trimmed, resin-embedded nodes consisting of
150 sections; B) side view showing 3 T-cells within the densely packed lymph node paracortex in 3D; C) top view where the cytoplasm (green), nucleus (blue), and
mitochondria (gold) of the T-cells are visible; and D) zoom-in on the 3D image of the T-cells. Courtesy Frank Assen, Ludek Lovicar, Vanessa Zheden, and Michael Sixt,
Institute of Science and Technology (IST) Austria, Klosterneuburg.
2 μ m
1 μ m
2 μ m
2 μ m
6 HIGH RESOLUTION ARRAY TOMOGRAPHY WITH AUTOMATED SERIAL SECTIONING](https://image.slidesharecdn.com/artos3dapplicationnote1118-200408113844/85/Leica-ARTOS-3D-serial-sectioning-6-320.jpg)