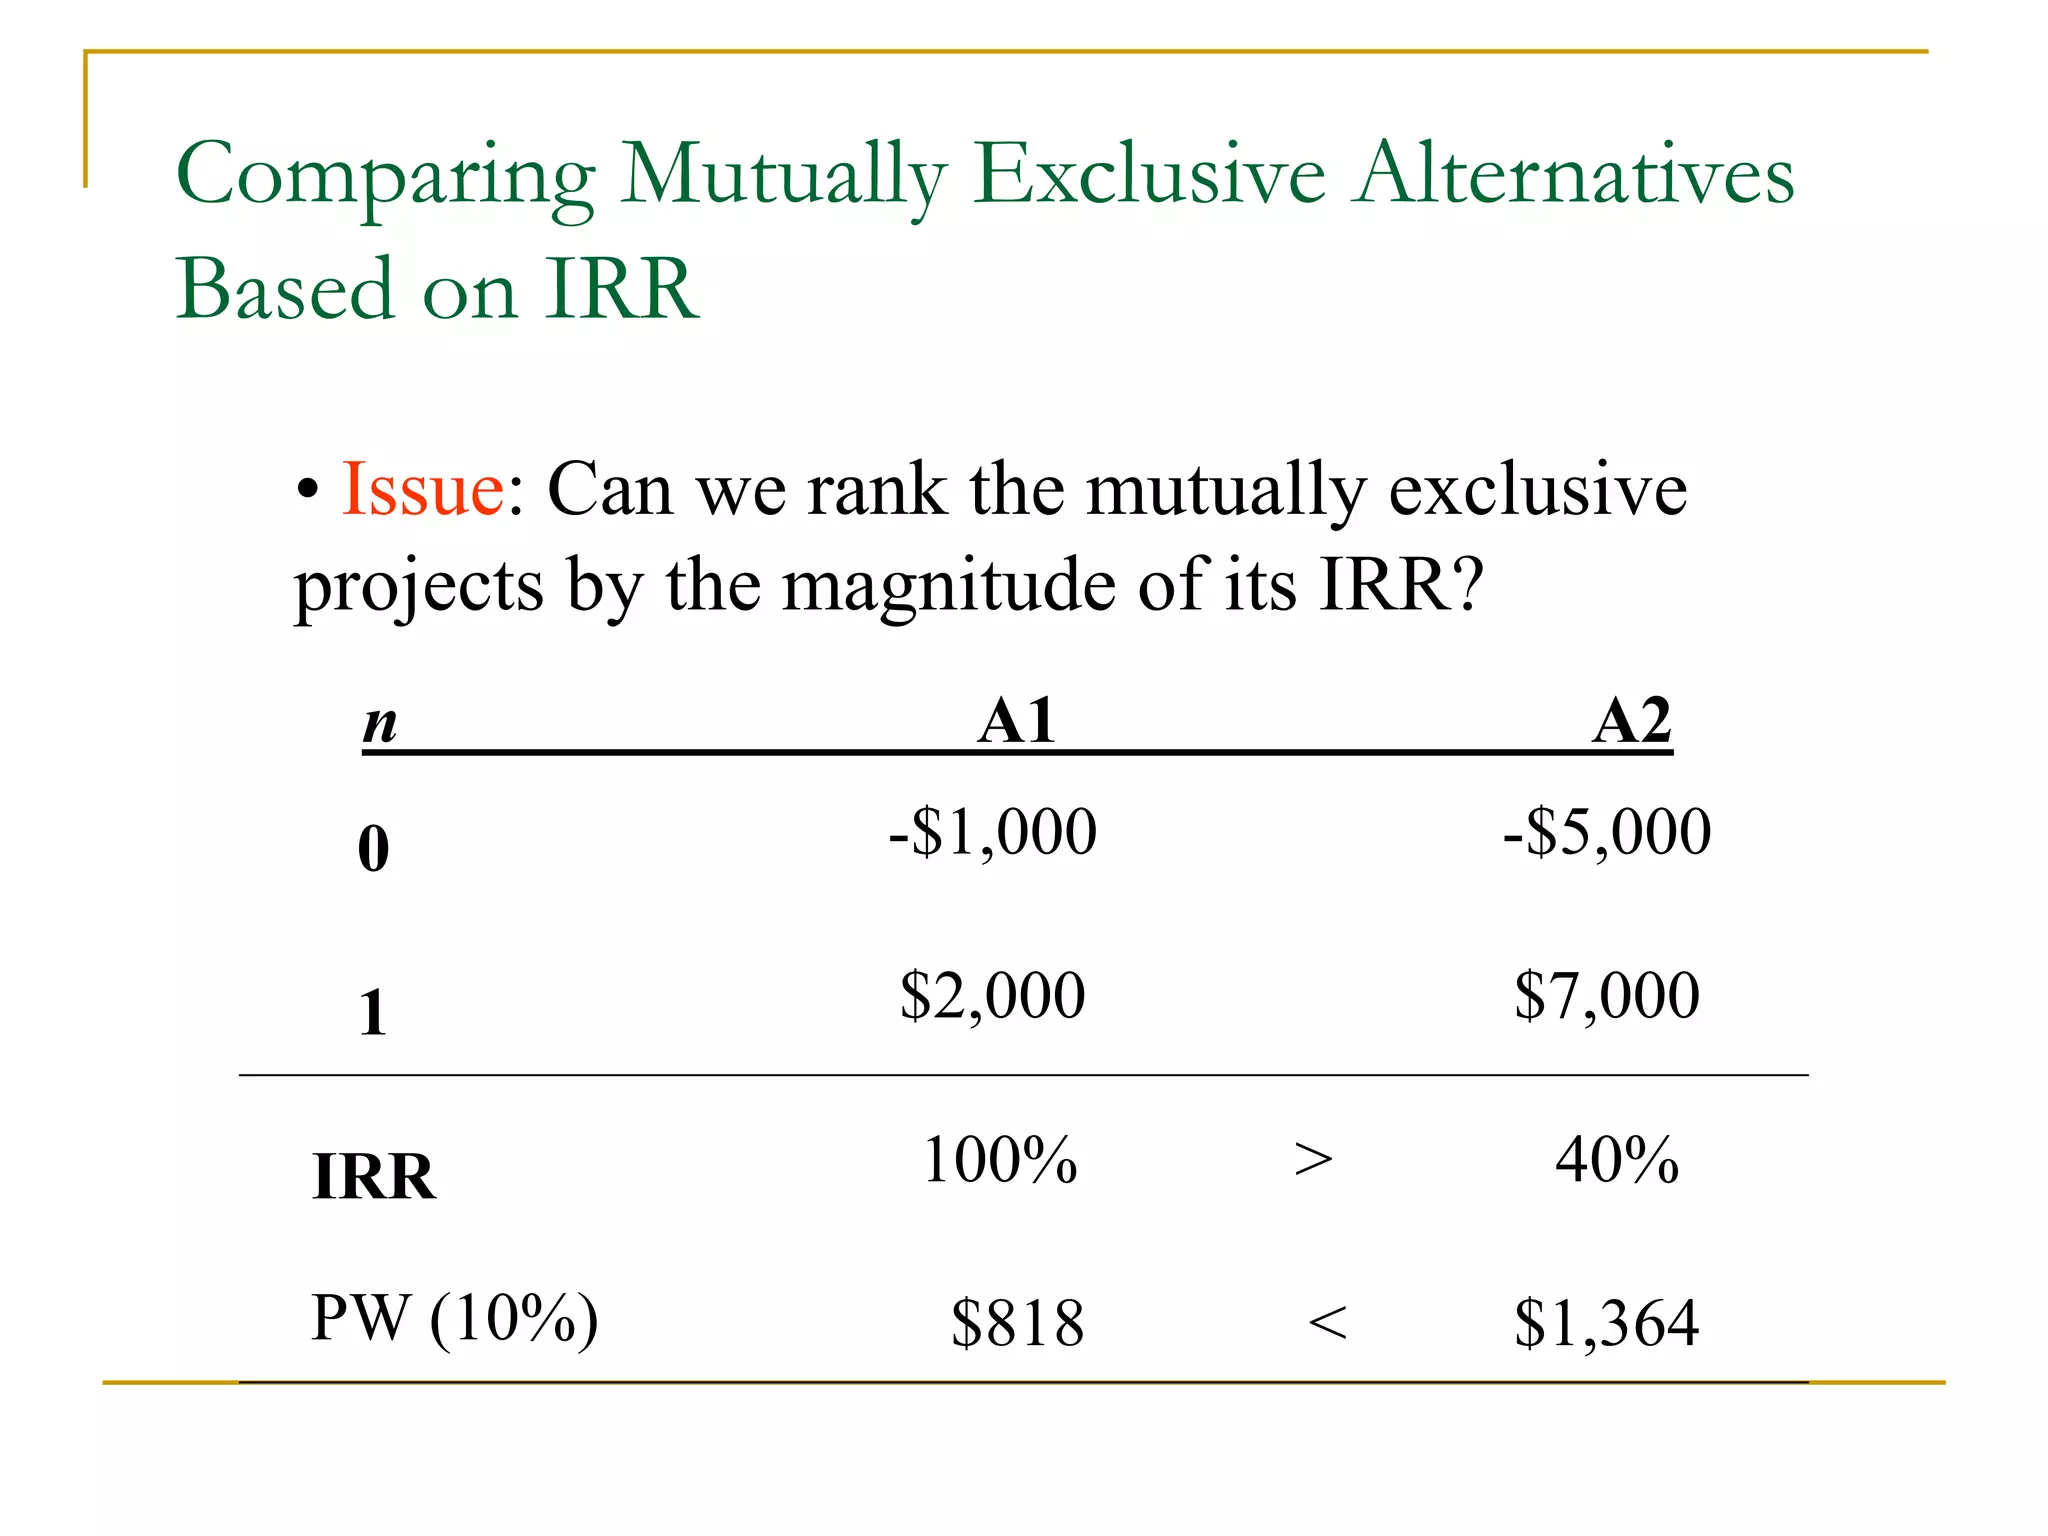
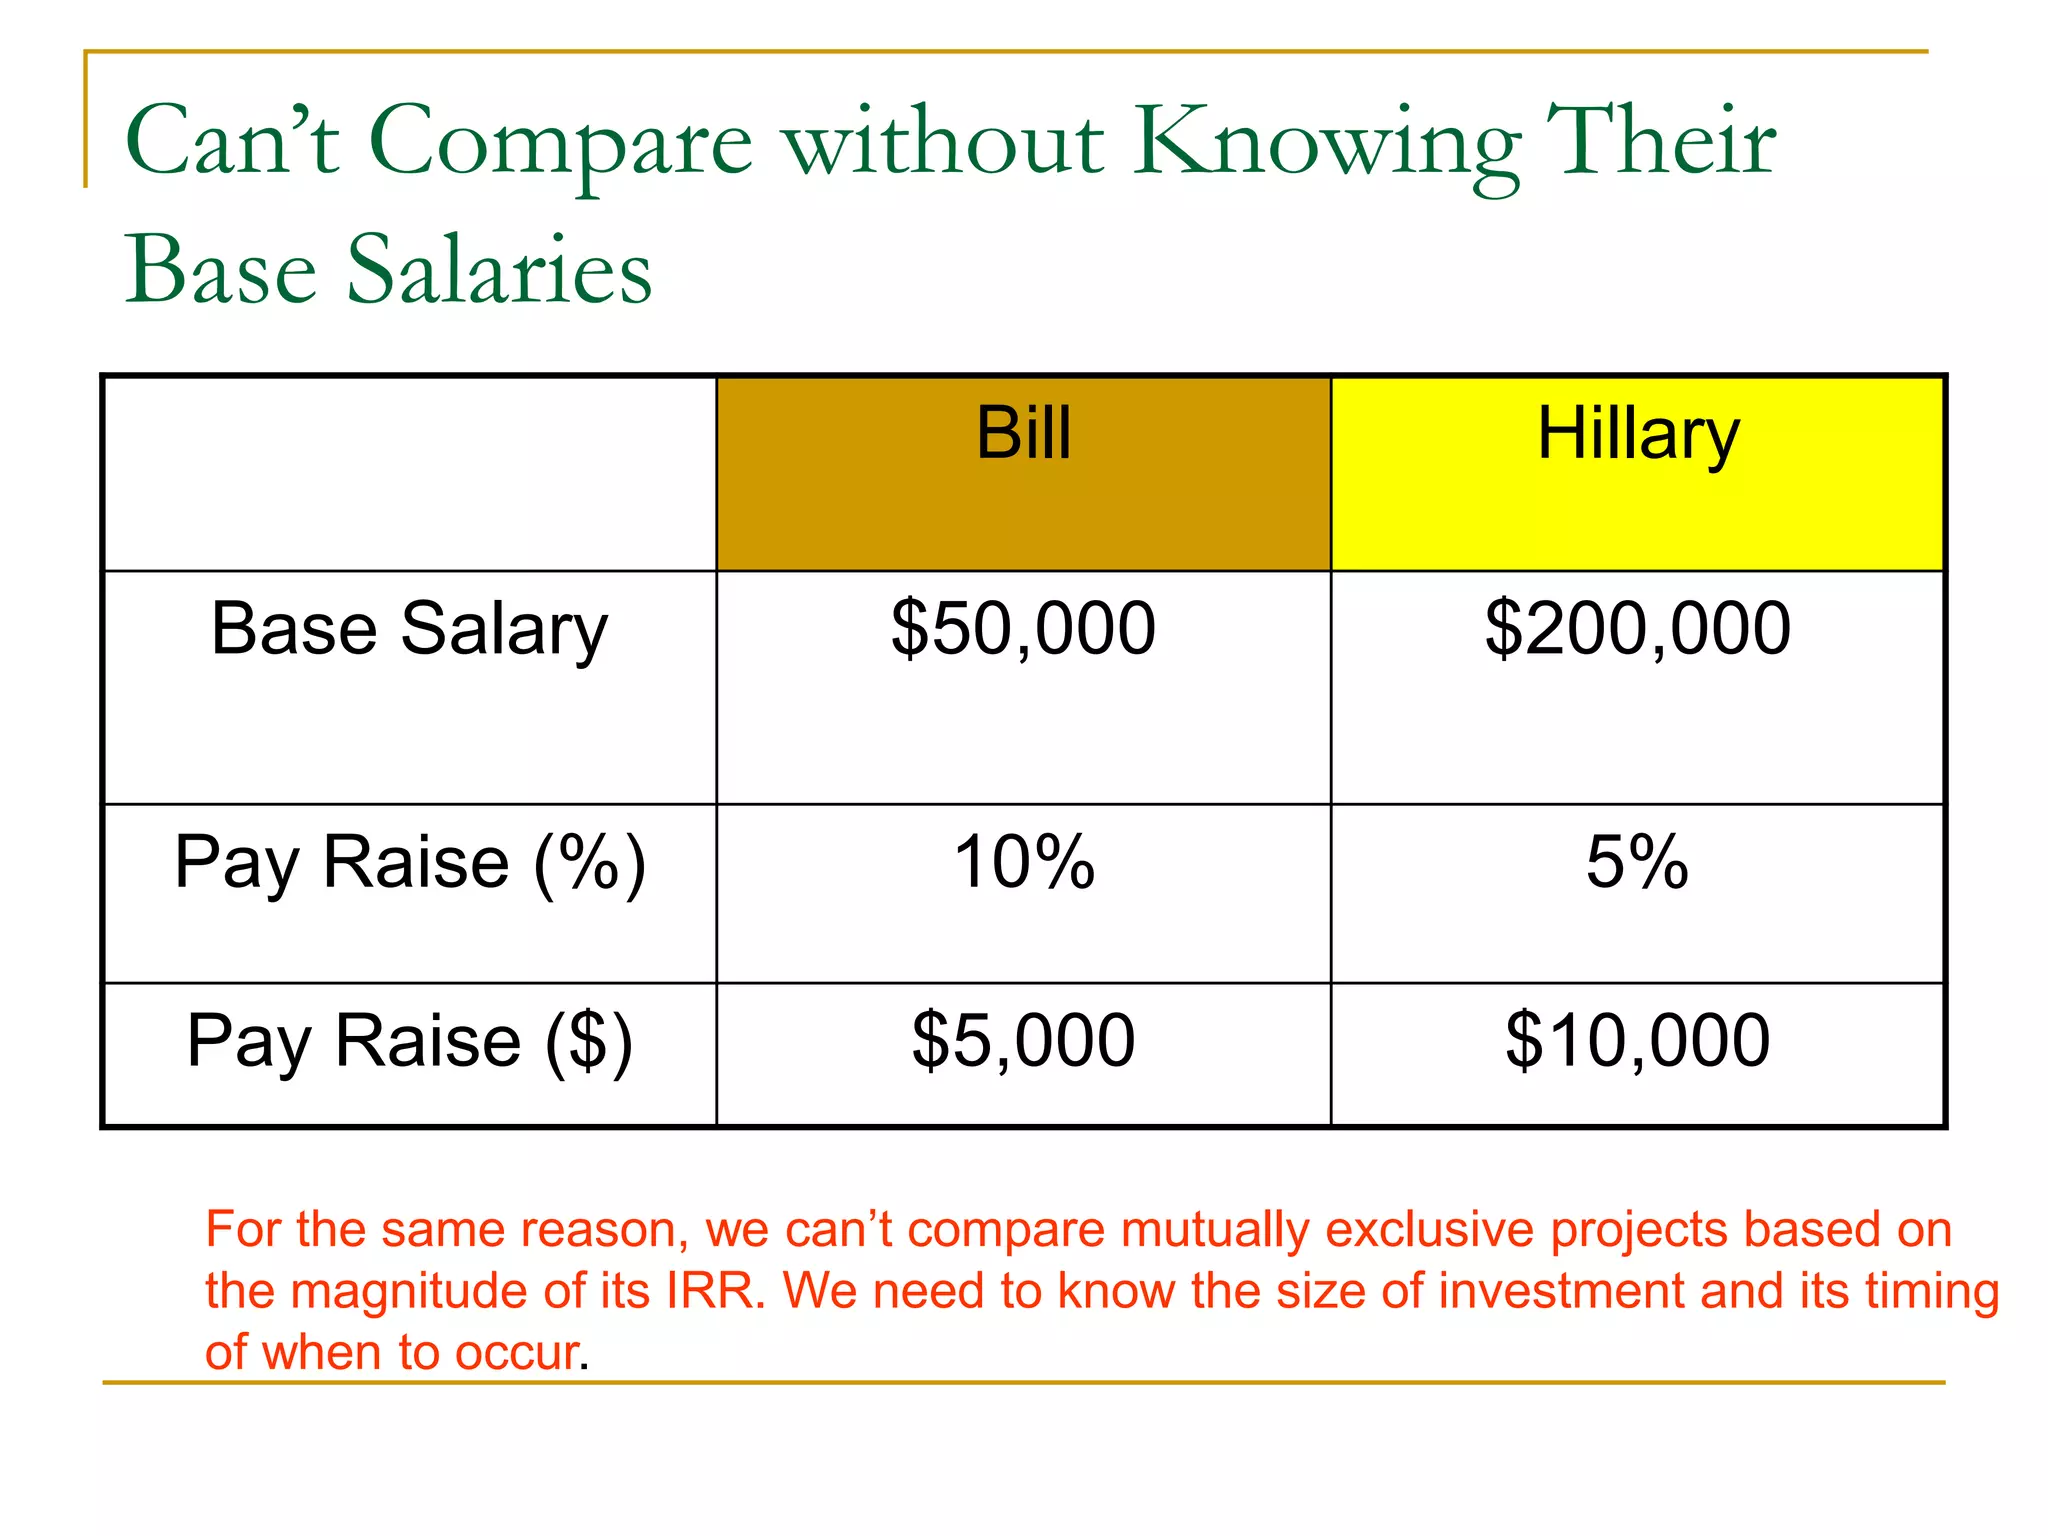
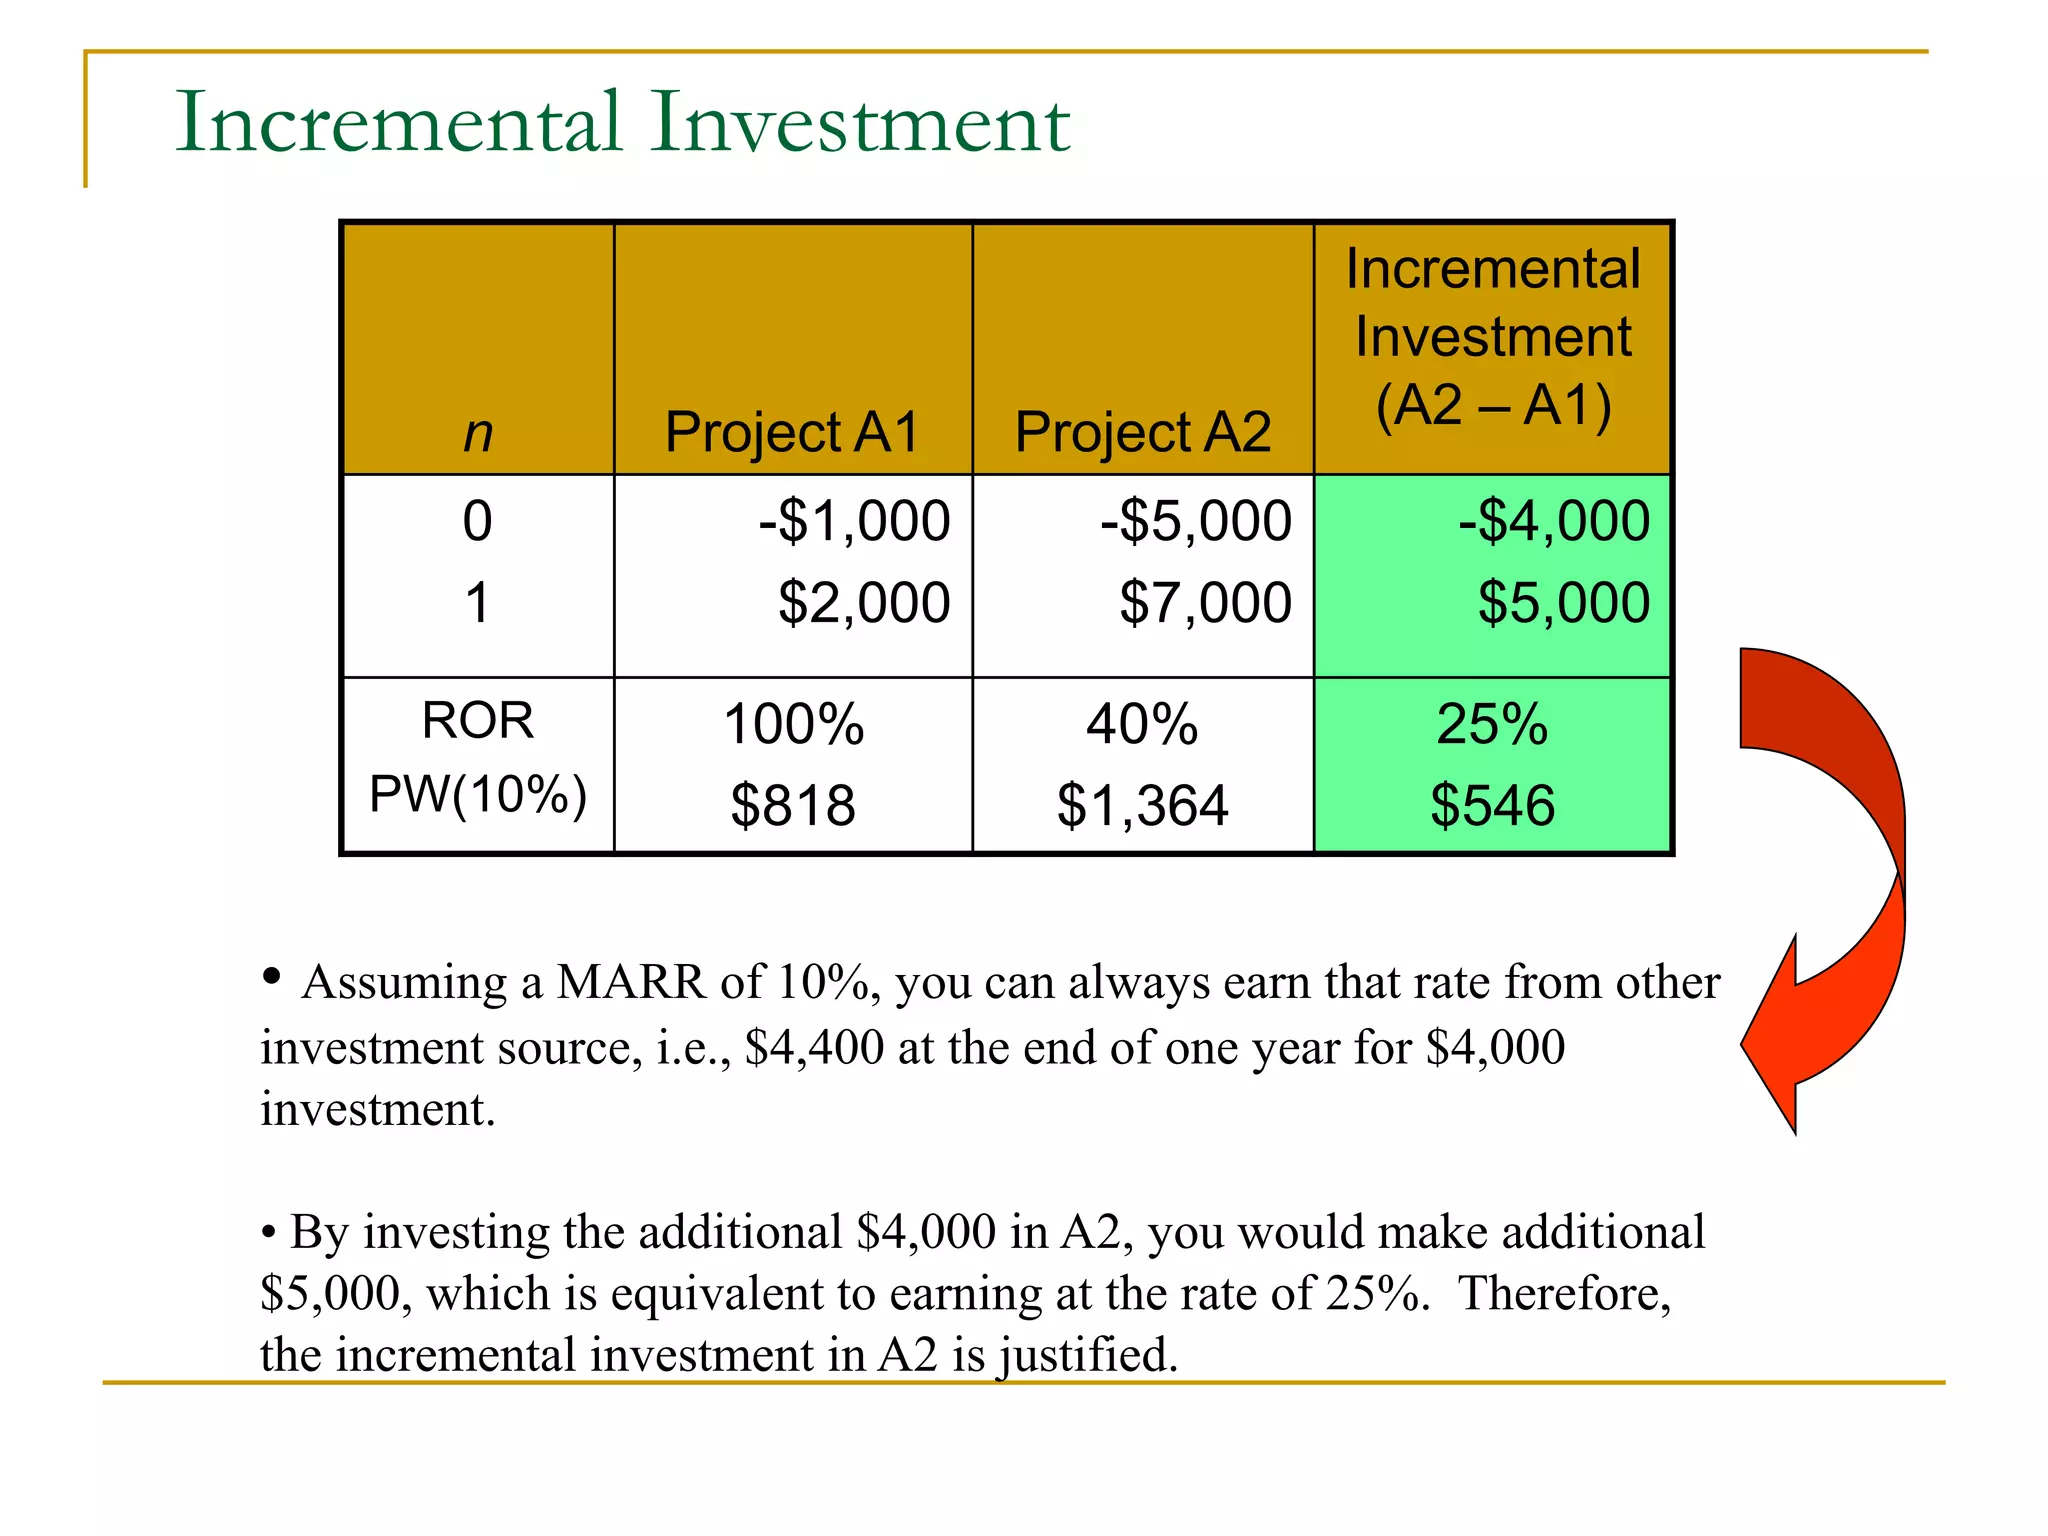
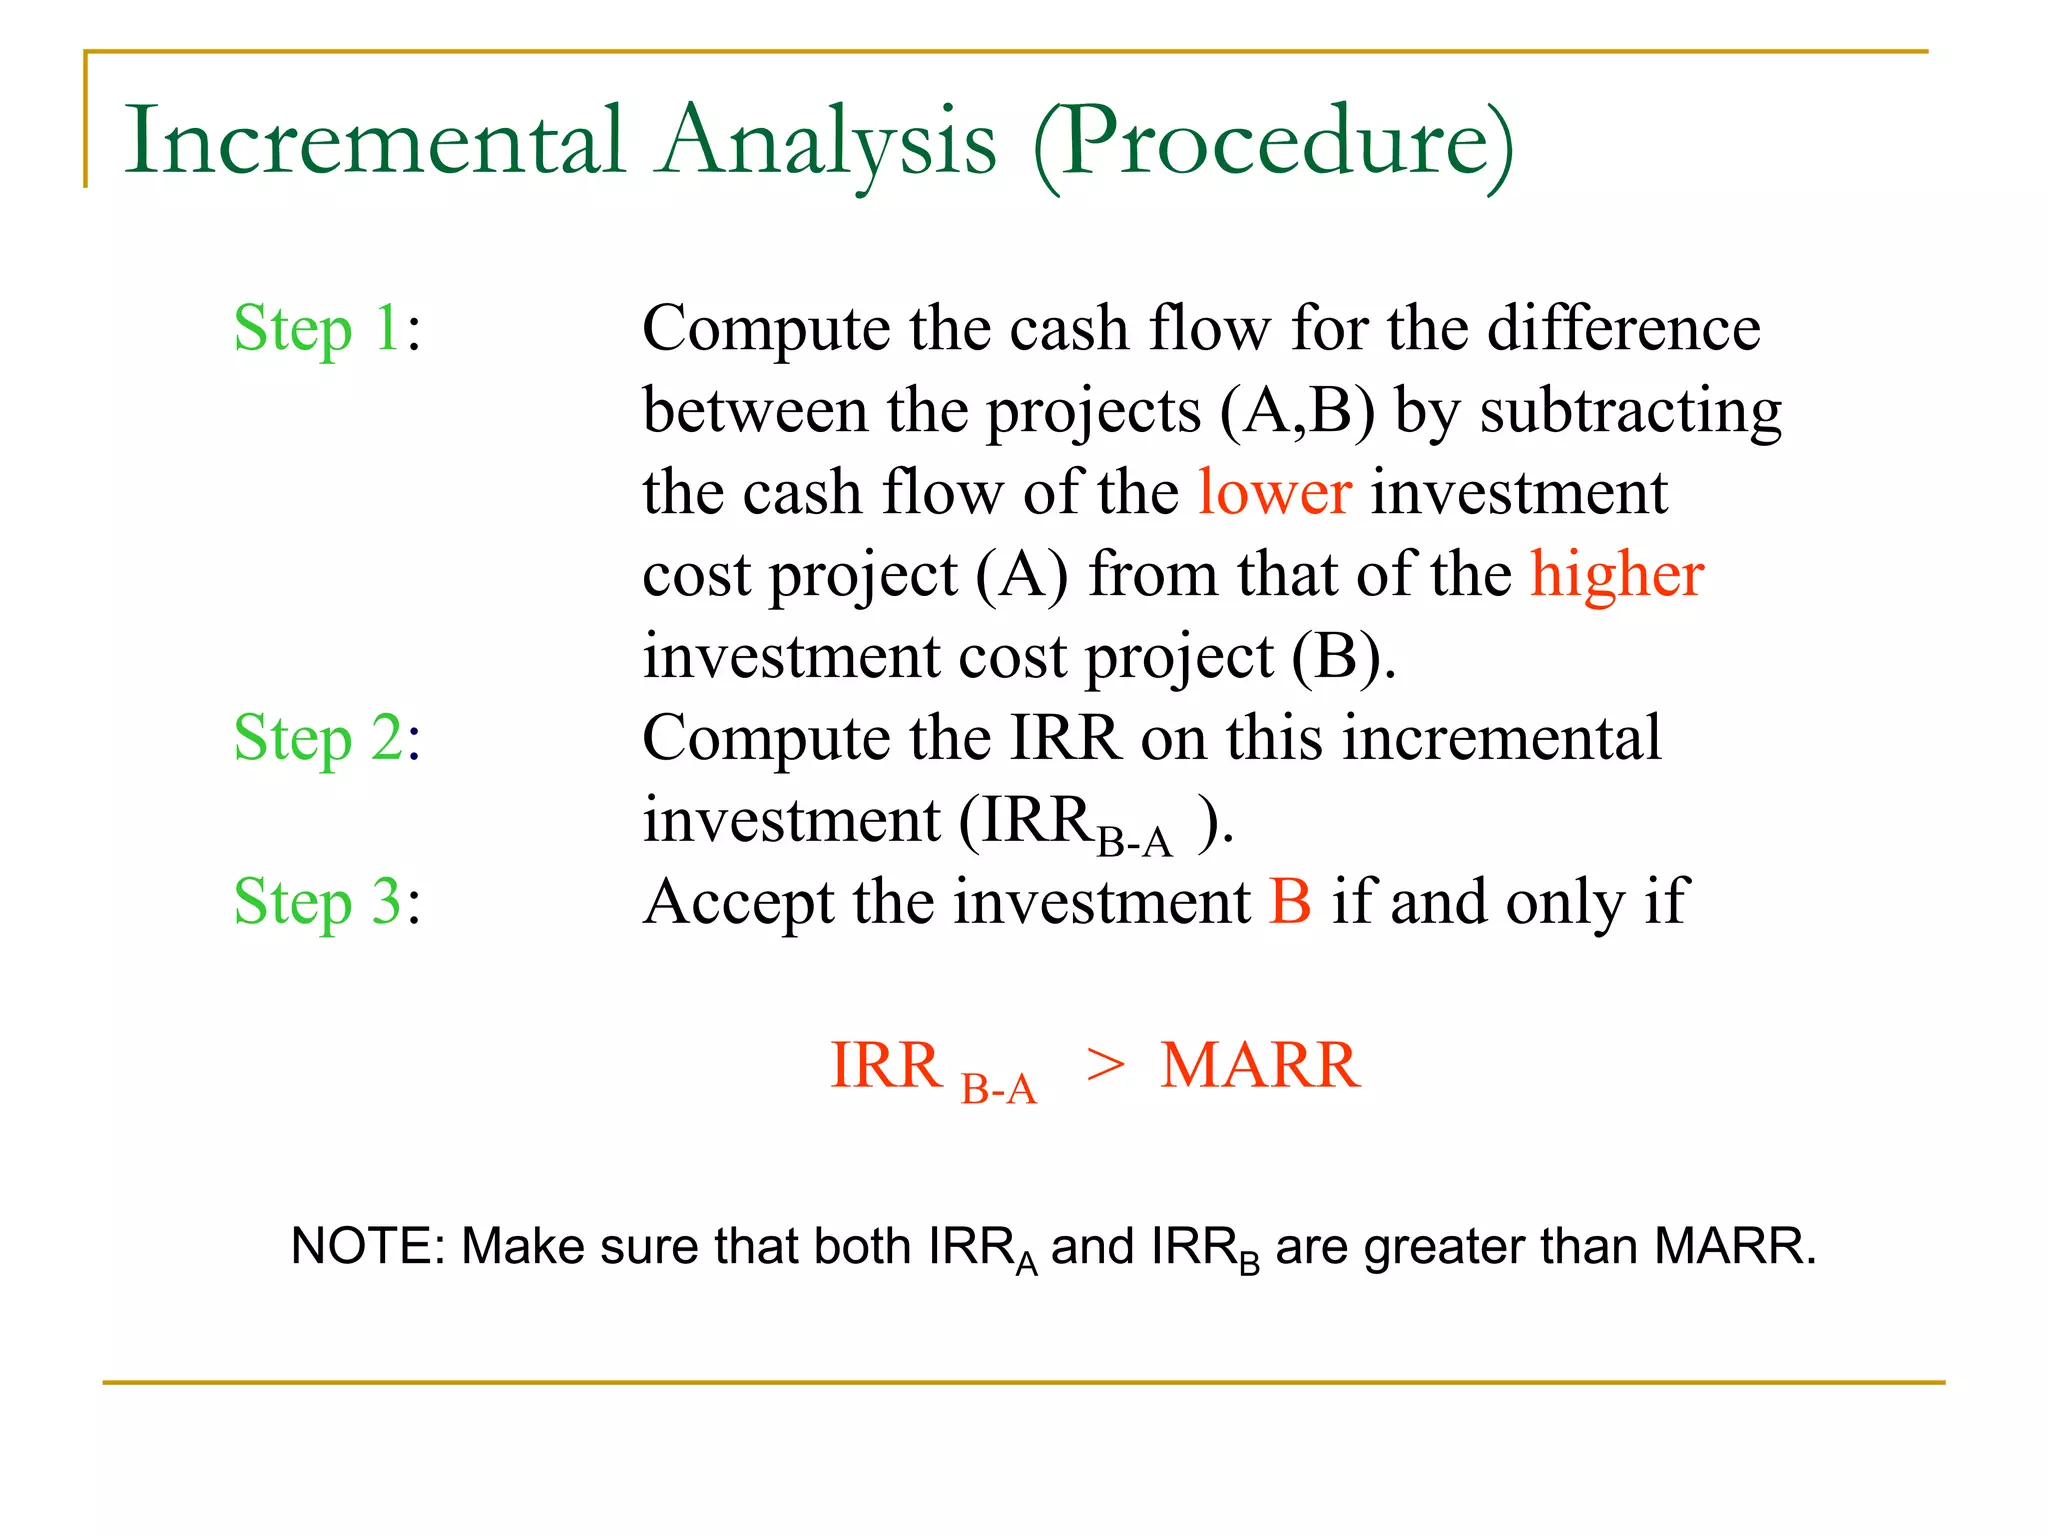
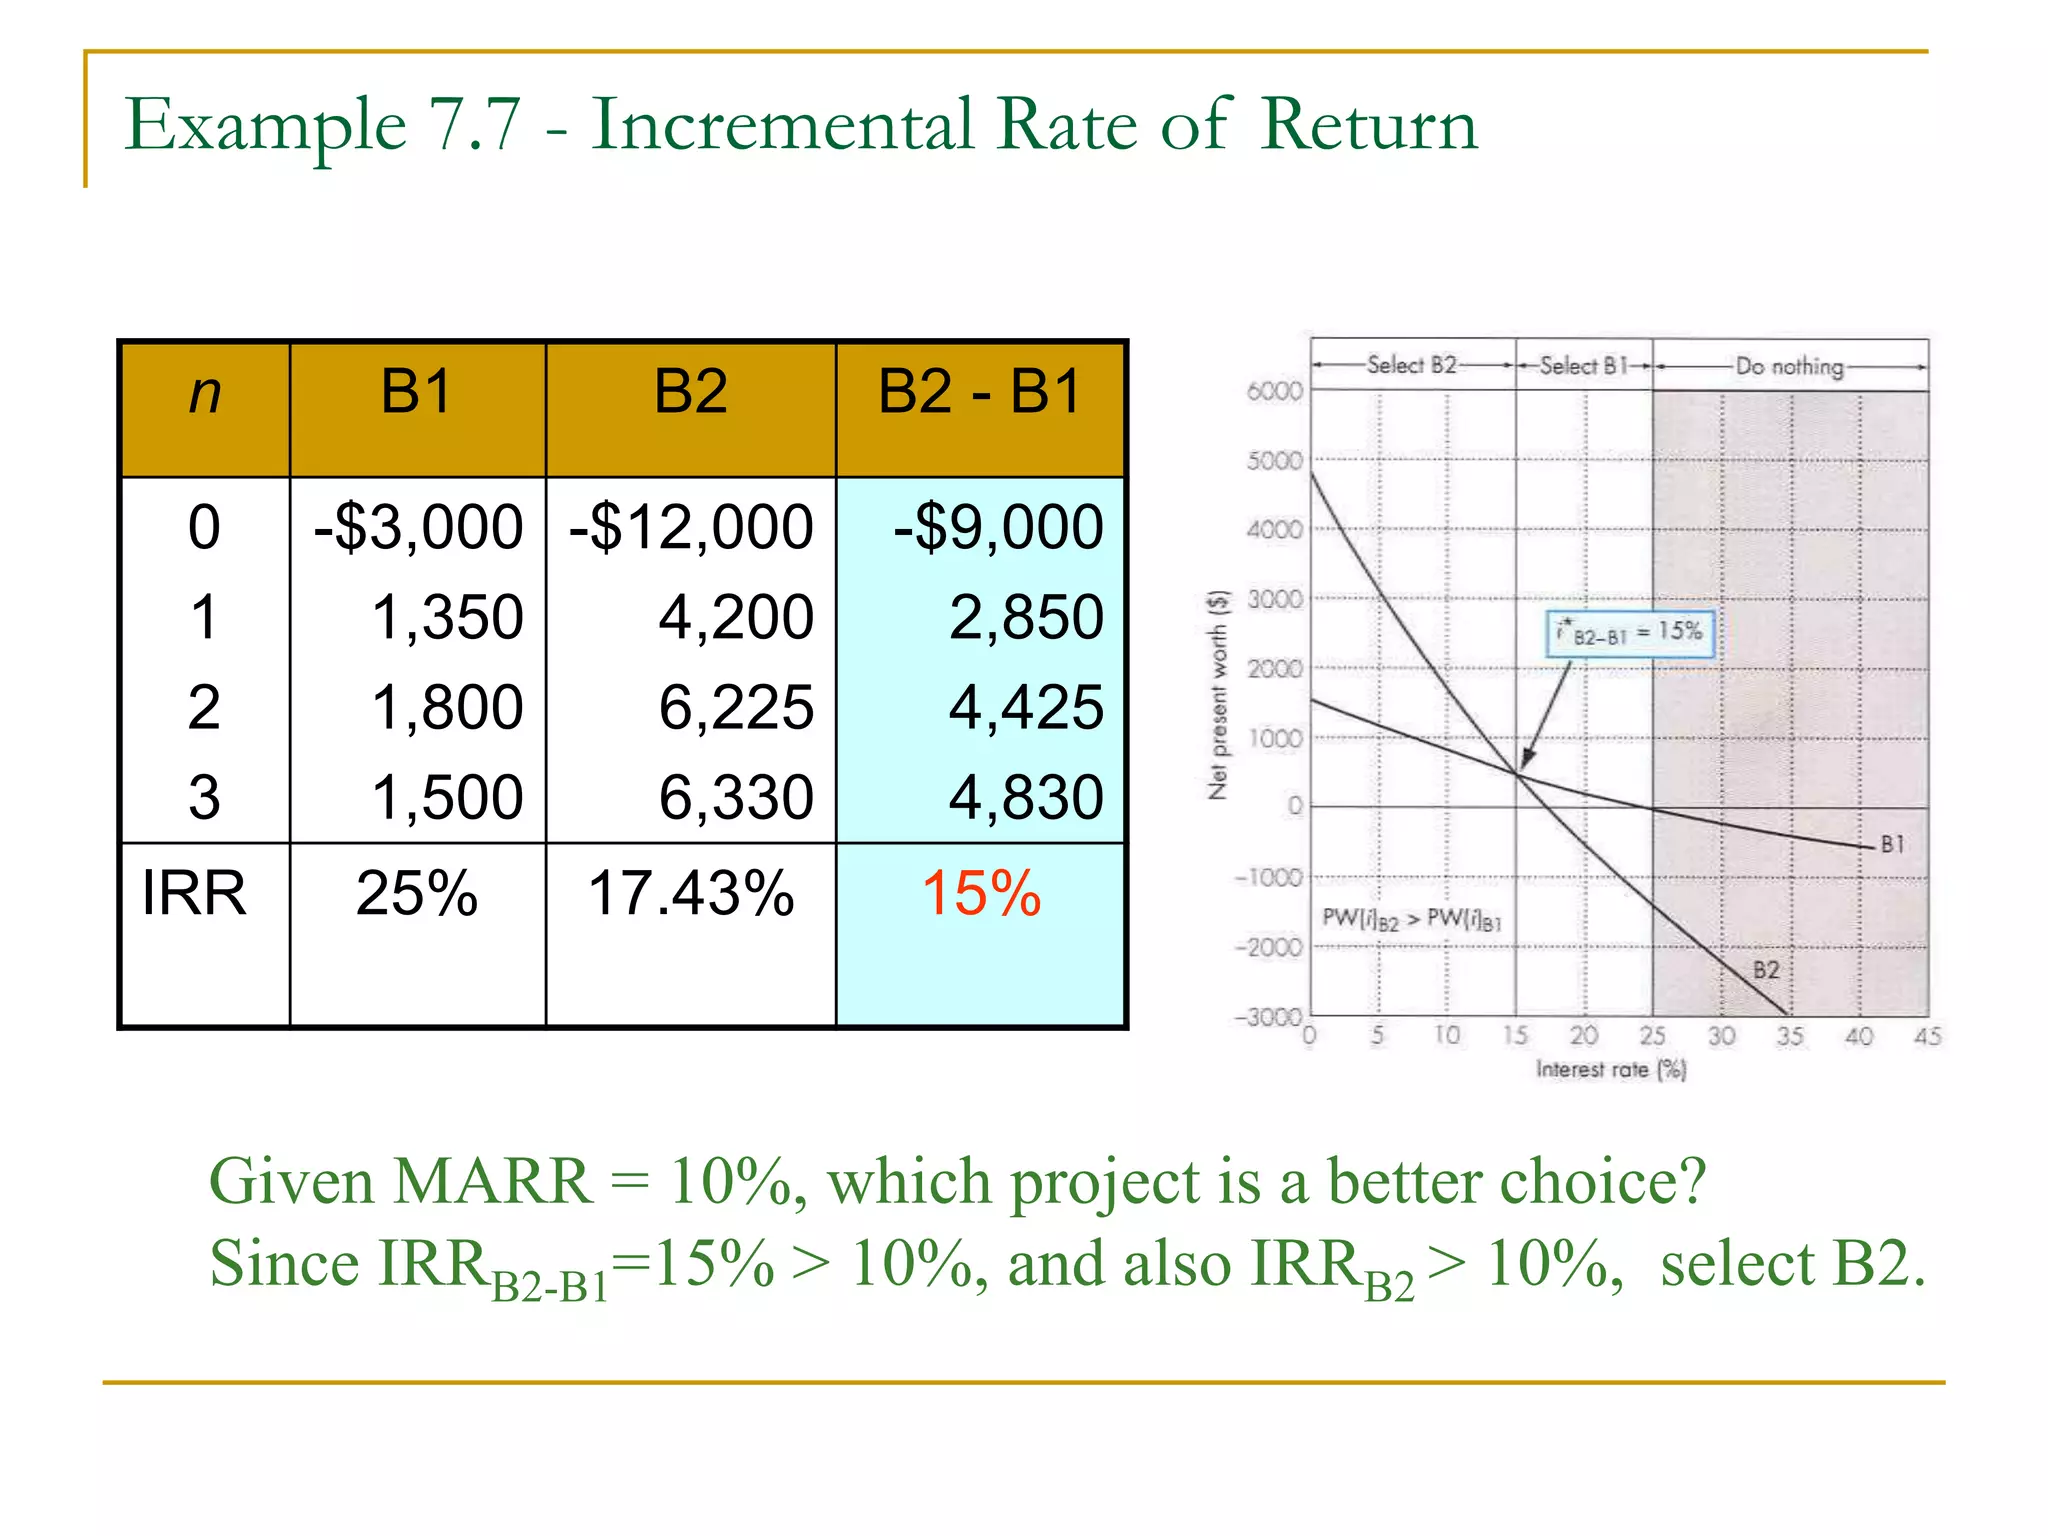
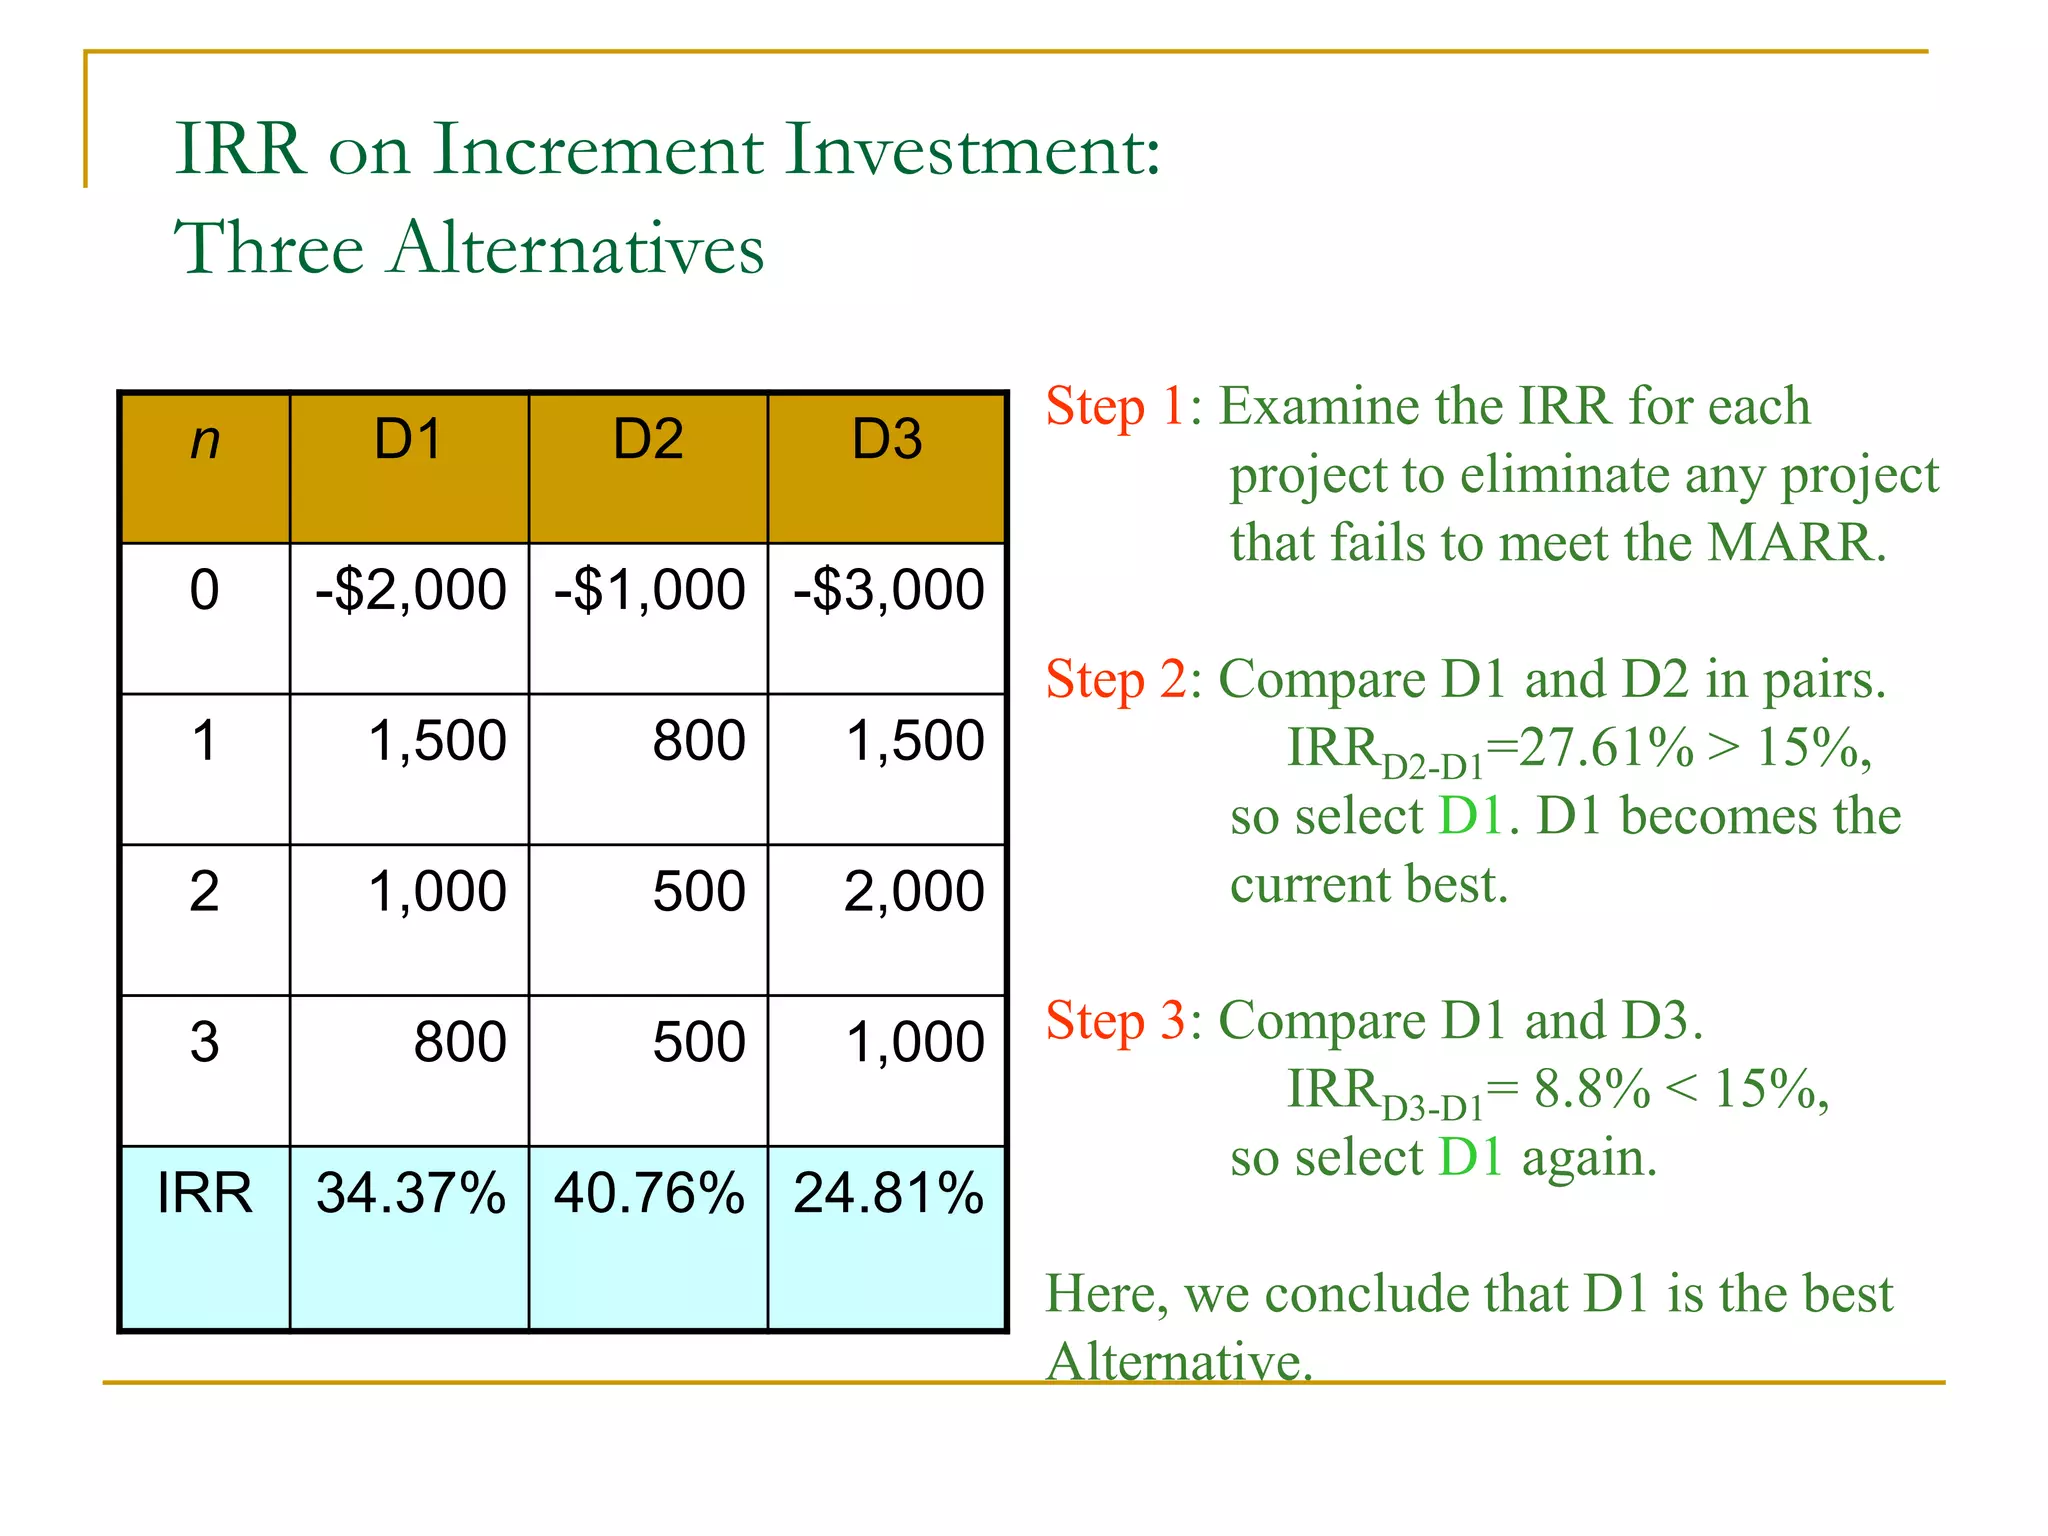
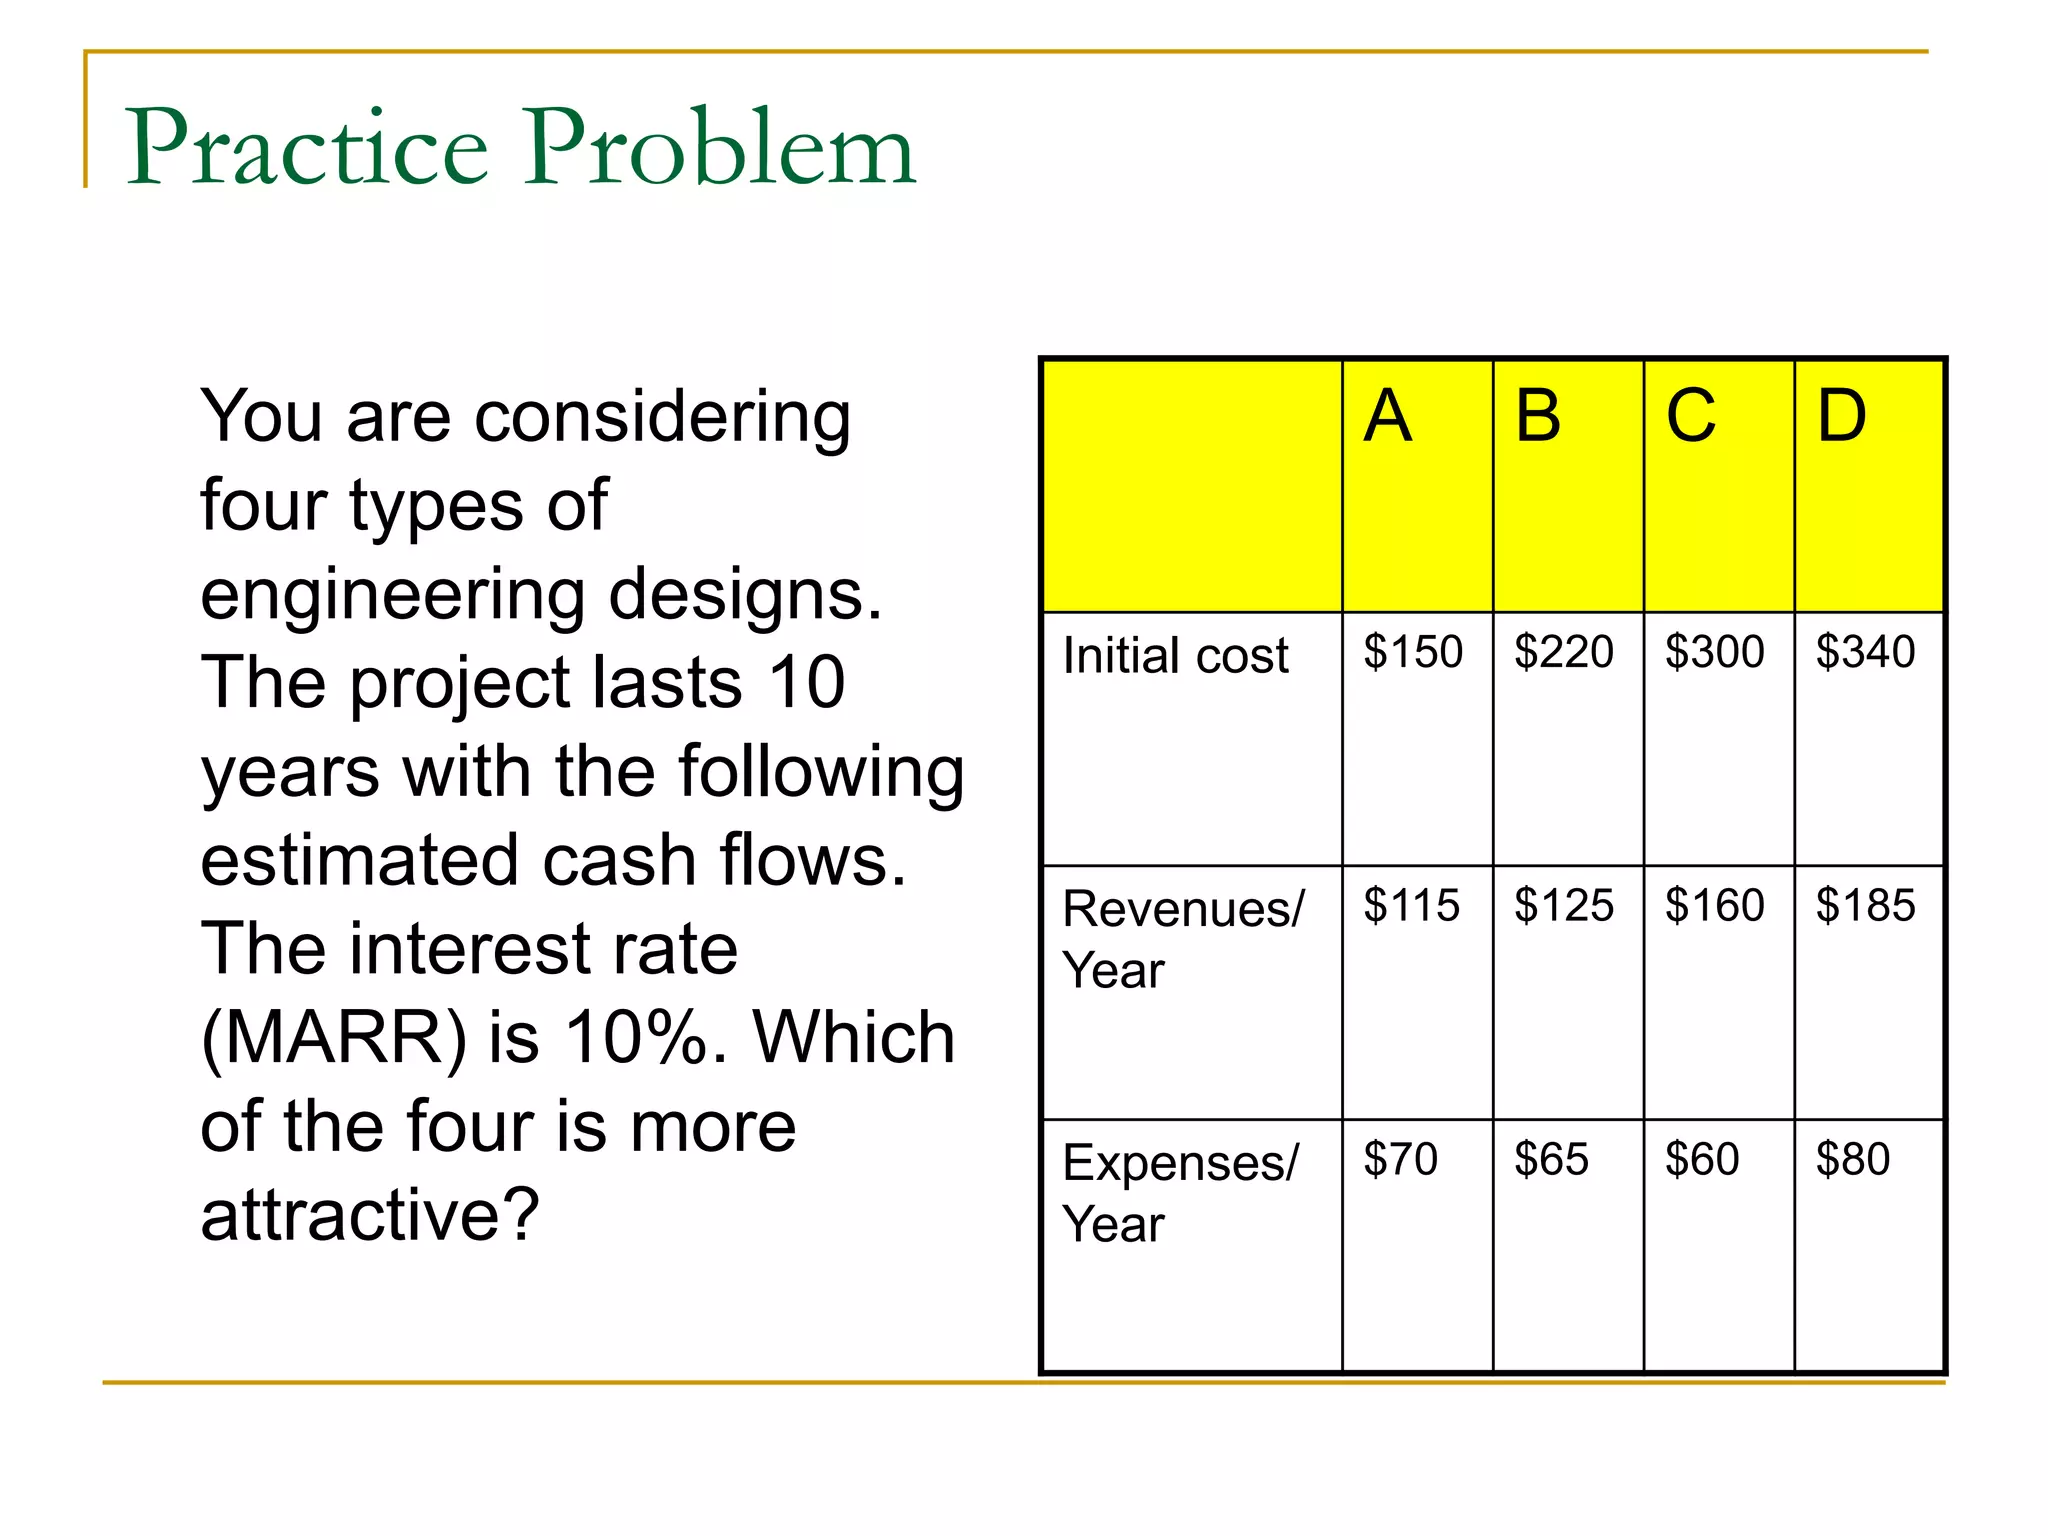
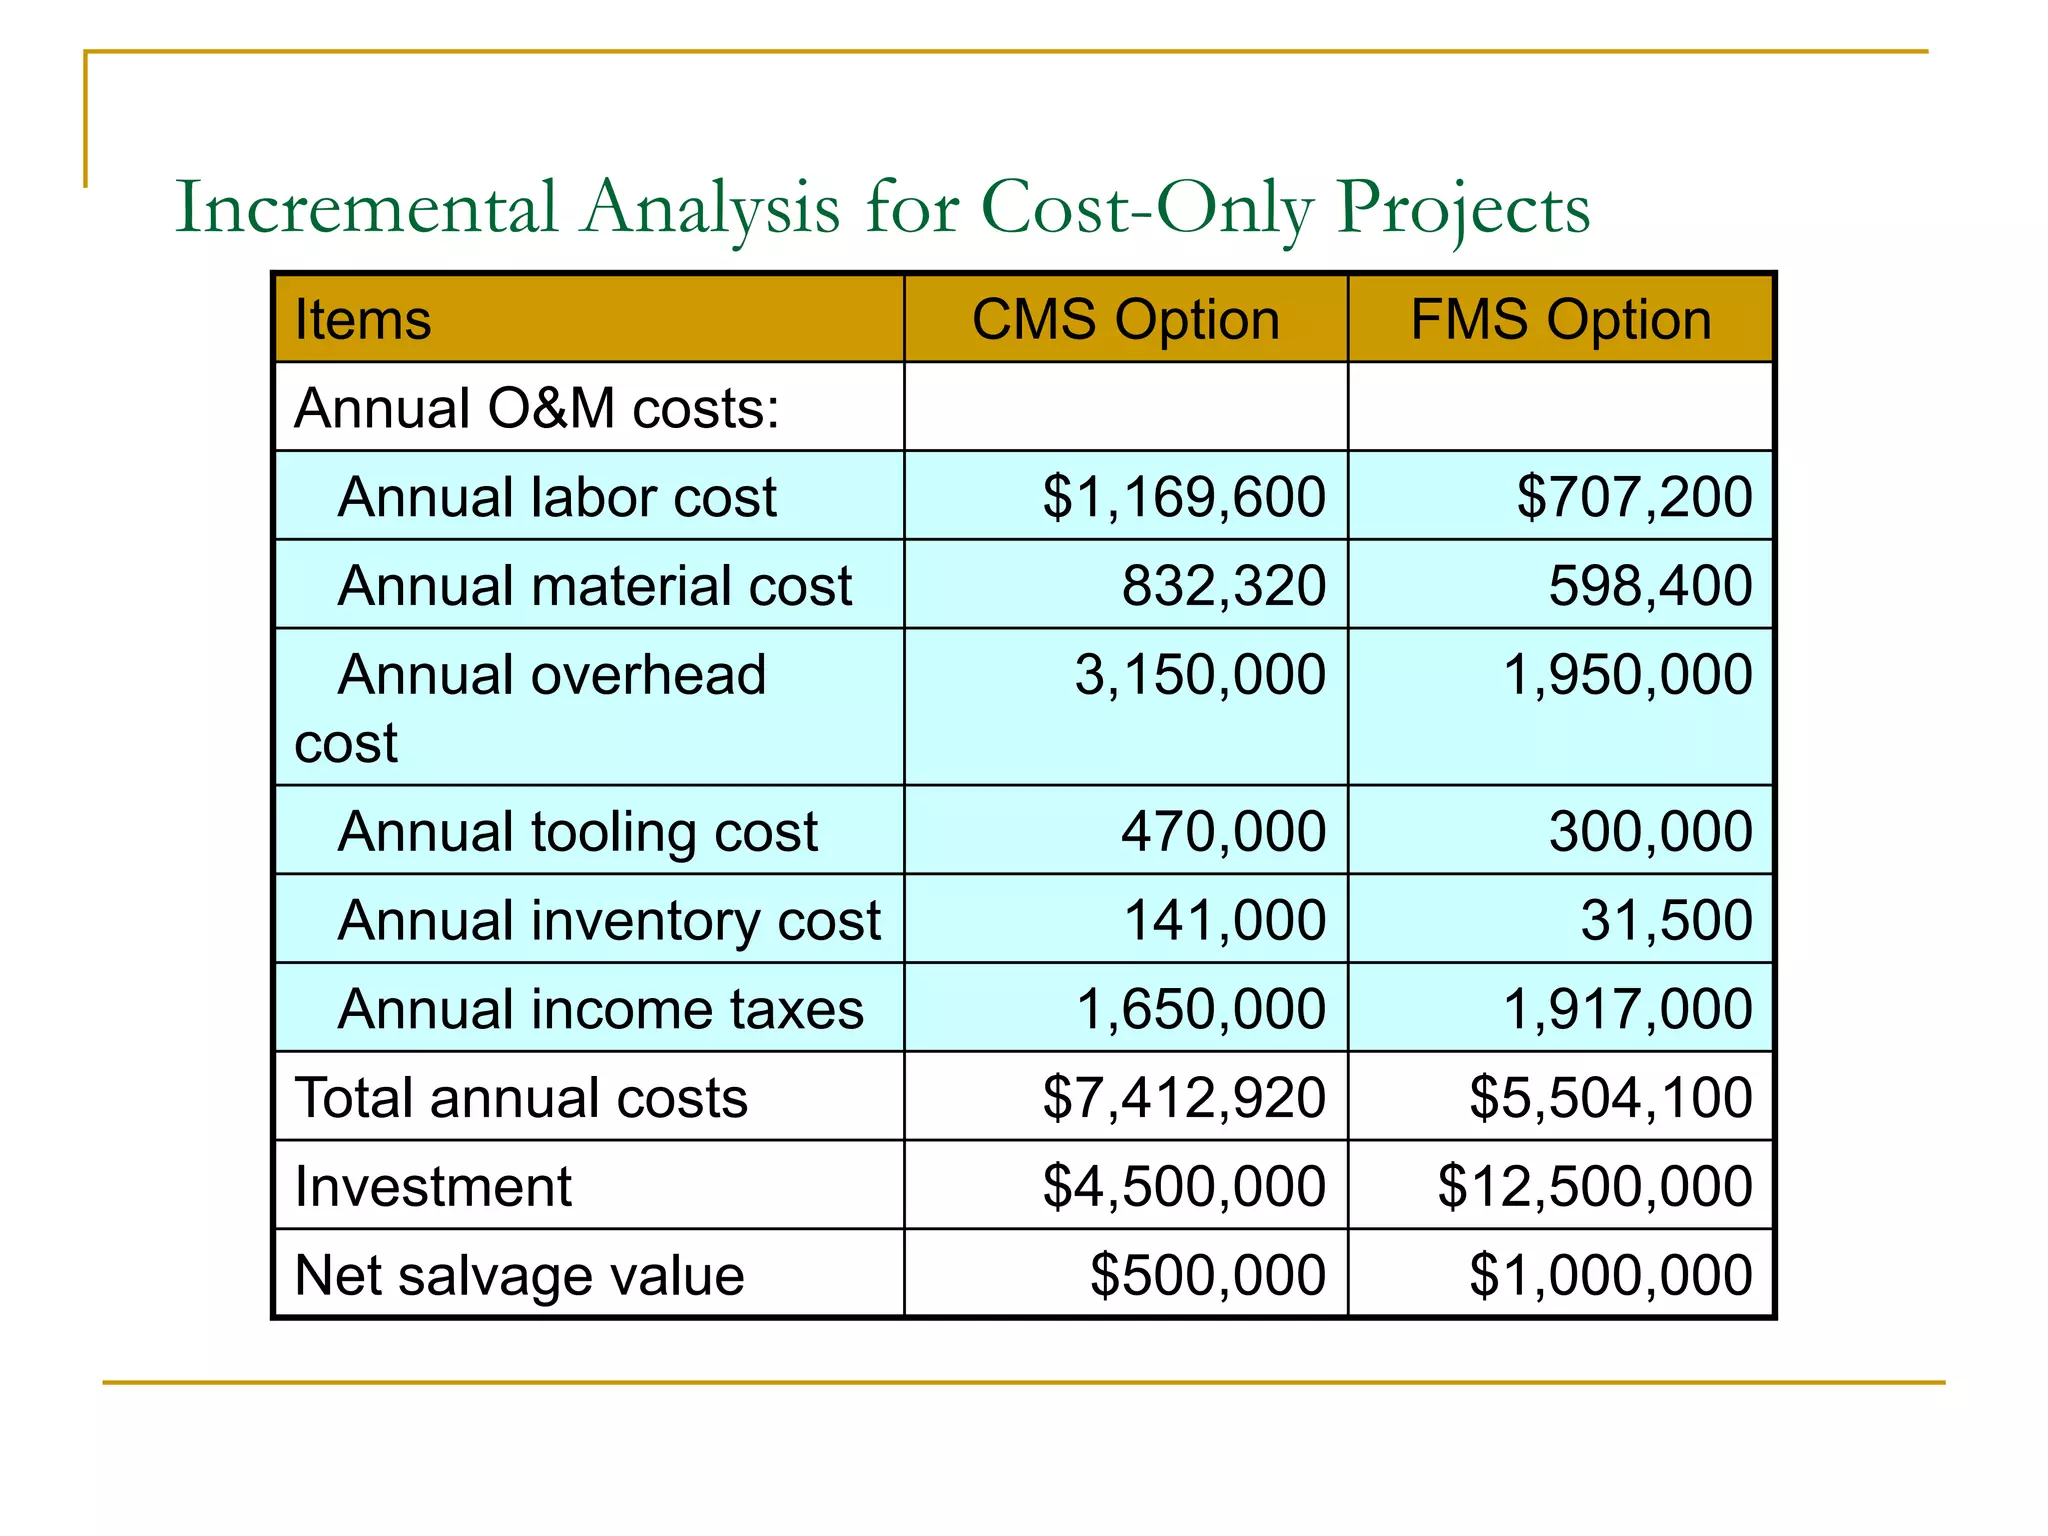
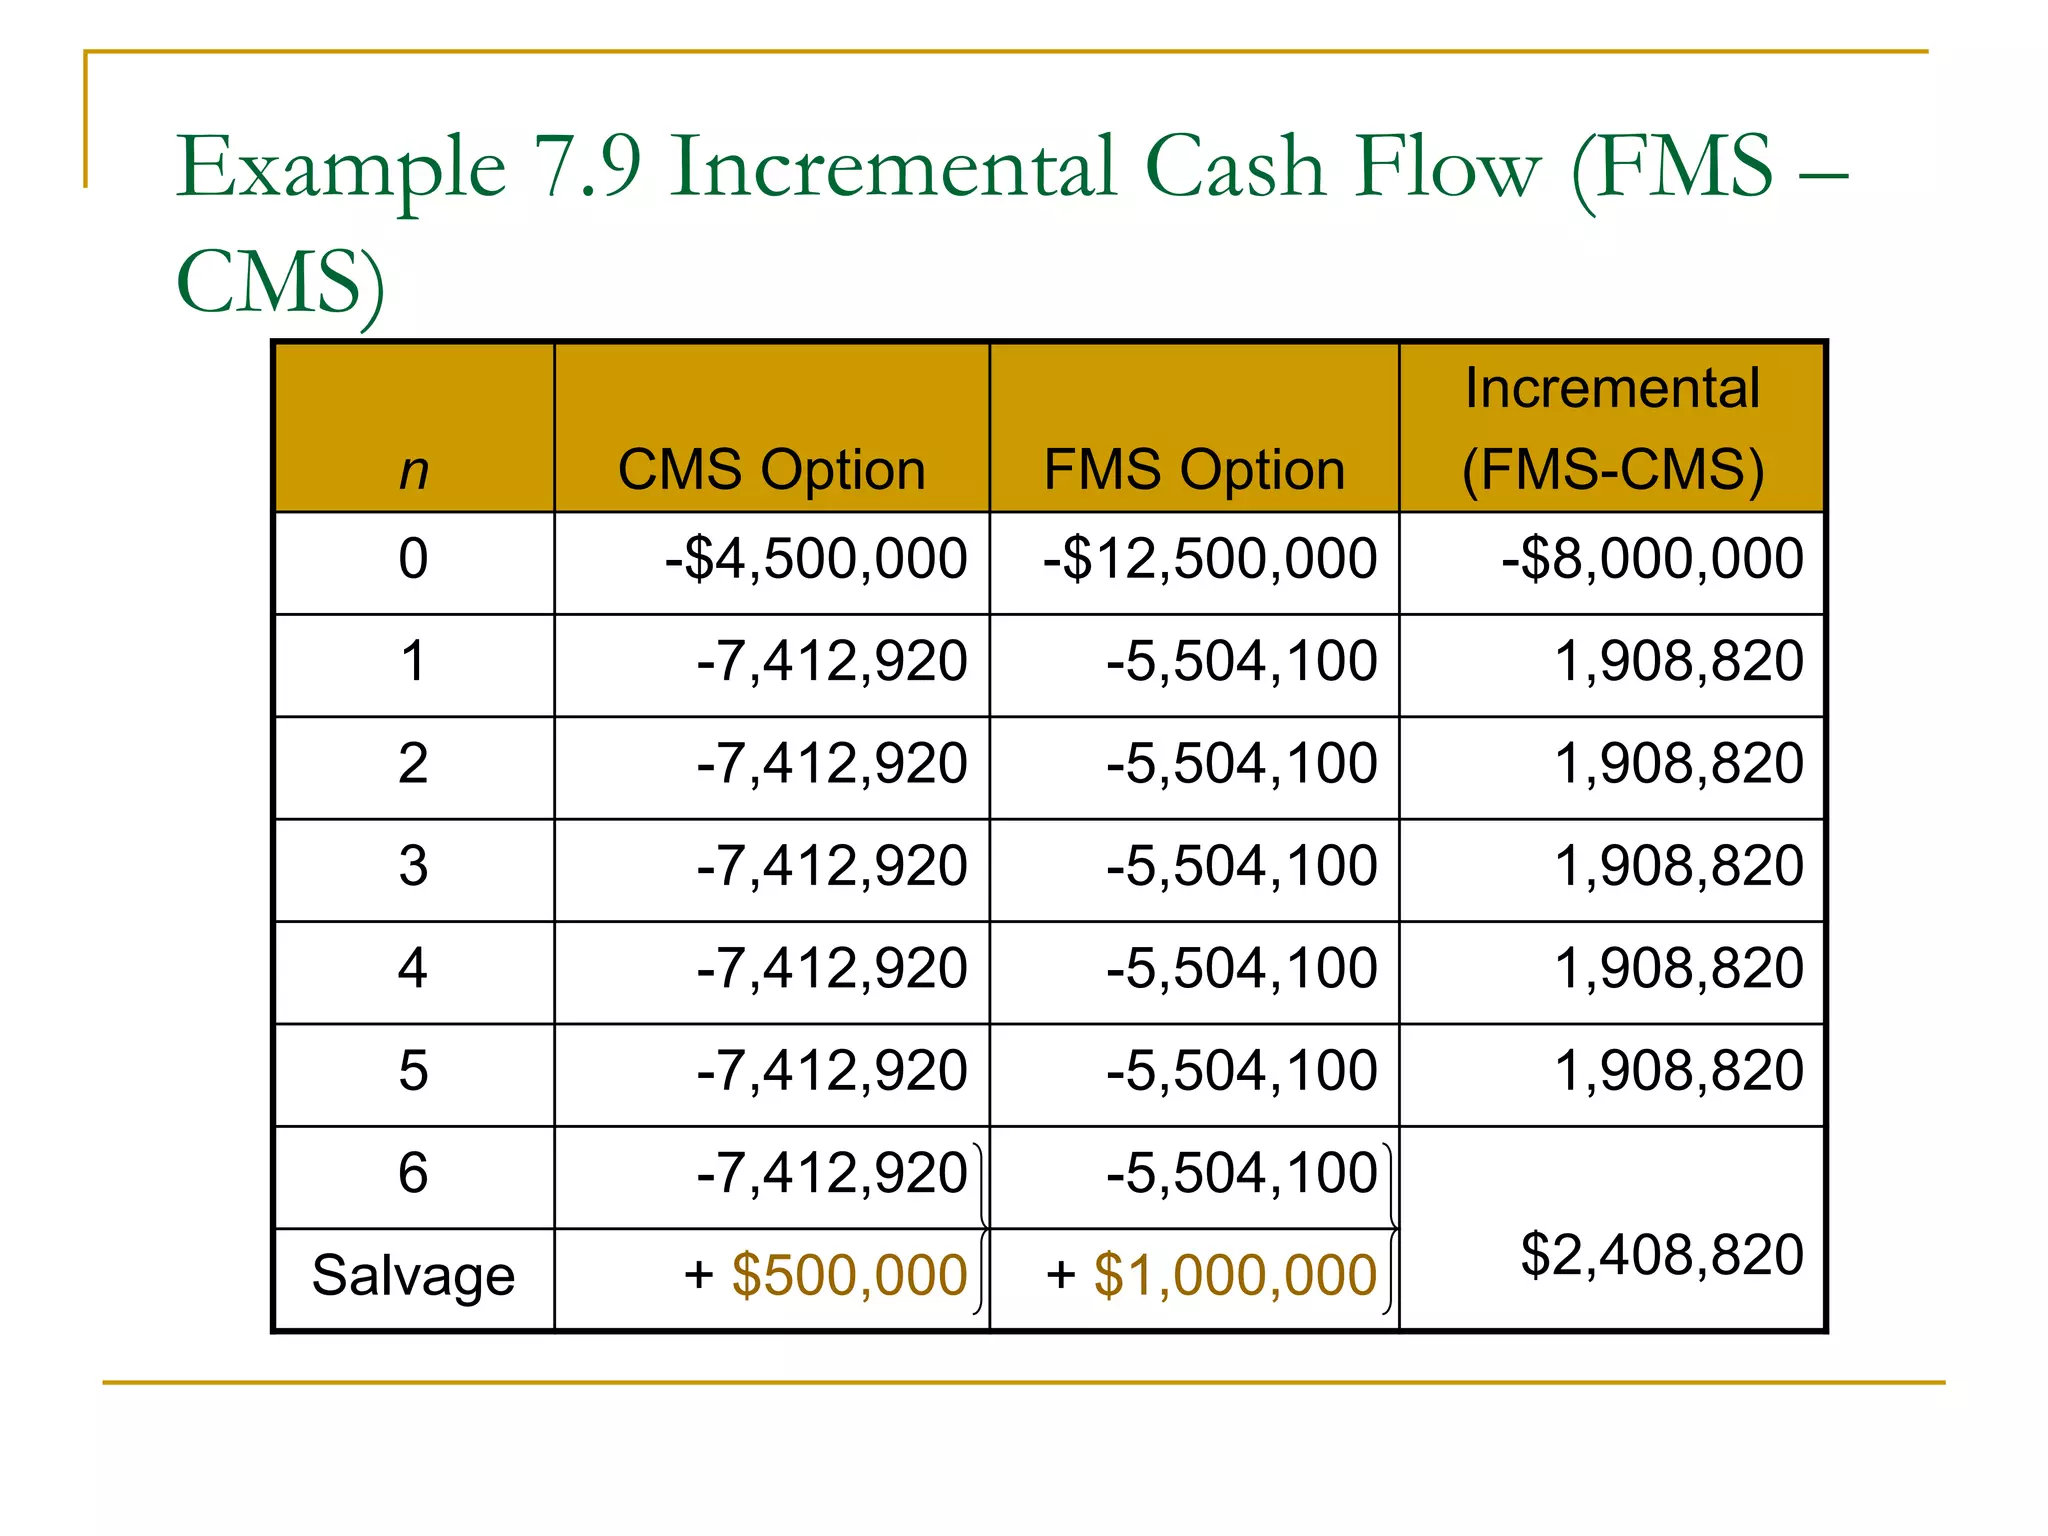
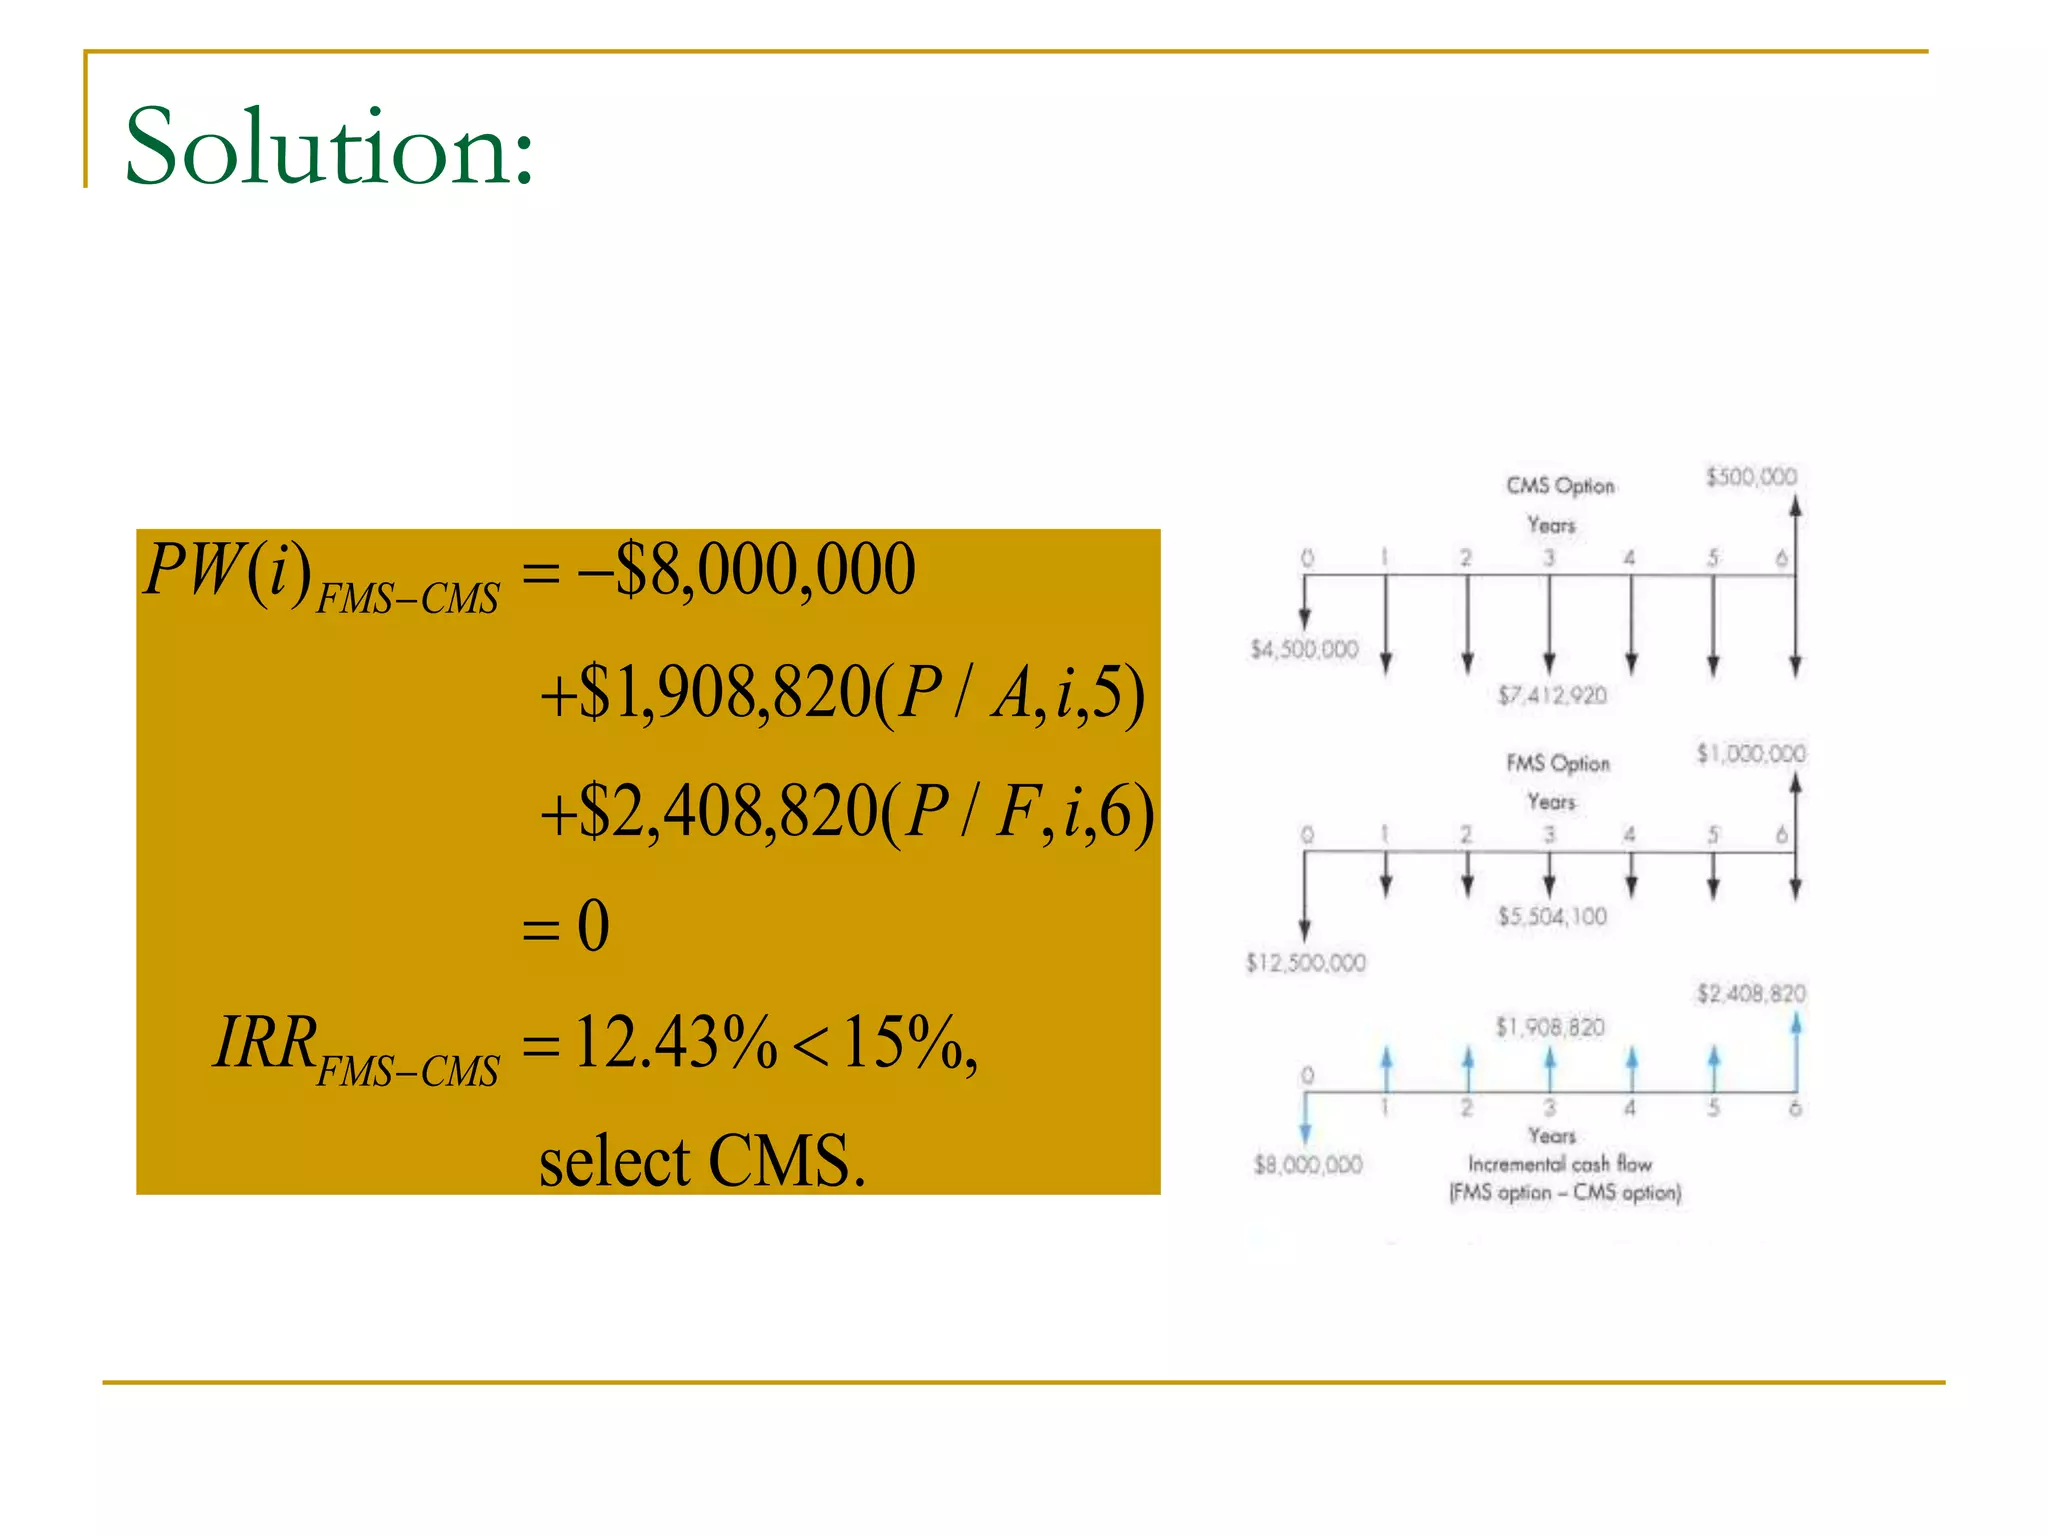
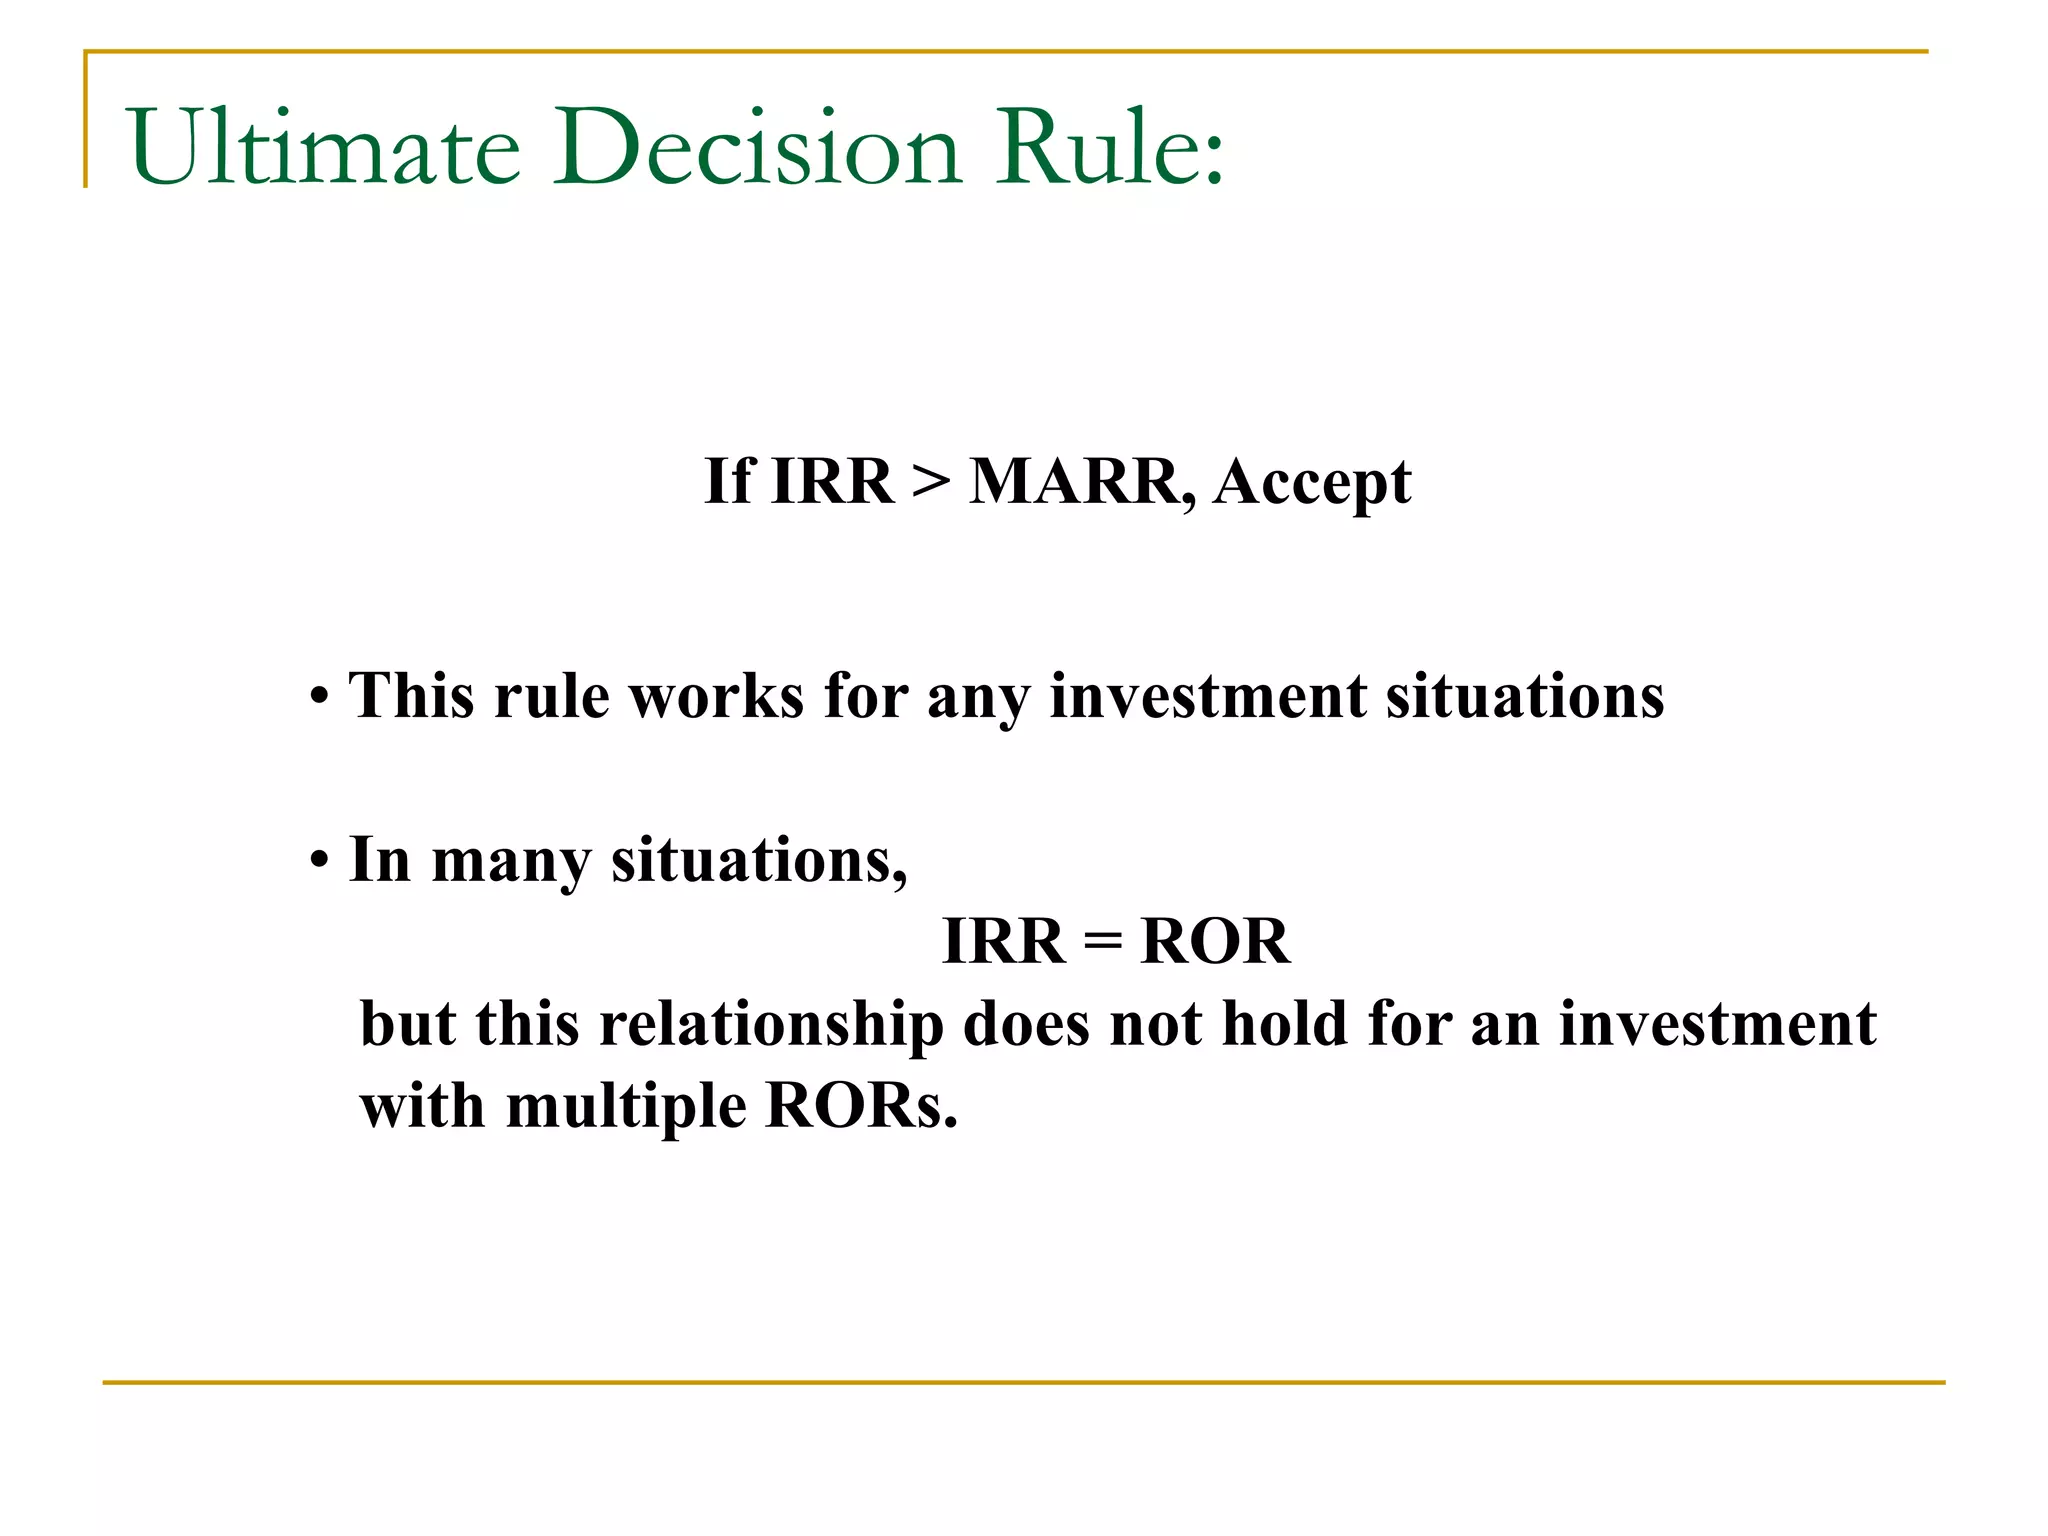
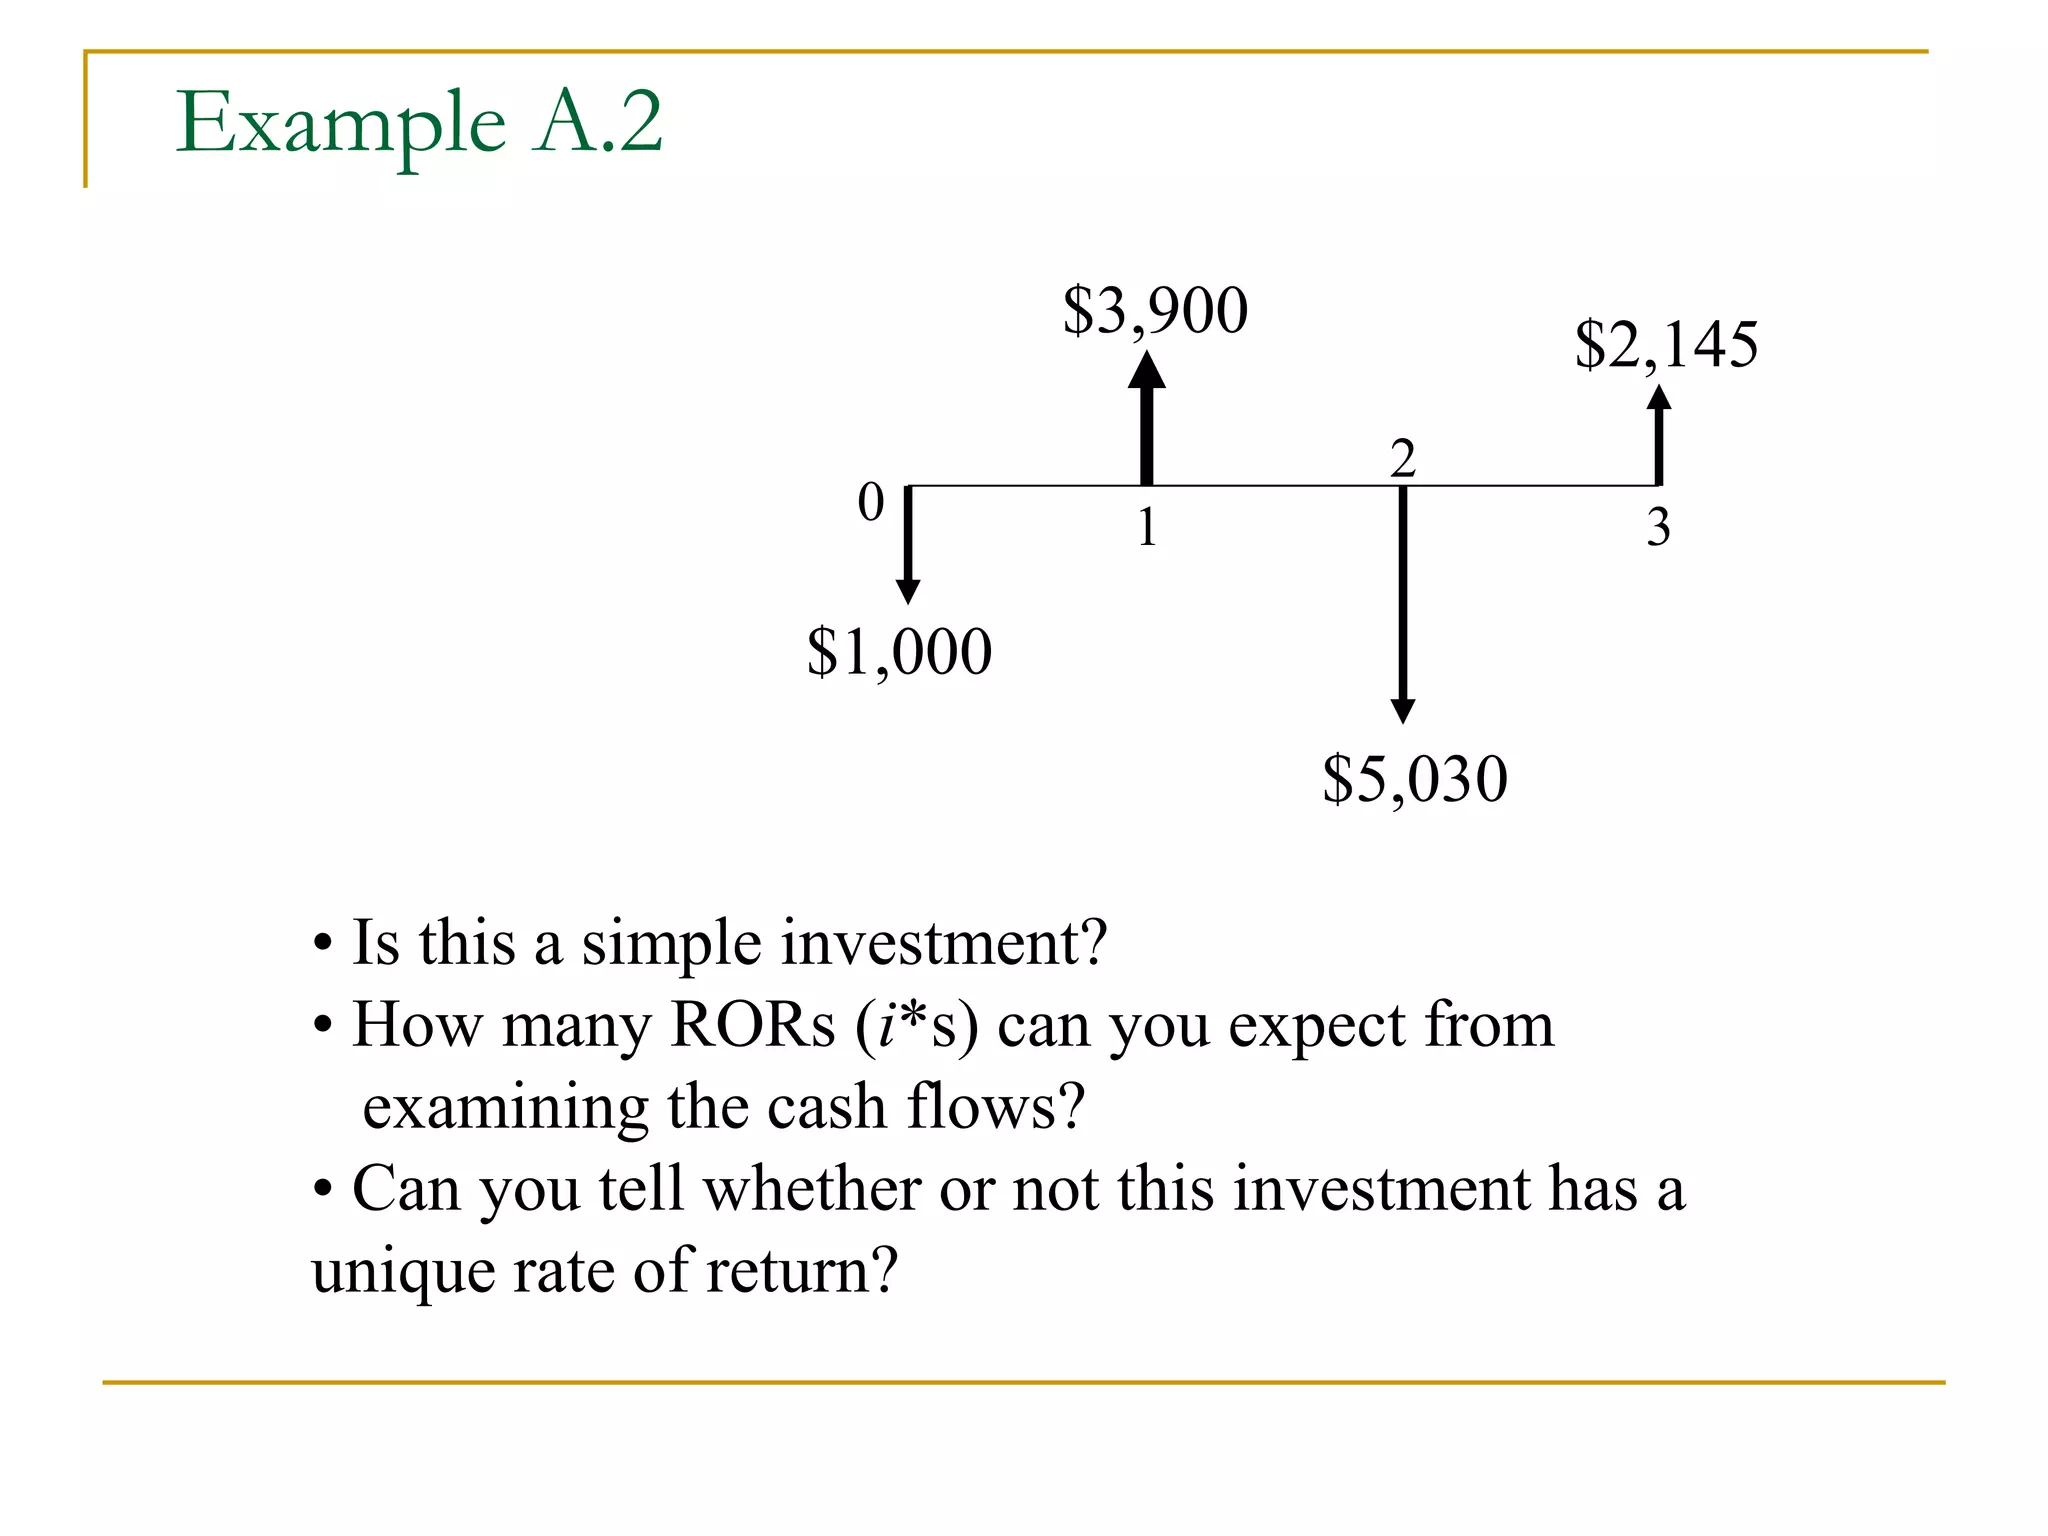
Incremental Analysis
Lecture No. 21
Professor C. S. Park
Fundamentals of Engineering Economics
Copyright © 2005
Comparing Mutually Exclusive Alternatives
Based on IRR
• Issue: Can we rank the mutually exclusive
projects by the magnitude of its IRR?
n A1 A2
0
1
IRR
-$1,000 -$5,000
$2,000 $7,000
100% > 40%
$818 < $1,364
PW (10%)
Who Got More Pay Raise?
Bill Hillary
10% 5%
Can’t Compare without Knowing Their
Base Salaries
Bill Hillary
Base Salary $50,000 $200,000
Pay Raise (%) 10% 5%
Pay Raise ($) $5,000 $10,000
For the same reason, we can’t compare mutually exclusive projects based on
the magnitude of its IRR. We need to know the size of investment and its timing
of when to occur.
Incremental Investment
• Assuming a MARR of 10%, you can always earn that rate from other
investment source, i.e., $4,400 at the end of one year for $4,000
investment.
• By investing the additional $4,000 in A2, you would make additional
$5,000, which is equivalent to earning at the rate of 25%. Therefore,
the incremental investment in A2 is justified.
n Project A1 Project A2
Incremental
Investment
(A2 – A1)
0
1
-$1,000
$2,000
-$5,000
$7,000
-$4,000
$5,000
ROR
PW(10%)
100%
$818
40%
$1,364
25%
$546
Incremental Analysis (Procedure)
Step 1: Compute the cash flow for the difference
between the projects (A,B) by subtracting
the cash flow of the lower investment
cost project (A) from that of the higher
investment cost project (B).
Step 2: Compute the IRR on this incremental
investment (IRR ).
Step 3: Accept the investment B if and only if
IRR B-A > MARR
B-A
NOTE: Make sure that both IRRA and IRRB are greater than MARR.
Example 7.7 - Incremental Rate of Return
n B1 B2 B2 - B1
0
1
2
3
-$3,000
1,350
1,800
1,500
-$12,000
4,200
6,225
6,330
-$9,000
2,850
4,425
4,830
IRR 25% 17.43% 15%
Given MARR = 10%, which project is a better choice?
Since IRRB2-B1=15% > 10%, and also IRRB2 > 10%, select B2.
IRR on Increment Investment:
Three Alternatives
n D1 D2 D3
0 -$2,000 -$1,000 -$3,000
1 1,500 800 1,500
2 1,000 500 2,000
3 800 500 1,000
IRR 34.37% 40.76% 24.81%
Step 1: Examine the IRR for each
project to eliminate any project
that fails to meet the MARR.
Step 2: Compare D1 and D2 in pairs.
IRRD2-D1=27.61% > 15%,
so select D1. D1 becomes the
current best.
Step 3: Compare D1 and D3.
IRRD3-D1= 8.8% < 15%,
so select D1 again.
Here, we conclude that D1 is the best
Alternative.
Practice Problem
You are considering
four types of
engineering designs.
The project lasts 10
years with the following
estimated cash flows.
The interest rate
(MARR) is 10%. Which
of the four is more
attractive?
A B C D
Initial cost $150 $220 $300 $340
Revenues/
Year
$115 $125 $160 $185
Expenses/
Year
$70 $65 $60 $80
Incremental Analysis for Cost-Only Projects
Items CMS Option FMS Option
Annual O&M costs:
Annual labor cost $1,169,600 $707,200
Annual material cost 832,320 598,400
Annual overhead
cost
3,150,000 1,950,000
Annual tooling cost 470,000 300,000
Annual inventory cost 141,000 31,500
Annual income taxes 1,650,000 1,917,000
Total annual costs $7,412,920 $5,504,100
Investment $4,500,000 $12,500,000
Net salvage value $500,000 $1,000,000
Example 7.9 Incremental Cash Flow (FMS –
CMS)
n CMS Option FMS Option
Incremental
(FMS-CMS)
0 -$4,500,000 -$12,500,000 -$8,000,000
1 -7,412,920 -5,504,100 1,908,820
2 -7,412,920 -5,504,100 1,908,820
3 -7,412,920 -5,504,100 1,908,820
4 -7,412,920 -5,504,100 1,908,820
5 -7,412,920 -5,504,100 1,908,820
6 -7,412,920 -5,504,100
$2,408,820
Salvage + $500,000 + $1,000,000
Solution:
PW i
P A i
P F i
IRR
FMS CMS
FMS CMS
( ) $8, ,
$1,908, ( / , , )
$2, , ( / , , )
.43%


 



 
000 000
820 5
408 820 6
0
12 15%,
select CMS.
Ultimate Decision Rule:
If IRR > MARR, Accept
• This rule works for any investment situations
• In many situations,
IRR = ROR
but this relationship does not hold for an investment
with multiple RORs.
Predicting Multiple RORs (Chapter
7A)
- 100% < i *< infinity
• Net Cash Flow Rule of Signs
No. of real RORs (i*s)
<
No. of sign changes in the project
cash flows
Example
n Net Cash flow Sign Change
0
1
2
3
4
5
6
-$100
-$20
$50
0
$60
-$30
$100
1
1
1
• No. of real i*s  3
• This implies that the project could have
(0, 1, 2, or 3) i*s but NOT more than 3.
Accumulated Cash Flow Sign Test
Find the accounting sum of net cash flows at
the end of each period over the life of the
project
Period Cash Flow Sum
(n) (An ) Sn
If the series S starts negatively and changes sign
ONLY ONCE, there exists a unique positive i*.
S A
S S A
S S A
S S A
N N N
0 0
1 0 1
2 1 2
1

 
 
 


A
A
A
AN
0
1
2

0
1
2

N
Example
n An Sn Sign change
0
1
2
3
4
5
6
-$100
-$20
$50
0
$60
-$30
$100
-$100
-$120
-$70
-$70
-$10
-$40
$60 1
• No of sign change = 1, indicating a unique i*.
• i* = 10.46%
Example A.2
$2,145
$3,900
$5,030
$1,000
0 1
2
3
• Is this a simple investment?
• How many RORs (i*s) can you expect from
examining the cash flows?
• Can you tell whether or not this investment has a
unique rate of return?
Summary
 Rate of return (ROR) is the interest rate earned on
unrecovered project balances such that an investment’s cash
receipts make the terminal project balance equal to zero.
 Rate of return is an intuitively familiar and understandable
measure of project profitability that many managers prefer to
NPW or other equivalence measures.
 Mathematically we can determine the rate of return for a
given project cash flow series by locating an interest rate that
equates the net present worth of its cash flows to zero. This
break-even interest rate is denoted by the symbol i*.
 Internal rate of return (IRR) is another term for ROR that
stresses the fact that we are concerned with the interest
earned on the portion of the project that is internally invested,
not those portions that are released by (borrowed from) the
project.
 To apply rate of return analysis correctly, we need to classify
an investment into either a simple or a nonsimple investment.
 A simple investment is defined as one in which the initial
cash flows are negative and only one sign change occurs in
the net cash flow, whereas a nonsimple investment is one for
which more than one sign change occurs in the net cash flow
series.
 Multiple i*s occur only in nonsimple investments. However,
not all nonsimple investments will have multiple i*s either.
 For a simple investment, the solving rate of return (i*) is the
rate of return internal to the project; so the decision rule is:
If IRR > MARR, accept the project.
If IRR = MARR, remain indifferent.
If IRR < MARR, reject the project.
IRR analysis yields results consistent with NPW and other
equivalence methods.
 For a nonsimple investment, because of the possibility of
having multiple rates of return, we need to calculate the true
IRR, or known as “return on invested capital.” However, your
objective is to make an accept or reject decision, it is
recommended the IRR analysis be abandoned and either the
NPW or AE analysis be used to make an accept/reject
decision.
 When properly selecting among alternative projects by IRR
analysis, incremental investment must be used.

Lecture-No21.ppt

  • 1.
    Incremental Analysis Lecture No.21 Professor C. S. Park Fundamentals of Engineering Economics Copyright © 2005
  • 2.
    Comparing Mutually ExclusiveAlternatives Based on IRR • Issue: Can we rank the mutually exclusive projects by the magnitude of its IRR? n A1 A2 0 1 IRR -$1,000 -$5,000 $2,000 $7,000 100% > 40% $818 < $1,364 PW (10%)
  • 3.
    Who Got MorePay Raise? Bill Hillary 10% 5%
  • 4.
    Can’t Compare withoutKnowing Their Base Salaries Bill Hillary Base Salary $50,000 $200,000 Pay Raise (%) 10% 5% Pay Raise ($) $5,000 $10,000 For the same reason, we can’t compare mutually exclusive projects based on the magnitude of its IRR. We need to know the size of investment and its timing of when to occur.
  • 5.
    Incremental Investment • Assuminga MARR of 10%, you can always earn that rate from other investment source, i.e., $4,400 at the end of one year for $4,000 investment. • By investing the additional $4,000 in A2, you would make additional $5,000, which is equivalent to earning at the rate of 25%. Therefore, the incremental investment in A2 is justified. n Project A1 Project A2 Incremental Investment (A2 – A1) 0 1 -$1,000 $2,000 -$5,000 $7,000 -$4,000 $5,000 ROR PW(10%) 100% $818 40% $1,364 25% $546
  • 6.
    Incremental Analysis (Procedure) Step1: Compute the cash flow for the difference between the projects (A,B) by subtracting the cash flow of the lower investment cost project (A) from that of the higher investment cost project (B). Step 2: Compute the IRR on this incremental investment (IRR ). Step 3: Accept the investment B if and only if IRR B-A > MARR B-A NOTE: Make sure that both IRRA and IRRB are greater than MARR.
  • 7.
    Example 7.7 -Incremental Rate of Return n B1 B2 B2 - B1 0 1 2 3 -$3,000 1,350 1,800 1,500 -$12,000 4,200 6,225 6,330 -$9,000 2,850 4,425 4,830 IRR 25% 17.43% 15% Given MARR = 10%, which project is a better choice? Since IRRB2-B1=15% > 10%, and also IRRB2 > 10%, select B2.
  • 8.
    IRR on IncrementInvestment: Three Alternatives n D1 D2 D3 0 -$2,000 -$1,000 -$3,000 1 1,500 800 1,500 2 1,000 500 2,000 3 800 500 1,000 IRR 34.37% 40.76% 24.81% Step 1: Examine the IRR for each project to eliminate any project that fails to meet the MARR. Step 2: Compare D1 and D2 in pairs. IRRD2-D1=27.61% > 15%, so select D1. D1 becomes the current best. Step 3: Compare D1 and D3. IRRD3-D1= 8.8% < 15%, so select D1 again. Here, we conclude that D1 is the best Alternative.
  • 9.
    Practice Problem You areconsidering four types of engineering designs. The project lasts 10 years with the following estimated cash flows. The interest rate (MARR) is 10%. Which of the four is more attractive? A B C D Initial cost $150 $220 $300 $340 Revenues/ Year $115 $125 $160 $185 Expenses/ Year $70 $65 $60 $80
  • 10.
    Incremental Analysis forCost-Only Projects Items CMS Option FMS Option Annual O&M costs: Annual labor cost $1,169,600 $707,200 Annual material cost 832,320 598,400 Annual overhead cost 3,150,000 1,950,000 Annual tooling cost 470,000 300,000 Annual inventory cost 141,000 31,500 Annual income taxes 1,650,000 1,917,000 Total annual costs $7,412,920 $5,504,100 Investment $4,500,000 $12,500,000 Net salvage value $500,000 $1,000,000
  • 11.
    Example 7.9 IncrementalCash Flow (FMS – CMS) n CMS Option FMS Option Incremental (FMS-CMS) 0 -$4,500,000 -$12,500,000 -$8,000,000 1 -7,412,920 -5,504,100 1,908,820 2 -7,412,920 -5,504,100 1,908,820 3 -7,412,920 -5,504,100 1,908,820 4 -7,412,920 -5,504,100 1,908,820 5 -7,412,920 -5,504,100 1,908,820 6 -7,412,920 -5,504,100 $2,408,820 Salvage + $500,000 + $1,000,000
  • 12.
    Solution: PW i P Ai P F i IRR FMS CMS FMS CMS ( ) $8, , $1,908, ( / , , ) $2, , ( / , , ) .43%          000 000 820 5 408 820 6 0 12 15%, select CMS.
  • 13.
    Ultimate Decision Rule: IfIRR > MARR, Accept • This rule works for any investment situations • In many situations, IRR = ROR but this relationship does not hold for an investment with multiple RORs.
  • 14.
    Predicting Multiple RORs(Chapter 7A) - 100% < i *< infinity • Net Cash Flow Rule of Signs No. of real RORs (i*s) < No. of sign changes in the project cash flows
  • 15.
    Example n Net Cashflow Sign Change 0 1 2 3 4 5 6 -$100 -$20 $50 0 $60 -$30 $100 1 1 1 • No. of real i*s  3 • This implies that the project could have (0, 1, 2, or 3) i*s but NOT more than 3.
  • 16.
    Accumulated Cash FlowSign Test Find the accounting sum of net cash flows at the end of each period over the life of the project Period Cash Flow Sum (n) (An ) Sn If the series S starts negatively and changes sign ONLY ONCE, there exists a unique positive i*. S A S S A S S A S S A N N N 0 0 1 0 1 2 1 2 1          A A A AN 0 1 2  0 1 2  N
  • 17.
    Example n An SnSign change 0 1 2 3 4 5 6 -$100 -$20 $50 0 $60 -$30 $100 -$100 -$120 -$70 -$70 -$10 -$40 $60 1 • No of sign change = 1, indicating a unique i*. • i* = 10.46%
  • 18.
    Example A.2 $2,145 $3,900 $5,030 $1,000 0 1 2 3 •Is this a simple investment? • How many RORs (i*s) can you expect from examining the cash flows? • Can you tell whether or not this investment has a unique rate of return?
  • 19.
    Summary  Rate ofreturn (ROR) is the interest rate earned on unrecovered project balances such that an investment’s cash receipts make the terminal project balance equal to zero.  Rate of return is an intuitively familiar and understandable measure of project profitability that many managers prefer to NPW or other equivalence measures.  Mathematically we can determine the rate of return for a given project cash flow series by locating an interest rate that equates the net present worth of its cash flows to zero. This break-even interest rate is denoted by the symbol i*.
  • 20.
     Internal rateof return (IRR) is another term for ROR that stresses the fact that we are concerned with the interest earned on the portion of the project that is internally invested, not those portions that are released by (borrowed from) the project.  To apply rate of return analysis correctly, we need to classify an investment into either a simple or a nonsimple investment.  A simple investment is defined as one in which the initial cash flows are negative and only one sign change occurs in the net cash flow, whereas a nonsimple investment is one for which more than one sign change occurs in the net cash flow series.  Multiple i*s occur only in nonsimple investments. However, not all nonsimple investments will have multiple i*s either.
  • 21.
     For asimple investment, the solving rate of return (i*) is the rate of return internal to the project; so the decision rule is: If IRR > MARR, accept the project. If IRR = MARR, remain indifferent. If IRR < MARR, reject the project. IRR analysis yields results consistent with NPW and other equivalence methods.  For a nonsimple investment, because of the possibility of having multiple rates of return, we need to calculate the true IRR, or known as “return on invested capital.” However, your objective is to make an accept or reject decision, it is recommended the IRR analysis be abandoned and either the NPW or AE analysis be used to make an accept/reject decision.  When properly selecting among alternative projects by IRR analysis, incremental investment must be used.