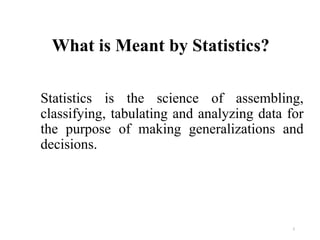
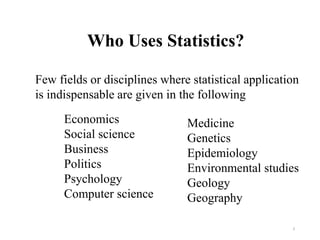
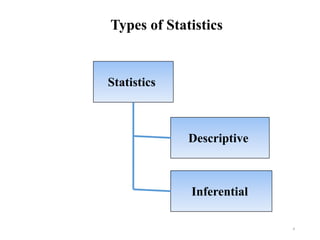
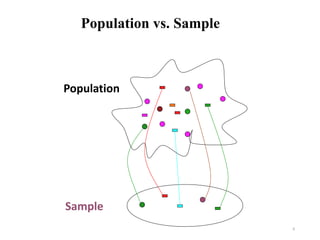
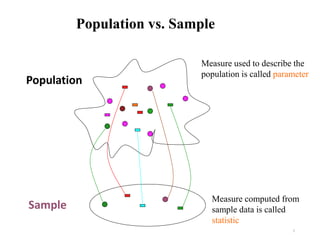
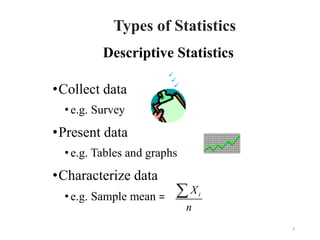
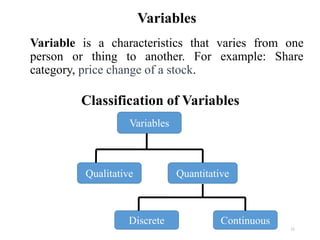
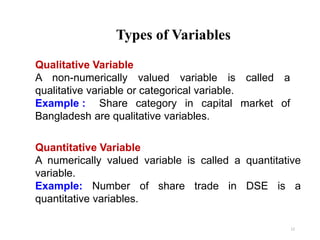
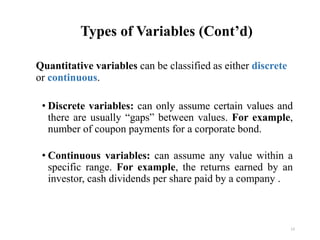
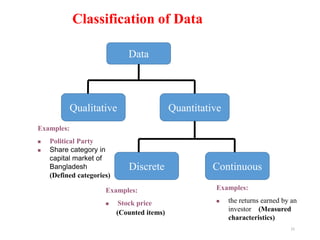
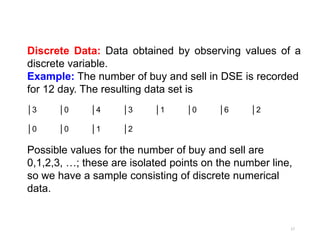
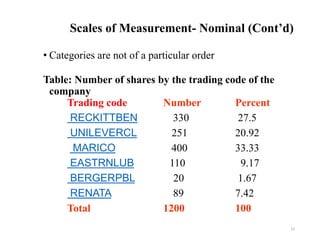
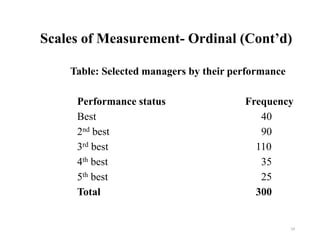
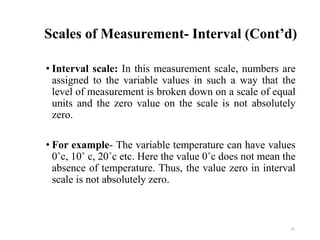
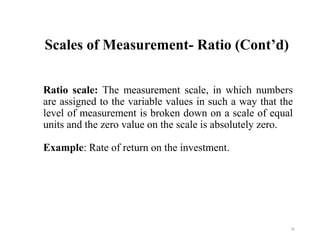
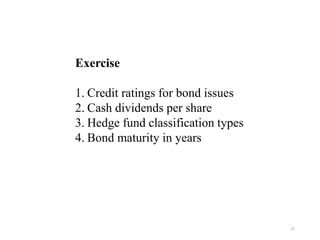
SlideShare a Scribd company logo
Introduction to Statistics
Dr. Tamanna Islam
Bangladesh Institute of Capital Market (BICM)
1
What is Meant by Statistics?
Statistics is the science of assembling,
classifying, tabulating and analyzing data for
the purpose of making generalizations and
decisions.
2
Who Uses Statistics?
3
Few fields or disciplines where statistical application
is indispensable are given in the following
Economics
Social science
Business
Politics
Psychology
Computer science
Medicine
Genetics
Epidemiology
Environmental studies
Geology
Geography
Statistics
Descriptive
Inferential
Types of Statistics
4
Types of Statistics
• Descriptive Statistics: Methods of organizing,
summarizing, and presenting data in an informative way.
• Inferential statistics: The following concepts would be
required for defining inferential statistics.
 A population is a collection of all possible
individuals, objects, or measurements of interest. A
parameter is a summary measure that describes a
characteristic of the population.
 A sample is a representative portion or part of the
population of interest. A statistic is a summary
measure computed from a sample.
5
Population vs. Sample
6
Population
Sample
Population vs. Sample
7
Population
Sample
Measure used to describe the
population is called parameter
Measure computed from
sample data is called
statistic
Census vs. Survey
8
Population
Sample
In a census, data about all
individual units are collected
in the population.
The term survey has
been defined as a
method of collecting
detailed information
relating to representative
group.
Descriptive Statistics
•Collect data
• e.g. Survey
•Present data
• e.g. Tables and graphs
•Characterize data
• e.g. Sample mean =
9
i
X
n

Types of Statistics
Inferential Statistics
• Estimation
• making estimates about
populations
• Hypothesis testing
• testing hypotheses to draw
conclusions about populations
10
Drawing conclusions and/or making decisions concerning a
population based on sample results.
Variables
Variable is a characteristics that varies from one
person or thing to another. For example: Share
category, price change of a stock.
11
Variables
Qualitative Quantitative
Discrete Continuous
Classification of Variables
Types of Variables
12
Qualitative Variable
A non-numerically valued variable is called a
qualitative variable or categorical variable.
Example : Share category in capital market of
Bangladesh are qualitative variables.
Quantitative Variable
A numerically valued variable is called a quantitative
variable.
Example: Number of share trade in DSE is a
quantitative variables.
Types of Variables (Cont’d)
Quantitative variables can be classified as either discrete
or continuous.
• Discrete variables: can only assume certain values and
there are usually “gaps” between values. For example,
number of coupon payments for a corporate bond.
• Continuous variables: can assume any value within a
specific range. For example, the returns earned by an
investor, cash dividends per share paid by a company .
13
Data
Information obtained by observing values of a
variable is data.
14
Data
Qualitative Quantitative
Discrete Continuous
Classification of Data
Examples:
 Political Party
 Share category in
capital market of
Bangladesh
(Defined categories)
Examples:
 Stock price
(Counted items)
Examples:
 the returns earned by an
investor (Measured
characteristics)
15
Qualitative Data
Data obtained by observing values of a qualitative
variable.
Example: Share category in capital market of Bangladesh
as A, B, G, N, Z. The data received when you are told
Individual’s type is qualitative data.
Quantitative Data
Data obtained by observing values of a quantitative
variable.
Example: Daily sales recorded in DSE will give
quantitative data.
16
Discrete Data: Data obtained by observing values of a
discrete variable.
Example: The number of buy and sell in DSE is recorded
for 12 day. The resulting data set is
│3 │0 │4 │3 │1 │0 │6 │2
│0 │0 │1 │2
Possible values for the number of buy and sell are
0,1,2,3, …; these are isolated points on the number line,
so we have a sample consisting of discrete numerical
data.
17
Continuous Data: Data obtained by observing values of a
continuous variable.
Example: A sample of 20 investors return earned (hundred
TK) is determined for each one. The resulting data set is:
29.8 27.6 28.3 28.7 27.9 29.9 30.1 28.0 28.7
27.9 28.5 29.5 27.2 26.9 28.4 27.9 28.0 30.0
29.1 26.4
Here we have a sample consisting of continuous data.
18
Scales of Measurement
• Measurement is a process of assigning numbers to
some characteristics or variables or events according to
scientific rules.
• Arithmetic and statistical operations for summarizing
and presenting data depend on the levels of
measurement.
 Example- Average height of Bangladeshi male,
Proportion of smokers in a community.
19
Scales of Measurement (Cont’d)
Four scales of measurement:
 Nominal scale
 Ordinal scale
 Interval scale
 Ratio scale
20
Scales of Measurement- Nominal (Cont’d)
• Nominal scale: The measurement scale, in which
numbers are assigned to the categories or variable values
for identification only, is called a nominal scale.
• For example- name of company’s.
• Each value is a category and the values itself serves
merely as a label on name for the category.
• No assumption of ordering or distance between
categories is made.
21
• Categories are not of a particular order
Table: Number of shares by the trading code of the
company
Trading code Number Percent
RECKITTBEN 330 27.5
UNILEVERCL 251 20.92
MARICO 400 33.33
EASTRNLUB 110 9.17
BERGERPBL 20 1.67
RENATA 89 7.42
Total 1200 100
22
Scales of Measurement- Nominal (Cont’d)
Scales of Measurement- Ordinal (Cont’d)
Ordinal scale: The measurement scale, in which
numbers are assigned to the categories or
variable values for identification as well as
ranking.
Example: Rank of the managers of mutual funds
based on their performance.
23
Scales of Measurement- Ordinal (Cont’d)
Table: Selected managers by their performance
Performance status Frequency
Best 40
2nd best 90
3rd best 110
4th best 35
5th best 25
Total 300
24
Scales of Measurement- Interval (Cont’d)
• Interval scale: In this measurement scale, numbers are
assigned to the variable values in such a way that the
level of measurement is broken down on a scale of equal
units and the zero value on the scale is not absolutely
zero.
• For example- The variable temperature can have values
0˚c, 10˚ c, 20˚c etc. Here the value 0˚c does not mean the
absence of temperature. Thus, the value zero in interval
scale is not absolutely zero.
25
Scales of Measurement- Ratio (Cont’d)
Ratio scale: The measurement scale, in which numbers
are assigned to the variable values in such a way that the
level of measurement is broken down on a scale of equal
units and the zero value on the scale is absolutely zero.
Example: Rate of return on the investment.
26
27
Exercise
1. Credit ratings for bond issues
2. Cash dividends per share
3. Hedge fund classification types
4. Bond maturity in years
Thank You!
28

More Related Content

Similar to Lecture 01_What is Satistics.pptx

Demand estimation and forecasting
Demand estimation and forecastingDemand estimation and forecasting
Demand estimation and forecasting
shivraj negi
 
UNIT IV.pptx
UNIT IV.pptxUNIT IV.pptx
UNIT IV.pptx
senthil kumar
 
Introduction to statistics.pptx
Introduction to statistics.pptxIntroduction to statistics.pptx
Introduction to statistics.pptx
Unfold1
 
Descriptive Analytics: Data Reduction
 Descriptive Analytics: Data Reduction Descriptive Analytics: Data Reduction
Descriptive Analytics: Data Reduction
Nguyen Ngoc Binh Phuong
 
Statistics online lecture 01.pptx
Statistics online lecture  01.pptxStatistics online lecture  01.pptx
Statistics online lecture 01.pptx
IkramUlhaq93
 
Stats LECTURE 1.pptx
Stats LECTURE 1.pptxStats LECTURE 1.pptx
Stats LECTURE 1.pptx
KEHKASHANNIZAM
 
What is Descriptive Statistics and How Do You Choose the Right One for Enterp...
What is Descriptive Statistics and How Do You Choose the Right One for Enterp...What is Descriptive Statistics and How Do You Choose the Right One for Enterp...
What is Descriptive Statistics and How Do You Choose the Right One for Enterp...
Smarten Augmented Analytics
 
Topic-1-Review-of-Basic-Statistics.pptx
Topic-1-Review-of-Basic-Statistics.pptxTopic-1-Review-of-Basic-Statistics.pptx
Topic-1-Review-of-Basic-Statistics.pptx
JohnLester81
 
Topic-1-Review-of-Basic-Statistics.pptx
Topic-1-Review-of-Basic-Statistics.pptxTopic-1-Review-of-Basic-Statistics.pptx
Topic-1-Review-of-Basic-Statistics.pptx
PreciousAntonetteOrp
 
1.0 Descriptive statistics.pdf
1.0 Descriptive statistics.pdf1.0 Descriptive statistics.pdf
1.0 Descriptive statistics.pdf
thaersyam
 
Introduction to Statistics (Part -I)
Introduction to Statistics (Part -I)Introduction to Statistics (Part -I)
Introduction to Statistics (Part -I)
YesAnalytics
 
Managerial Economics (Chapter 5 - Demand Estimation)
 Managerial Economics (Chapter 5 - Demand Estimation) Managerial Economics (Chapter 5 - Demand Estimation)
Managerial Economics (Chapter 5 - Demand Estimation)
Nurul Shareena Misran
 
LEVEL OF MEASUREMENTS_2.ppt
LEVEL OF MEASUREMENTS_2.pptLEVEL OF MEASUREMENTS_2.ppt
LEVEL OF MEASUREMENTS_2.ppt
chusematelephone
 
Statistics
StatisticsStatistics
Statisticspikuoec
 
Chapter 8 addisional content
Chapter 8 addisional contentChapter 8 addisional content
Chapter 8 addisional contentbathabilev
 
Chapter 1: Statistics
Chapter 1: StatisticsChapter 1: Statistics
Chapter 1: Statistics
Andrilyn Alcantara
 
Day 1_ Introduction.pptx
Day 1_ Introduction.pptxDay 1_ Introduction.pptx
Day 1_ Introduction.pptx
AyushiAgarwal265370
 
Topic 1 ELEMENTARY STATISTICS.pptx
Topic 1 ELEMENTARY STATISTICS.pptxTopic 1 ELEMENTARY STATISTICS.pptx
Topic 1 ELEMENTARY STATISTICS.pptx
moisespadillacpsu19
 
Introduction of biostatistics
Introduction of biostatisticsIntroduction of biostatistics
Introduction of biostatistics
khushbu
 

Similar to Lecture 01_What is Satistics.pptx (20)

Demand estimation and forecasting
Demand estimation and forecastingDemand estimation and forecasting
Demand estimation and forecasting
 
UNIT IV.pptx
UNIT IV.pptxUNIT IV.pptx
UNIT IV.pptx
 
Introduction to statistics.pptx
Introduction to statistics.pptxIntroduction to statistics.pptx
Introduction to statistics.pptx
 
Descriptive Analytics: Data Reduction
 Descriptive Analytics: Data Reduction Descriptive Analytics: Data Reduction
Descriptive Analytics: Data Reduction
 
Statistics online lecture 01.pptx
Statistics online lecture  01.pptxStatistics online lecture  01.pptx
Statistics online lecture 01.pptx
 
Stats LECTURE 1.pptx
Stats LECTURE 1.pptxStats LECTURE 1.pptx
Stats LECTURE 1.pptx
 
What is Descriptive Statistics and How Do You Choose the Right One for Enterp...
What is Descriptive Statistics and How Do You Choose the Right One for Enterp...What is Descriptive Statistics and How Do You Choose the Right One for Enterp...
What is Descriptive Statistics and How Do You Choose the Right One for Enterp...
 
Topic-1-Review-of-Basic-Statistics.pptx
Topic-1-Review-of-Basic-Statistics.pptxTopic-1-Review-of-Basic-Statistics.pptx
Topic-1-Review-of-Basic-Statistics.pptx
 
Topic-1-Review-of-Basic-Statistics.pptx
Topic-1-Review-of-Basic-Statistics.pptxTopic-1-Review-of-Basic-Statistics.pptx
Topic-1-Review-of-Basic-Statistics.pptx
 
1.0 Descriptive statistics.pdf
1.0 Descriptive statistics.pdf1.0 Descriptive statistics.pdf
1.0 Descriptive statistics.pdf
 
Introduction to Statistics (Part -I)
Introduction to Statistics (Part -I)Introduction to Statistics (Part -I)
Introduction to Statistics (Part -I)
 
Managerial Economics (Chapter 5 - Demand Estimation)
 Managerial Economics (Chapter 5 - Demand Estimation) Managerial Economics (Chapter 5 - Demand Estimation)
Managerial Economics (Chapter 5 - Demand Estimation)
 
LEVEL OF MEASUREMENTS_2.ppt
LEVEL OF MEASUREMENTS_2.pptLEVEL OF MEASUREMENTS_2.ppt
LEVEL OF MEASUREMENTS_2.ppt
 
Statistics
StatisticsStatistics
Statistics
 
Chapter 8 addisional content
Chapter 8 addisional contentChapter 8 addisional content
Chapter 8 addisional content
 
Chapter 8 addisional content
Chapter 8 addisional contentChapter 8 addisional content
Chapter 8 addisional content
 
Chapter 1: Statistics
Chapter 1: StatisticsChapter 1: Statistics
Chapter 1: Statistics
 
Day 1_ Introduction.pptx
Day 1_ Introduction.pptxDay 1_ Introduction.pptx
Day 1_ Introduction.pptx
 
Topic 1 ELEMENTARY STATISTICS.pptx
Topic 1 ELEMENTARY STATISTICS.pptxTopic 1 ELEMENTARY STATISTICS.pptx
Topic 1 ELEMENTARY STATISTICS.pptx
 
Introduction of biostatistics
Introduction of biostatisticsIntroduction of biostatistics
Introduction of biostatistics
 

Recently uploaded

Best Digital Marketing Institute In NOIDA
Best Digital Marketing Institute In NOIDABest Digital Marketing Institute In NOIDA
Best Digital Marketing Institute In NOIDA
deeptiverma2406
 
Aficamten in HCM (SEQUOIA HCM TRIAL 2024)
Aficamten in HCM (SEQUOIA HCM TRIAL 2024)Aficamten in HCM (SEQUOIA HCM TRIAL 2024)
Aficamten in HCM (SEQUOIA HCM TRIAL 2024)
Ashish Kohli
 
MATATAG CURRICULUM: ASSESSING THE READINESS OF ELEM. PUBLIC SCHOOL TEACHERS I...
MATATAG CURRICULUM: ASSESSING THE READINESS OF ELEM. PUBLIC SCHOOL TEACHERS I...MATATAG CURRICULUM: ASSESSING THE READINESS OF ELEM. PUBLIC SCHOOL TEACHERS I...
MATATAG CURRICULUM: ASSESSING THE READINESS OF ELEM. PUBLIC SCHOOL TEACHERS I...
NelTorrente
 
Natural birth techniques - Mrs.Akanksha Trivedi Rama University
Natural birth techniques - Mrs.Akanksha Trivedi Rama UniversityNatural birth techniques - Mrs.Akanksha Trivedi Rama University
Natural birth techniques - Mrs.Akanksha Trivedi Rama University
Akanksha trivedi rama nursing college kanpur.
 
CACJapan - GROUP Presentation 1- Wk 4.pdf
CACJapan - GROUP Presentation 1- Wk 4.pdfCACJapan - GROUP Presentation 1- Wk 4.pdf
CACJapan - GROUP Presentation 1- Wk 4.pdf
camakaiclarkmusic
 
RPMS TEMPLATE FOR SCHOOL YEAR 2023-2024 FOR TEACHER 1 TO TEACHER 3
RPMS TEMPLATE FOR SCHOOL YEAR 2023-2024 FOR TEACHER 1 TO TEACHER 3RPMS TEMPLATE FOR SCHOOL YEAR 2023-2024 FOR TEACHER 1 TO TEACHER 3
RPMS TEMPLATE FOR SCHOOL YEAR 2023-2024 FOR TEACHER 1 TO TEACHER 3
IreneSebastianRueco1
 
Lapbook sobre os Regimes Totalitários.pdf
Lapbook sobre os Regimes Totalitários.pdfLapbook sobre os Regimes Totalitários.pdf
Lapbook sobre os Regimes Totalitários.pdf
Jean Carlos Nunes Paixão
 
Executive Directors Chat Leveraging AI for Diversity, Equity, and Inclusion
Executive Directors Chat  Leveraging AI for Diversity, Equity, and InclusionExecutive Directors Chat  Leveraging AI for Diversity, Equity, and Inclusion
Executive Directors Chat Leveraging AI for Diversity, Equity, and Inclusion
TechSoup
 
How to Build a Module in Odoo 17 Using the Scaffold Method
How to Build a Module in Odoo 17 Using the Scaffold MethodHow to Build a Module in Odoo 17 Using the Scaffold Method
How to Build a Module in Odoo 17 Using the Scaffold Method
Celine George
 
PIMS Job Advertisement 2024.pdf Islamabad
PIMS Job Advertisement 2024.pdf IslamabadPIMS Job Advertisement 2024.pdf Islamabad
PIMS Job Advertisement 2024.pdf Islamabad
AyyanKhan40
 
Fresher’s Quiz 2023 at GMC Nizamabad.pptx
Fresher’s Quiz 2023 at GMC Nizamabad.pptxFresher’s Quiz 2023 at GMC Nizamabad.pptx
Fresher’s Quiz 2023 at GMC Nizamabad.pptx
SriSurya50
 
MERN Stack Developer Roadmap By ScholarHat PDF
MERN Stack Developer Roadmap By ScholarHat PDFMERN Stack Developer Roadmap By ScholarHat PDF
MERN Stack Developer Roadmap By ScholarHat PDF
scholarhattraining
 
Reflective and Evaluative Practice PowerPoint
Reflective and Evaluative Practice PowerPointReflective and Evaluative Practice PowerPoint
Reflective and Evaluative Practice PowerPoint
amberjdewit93
 
Chapter 4 - Islamic Financial Institutions in Malaysia.pptx
Chapter 4 - Islamic Financial Institutions in Malaysia.pptxChapter 4 - Islamic Financial Institutions in Malaysia.pptx
Chapter 4 - Islamic Financial Institutions in Malaysia.pptx
Mohd Adib Abd Muin, Senior Lecturer at Universiti Utara Malaysia
 
Pride Month Slides 2024 David Douglas School District
Pride Month Slides 2024 David Douglas School DistrictPride Month Slides 2024 David Douglas School District
Pride Month Slides 2024 David Douglas School District
David Douglas School District
 
clinical examination of hip joint (1).pdf
clinical examination of hip joint (1).pdfclinical examination of hip joint (1).pdf
clinical examination of hip joint (1).pdf
Priyankaranawat4
 
Biological Screening of Herbal Drugs in detailed.
Biological Screening of Herbal Drugs in detailed.Biological Screening of Herbal Drugs in detailed.
Biological Screening of Herbal Drugs in detailed.
Ashokrao Mane college of Pharmacy Peth-Vadgaon
 
Advantages and Disadvantages of CMS from an SEO Perspective
Advantages and Disadvantages of CMS from an SEO PerspectiveAdvantages and Disadvantages of CMS from an SEO Perspective
Advantages and Disadvantages of CMS from an SEO Perspective
Krisztián Száraz
 
kitab khulasah nurul yaqin jilid 1 - 2.pptx
kitab khulasah nurul yaqin jilid 1 - 2.pptxkitab khulasah nurul yaqin jilid 1 - 2.pptx
kitab khulasah nurul yaqin jilid 1 - 2.pptx
datarid22
 
Digital Artifact 1 - 10VCD Environments Unit
Digital Artifact 1 - 10VCD Environments UnitDigital Artifact 1 - 10VCD Environments Unit
Digital Artifact 1 - 10VCD Environments Unit
chanes7
 

Recently uploaded (20)

Best Digital Marketing Institute In NOIDA
Best Digital Marketing Institute In NOIDABest Digital Marketing Institute In NOIDA
Best Digital Marketing Institute In NOIDA
 
Aficamten in HCM (SEQUOIA HCM TRIAL 2024)
Aficamten in HCM (SEQUOIA HCM TRIAL 2024)Aficamten in HCM (SEQUOIA HCM TRIAL 2024)
Aficamten in HCM (SEQUOIA HCM TRIAL 2024)
 
MATATAG CURRICULUM: ASSESSING THE READINESS OF ELEM. PUBLIC SCHOOL TEACHERS I...
MATATAG CURRICULUM: ASSESSING THE READINESS OF ELEM. PUBLIC SCHOOL TEACHERS I...MATATAG CURRICULUM: ASSESSING THE READINESS OF ELEM. PUBLIC SCHOOL TEACHERS I...
MATATAG CURRICULUM: ASSESSING THE READINESS OF ELEM. PUBLIC SCHOOL TEACHERS I...
 
Natural birth techniques - Mrs.Akanksha Trivedi Rama University
Natural birth techniques - Mrs.Akanksha Trivedi Rama UniversityNatural birth techniques - Mrs.Akanksha Trivedi Rama University
Natural birth techniques - Mrs.Akanksha Trivedi Rama University
 
CACJapan - GROUP Presentation 1- Wk 4.pdf
CACJapan - GROUP Presentation 1- Wk 4.pdfCACJapan - GROUP Presentation 1- Wk 4.pdf
CACJapan - GROUP Presentation 1- Wk 4.pdf
 
RPMS TEMPLATE FOR SCHOOL YEAR 2023-2024 FOR TEACHER 1 TO TEACHER 3
RPMS TEMPLATE FOR SCHOOL YEAR 2023-2024 FOR TEACHER 1 TO TEACHER 3RPMS TEMPLATE FOR SCHOOL YEAR 2023-2024 FOR TEACHER 1 TO TEACHER 3
RPMS TEMPLATE FOR SCHOOL YEAR 2023-2024 FOR TEACHER 1 TO TEACHER 3
 
Lapbook sobre os Regimes Totalitários.pdf
Lapbook sobre os Regimes Totalitários.pdfLapbook sobre os Regimes Totalitários.pdf
Lapbook sobre os Regimes Totalitários.pdf
 
Executive Directors Chat Leveraging AI for Diversity, Equity, and Inclusion
Executive Directors Chat  Leveraging AI for Diversity, Equity, and InclusionExecutive Directors Chat  Leveraging AI for Diversity, Equity, and Inclusion
Executive Directors Chat Leveraging AI for Diversity, Equity, and Inclusion
 
How to Build a Module in Odoo 17 Using the Scaffold Method
How to Build a Module in Odoo 17 Using the Scaffold MethodHow to Build a Module in Odoo 17 Using the Scaffold Method
How to Build a Module in Odoo 17 Using the Scaffold Method
 
PIMS Job Advertisement 2024.pdf Islamabad
PIMS Job Advertisement 2024.pdf IslamabadPIMS Job Advertisement 2024.pdf Islamabad
PIMS Job Advertisement 2024.pdf Islamabad
 
Fresher’s Quiz 2023 at GMC Nizamabad.pptx
Fresher’s Quiz 2023 at GMC Nizamabad.pptxFresher’s Quiz 2023 at GMC Nizamabad.pptx
Fresher’s Quiz 2023 at GMC Nizamabad.pptx
 
MERN Stack Developer Roadmap By ScholarHat PDF
MERN Stack Developer Roadmap By ScholarHat PDFMERN Stack Developer Roadmap By ScholarHat PDF
MERN Stack Developer Roadmap By ScholarHat PDF
 
Reflective and Evaluative Practice PowerPoint
Reflective and Evaluative Practice PowerPointReflective and Evaluative Practice PowerPoint
Reflective and Evaluative Practice PowerPoint
 
Chapter 4 - Islamic Financial Institutions in Malaysia.pptx
Chapter 4 - Islamic Financial Institutions in Malaysia.pptxChapter 4 - Islamic Financial Institutions in Malaysia.pptx
Chapter 4 - Islamic Financial Institutions in Malaysia.pptx
 
Pride Month Slides 2024 David Douglas School District
Pride Month Slides 2024 David Douglas School DistrictPride Month Slides 2024 David Douglas School District
Pride Month Slides 2024 David Douglas School District
 
clinical examination of hip joint (1).pdf
clinical examination of hip joint (1).pdfclinical examination of hip joint (1).pdf
clinical examination of hip joint (1).pdf
 
Biological Screening of Herbal Drugs in detailed.
Biological Screening of Herbal Drugs in detailed.Biological Screening of Herbal Drugs in detailed.
Biological Screening of Herbal Drugs in detailed.
 
Advantages and Disadvantages of CMS from an SEO Perspective
Advantages and Disadvantages of CMS from an SEO PerspectiveAdvantages and Disadvantages of CMS from an SEO Perspective
Advantages and Disadvantages of CMS from an SEO Perspective
 
kitab khulasah nurul yaqin jilid 1 - 2.pptx
kitab khulasah nurul yaqin jilid 1 - 2.pptxkitab khulasah nurul yaqin jilid 1 - 2.pptx
kitab khulasah nurul yaqin jilid 1 - 2.pptx
 
Digital Artifact 1 - 10VCD Environments Unit
Digital Artifact 1 - 10VCD Environments UnitDigital Artifact 1 - 10VCD Environments Unit
Digital Artifact 1 - 10VCD Environments Unit
 

Lecture 01_What is Satistics.pptx

  • 1. Introduction to Statistics Dr. Tamanna Islam Bangladesh Institute of Capital Market (BICM) 1
  • 2. What is Meant by Statistics? Statistics is the science of assembling, classifying, tabulating and analyzing data for the purpose of making generalizations and decisions. 2
  • 3. Who Uses Statistics? 3 Few fields or disciplines where statistical application is indispensable are given in the following Economics Social science Business Politics Psychology Computer science Medicine Genetics Epidemiology Environmental studies Geology Geography
  • 5. Types of Statistics • Descriptive Statistics: Methods of organizing, summarizing, and presenting data in an informative way. • Inferential statistics: The following concepts would be required for defining inferential statistics.  A population is a collection of all possible individuals, objects, or measurements of interest. A parameter is a summary measure that describes a characteristic of the population.  A sample is a representative portion or part of the population of interest. A statistic is a summary measure computed from a sample. 5
  • 7. Population vs. Sample 7 Population Sample Measure used to describe the population is called parameter Measure computed from sample data is called statistic
  • 8. Census vs. Survey 8 Population Sample In a census, data about all individual units are collected in the population. The term survey has been defined as a method of collecting detailed information relating to representative group.
  • 9. Descriptive Statistics •Collect data • e.g. Survey •Present data • e.g. Tables and graphs •Characterize data • e.g. Sample mean = 9 i X n  Types of Statistics
  • 10. Inferential Statistics • Estimation • making estimates about populations • Hypothesis testing • testing hypotheses to draw conclusions about populations 10 Drawing conclusions and/or making decisions concerning a population based on sample results.
  • 11. Variables Variable is a characteristics that varies from one person or thing to another. For example: Share category, price change of a stock. 11 Variables Qualitative Quantitative Discrete Continuous Classification of Variables
  • 12. Types of Variables 12 Qualitative Variable A non-numerically valued variable is called a qualitative variable or categorical variable. Example : Share category in capital market of Bangladesh are qualitative variables. Quantitative Variable A numerically valued variable is called a quantitative variable. Example: Number of share trade in DSE is a quantitative variables.
  • 13. Types of Variables (Cont’d) Quantitative variables can be classified as either discrete or continuous. • Discrete variables: can only assume certain values and there are usually “gaps” between values. For example, number of coupon payments for a corporate bond. • Continuous variables: can assume any value within a specific range. For example, the returns earned by an investor, cash dividends per share paid by a company . 13
  • 14. Data Information obtained by observing values of a variable is data. 14
  • 15. Data Qualitative Quantitative Discrete Continuous Classification of Data Examples:  Political Party  Share category in capital market of Bangladesh (Defined categories) Examples:  Stock price (Counted items) Examples:  the returns earned by an investor (Measured characteristics) 15
  • 16. Qualitative Data Data obtained by observing values of a qualitative variable. Example: Share category in capital market of Bangladesh as A, B, G, N, Z. The data received when you are told Individual’s type is qualitative data. Quantitative Data Data obtained by observing values of a quantitative variable. Example: Daily sales recorded in DSE will give quantitative data. 16
  • 17. Discrete Data: Data obtained by observing values of a discrete variable. Example: The number of buy and sell in DSE is recorded for 12 day. The resulting data set is │3 │0 │4 │3 │1 │0 │6 │2 │0 │0 │1 │2 Possible values for the number of buy and sell are 0,1,2,3, …; these are isolated points on the number line, so we have a sample consisting of discrete numerical data. 17
  • 18. Continuous Data: Data obtained by observing values of a continuous variable. Example: A sample of 20 investors return earned (hundred TK) is determined for each one. The resulting data set is: 29.8 27.6 28.3 28.7 27.9 29.9 30.1 28.0 28.7 27.9 28.5 29.5 27.2 26.9 28.4 27.9 28.0 30.0 29.1 26.4 Here we have a sample consisting of continuous data. 18
  • 19. Scales of Measurement • Measurement is a process of assigning numbers to some characteristics or variables or events according to scientific rules. • Arithmetic and statistical operations for summarizing and presenting data depend on the levels of measurement.  Example- Average height of Bangladeshi male, Proportion of smokers in a community. 19
  • 20. Scales of Measurement (Cont’d) Four scales of measurement:  Nominal scale  Ordinal scale  Interval scale  Ratio scale 20
  • 21. Scales of Measurement- Nominal (Cont’d) • Nominal scale: The measurement scale, in which numbers are assigned to the categories or variable values for identification only, is called a nominal scale. • For example- name of company’s. • Each value is a category and the values itself serves merely as a label on name for the category. • No assumption of ordering or distance between categories is made. 21
  • 22. • Categories are not of a particular order Table: Number of shares by the trading code of the company Trading code Number Percent RECKITTBEN 330 27.5 UNILEVERCL 251 20.92 MARICO 400 33.33 EASTRNLUB 110 9.17 BERGERPBL 20 1.67 RENATA 89 7.42 Total 1200 100 22 Scales of Measurement- Nominal (Cont’d)
  • 23. Scales of Measurement- Ordinal (Cont’d) Ordinal scale: The measurement scale, in which numbers are assigned to the categories or variable values for identification as well as ranking. Example: Rank of the managers of mutual funds based on their performance. 23
  • 24. Scales of Measurement- Ordinal (Cont’d) Table: Selected managers by their performance Performance status Frequency Best 40 2nd best 90 3rd best 110 4th best 35 5th best 25 Total 300 24
  • 25. Scales of Measurement- Interval (Cont’d) • Interval scale: In this measurement scale, numbers are assigned to the variable values in such a way that the level of measurement is broken down on a scale of equal units and the zero value on the scale is not absolutely zero. • For example- The variable temperature can have values 0˚c, 10˚ c, 20˚c etc. Here the value 0˚c does not mean the absence of temperature. Thus, the value zero in interval scale is not absolutely zero. 25
  • 26. Scales of Measurement- Ratio (Cont’d) Ratio scale: The measurement scale, in which numbers are assigned to the variable values in such a way that the level of measurement is broken down on a scale of equal units and the zero value on the scale is absolutely zero. Example: Rate of return on the investment. 26
  • 27. 27 Exercise 1. Credit ratings for bond issues 2. Cash dividends per share 3. Hedge fund classification types 4. Bond maturity in years