Beyond the EU: DORA and NIS 2 Directive's Global Impact
Land use
1. DEBARSHI DEBNATH(+919475480808)
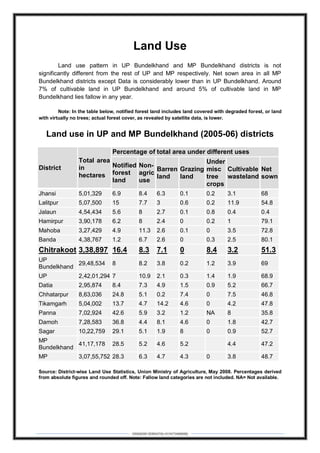
Land Use
Land use pattern in UP Bundelkhand and MP Bundelkhand districts is not
significantly different from the rest of UP and MP respectively. Net sown area in all MP
Bundelkhand districts except Data is considerably lower than in UP Bundelkhand. Around
7% of cultivable land in UP Bundelkhand and around 5% of cultivable land in MP
Bundelkhand lies fallow in any year.
Note: In the table below, notified forest land includes land covered with degraded forest, or land
with virtually no trees; actual forest cover, as revealed by satellite data, is lower.
Land use in UP and MP Bundelkhand (2005-06) districts
District
Total area
in
hectares
Percentage of total area under different uses
Notified
forest
land
Non-
agric
use
Barren
land
Grazing
land
Under
misc
tree
crops
Cultivable
wasteland
Net
sown
Jhansi 5,01,329 6.9 8.4 6.3 0.1 0.2 3.1 68
Lalitpur 5,07,500 15 7.7 3 0.6 0.2 11.9 54.8
Jalaun 4,54,434 5.6 8 2.7 0.1 0.8 0.4 0.4
Hamirpur 3,90,178 6.2 8 2.4 0 0.2 1 79.1
Mahoba 3,27,429 4.9 11.3 2.6 0.1 0 3.5 72.8
Banda 4,38,767 1.2 6.7 2.6 0 0.3 2.5 80.1
Chitrakoot 3,38,897 16.4 8.3 7.1 0 8.4 3.2 51.3
UP
Bundelkhand
29,48,534 8 8.2 3.8 0.2 1.2 3.9 69
UP 2,42,01,294 7 10.9 2.1 0.3 1.4 1.9 68.9
Datia 2,95,874 8.4 7.3 4.9 1.5 0.9 5.2 66.7
Chhatarpur 8,63,036 24.8 5.1 0.2 7.4 0 7.5 46.8
Tikamgarh 5,04,002 13.7 4.7 14.2 4.6 0 4.2 47.8
Panna 7,02,924 42.6 5.9 3.2 1.2 NA 8 35.8
Damoh 7,28,583 36.8 4.4 8.1 4.6 0 1.8 42.7
Sagar 10,22,759 29.1 5.1 1.9 8 0 0.9 52.7
MP
Bundelkhand
41,17,178 28.5 5.2 4.6 5.2 4.4 47.2
MP 3,07,55,752 28.3 6.3 4.7 4.3 0 3.8 48.7
Source: District-wise Land Use Statistics, Union Ministry of Agriculture, May 2008. Percentages derived
from absolute figures and rounded off. Note: Fallow land categories are not included. NA= Not available.
2. DEBARSHI DEBNATH(+919475480808)
Land use in UP and MP Bundelkhand (2005-06) Districts
6.9
15
5.6
6.2
4.9
1.2
16.4
8
7
8.4
24.8
13.7
42.6
36.8
29.1
28.5
28.3
6.3
3
2.7
2.4
2.6
2.6
7.1
3.8
0
4.9
0.2
14.2
3.2
8.1
1.9
4.6
4.7
68
54.8
0.4
79.1
72.8
80.1
51.3
69
68.9
66.7
46.8
47.8
35.8
42.7
52.7
47.2
48.7
Jhansi
Lalitpur
Jalaun
Hamirpur
Mahoba
Banda
Chitrakoot
UP Bundelkhand
UP
Datia
Chhatarpur
Tikamgarh
Panna
Damoh
Sagar
MP Bundelkhand
MP
0 10 20 30 40 50 60 70 80 90
NET SOWN
CULTIVABLE
WASTELAND
UNDER MISC
TREE CROPS
GRAZING
LAND
BARREN
LAND
NON-AGRIC
USE
NOTIFIED
FOREST
LAND