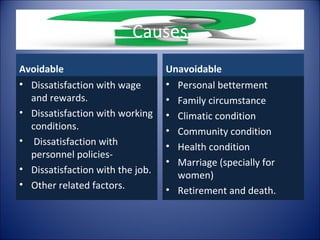
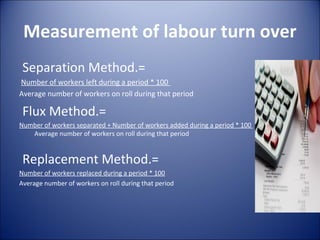
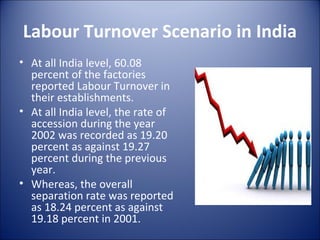
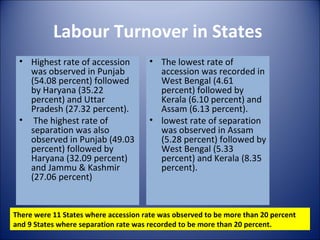
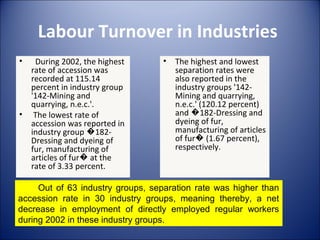
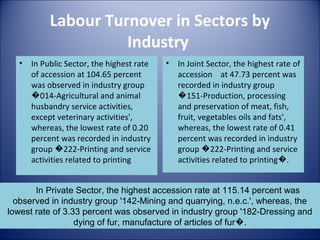
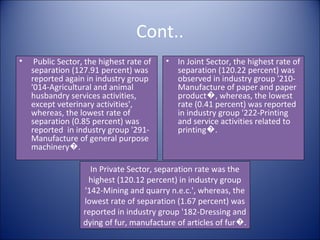
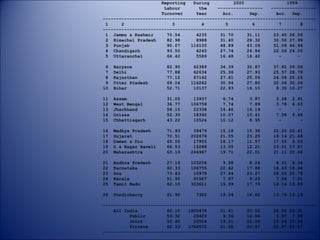
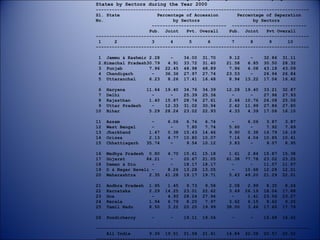
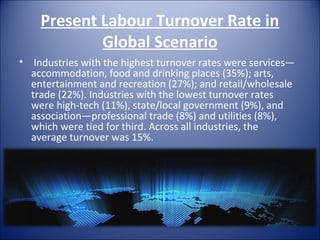
Labour Turnover – A HR
      Challenge
         Name Souvick Mandal
         Roll- 95/HRO/111011
  Registration No- 120-1121-0192-11
Guided By- Prof. Amitabh Bhattachariya
What is it?
• Labour turnover is the movement of people out of the
  organisation. It is usually convenient to measure it by
  recording movements out of the firms on the
  assumption that a leave is eventually replaced by a
  new employee. The term separation is used to denote
  an employee who leaves for any reasons; labour
  turnover is the rate of change in number of employees
  of a concern during a definite period.
Causes
Avoidable                         Unavoidable
• Dissatisfaction with wage       • Personal betterment
  and rewards.                    • Family circumstance
• Dissatisfaction with working    • Climatic condition
  conditions.                     • Community condition
• Dissatisfaction with            • Health condition
  personnel policies-
                                  • Marriage (specially for
• Dissatisfaction with the job.
                                    women)
• Other related factors.          • Retirement and death.
Effects
• Interruption in the continuous process of production with
  result that overall production is reduced.
• New workers take time to become efficient. Hence lower
  efficiency workers increase the cost of production.
• Selection and training cost of new workers recruited to
  replace the workers who have left increase the cost of
  production.
• More scrap, rejects and defectives which increases the cost
  of productions.
• cause more depreciation of tools and machinery.
• Accident may also happen very often and hamper the
  production process & organizational harmony.
Measurement of labour turn over
 Separation Method.=
Number of workers left during a period * 100
Average number of workers on roll during that period

 Flux Method.=
Number of workers separated + Number of workers added during a period * 100
   Average number of workers on roll during that period


 Replacement Method.=
Number of workers replaced during a period * 100
Average number of workers on roll during that period
Cost of labour turnover
• Inefficiency of new worker
• Employment department
• Training and induction
• Cost of tools and machine
  breakage
• Accident frequency and
  severity
• Cost of scrap and defective
  work
Labour Turnover Scenario in India
• At all India level, 60.08
  percent of the factories
  reported Labour Turnover in
  their establishments.
• At all India level, the rate of
  accession during the year
  2002 was recorded as 19.20
  percent as against 19.27
  percent during the previous
  year.
• Whereas, the overall
  separation rate was reported
  as 18.24 percent as against
  19.18 percent in 2001.
Labour Turnover in States
 • Highest rate of accession           • The lowest rate of
   was observed in Punjab                accession was recorded in
   (54.08 percent) followed              West Bengal (4.61
   by Haryana (35.22                     percent) followed by
   percent) and Uttar                    Kerala (6.10 percent) and
   Pradesh (27.32 percent).              Assam (6.13 percent).
 • The highest rate of                 • lowest rate of separation
   separation was also                   was observed in Assam
   observed in Punjab (49.03             (5.28 percent) followed by
   percent) followed by                  West Bengal (5.33
   Haryana (32.09 percent)               percent) and Kerala (8.35
   and Jammu & Kashmir                   percent).
   (27.06 percent)


There were 11 States where accession rate was observed to be more than 20 percent
and 9 States where separation rate was recorded to be more than 20 percent.
Labour Turnover in Industries
•    During 2002, the highest      •   The highest and lowest
    rate of accession was              separation rates were
    recorded at 115.14                 also reported in the
    percent in industry group          industry groups '142-
    '142-Mining and                    Mining and quarrying,
    quarrying, n.e.c.'.                n.e.c.' (120.12 percent)
•    The lowest rate of                and �182-Dressing and
    accession was reported in          dyeing of fur,
    industry group �182-               manufacturing of articles
    Dressing and dyeing of             of fur� (1.67 percent),
    fur, manufacturing of              respectively.
    articles of fur� at the
    rate of 3.33 percent.

     Out of 63 industry groups, separation rate was higher than
accession rate in 30 industry groups, meaning thereby, a net
decrease in employment of directly employed regular workers
during 2002 in these industry groups.
Labour Turnover in Sectors by States
• At all India level, among          •    All India level among
  sectors, the rate of                   sectors, the highest rate of
  accession was highest at               separation was reported in
  19.43 percent in Private               Private Sector (18.36
  Sector, followed by 14.56              percent), followed by Joint
  percent in Joint Sector and            Sector (17.35 percent) and
  merely 7.62 percent in                 Public Sector (9.57
  Public Sector.                         percent).

   It is observed that at all India level both Public Sector and
   Joint Sector witnessed a decrease in employment of
   directly employed workers by 1.95 percent and 2.79
   percent, respectively, during the year, whereas, in Private
   Sector a marginal increase in employment of such
   workers of 1.07 percent was recorded
Cont..
• In Public Sector, the highest    • In Joint sector, the highest
  rate of accession at 56.40         rate of accession at 59.66
  percent was observed in            percent was observed in
  Rajasthan, whereas, the            Himachal Pradesh, whereas,
  lowest accession rate of           the lowest accession rate of
  0.82 percent was observed          0.99 percent was recorded
  in Kerala.                         in Orissa.


              In Private Sector, the highest and lowest
                 rates of accession were reported in
              Punjab (54.78 percent) and West Bengal
                     (4.26 percent), respectively.
Cont..
• The highest and lowest         • In Joint Sector, the
  separation rates, in Public      highest rate of separation
  Sector, were observed in         was also recorded in
  Daman & Diu (44.44               Punjab (53.32 percent),
  percent) and Chattisgarh         whereas, the lowest rate
  (0.93 percent),                  was reported in Goa (0.66
  respectively.                    percent).


     In Private Sector, the highest and lowest separation
rates were reported in Punjab (49.37 percent) and Assam
                (5.07 percent), respectively.
Labour Turnover in Sectors by
                     Industry
  •   In Public Sector, the highest rate   •   In Joint Sector, the highest rate of
      of accession at 104.65 percent           accession at 47.73 percent was
      was observed in industry group           recorded in industry group
      �014-Agricultural and animal             �151-Production, processing
      husbandry service activities,            and preservation of meat, fish,
      except veterinary activities',           fruit, vegetables oils and fats',
      whereas, the lowest rate of 0.20         whereas, the lowest rate of 0.41
      percent was recorded in industry         percent was recorded in industry
      group �222-Printing and service          group �222-Printing and service
      activities related to printing           activities related to printing�.


       In Private Sector, the highest accession rate at 115.14 percent was
  observed in industry group '142-Mining and quarrying, n.e.c.', whereas, the
lowest rate of 3.33 percent was observed in industry group '182-Dressing and
                  dying of fur, manufacture of articles of fur�.
Cont..
•    Public Sector, the highest rate of   •   In Joint Sector, the highest rate of
    separation (127.91 percent) was           separation (120.22 percent) was
    reported again in industry group          observed in industry group '210-
    '014-Agricultural and animal              Manufacture of paper and paper
    husbandry services activities,            product�, whereas, the lowest
    except veterinary activities',            rate (0.41 percent) was reported
    whereas, the lowest rate of               in industry group '222-Printing
    separation (0.85 percent) was             and service activities related to
    reported in industry group '291-          printing�.
    Manufacture of general purpose
    machinery�.

                     In Private Sector, separation rate was the
                    highest (120.12 percent) in industry group
                   '142-Mining and quarry n.e.c.', whereas, the
                   lowest rate of separation (1.67 percent) was
                   reported in industry group '182-Dressing and
                   dying of fur, manufacture of articles of fur�.
Reporting   During          2000               1999
                       Labour       the    -----------------   -----------------
                      Turnover     Year      Acc.       Sep.     Acc. Sep.
--------------------------------------------------------------------------------
 1     2                  3          4        5          6        7         8
--------------------------------------------------------------------------------
 1 Jammu & Kashmir      70.54      4235     31.70      31.11    23.40 26.59
 2 Himachal Pradesh     82.98      8988     31.40      28.32    30.50 27.99
 3 Punjab               90.07    116100     48.89      43.09    51.09 46.94
 4 Chandigarh           93.50      4245     27.74      26.84    22.06 24.00
 5 Uttaranchal          66.42      5589     16.48      16.42      -       -

 6   Haryana            82.90     62389     34.39    32.87     37.82   29.56
 7   Delhi              77.88     62634     25.36    27.93     25.57   28.79
 8   Rajasthan          77.12     67142     27.61    25.06     24.08   25.26
 9   Uttar Pradesh      69.04    116262     30.94    27.80     32.06   32.26
10   Bihar              52.71     10137     22.93    16.10      9.30   10.27

11   Assam              31.05     13937      6.74     3.87      3.28    2.91
12   West Bengal        36.77    106758      7.74     7.89      3.78    4.63
13   Jharkhand          58.15     22338     14.46    16.19       -        -
14   Orissa             52.30     18392     10.07    10.41      7.58    9.46
15   Chhattisgarh       43.22     10524     10.12     8.95       -          -

16   Madhya Pradesh     71.93     39479     15.18    15.38     22.20   22.41
17   Gujarat            70.51    202678     21.05    23.25     19.14   21.48
18   Daman & Diu        65.55     17955     18.17    11.57     17.55    9.53
19   D & Nagar Haveli   66.53     15288     13.05    12.21     23.01   17.87
20   Maharashtra        63.19    246967     19.71    22.01     21.11   22.66

21   Andhra Pradesh     27.19    103256      9.58     8.24      8.21 8.34
22   Karnataka          62.33    106755     22.62    17.88     18.63 19.64
23   Goa                73.43     10978     27.94    23.27     28.02 21.79
24   Kerala             51.90     91527      7.97     9.25      7.54 7.01
25   Tamil Nadu         62.10    333611     19.99    17.79     18.14 15.89

26   Pondicherry        61.90      7322     19.04    16.62     13.74 13.19

--------------------------------------------------------------------------------
    All India           62.10   1805478     21.41     20.52     20.52 20.31
          Public        53.32     20403      9.36     14.84      5.97 7.99
          Joint         55.40     20504     19.51     22.08     15.04 12.59
          Private       62.23   1764572     21.58     20.57     20.87 20.67
--------------------------------------------------------------------------------
States by Sectors during the Year 2000
--------------------------------------------------------------------------------
Sl. State              Percentage of Accession       Percentage of Separation
No.                          by Sectors                    by Sectors
                     ---------------------------- ----------------------------
                    Pub. Joint    Pvt. Overall    Pub. Joint    Pvt Overall
--------------------------------------------------------------------------------
 1     2             3      4      5      6        7      8      9      10
--------------------------------------------------------------------------------

 1 Jammu & Kashmir 2.28         -     34.00   31.70    9.12     -     32.86   31.11
 2.Himachal Pradesh30.79       4.91   33.72   31.40   21.58    6.85   30.50   28.32
 3 Punjab           7.96      22.45   48.98   48.89    7.96    4.08   43.18   43.09
 4 Chandigarh        -        36.36   27.97   27.74   23.53     -     26.94   26.84
 5 Uttaranchal      6.23       8.26   17.41   16.48    8.94   13.22   17.04   16.42

 6   Haryana          11.64   19.40   34.76   34.39   12.28   19.40   33.21   32.87
 7   Delhi              -       -     25.39   25.36     -       -     27.96   27.93
 8   Rajasthan         1.40   15.87   28.74   27.61    2.48   10.76   26.08   25.06
 9   Uttar Pradesh      -     12.33   31.02   30.94    2.42   11.99   27.86   27.80
10   Bihar             5.29   28.24   23.02   22.93    4.33    4.39   17.06   16.10

11   Assam              -      6.06    6.76    6.74    -       6.06    3.87    3.87
12   West Bengal        -       -      7.80    7.74   5.60      -      7.92    7.89
13   Jharkhand         1.47    0.38   15.43   14.46   9.90     0.38   16.79   16.19
14   Orissa            2.13    4.77   10.80   10.07   7.16     4.04   10.85   10.41
15   Chhattisgarh     35.74     -      9.54   10.12   3.83      -      9.07    8.95

16   Madhya Pradesh 0.80       4.70   15.61   15.18    1.61    2.84   15.87   15.38
17   Gujarat        84.21       -     20.67   21.05   61.38   77.78   23.02   23.25
18   Daman & Diu      -         -     18.17   18.17     -       -     11.57   11.57
19   D & Nagar Haveli -        8.26   13.28   13.05     -     10.68   12.28   12.21
20   Maharashtra     2.35     41.28   19.17   19.71    5.43   49.20   21.29   22.01

21   Andhra Pradesh   1.95     1.45    9.73    9.58    2.08    2.99    8.35    8.24
22   Karnataka        2.29    14.25   23.01   22.62    3.49   26.19   18.04   17.88
23   Goa               -       4.93   28.24   27.94     -      1.41   23.56   23.27
24   Kerala           1.94     6.79    8.25    7.97    3.62    6.15    9.62    9.25
25   Tamil Nadu       8.50     3.22   20.20   19.99   38.00    3.46   17.60   17.79

26   Pondicherry       -        -     19.11   19.04    -        -     16.68   16.62

--------------------------------------------------------------------------------
    All India       9.36 19.51 21.58 21.41       14.84 22.08 20.57 20.52
Present Labour Turnover Rate in
            Global Scenario
• Industries with the highest turnover rates were services—
  accommodation, food and drinking places (35%); arts,
  entertainment and recreation (27%); and retail/wholesale
  trade (22%). Industries with the lowest turnover rates
  were high-tech (11%), state/local government (9%), and
  association—professional trade (8%) and utilities (8%),
  which were tied for third. Across all industries, the
  average turnover was 15%.
EXAMPLE OF LABOUR TURNOVER IN
INDIAN IT INDUSTRY (CHENNAI CITY)
THE INDIAN IT INDUSTRY
• The Information Technology (IT) sector in India holds the
  distinction of advancing the country into the new-age
  economy. The growth momentum attained by the overall
  economy since the late 1990s to a great extent can be
  owed to the IT sector, well supported by a liberalized policy
  regime with reduction in telecommunication cost and
  import duties on hardware and software. Perceptible is the
  transformation since liberalization – India today is the
  world leader in information technology and business
  outsourcing. Correspondingly, the industry’s contribution
  to India’s GDP has grown significantly from 1.2% in 1999-
  2000 to around 4.8% in FY06, and has been estimated to
  cross 5% in FY07. The sector has been growing at an annual
  rate of 28% per annum since FY01.
Findings From the study
•    The demographic factors in the       •   The comparison between the
    study reveals that the major              working condition of employees’
    respondents are male 58%, the             in the organization and the work
    maximum respondents belong to             load of employees reveals that
    the age group 20-30 years i.e.,           the result of the t test is not
    35%, and the majority of                  significant to each other. Hence
    respondents belongs to executive          the work load and working
    level i.e., 61% and the majority of       condition does not coincide.
    respondents experience is below
    5 years and the monthly income
    earned by majority of
    respondents belongs to above
    10,000 i.e., 33% and the majority
    of the respondents qualification
    belongs to undergraduate i.e.,
    34% .
Cont..
• The comparison between the working
  environment and the health & safety measures
  provided to the employees reveals that the result
  of the t test is not significant to each other.
  Hence the work environment has no significance
  over safety measures.
• The relationship between training program
  provided to employees and the reasons for
  leaving the organization by employees analyzed
  using f test reveals that both has an equal
  variation.
Cont..
• The relationship between the co-workers
  relationship and top management personnel
  was analyzed using f test reveals that both
  had an equal variation. This states that both
  the samples are equal variant among
  themselves.
HR Solution on Labour turnover
• Pay problem            • Adequate statistical
• Employee leaving to      control
  further their career   • Joint control
• Employee leaving due   • Use of exit interview
  to conflict            • Workers participation
• The induction crisis
Business Story
• Kwality Wall’s (Labour Turnover-WPM-
  Innovation)
Closing case 1
Telcon (Tata- Hitachi Joint venture at Kharagpur)
Closing case 2
Pay revision and Turnover in Indian Army


          Old Pay Scale of Indian Army
The armed forces, which are facing a shortage of middle level
personnel would be better placed to hire capable junior officers and
other staff.
Bibliography
 Books-
• 1. Cost and Management Accounting, Publisher- Taxmann, Author-Ravi.M.Kishore.
• 2. Cost Accounting, Publisher- Kalyani New Delhi.

 Research Papers and Articles-
• 1. Employee turnover in “IT” Industry with special reference to Chennai City-An
  Exploratory Study, Mrs. E. DEEPA; Mrs. M. STELLA of Vivekanandha College of
  Engineering for Women, Elayapalayam,Tiruchengode, Tamilnadu.
• 2. Article was prepared by Eliza Jacobs, strategic research analyst at SHRM.
• 3. Annual Survey of Industries, 2002-03 Vol. II Report on Absenteeism, Labour
  Turnover, Employment & Labour Cost in Sample Sector, CHAPTER-III.

•   Websites-
•   1. http://labourbureau.nic.in/asi2K2-3%20S%20ChapterIII.htm
•   2. - www.shrm.org
Labour turnover – a hr challenge

Labour turnover – a hr challenge

  • 1.
    Labour Turnover –A HR Challenge Name Souvick Mandal Roll- 95/HRO/111011 Registration No- 120-1121-0192-11 Guided By- Prof. Amitabh Bhattachariya
  • 2.
    What is it? •Labour turnover is the movement of people out of the organisation. It is usually convenient to measure it by recording movements out of the firms on the assumption that a leave is eventually replaced by a new employee. The term separation is used to denote an employee who leaves for any reasons; labour turnover is the rate of change in number of employees of a concern during a definite period.
  • 3.
    Causes Avoidable Unavoidable • Dissatisfaction with wage • Personal betterment and rewards. • Family circumstance • Dissatisfaction with working • Climatic condition conditions. • Community condition • Dissatisfaction with • Health condition personnel policies- • Marriage (specially for • Dissatisfaction with the job. women) • Other related factors. • Retirement and death.
  • 4.
    Effects • Interruption inthe continuous process of production with result that overall production is reduced. • New workers take time to become efficient. Hence lower efficiency workers increase the cost of production. • Selection and training cost of new workers recruited to replace the workers who have left increase the cost of production. • More scrap, rejects and defectives which increases the cost of productions. • cause more depreciation of tools and machinery. • Accident may also happen very often and hamper the production process & organizational harmony.
  • 5.
    Measurement of labourturn over Separation Method.= Number of workers left during a period * 100 Average number of workers on roll during that period Flux Method.= Number of workers separated + Number of workers added during a period * 100 Average number of workers on roll during that period Replacement Method.= Number of workers replaced during a period * 100 Average number of workers on roll during that period
  • 6.
    Cost of labourturnover • Inefficiency of new worker • Employment department • Training and induction • Cost of tools and machine breakage • Accident frequency and severity • Cost of scrap and defective work
  • 7.
    Labour Turnover Scenarioin India • At all India level, 60.08 percent of the factories reported Labour Turnover in their establishments. • At all India level, the rate of accession during the year 2002 was recorded as 19.20 percent as against 19.27 percent during the previous year. • Whereas, the overall separation rate was reported as 18.24 percent as against 19.18 percent in 2001.
  • 8.
    Labour Turnover inStates • Highest rate of accession • The lowest rate of was observed in Punjab accession was recorded in (54.08 percent) followed West Bengal (4.61 by Haryana (35.22 percent) followed by percent) and Uttar Kerala (6.10 percent) and Pradesh (27.32 percent). Assam (6.13 percent). • The highest rate of • lowest rate of separation separation was also was observed in Assam observed in Punjab (49.03 (5.28 percent) followed by percent) followed by West Bengal (5.33 Haryana (32.09 percent) percent) and Kerala (8.35 and Jammu & Kashmir percent). (27.06 percent) There were 11 States where accession rate was observed to be more than 20 percent and 9 States where separation rate was recorded to be more than 20 percent.
  • 9.
    Labour Turnover inIndustries • During 2002, the highest • The highest and lowest rate of accession was separation rates were recorded at 115.14 also reported in the percent in industry group industry groups '142- '142-Mining and Mining and quarrying, quarrying, n.e.c.'. n.e.c.' (120.12 percent) • The lowest rate of and �182-Dressing and accession was reported in dyeing of fur, industry group �182- manufacturing of articles Dressing and dyeing of of fur� (1.67 percent), fur, manufacturing of respectively. articles of fur� at the rate of 3.33 percent. Out of 63 industry groups, separation rate was higher than accession rate in 30 industry groups, meaning thereby, a net decrease in employment of directly employed regular workers during 2002 in these industry groups.
  • 10.
    Labour Turnover inSectors by States • At all India level, among • All India level among sectors, the rate of sectors, the highest rate of accession was highest at separation was reported in 19.43 percent in Private Private Sector (18.36 Sector, followed by 14.56 percent), followed by Joint percent in Joint Sector and Sector (17.35 percent) and merely 7.62 percent in Public Sector (9.57 Public Sector. percent). It is observed that at all India level both Public Sector and Joint Sector witnessed a decrease in employment of directly employed workers by 1.95 percent and 2.79 percent, respectively, during the year, whereas, in Private Sector a marginal increase in employment of such workers of 1.07 percent was recorded
  • 11.
    Cont.. • In PublicSector, the highest • In Joint sector, the highest rate of accession at 56.40 rate of accession at 59.66 percent was observed in percent was observed in Rajasthan, whereas, the Himachal Pradesh, whereas, lowest accession rate of the lowest accession rate of 0.82 percent was observed 0.99 percent was recorded in Kerala. in Orissa. In Private Sector, the highest and lowest rates of accession were reported in Punjab (54.78 percent) and West Bengal (4.26 percent), respectively.
  • 12.
    Cont.. • The highestand lowest • In Joint Sector, the separation rates, in Public highest rate of separation Sector, were observed in was also recorded in Daman & Diu (44.44 Punjab (53.32 percent), percent) and Chattisgarh whereas, the lowest rate (0.93 percent), was reported in Goa (0.66 respectively. percent). In Private Sector, the highest and lowest separation rates were reported in Punjab (49.37 percent) and Assam (5.07 percent), respectively.
  • 13.
    Labour Turnover inSectors by Industry • In Public Sector, the highest rate • In Joint Sector, the highest rate of of accession at 104.65 percent accession at 47.73 percent was was observed in industry group recorded in industry group �014-Agricultural and animal �151-Production, processing husbandry service activities, and preservation of meat, fish, except veterinary activities', fruit, vegetables oils and fats', whereas, the lowest rate of 0.20 whereas, the lowest rate of 0.41 percent was recorded in industry percent was recorded in industry group �222-Printing and service group �222-Printing and service activities related to printing activities related to printing�. In Private Sector, the highest accession rate at 115.14 percent was observed in industry group '142-Mining and quarrying, n.e.c.', whereas, the lowest rate of 3.33 percent was observed in industry group '182-Dressing and dying of fur, manufacture of articles of fur�.
  • 14.
    Cont.. • Public Sector, the highest rate of • In Joint Sector, the highest rate of separation (127.91 percent) was separation (120.22 percent) was reported again in industry group observed in industry group '210- '014-Agricultural and animal Manufacture of paper and paper husbandry services activities, product�, whereas, the lowest except veterinary activities', rate (0.41 percent) was reported whereas, the lowest rate of in industry group '222-Printing separation (0.85 percent) was and service activities related to reported in industry group '291- printing�. Manufacture of general purpose machinery�. In Private Sector, separation rate was the highest (120.12 percent) in industry group '142-Mining and quarry n.e.c.', whereas, the lowest rate of separation (1.67 percent) was reported in industry group '182-Dressing and dying of fur, manufacture of articles of fur�.
  • 15.
    Reporting During 2000 1999 Labour the ----------------- ----------------- Turnover Year Acc. Sep. Acc. Sep. -------------------------------------------------------------------------------- 1 2 3 4 5 6 7 8 -------------------------------------------------------------------------------- 1 Jammu & Kashmir 70.54 4235 31.70 31.11 23.40 26.59 2 Himachal Pradesh 82.98 8988 31.40 28.32 30.50 27.99 3 Punjab 90.07 116100 48.89 43.09 51.09 46.94 4 Chandigarh 93.50 4245 27.74 26.84 22.06 24.00 5 Uttaranchal 66.42 5589 16.48 16.42 - - 6 Haryana 82.90 62389 34.39 32.87 37.82 29.56 7 Delhi 77.88 62634 25.36 27.93 25.57 28.79 8 Rajasthan 77.12 67142 27.61 25.06 24.08 25.26 9 Uttar Pradesh 69.04 116262 30.94 27.80 32.06 32.26 10 Bihar 52.71 10137 22.93 16.10 9.30 10.27 11 Assam 31.05 13937 6.74 3.87 3.28 2.91 12 West Bengal 36.77 106758 7.74 7.89 3.78 4.63 13 Jharkhand 58.15 22338 14.46 16.19 - - 14 Orissa 52.30 18392 10.07 10.41 7.58 9.46 15 Chhattisgarh 43.22 10524 10.12 8.95 - - 16 Madhya Pradesh 71.93 39479 15.18 15.38 22.20 22.41 17 Gujarat 70.51 202678 21.05 23.25 19.14 21.48 18 Daman & Diu 65.55 17955 18.17 11.57 17.55 9.53 19 D & Nagar Haveli 66.53 15288 13.05 12.21 23.01 17.87 20 Maharashtra 63.19 246967 19.71 22.01 21.11 22.66 21 Andhra Pradesh 27.19 103256 9.58 8.24 8.21 8.34 22 Karnataka 62.33 106755 22.62 17.88 18.63 19.64 23 Goa 73.43 10978 27.94 23.27 28.02 21.79 24 Kerala 51.90 91527 7.97 9.25 7.54 7.01 25 Tamil Nadu 62.10 333611 19.99 17.79 18.14 15.89 26 Pondicherry 61.90 7322 19.04 16.62 13.74 13.19 -------------------------------------------------------------------------------- All India 62.10 1805478 21.41 20.52 20.52 20.31 Public 53.32 20403 9.36 14.84 5.97 7.99 Joint 55.40 20504 19.51 22.08 15.04 12.59 Private 62.23 1764572 21.58 20.57 20.87 20.67 --------------------------------------------------------------------------------
  • 16.
    States by Sectorsduring the Year 2000 -------------------------------------------------------------------------------- Sl. State Percentage of Accession Percentage of Separation No. by Sectors by Sectors ---------------------------- ---------------------------- Pub. Joint Pvt. Overall Pub. Joint Pvt Overall -------------------------------------------------------------------------------- 1 2 3 4 5 6 7 8 9 10 -------------------------------------------------------------------------------- 1 Jammu & Kashmir 2.28 - 34.00 31.70 9.12 - 32.86 31.11 2.Himachal Pradesh30.79 4.91 33.72 31.40 21.58 6.85 30.50 28.32 3 Punjab 7.96 22.45 48.98 48.89 7.96 4.08 43.18 43.09 4 Chandigarh - 36.36 27.97 27.74 23.53 - 26.94 26.84 5 Uttaranchal 6.23 8.26 17.41 16.48 8.94 13.22 17.04 16.42 6 Haryana 11.64 19.40 34.76 34.39 12.28 19.40 33.21 32.87 7 Delhi - - 25.39 25.36 - - 27.96 27.93 8 Rajasthan 1.40 15.87 28.74 27.61 2.48 10.76 26.08 25.06 9 Uttar Pradesh - 12.33 31.02 30.94 2.42 11.99 27.86 27.80 10 Bihar 5.29 28.24 23.02 22.93 4.33 4.39 17.06 16.10 11 Assam - 6.06 6.76 6.74 - 6.06 3.87 3.87 12 West Bengal - - 7.80 7.74 5.60 - 7.92 7.89 13 Jharkhand 1.47 0.38 15.43 14.46 9.90 0.38 16.79 16.19 14 Orissa 2.13 4.77 10.80 10.07 7.16 4.04 10.85 10.41 15 Chhattisgarh 35.74 - 9.54 10.12 3.83 - 9.07 8.95 16 Madhya Pradesh 0.80 4.70 15.61 15.18 1.61 2.84 15.87 15.38 17 Gujarat 84.21 - 20.67 21.05 61.38 77.78 23.02 23.25 18 Daman & Diu - - 18.17 18.17 - - 11.57 11.57 19 D & Nagar Haveli - 8.26 13.28 13.05 - 10.68 12.28 12.21 20 Maharashtra 2.35 41.28 19.17 19.71 5.43 49.20 21.29 22.01 21 Andhra Pradesh 1.95 1.45 9.73 9.58 2.08 2.99 8.35 8.24 22 Karnataka 2.29 14.25 23.01 22.62 3.49 26.19 18.04 17.88 23 Goa - 4.93 28.24 27.94 - 1.41 23.56 23.27 24 Kerala 1.94 6.79 8.25 7.97 3.62 6.15 9.62 9.25 25 Tamil Nadu 8.50 3.22 20.20 19.99 38.00 3.46 17.60 17.79 26 Pondicherry - - 19.11 19.04 - - 16.68 16.62 -------------------------------------------------------------------------------- All India 9.36 19.51 21.58 21.41 14.84 22.08 20.57 20.52
  • 17.
    Present Labour TurnoverRate in Global Scenario • Industries with the highest turnover rates were services— accommodation, food and drinking places (35%); arts, entertainment and recreation (27%); and retail/wholesale trade (22%). Industries with the lowest turnover rates were high-tech (11%), state/local government (9%), and association—professional trade (8%) and utilities (8%), which were tied for third. Across all industries, the average turnover was 15%.
  • 18.
    EXAMPLE OF LABOURTURNOVER IN INDIAN IT INDUSTRY (CHENNAI CITY)
  • 19.
    THE INDIAN ITINDUSTRY • The Information Technology (IT) sector in India holds the distinction of advancing the country into the new-age economy. The growth momentum attained by the overall economy since the late 1990s to a great extent can be owed to the IT sector, well supported by a liberalized policy regime with reduction in telecommunication cost and import duties on hardware and software. Perceptible is the transformation since liberalization – India today is the world leader in information technology and business outsourcing. Correspondingly, the industry’s contribution to India’s GDP has grown significantly from 1.2% in 1999- 2000 to around 4.8% in FY06, and has been estimated to cross 5% in FY07. The sector has been growing at an annual rate of 28% per annum since FY01.
  • 20.
    Findings From thestudy • The demographic factors in the • The comparison between the study reveals that the major working condition of employees’ respondents are male 58%, the in the organization and the work maximum respondents belong to load of employees reveals that the age group 20-30 years i.e., the result of the t test is not 35%, and the majority of significant to each other. Hence respondents belongs to executive the work load and working level i.e., 61% and the majority of condition does not coincide. respondents experience is below 5 years and the monthly income earned by majority of respondents belongs to above 10,000 i.e., 33% and the majority of the respondents qualification belongs to undergraduate i.e., 34% .
  • 21.
    Cont.. • The comparisonbetween the working environment and the health & safety measures provided to the employees reveals that the result of the t test is not significant to each other. Hence the work environment has no significance over safety measures. • The relationship between training program provided to employees and the reasons for leaving the organization by employees analyzed using f test reveals that both has an equal variation.
  • 22.
    Cont.. • The relationshipbetween the co-workers relationship and top management personnel was analyzed using f test reveals that both had an equal variation. This states that both the samples are equal variant among themselves.
  • 23.
    HR Solution onLabour turnover • Pay problem • Adequate statistical • Employee leaving to control further their career • Joint control • Employee leaving due • Use of exit interview to conflict • Workers participation • The induction crisis
  • 24.
    Business Story • KwalityWall’s (Labour Turnover-WPM- Innovation)
  • 25.
    Closing case 1 Telcon(Tata- Hitachi Joint venture at Kharagpur)
  • 26.
    Closing case 2 Payrevision and Turnover in Indian Army Old Pay Scale of Indian Army
  • 27.
    The armed forces,which are facing a shortage of middle level personnel would be better placed to hire capable junior officers and other staff.
  • 28.
    Bibliography Books- • 1.Cost and Management Accounting, Publisher- Taxmann, Author-Ravi.M.Kishore. • 2. Cost Accounting, Publisher- Kalyani New Delhi. Research Papers and Articles- • 1. Employee turnover in “IT” Industry with special reference to Chennai City-An Exploratory Study, Mrs. E. DEEPA; Mrs. M. STELLA of Vivekanandha College of Engineering for Women, Elayapalayam,Tiruchengode, Tamilnadu. • 2. Article was prepared by Eliza Jacobs, strategic research analyst at SHRM. • 3. Annual Survey of Industries, 2002-03 Vol. II Report on Absenteeism, Labour Turnover, Employment & Labour Cost in Sample Sector, CHAPTER-III. • Websites- • 1. http://labourbureau.nic.in/asi2K2-3%20S%20ChapterIII.htm • 2. - www.shrm.org