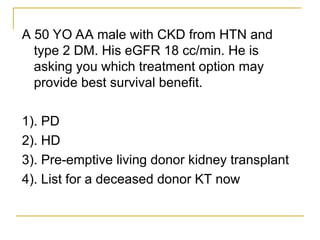
A 50 YOAA male with CKD from HTN and
type 2 DM. His eGFR 18 cc/min. He is
asking you which treatment option may
provide best survival benefit.
1). PD
2). HD
3). Pre-emptive living donor kidney transplant
4). List for a deceased donor KT now
4.
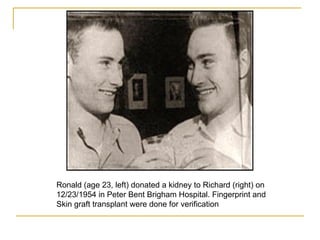
Ronald (age 23,left) donated a kidney to Richard (right) on
12/23/1954 in Peter Bent Brigham Hospital. Fingerprint and
Skin graft transplant were done for verification
5.
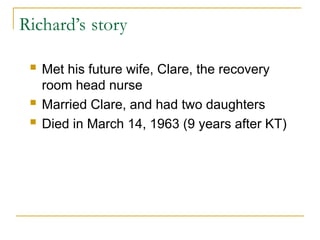
Richard’s story
Methis future wife, Clare, the recovery
room head nurse
Married Clare, and had two daughters
Died in March 14, 1963 (9 years after KT)
6.
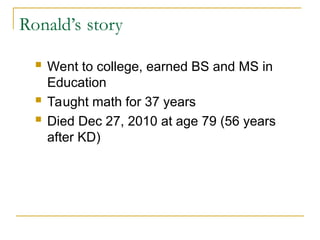
Ronald’s story
Wentto college, earned BS and MS in
Education
Taught math for 37 years
Died Dec 27, 2010 at age 79 (56 years
after KD)
8.
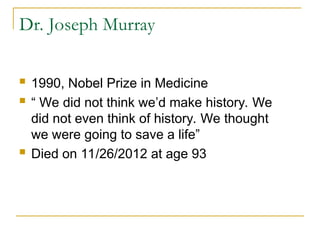
Dr. Joseph Murray
1990, Nobel Prize in Medicine
“ We did not think we’d make history. We
did not even think of history. We thought
we were going to save a life”
Died on 11/26/2012 at age 93
10.
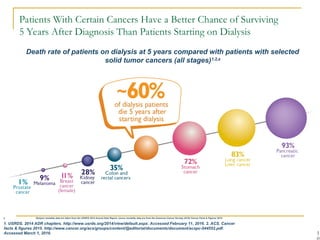
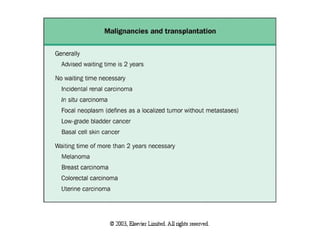
Patients With CertainCancers Have a Better Chance of Surviving
5 Years After Diagnosis Than Patients Starting on Dialysis
1
Death rate of patients on dialysis at 5 years compared with patients with selected
solid tumor cancers (all stages)1,2,a
a Dialysis mortality data are taken from the USRDS 2014 Annual Data Report; cancer mortality data are from the American Cancer Society (ACS) Cancer Facts & Figures 2015.
1. USRDS. 2014 ADR chapters. http://www.usrds.org/2014/view/default.aspx. Accessed February 11, 2016. 2. ACS. Cancer
facts & figures 2015. http://www.cancer.org/acs/groups/content/@editorial/documents/document/acspc-044552.pdf.
Accessed March 1, 2016.
11.
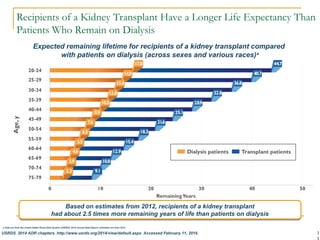
Recipients of aKidney Transplant Have a Longer Life Expectancy Than
Patients Who Remain on Dialysis
1
a Data are from the United States Renal Data System (USRDS) 2014 Annual Data Report; estimates are from 2012.
USRDS. 2014 ADR chapters. http://www.usrds.org/2014/view/default.aspx. Accessed February 11, 2016.
Expected remaining lifetime for recipients of a kidney transplant compared
with patients on dialysis (across sexes and various races)a
Based on estimates from 2012, recipients of a kidney transplant
had about 2.5 times more remaining years of life than patients on dialysis
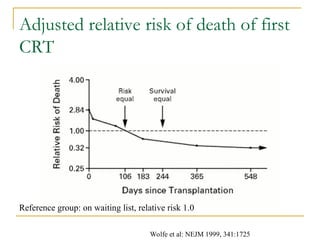
Adjusted relative riskof death of first
CRT
Reference group: on waiting list, relative risk 1.0
Wolfe et al: NEJM 1999, 341:1725
15.
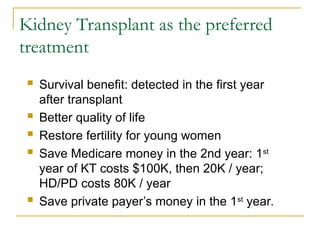
Kidney Transplant asthe preferred
treatment
Survival benefit: detected in the first year
after transplant
Better quality of life
Restore fertility for young women
Save Medicare money in the 2nd year: 1st
year of KT costs $100K, then 20K / year;
HD/PD costs 80K / year
Save private payer’s money in the 1st
year.
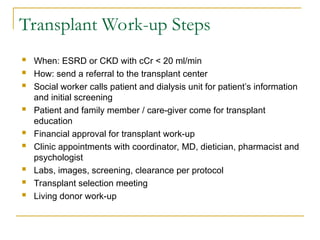
Transplant Work-up Steps
When: ESRD or CKD with cCr < 20 ml/min
How: send a referral to the transplant center
Social worker calls patient and dialysis unit for patient’s information
and initial screening
Patient and family member / care-giver come for transplant
education
Financial approval for transplant work-up
Clinic appointments with coordinator, MD, dietician, pharmacist and
psychologist
Labs, images, screening, clearance per protocol
Transplant selection meeting
Living donor work-up
19.
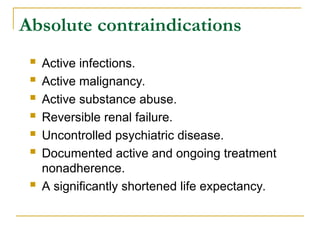
Absolute contraindications
Activeinfections.
Active malignancy.
Active substance abuse.
Reversible renal failure.
Uncontrolled psychiatric disease.
Documented active and ongoing treatment
nonadherence.
A significantly shortened life expectancy.
20.
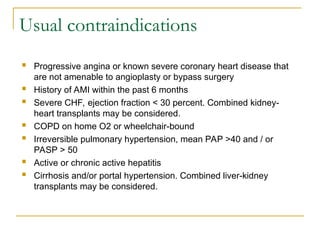
Usual contraindications
Progressiveangina or known severe coronary heart disease that
are not amenable to angioplasty or bypass surgery
History of AMI within the past 6 months
Severe CHF, ejection fraction < 30 percent. Combined kidney-
heart transplants may be considered.
COPD on home O2 or wheelchair-bound
Irreversible pulmonary hypertension, mean PAP >40 and / or
PASP > 50
Active or chronic active hepatitis
Cirrhosis and/or portal hypertension. Combined liver-kidney
transplants may be considered.
2
a
Data are fromthe Organ Procurement and Transplantation Network/Scientific Registry of Transplant Recipients (OPTN/SRTR). 2013 Annual
Data Report: Kidney.
Three-year outcomes are for adult patients waiting for a kidney transplant and first placed on the waiting list in 2010.
b
Includes patients who were still waiting, died, or were removed from the list.
Matas AJ et al. Am J Transplant. 2015;15(suppl 2):1-34 [supplementary material]. http://onlinelibrary.wiley.com/doi/10.1111/ajt.13195/suppinfo. Accessed
March 1, 2016.
63% of patients placed on the waiting list in 2010 did not receive a kidney
transplant within 3 yearsb
The median waiting time for a deceased donor kidney transplant was
4 years for adult patients active at listing in 2009
28.
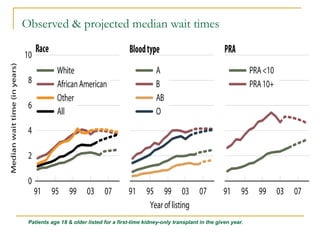
Observed & projectedmedian wait times
Patients age 18 & older listed for a first-time kidney-only transplant in the given year.
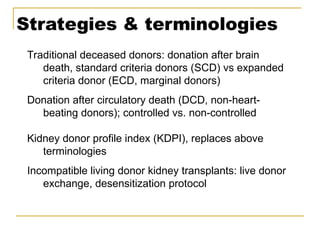
Strategies & terminologies
Traditionaldeceased donors: donation after brain
death, standard criteria donors (SCD) vs expanded
criteria donor (ECD, marginal donors)
Donation after circulatory death (DCD, non-heart-
beating donors); controlled vs. non-controlled
Kidney donor profile index (KDPI), replaces above
terminologies
Incompatible living donor kidney transplants: live donor
exchange, desensitization protocol
31.
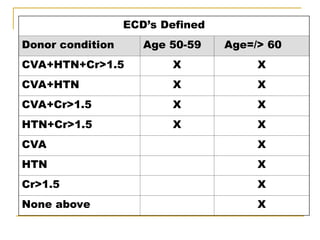
ECD’s Defined
Donor conditionAge 50-59 Age=/> 60
CVA+HTN+Cr>1.5 X X
CVA+HTN X X
CVA+Cr>1.5 X X
HTN+Cr>1.5 X X
CVA X
HTN X
Cr>1.5 X
None above X
32.
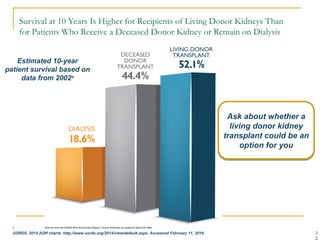
Survival at 10Years Is Higher for Recipients of Living Donor Kidneys Than
for Patients Who Receive a Deceased Donor Kidney or Remain on Dialysis
3
Ask about whether a
living donor kidney
transplant could be an
option for you
Estimated 10-year
patient survival based on
data from 2002a
a Data are from the USRDS 2014 Annual Data Report; 10-year estimates are based on data from 2002.
USRDS. 2014 ADR charts. http://www.usrds.org/2014/view/default.aspx. Accessed February 11, 2016.
33.
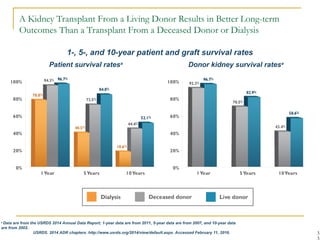
A Kidney TransplantFrom a Living Donor Results in Better Long-term
Outcomes Than a Transplant From a Deceased Donor or Dialysis
3
a
Data are from the USRDS 2014 Annual Data Report; 1-year data are from 2011, 5-year data are from 2007, and 10-year data
are from 2002.
USRDS. 2014 ADR chapters. http://www.usrds.org/2014/view/default.aspx. Accessed February 11, 2016.
Patient survival ratesa
Donor kidney survival ratesa
1-, 5-, and 10-year patient and graft survival rates
34.
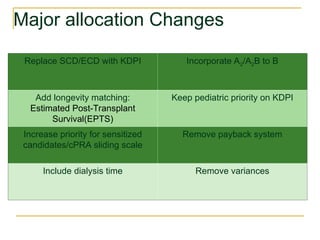
Major allocation Changes
ReplaceSCD/ECD with KDPI Incorporate A2/A2B to B
Add longevity matching:
Estimated Post-Transplant
Survival(EPTS)
Keep pediatric priority on KDPI
Increase priority for sensitized
candidates/cPRA sliding scale
Remove payback system
Include dialysis time Remove variances
35.
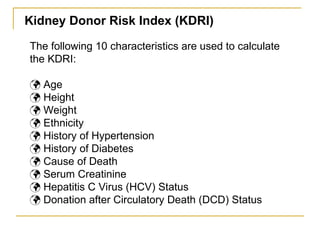
The following 10characteristics are used to calculate
the KDRI:
Age
Height
Weight
Ethnicity
History of Hypertension
History of Diabetes
Cause of Death
Serum Creatinine
Hepatitis C Virus (HCV) Status
Donation after Circulatory Death (DCD) Status
Kidney Donor Risk Index (KDRI)
36.
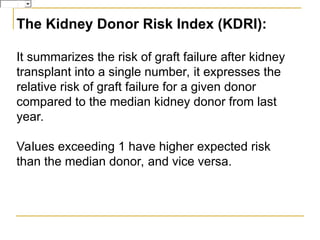
The Kidney DonorRisk Index (KDRI):
It summarizes the risk of graft failure after kidney
transplant into a single number, it expresses the
relative risk of graft failure for a given donor
compared to the median kidney donor from last
year.
Values exceeding 1 have higher expected risk
than the median donor, and vice versa.
37.
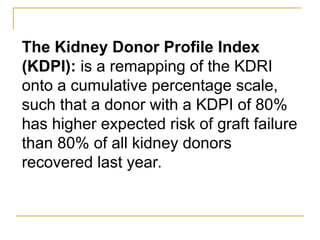
The Kidney DonorProfile Index
(KDPI): is a remapping of the KDRI
onto a cumulative percentage scale,
such that a donor with a KDPI of 80%
has higher expected risk of graft failure
than 80% of all kidney donors
recovered last year.
Estimated Post-Transplant Survival(EPTS)
Candidate age, time on dialysis, prior organ transplant,
diabetes status; 4 variables, more predictive than age alone
Percentage scale, similar to KDPI, lower = better
EPTS of 20 percent suggests that the patient would likely
survive longer than 80 percent of all other recipients.
Top 20% of candidates by EPTS (<20%) to receive top 20%
kidneys (KDPI<20%)
Longevity Matching for Recipients
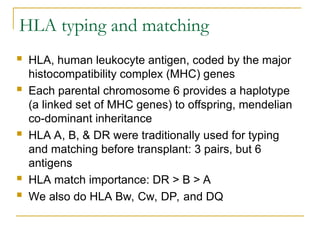
HLA typing andmatching
HLA, human leukocyte antigen, coded by the major
histocompatibility complex (MHC) genes
Each parental chromosome 6 provides a haplotype
(a linked set of MHC genes) to offspring, mendelian
co-dominant inheritance
HLA A, B, & DR were traditionally used for typing
and matching before transplant: 3 pairs, but 6
antigens
HLA match importance: DR > B > A
We also do HLA Bw, Cw, DP, and DQ
46.
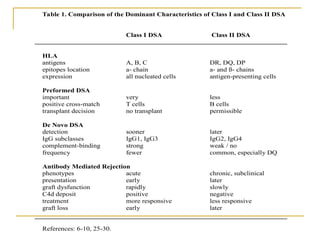
Table 1. Comparisonof the Dominant Characteristics of Class I and Class II DSA
Class I DSA Class II DSA
HLA
antigens A, B, C DR, DQ, DP
epitopes location a- chain a- and ß- chains
expression all nucleated cells antigen-presenting cells
Preformed DSA
important very less
positive cross-match T cells B cells
transplant decision no transplant permissible
De Novo DSA
detection sooner later
IgG subclasses IgG1, IgG3 IgG2, IgG4
complement-binding strong weak / no
frequency fewer common, especially DQ
Antibody Mediated Rejection
phenotypes acute chronic, subclinical
presentation early later
graft dysfunction rapidly slowly
C4d deposit positive negative
treatment more responsive less responsive
graft loss early later
References: 6-10, 25-30.
47.
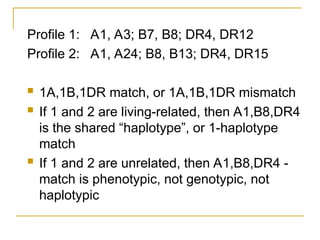
Profile 1: A1,A3; B7, B8; DR4, DR12
Profile 2: A1, A24; B8, B13; DR4, DR15
Living related
Living unrelated, or one is a deceased
donor
48.
Profile 1: A1,A3; B7, B8; DR4, DR12
Profile 2: A1, A24; B8, B13; DR4, DR15
1A,1B,1DR match, or 1A,1B,1DR mismatch
If 1 and 2 are living-related, then A1,B8,DR4
is the shared “haplotype”, or 1-haplotype
match
If 1 and 2 are unrelated, then A1,B8,DR4 -
match is phenotypic, not genotypic, not
haplotypic
49.
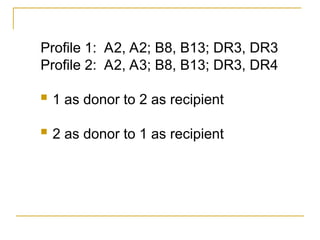
Profile 1: A2,A2; B8, B13; DR3, DR3
Profile 2: A2, A3; B8, B13; DR3, DR4
1 as donor to 2 as recipient
2 as donor to 1 as recipient
50.
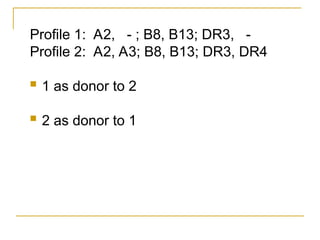
Profile 1: A2,- ; B8, B13; DR3, -
Profile 2: A2, A3; B8, B13; DR3, DR4
1 as donor to 2
2 as donor to 1
51.
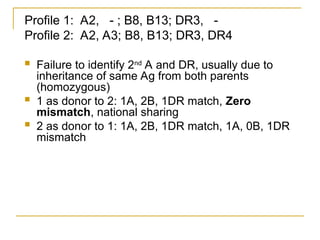
Profile 1: A2,- ; B8, B13; DR3, -
Profile 2: A2, A3; B8, B13; DR3, DR4
Failure to identify 2nd
A and DR, usually due to
inheritance of same Ag from both parents
(homozygous)
1 as donor to 2: 1A, 2B, 1DR match, Zero
mismatch, national sharing
2 as donor to 1: 1A, 2B, 1DR match, 1A, 0B, 1DR
mismatch
52.
National kidney sharing
All (6) HLA antigen - matched kidneys
Phenotypically matched
Zero mismatch
Deceased donor does not have any Ag
different from recipient, but recipient may
have Ag different from the donor
53.
PRA
The presenceof antibodies in the recipient’s blood
against a panel of selected HLA antigens
representing donor population
PRA defines sensitization, 0 to 100%
Sensitization: blood transfusion, pregnancy,
previous transplants
Higher PRA, more difficult to find a donor, longer
waiting time
cPRA is calculated based on the patient listing of
“unacceptable” HLA antigens
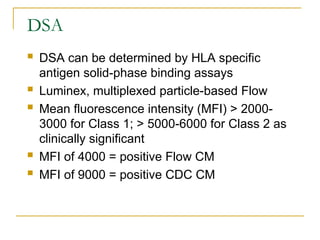
DSA
DSA canbe determined by HLA specific
antigen solid-phase binding assays
Luminex, multiplexed particle-based Flow
Mean fluorescence intensity (MFI) > 2000-
3000 for Class 1; > 5000-6000 for Class 2 as
clinically significant
MFI of 4000 = positive Flow CM
MFI of 9000 = positive CDC CM
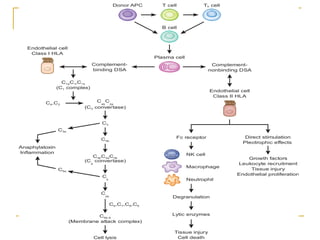
58.
T cell
Plasma cell
DonorAPC
Endothelial cell
Class I HLA
T cell
h
B cell
Endothelial cell
Class II HLA
Direct stimulation
Pleotrophic effects
Growth factors
Leukocyte recruitment
Tissue injury
Endothelial proliferation
Fc receptor
NK cell
Macrophage
Neutrophil
Degranulation
Lytic enzymes
Tissue injury
Cell death
Complement-
binding DSA
C C C
1q 1r 1s
(C complex)
1
C ,C
4 2
C C
4b 2a
(C convertase)
3
C C C
4b 2a 3b
(C convertase)
5
C3
C3a
Anaphylatoxin
Inflammation
C5a
C3b
C
5
C
5b
C ,C ,C ,C
6 7 8 9
C5b-9
(Membrane attack complex)
Cell lysis
Complement-
nonbinding DSA
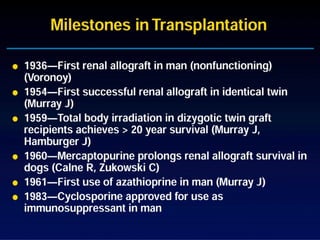
#3 This slide summarize the milestones in KT: first KT performed in human was in 1936, it was allograf renal transplant between two humans. but it did not work likely due to rejection. At that time, there was no immunosuppressive drugs. Many KT were performed since then, but no one worked until 18 years later when Dr. Murray did a KT between two identical twin, and it worked for the first time. Because of historic contribution, Dr. Murray was rewarded with the Nobel prize. The first immunosuppressive therapy was total body radiation, then followed by steroid and azathioprine. In the 60s, 70s and early 80s, steroid and azathioprine were the standard therapy. At that time, rejection is the most common cause of allograft failure, and 1 year graft survival was about 40 to 50%. Cyclosporine was intruded to clinic in 1982 and FDA approved in 1983. It revolutionized whole organ transplantation, greatly improved the 1 year graft survival to 80 to 85%.
#10 Patients With Certain Cancers Have a Better Chance of Surviving 5 Years After Diagnosis Than Patients Starting on Dialysis
This slide compares the number of people on dialysis who died within 5 years of starting dialysis with the 5-year death rate at diagnosis for patients with selected solid tumor cancers, across all stages1,2
Approximately 60 out of every 100 patients who began dialysis in 2007 died within
5 years of starting dialysis1
This was higher than the 5-year death rate for people who were diagnosed with
any stage of2:
Prostate cancer (1 out of every 100 patients)
Melanoma of the skin (9 out of every 100)
Breast cancer in females (11 out of every 100)
Kidney cancer (28 out of every 100)
Colon and rectal cancers (35 out of every 100)
But was lower than the 5-year death rate for people who were diagnosed with any
stage of2:
Stomach cancer (72 out of every 100)
Lung cancer (83 out of every 100)
Liver cancer (83 out of every 100)
Pancreatic cancer (93 out of every 100)
References:
USRDS. 2014 ADR chapters. http://www.usrds.org/2014/view/default.aspx. Accessed February 11, 2016.
American Cancer Society (ACS). Cancer facts & figures 2015. http://www.cancer.org/acs/groups/content/@editorial/documents/document/acspc-044552.pdf. Accessed March 1, 2016.
#11 Recipients of a Kidney Transplant Have a Longer Life Expectancy Than Patients Who Remain on Dialysis
This slide shows the years of expected remaining lifetime for patients on dialysis (orange bars) compared with recipients of a kidney transplant (blue bars) in 5-year age increments
Based on estimates from 2012, recipients of a kidney transplant, regardless of age, can expect to have about 2.5 times more remaining years of life compared to patients
on dialysis
Similar trends were observed across genders and various races
Reference:
United States Renal Data System (USRDS). 2014 ADR chapters. http://www.usrds.org/2014/view/default.aspx. Accessed February 11, 2016.
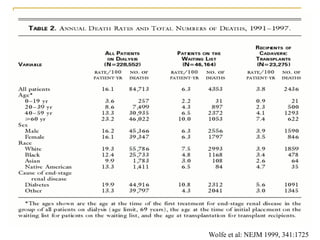
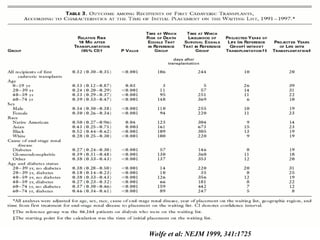
#12 This is a very important study of the annual death rate of our ESRD patients published in NEJM 1999. Based on the US renal data and United network of organ sharing from 1991 to 1997, 16% of dialysis patients die every year. The annual death rate drop to 3.8% if the patients have a KT. Well, you may say it is unfair to compare the death rate between the dialysis patients and KT patients, because KT patients are highly selected group, and they are healthier. It is true. But let us compare KT patients with KT candidates, who have been also highly selected, but still on waiting list: you can still see a big difference in their death rate: 6.3% vs 3.8% (about 40% less)
#13 It is a busy slide, but let just focus on the last two columns, which compare the projected years of life, among patients with first cadeveric kidney transplant, and those on waiting list without KT. Overall, the projected years of life is 20 years in CRT compared to only 10 years in those on waiting list and receiving dialysis.
The taking home message is that KT prolong the life of all patient group with ESRD
#14 This is an intention-to-treat analysis of the relative risk of death for the first cadaveric RT patients, adjusted to the reference group on waiting list: the relative risk of death as 1. The risk of death for KT patient is higher in the first 3 and half month, because of surgery related death, such as post surgery infection and complications. After that time, the risk of death less than the patients on waiting list. The survival benefit for KT can be detected as early as the post-surgery day 244, about 8 month after KT.
#15 After patient’s kidney has failed, they have to choose to take either HD, PD, or a kidney transplantation. Which one should be the first choice?
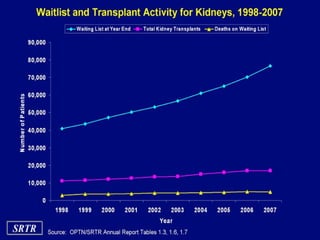
#27 Patients Who Receive a Kidney Transplant Have a Longer Life Expectancy Than Those Who Remain on Dialysis; However, the Wait for a Kidney From a Deceased Donor Is Long
This slide highlights the long wait times for a kidney transplant from a deceased donor1,2
The median waiting time for a deceased donor kidney transplant was 4 years for adult patients active at listing in 20091
Only 1 out of 5 (22.27%) adult patients who were newly placed on the waiting list in 2010 received a kidney from a deceased donor within 3 years2
Of the adult patients who were newly wait-listed in 2010, 63% did not receive a kidney transplant within 3 years2
This number includes:
44% of patients who were still waiting
9% of patients who were removed from the list
9% of patients who died
Factors affecting how long you wait include how well you match with the donor, how sick you are, and how many donors are available in your local area compared with the number of patients waiting3
References:
Matas AJ, Smith JM, Skeans MA, et al. OPTN/SRTR 2013 annual data report: kidney [supplementary information; Table KI 1.11]. Am J Transplant. 2015;15(suppl 2):1-34. http://onlinelibrary.wiley.com/doi/10.1111/ajt.13195/suppinfo. Accessed March 1, 2016.
Matas AJ, Smith JM, Skeans MA, et al. OPTN/SRTR 2013 annual data report: kidney [supplementary information; Table KI 1.10]. Am J Transplant. 2015;15(suppl 2):1-34. http://onlinelibrary.wiley.com/doi/10.1111/ajt.13195/suppinfo. Accessed March 1, 2016.
United Network for Organ Sharing (UNOS). Frequently asked questions. https://www.unos.org/transplantation/faqs/. Accessed February 11, 2016.
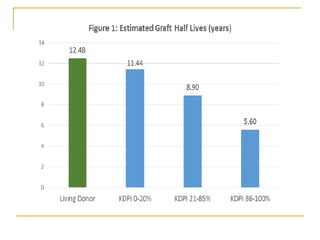
#32 Survival at 10 Years Is Higher for Recipients of Living Donor Kidneys Than for Patients Who Receive a Deceased Donor Kidney or Remain on Dialysis
This slide shows the difference in 10-year survival for patients who began dialysis or received a kidney transplant in 2002
Based on data from 2002, kidney transplantation more than doubled the chance of patients surviving 10 years compared with dialysis
Kidney transplants from a living donor had the best 10-year patient survival. For every 100 patients who received a kidney from a living donor, about 52 patients were still alive after 10 years
This is compared with 44 out of every 100 patients who received a kidney from a deceased donor and 19 out of every 100 patients who began dialysis
Reference:
USRDS. 2014 ADR chapters. http://www.usrds.org/2014/view/default.aspx. Accessed February 11, 2016.
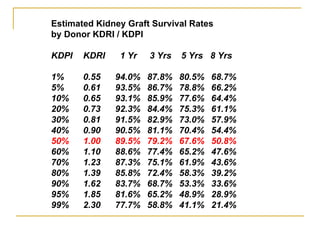
#33 A Kidney Transplant From a Living Donor Results in Better Long-term Outcomes Than a Transplant From a Deceased Donor or Dialysis
The graph on the left side compares 1-, 5-, and 10-year survival rates for patients on dialysis, recipients of a deceased donor kidney, and recipients of a living donor kidney
Based on 1-year data from 2011, 5-year data from 2007, and 10-year data from 2002, patients on dialysis (orange bars) had the lowest 1-, 5-, and 10-year survival rates—78.8%, 40.5%, and 18.6%, respectively
Recipients of kidneys from living donors had the highest long-term survival rates. Survival rates at 5 and 10 years were 84.8% and 52.1%, respectively, for recipients of a kidney from a living donor
The graph on the right side compares the 1-, 5-, and 10-year survival rates for kidneys transplanted from deceased donors and living donors
Based on 1-year data from 2011, 5-year data from 2007, and 10-year data from 2002, kidneys transplanted from living donors had higher long-term (5- and 10-year posttransplant) survival rates compared with kidneys transplanted from deceased donors
5-year survival rates of kidneys from living donors (blue bars) and deceased donors (gray bars) were 82.9% and 70.5%, respectively
10-year survival rates of kidneys from living donors (blue bars) and deceased donors (gray bars) were 58.6% and 43.4%, respectively
Reference:
USRDS. 2014 ADR chapters. http://www.usrds.org/2014/view/default.aspx. Accessed February 11, 2016.
#34 The new kidney allocation system is made up of several major components:
The current kidney donor quality metric (SCD and ECD) is being replaced with a more refined metric known as the Kidney Donor Profile Index (KDPI).
The allocation rules are designed to promote better longevity matching between donor and recipient in order to utilize the maximum amount of graft years.
In the new system, sensitized candidates are given increased priority through additional sliding scale points system for calculated PRA scores or CPRA.
Pre-registration dialysis time will now be calculated in a candidate’s waiting time.
There are new rules designed to provide greater access to Blood Type B candidates who can safely accept a kidney from an A2 or A2B blood type donor.
Also in the new system, pediatric priority will be based on the KDPI. Simulation modeling has shown that pediatric candidates will receive the same priority as they have in the current system.
The payback system is being eliminated altogether.
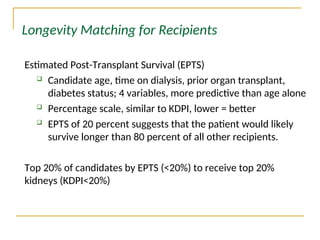
#40 The first proposed change is that of Longevity Matching which uses a formula called Estimated Post-transplant Survival (EPTS). Unlike the liver allocation system or the lung allocation system, the current kidney allocation system does not have a candidate classification based risk of death while on the waiting list or estimated post-transplant survival. Incorporating a metric like estimated post-transplant survival would allow for better matching of candidates and donated grafts so that individuals with very long estimated post transplant survival do not receive kidneys with very short survival (necessitating a second or third transplant from an already limited donor pool) and vice versa.
Four medical factors about the transplant candidate are used to calculate the Estimated Post-Transplant Survival (EPTS) score:
Age
History of diabetes
Length of time on dialysis
History of a prior kidney transplant
These factors are also used in a clinical formula. A percentage score estimates how long a candidate is expected to benefit from a functioning kidney when compared to the experience of other recipients over a recent time. A low EPTS percentage indicates likely longer-term survival, and a high percentage indicates shorter likely benefit. An EPTS of 20 percent, for example, suggests that if the candidate is transplanted, he or she would likely survive longer than 80 percent of other recipients.
The use of EPTS would not change how the majority of kidney candidates get priority for kidneys – only those expected to need and benefit from a transplant the very longest.
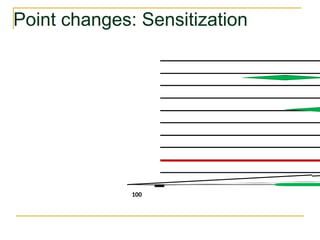
#41 This slide shows the sliding scale points system for CPRA that will be used in the new allocation system. As you can see, candidates will receive additional allocation points based on their sensitization level. Very highly sensitized candidates will receive a substantial amount of points. For example, candidates with CPRA scores of 100% will receive as much as 20 points.
In the current system, all candidates at or above 80% receive only 4 points.
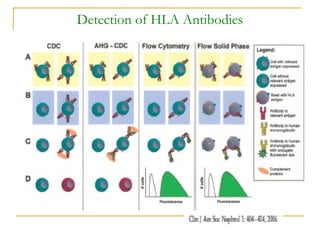
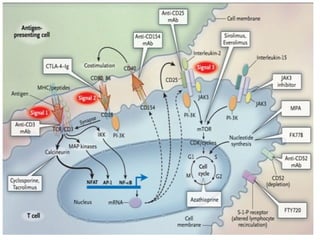
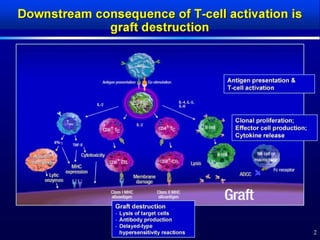
#58 A common goal of immunosuppressive therapies is inhibition of T-cells
T-cell activation results in1:
Production of cytotoxic T-cells that directly destroy mismatched tissue
Recruitment of inflammatory cells to the site of allograft
B-helper T-cell formation, which induces alloantibody production by B-cells and subsequent vascular abnormalities

![2
a
Data are from the Organ Procurement and Transplantation Network/Scientific Registry of Transplant Recipients (OPTN/SRTR). 2013 Annual
Data Report: Kidney.
Three-year outcomes are for adult patients waiting for a kidney transplant and first placed on the waiting list in 2010.
b
Includes patients who were still waiting, died, or were removed from the list.
Matas AJ et al. Am J Transplant. 2015;15(suppl 2):1-34 [supplementary material]. http://onlinelibrary.wiley.com/doi/10.1111/ajt.13195/suppinfo. Accessed
March 1, 2016.
63% of patients placed on the waiting list in 2010 did not receive a kidney
transplant within 3 yearsb
The median waiting time for a deceased donor kidney transplant was
4 years for adult patients active at listing in 2009](https://image.slidesharecdn.com/ktpart-1donorandrecipientselection-250507172004-1734b2f2/85/KT-part-1-Donor-and-recipient-selection-ppt-27-320.jpg)


![Human Renal Transplantation [Dr. Edmond Wong]](https://cdn.slidesharecdn.com/ss_thumbnails/humanrenaltransplantationedmond-140716214736-phpapp02-thumbnail.jpg?width=640&height=640&fit=bounds)


