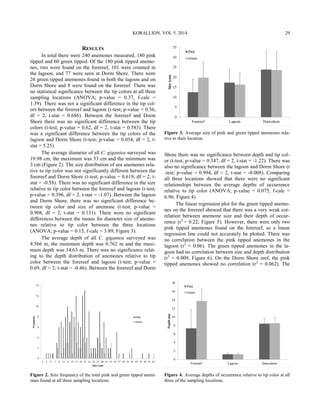
KorallionKorallion
Ecology of Coral ReefsEcology of Coral Reefs
Discovery Bay, JamaicaDiscovery Bay, Jamaica
Volume V, Maymester 2014Volume V, Maymester 2014
Suggested citations for Korallion
Volume
Sporre MA, Raynor CB, Kammerer AJ, and EJ Burge, editors. 2014. Korallion. Coastal Carolina Studies in
Coral Reef Ecology. 5: 72 pp.
Individual paper (example)
Baldwin, A. 2014. Population density and depth zonation of the long-spined sea urchin, Diadema antillarum, in
Discovery Bay, Jamaica. Korallion. Coastal Carolina University Studies in Coral Reef Ecology. Sporre
MA, Raynor CB, Kammerer AJ, and EJ Burge, eds. 5:1–4
FOREWORD
C
OASTAL CAROLINA UNIVERSITY is a comprehensive, public university with one of the largest undergraduate ma-
rine science programs on the east coast. In 2014 the university added a doctoral program in Marine Science—
Coastal Marine Systems Science to the educational offerings at Coastal. Located in Conway, South Carolina, just
minutes from Myrtle Beach, we are renowned for offering hands-on opportunities to students directly in the
field. Our faculty are research-active in the laboratory and in the field and offer numerous opportunities to involve students
in this research. The Department of Marine Science also offers three study abroad courses that give selected students the
experience of conducting research while abroad.
For almost 30 years, students and faculty from Coastal Carolina have traveled to the University of the West Indies
Discovery Bay Marine Lab (DBML), in Discovery Bay, Jamaica. Here students learn about and gain first hand experience
with coral reef ecosystems. Students participate in a three credit course, MSCI 477: Ecology of Coral Reefs, where they
learn about reef structure, productivity, and diversity, while getting to directly observe what they learn through diving on
the reef. The students also prepare and conduct an independent, faculty-supervised, research project that fulfills three cred-
its of MSCI 499: Directed Undergraduate Research.
The students prepare for the trip, which occurs annually in May, by spending time during the spring semester re-
searching and preparing their projects. Once at DBML, students take part in diving, researching, learning, and enjoying the
tropical coral reefs. They meet the natives, learn the culture, and get a real taste of Jamaica. As the trip ends, the last dives
are logged and presentations and projects are finished. For most participants their Jamaican experience ends here, but com-
pilation of this volume of papers occurs in the fall semester following our trip to Jamaica. Two to three of the students vol-
unteer and are chosen to be editors, enrolling in MSCI 399: Scientific Publishing, during the fall semester to create this
volume.
The following papers are a compilation of the exceptional student research projects that collectively make up the
fifth volume of Korallion. As the editors, we found this process to be sometimes frustrating but extremely rewarding and
fun. We are proud of each paper, and with the authors we worked very hard to create a work that will be beneficial to those
who follow in our footsteps. Working on this volume reminded us of the great experiences and the cherished memories we
have from our time in Discovery Bay. We hope that this collection will contribute to the scientific community and be help-
ful to the students who are selected for the trips in years to come.
i
STUDENT EDITORS
Caitlin B. Raynor
Class of 2015
Caitlin is from Laurel, Maryland and graduating with a
B.S. in Marine Science. After graduation she plans to
pursue a Masters of Teaching in middle level science.
She hopes to become an aquarist with the goal of edu-
cating the public about the marine world. Her favorite
memory from Jamaica is a dive she had at Dancing Lady
with Tiffany, Megan, and Ashton, when they spent the
entire dive laughing through their regulators trying to
spear lionfish.
Andrew J. Kammerer
Class of 2014
AJ is from southern New Jersey, and is graduating with
a B.S. in Marine Science. He is attending graduate
school at Coastal Carolina University starting in 2015,
pursuing a masters degree focusing in radar related
ocean wave measurements. All of his favorite memories
from Jamaica involved climbing up things and jumping
off of them, as well as being in the water, diving every
day, as much as possible.
Megan A. Sporre
Class of 2015
Megan is from Bel Air, Maryland and graduating with
honors and dual B.S. degrees in Marine Science and Bi-
ology. After graduation she plans to attend graduate
school in the Pacific Northwest focusing on the popula-
tion genetics of pinnipeds. Her favorite memory from
Jamaica was the last dive at Runaway Bay. The under-
water canyon was breathtaking.
STUDIES IN CORAL REEF ECOLOGYii
FACULTY AND STAFF
Erin J. Burge
Associate Professor, Marine Science
eburge@coastal.edu
Dr. Erin Burge has been involved with the Jamaica coral reef ecolo-
gy program since 2007. He has been a certified SCUBA diver since
1988 and completed over 240 scientific dives in and around Discov-
ery Bay. His research interests include environmental immunology,
molecular physiology, and molecular biology of marine inverte-
brates and fishes. At Coastal Carolina University, Dr. Burge has
participated in projects ranging from using underwater videos to
monitor grouper populations, molecular tools to detect parasites,
and evaluating ecological changes on Caribbean coral reefs. For
more information visit his faculty web page (www.coastal.edu/
marine/erinburge/ and www.ecologyofcoralreefs.com
Steve Luff
Dive Safety Officer and Instructor
sluff@coastal.edu
Steve Luff has been diving since 1977 and became a SCUBA in-
structor in 1993. Steve is an alumnus of the Ecology of Coral Reefs
program (‘96) and a graduate of the Marine Science program at
Coastal Carolina University. He serves as the scientific dive safety
officer and SCUBA program instructor for CCU. His attention to
safe diving practices and almost 20 years of experience diving the
north-central coast of Jamaica have given him a unique knowledge
of the local diving conditions, environments, and marine life that
are valuable assets to the students conducting field research and
data collection during MSCI 477: Ecology of Coral Reefs
KORALLION. VOL 5. 2014
Dwayne “Skeggy”
Edwards
Coxswain
Naval Feurtado
Driver
Daniel Scarlett
DBML Dive Safety
Officer
Oneil “Snow” Holder
DBML Diver
iii
STUDENT PARTICIPANTS
Tiffany M. Beheler
Class of 2014
Tiffany is from Roanoke, Virginia and
graduated with a degree in Marine Sci-
ence with a minor in Biology. Tiffany
hopes to pursue a Masters in Australia
focusing on coral reef ecology. Her fa-
vorite memory from Jamaica was her last
dive with AJ, Cait, and Meg. They got to
dive with a green sea turtle at Runaway
Bay Canyon.
Catharine C. Gordon
Class of 2016
Catharine is from Iowa City, Iowa,
majoring in marine science with a
minor in biology. Her career goals
include becoming a head aquarist
and dive master. Her favorite memo-
ries from the trip are Dunn’s River
Falls and the bonfire with the lab
staff. These were times when the
group bonded and they got to see the
culture of Jamaica.
Megan E. Miller
Class of 2015
Megan is from Pittsburgh, Pennsyl-
vania and pursuing a degree in Ma-
rine Science with a minor in Biolo-
gy. After graduation she plans to
apply for the Peace Corps or to be a
fisheries observer in Alaska. Her
favorite memory from Jamaica is
diving. She loved waking up every
morning and going to dive, it was
beautiful and calming.
Lanie M. Esch
Class of 2015
Melanie is from Grand Rap-
ids, Michigan and came to
Coastal Carolina to study ma-
rine biology. She will gradu-
ate with a B.S. in Marine Sci-
ence and a minor in biology.
She plans to apply for gradu-
ate school in the spring of
2016. Her favorite memory of
Jamaica was the first dive at
Dairy Bull. The beauty of the
reef reminded her of why she
loves what she studies and
plans to do with her future.
Sam M. Cook
Class of 2015
Sam is from Crescent Township, Pennsylva-
nia. She will be graduating with a B.S. in Ma-
rine Science and a double minor in Biology
and Environmental Science. She plans to
attend graduate school for environmental
management or policy and pursue a career
related to that field. Her favorite memory was
getting to see a nurse shark on the forereef.
STUDIES IN CORAL REEF ECOLOGYiv
STUDENT PARTICIPANTS
Ariana A. Baldwin
Class of 2015
Ariana is a Marine Science
major and is originally from
Crofton, Maryland. After
graduating, Ariana hopes to
attend graduate school to
continue her career in scien-
tific diving. Her favorite
memory from the Jamaica
was being able to dive mul-
tiple times every day and
visiting Bioluminescent
Bay.
Ashton J. Galarno
Class of 2015
Ashton is from Columbus, Indiana and
majoring in marine science with minors
in biology and Spanish. She plans to
start graduate school the following year,
pursuing a masters degree and/or PhD in
marine biology, focusing on coral reef
ecology. One of her favorite memories
from Jamaica was lionfish 'hunting' with
Tiffany, Megan, and Caitlin.
Brandon Hinze
Class of 2015
Brandon is a Psychology major
with a minor in Marine Science
from Potosi, Missouri. After gradu-
ation in May, he plans to become a
marine animal behaviorist. Some of
his favorite memories were of the
people on the trip along with the
staff at DBML. He also enjoyed the
combination of waking up each
morning to the ocean in a com-
pletely stress-free environment
surrounded by amazing people.
D. Cristina O’Shea
Class of 2014
Cristina was born in Manizales, Co-
lombia and graduated from CCU with
a B.S. in Marine Science and a minor
in Biology. She hopes to attend Texas
A&M University to pursue a Masters
degree in Marine Biology specializing
in the physiological and behavioral
mechanisms that allow marine mam-
mals to dive to great depths for pro-
longed periods of time. She loved the
disposition of the Jamaican people and
their hospitality.
vKORALLION. VOL 5. 2014
TABLE OF CONTENTS
POPULATION DENSITY AND DEPTH ZONATION OF THE
LONG-SPINED SEA URCHIN, DIADEMA ANTILLARUM, IN
DISCOVERY BAY, JAMAICA
Ariana A. Baldwin……………………….…………….…1
REEF COVERAGE AND SPECIES RICHNESS WITH RESPECT
TO WATER DEPTH AT DISCOVERY BAY, JAMAICA
Melanie M. Esch……………………….…………………5
OBSERVING THE EFFECTIVENESS OF THE DISCOVERY
BAY FISH SANCTUARY USING REEF SURVEY TECH-
NIQUES
Samantha M. Cook.……………………….………………9
DENSITY, RESIDENCE TIME, AND INDIVIDUAL ASSOCIA-
TION OF FLAMINGO TONGUE SNAILS (CYPHOMA GIBBO-
SUM) ON GORGONIAN HOSTS
Catharine C. Gordon…..……………………..…….……15
STUDIES IN CORAL REEF ECOLOGYvi
TUBE AND VASE SPONGE DIVERSITY, ABUNDANCE, AND
DENSITY OF THEIR SYMBIONT, OPHIOTHRIX SUENSONII
Tiffany M. Beheler…………………………………….…19
TABLE OF CONTENTS
DEPTH DISTRIBUTION, SIZE FREQUENCY, AND TIP COLOR
POLYMORPHISM OF THE GIANT SEA ANEMONE, CONDY-
LACTIS GIGANTEA, OF DISCOVERY BAY, JAMAICA
Ashton J. Galarno……………………………..…….……27
A COMPARISON OF THE RIO BUENO AND DISCOVERY
BAYS BASED ON FECAL COLIFORM CONCENTRATION IN
RELATION TO FLUVIAL INPUT AND SURROUNDING HUMAN
DEVELOPMENT
Megan E. Miller…..………………………..……….……35
WATER COLUMN PROFILE AND PHYSICAL/BIOLOGICAL
ANALYSIS OF CRATER LAKE, DISCOVERY BAY, JAMAICA
Andrew J. Kammerer..…………………….…..…………39
KORALLION. VOL 5. 2014 vii
TABLE OF CONTENTS
NET MOVEMENT RATES OF ACANTHOPLEURA GRANULATA
WHEN SHELTER AND FOOD ARE PRESENT WITHIN THE
HABITAT
Caitlin B. Raynor…..……………………………….……43
DISTRIBUTION, LENGTH-WEIGHT RELATIONSHIP, BUR-
ROWING RATES, SIZE FREQUENCY, AND COLORATION
FREQUENCY OF DONAX DENTICULATUS IN DISCOVERY
BAY, JAMAICA
Megan A. Sporre…..………………………….……….…47
SHELL EXCHANGE MODELS IN CARIBBEAN HERMIT
CRABS, COENOBITA CLYPEATUS: NEGOTIATOR OR AG-
GRESSOR
D. Cristina O’Shea…..…………………………….……55
STUDIES IN CORAL REEF ECOLOGYviii
This research was conducted as part of Coastal Carolina Universi-
ty’s classes MSCI 477, Ecology of Coral Reefs, and MSCI 499,
Directed Undergraduate Research in Discovery Bay, Jamaica, 14
–31 May 2014. Contact e-mail: aabaldwin@coastal.edu
POPULATION DENSITY AND DEPTH ZONATION OF THE LONG-SPINED SEA
URCHIN, DIADEMA ANTILLARUM, IN DISCOVERY BAY, JAMAICA
Ariana A. Baldwin
Department of Marine Science, Coastal Carolina University, PO Box 261954, Conway, SC 29526
ABSTRACT:
Many corals require photosynthesis from symbiotic zooxanthellae that are embedded in their internal tissues. Without
primary production from these symbionts, many corals are unable to surpass maintenance metabolism requirements, thus
substantial reef accretion depends on the presence of zooxanthellae and the availability of light. Benthic shallow water
grazers such as the long-spined sea urchin, Diadema antillarum, effectively limit the growth of macroalgae that outcompete
corals for space, light, and nutrients. Diadema antillarum is considered a keystone species in Caribbean reefs as this urchin
regulates algal growth in shallow reef ecosystems. Diadema antillarum populations throughout the Caribbean have been
slowly recovering from massive die-off events in the early 1980s and 1990s. In the absence of grazing, many Caribbean
reefs have transitioned from a state of coral dominance to a state of macroalgal dominance. This study shows the density of
D. antillarum with depth and quantifies the “Diadema zone” on the western forereef of Discovery Bay, Jamaica. The data
obtained in this study shows that Diadema populations on the forereef have increased from 2010–2014 , and the depth
range where they are most abundant has become slightly shallower.
KEYWORDS: Diadema zone, keystone species, algal growth regulation, population recovery
INTRODUCTION
CORAL REEFS are delicate ecosystems heavily influ-
enced by factors such as light availability, surface
temperature, water quality, and essential symbiotic relation-
ships. Symbiotic zooxanthellae derive energy from light to
provide tropical corals with energy, thus substantial reef
growth depends on the abundance of light (Anthony and
Fabricus 2000). In most reefs, macroalgae dominate zoo-
xanthellae in biomass, resulting in limited zooxanthellae
photosynthesis (Small and Adey 2001). Extensive compe-
tition with algae may cause the coral to expel zooxanthellae
from its internal tissues, known as bleaching (Fitt et al
2001). Benthic shallow-water grazers such as Diadema
antillarum (Philippi, 1845) regulate percent algal cover by
feeding on competitive algae. Without this regulation, al-
gal growth rates greatly exceed those of the corals, result-
ing in competition and possible coral bleaching or mortali-
ty. Multiple experiments by Sammarco (1980) demonstrate
that algal cover and the presence of D. antillarum are in-
versely related. In the absence of D. antillarum, corals suf-
fered severe competitive losses to other benthic organisms
and coralline algae. Because D. antillarum effectively mod-
erates competition and algal cover, this urchin has been
characterized as a keystone species in shallow reef ecosys-
tems. Diadema antillarum has a substantial impact on the
structure of these ecosystems and there may be grave con-
sequences if the abundance of D. antillarum changes sig-
nificantly. The management and understanding of the ef-
fects of sea urchin populations on shallow reef ecosystems
may help to prevent further declination of corals, and may
be a key in avoiding catastrophic ecosystem changes (Alves
et al. 2003).
Over the past few decades, a predominant issue in Car-
ibbean reef ecology is the transition of coral dominance to
macroalgal dominance. Discovery Bay has been a study
site since the 1950s and is at the forefront of reports show-
ing a trend in the shift of reefs to macroalgal dominance.
Throughout the 1950s, Jamaican reefs were characterized
by few macroalgae with scleractinian coverage on about
90% of substrates (Edmunds and Carpenter 2001). In 1983,
a disease event devastated the predominant Caribbean ur-
chin, D. antillarum (Mumby et al. 2006). Two major hurri-
canes occurring in the 1990s in combination with the dis-
ease event caused a substantial loss of local Diadema. Sub-
sequently, coral cover has been recorded to less than 10%
and macroalgae reaches depths up to 35 meters (Edmunds
and Carpenter 2001). Although numbers of D. antillarum
have been slowly increasing over the last two decades, Car-
ibbean reefs have continued to deteriorate (Mumby et al.
2006). This decline in Caribbean reef systems can be at-
tributed to both natural and anthropogenic factors; global
pollution, sea temperature rise, dominance of algae, and
centuries of overfishing are some of the causes for reef
degradation in combination with smaller-scale local sources
(Mumby et al. 2006).
The fringing reef system of Discovery Bay is located on
the northern coast of the Caribbean island, Jamaica. The
KORALLION. VOL 5. 2014 1
reef sits above a narrow shelf, sheltering the lagoon from
oceanic swells. The bay lies in close proximity to a popu-
lated, industrial town. Anthropogenic factors such as over-
fishing, tourism, pollution, and runoff as well as sedimenta-
tion and disease associated with bauxite shipping vessels
have caused large amounts of reef degradation in this area.
Overfishing has led to the decline of local herbivorous fish
populations, and the rise of noncrustose algae (Mumby et
al. 2006). This harmful algal bloom persists in shallow
coastal Jamaican waters as local D. antillarum populations
have had only a small recovery.
However, local populations in small patches in Caribbe-
an reefs have seen a rise nearing populations recorded in
the late 1970s and early 1980s. From 1992–1996 there was
a significant increase in D. antillarum with abundant local
population sizes in shallow coastal water. Three similar
studies from 2010–2012 recorded the average density of D.
antillarum in shallow reef areas in Discovery Bay, Jamaica.
The results of these studies show the gradual increase in D.
antillarum populations over a recent 3-year span. Keller
(2010) found an average of 2.77 urchins per square meter,
Touse (2011) found an average of 3.23 urchins per square
meter, and Feldman (2012) found an average of 4.78 ur-
chins per square meter. Although the increase in D. antil-
larum since the die-off events has been slow, if these trends
continue, and populations of this herbivorous echinoid con-
tinue to expand spatially, macroalgae cover will decrease,
giving rise to a dominance of coral cover once again
(Edmunds and Carpenter 2001).
METHODS
The methods used in the study were adapted from stud-
ies done by Sellers (2009), Keller (2010), Touse (2011),
and Feldman (2012). Diadema antillarum was sampled by
SCUBA diving sessions using a transect and count method.
Nineteen 30 m transect belts were placed between 2.0–14.0
m deep. Depth readings were recorded using dive gauges,
and substrate type was also noted.
Transects were placed both parallel and perpendicular
to the western forereef region in three permanent mooring
stations on the outskirts of the opening of Discovery Bay,
including M1, Dancing Lady, and LTS (Long-term site).
Eight transects were placed parallel to the forereef, facing
southeast. The parallel transects were placed in shallow
areas where D. antillarum appeared to be most abundant,
these transects were sectioned off every 6 m and D. antil-
larum within 2 m of the transect were identified, counted
and recorded. Perpendicular transects were placed at vari-
ous depths facing North to South and sectioned off every 3
m, urchins were counted within 1 m of the transect.
Depths were determined for blocks along the transect
using dive gauges. The data obtained in the study was then
used to calculate the density of D. antillarum at each depth
block. Density values were calculated by dividing the num-
ber of urchins found by the standardized sample area and
then these numbers were averaged to give the average den-
sity at each depth block. The average densities with depth
were then compared to the averages obtained from 2010–
2012 and graphed to show the growth or retraction of the
local population size. Finally, an ANOVA test was run in
order to demonstrate a significant difference between the
numbers of urchins counted inside and outside of the deter-
mined zone.
RESULTS
This study assessed the population density and distribu-
tion with depth of D. antillarum in Discovery Bay, Jamai-
ca; an area that has been extensively studied for over fifty
years. Analysis of the data collected in this study showed
that the average density across all transects was 4.15 ur-
chins m-2
(STDEV=3.15), which is lower than the average
densities observed in previous years. However, in this
study, more transects were placed in deeper locations to
demonstrate a strong correlation with depth. An average
taken between all transects placed in closer proximity to the
“Diadema zone” gave a density of 5.59 (STDEV= 2.65),
compared to an average density of 4.78 observed by Feld-
man in 2012 (Standard deviation unknown). The average
densities per year observed from 2010-2014 have consist-
ently increased with each consecutive year (Figure 1).
Figure 1. The average D. antillarum density in the Diadema zone
per year from 2010–2014 is shown in the graph above. There was
an average of 2.77 urchins per square meter observed in 2010 with
a standard deviation of 2.02, 3.23 urchins m-2
with a standard de-
viation of 2.63 in 2011, 4.78 urchins m-2
(standard deviation un-
known) in 2012, and an average of 5.59 urchins m-2
with a stand-
ard deviation of 2.65 in 2014.
BALDWIN: DIADEMA ZONATION
The highest density recorded was 9.47 urchins m-2
at
approximately 1.5 m, compared to a maximum of 7 urchins
recorded per square meter in previous years. The lowest
density recorded per square meter was 0 urchins at all
depths observed below 7 m. Using the average densities
calculated for each depth category, the “Diadema zone”
2
spans from about 1.5 m –5.3 m (Figure 2). Standard devia-
tions in this survey tend to be relatively high because D.
antillarum cluster together in small patches and densities
are highly variable at any given location. Transects were
also placed in areas with varying substrate types, thus in
locations within the same depth range, different numbers of
urchins were found based on the bottom composition. Den-
sities inside and outside of this range of depths were signif-
icantly different, with a p-value of 0.0. A linear regression
was run to test the correlation between depth and density of
D. antillarum. There was a strong negative correlation with
density as depth increased based on the regression analysis
(Figure 3).
DISCUSSION
Diadema antillarum populations throughout the Carib-
bean have been slowly recovering after the die-off events
that occurred in the early 1980s and 1990s. The data ob-
tained in this study and similar studies in Discovery Bay
demonstrate that local D. antillarum populations have been
increasing over the past four years. Since 2010, the average
density has increased from 2.77 m-2
(Keller 2010) to 5.59 m
-2
in 2014. Diadema antillarum has few natural predators in
Jamaican reefs, although local fishermen often use them as
bait in fish pots. Without large storm events and the ab-
sence of species-wide diseases, the D. antillarum popula-
tion in Discovery Bay should continue to grow as space and
food remain available. However, due to the fact that D.
antillarum occupy such a narrow depth range and tend to
be arranged in a clustered formation, intraspecific competi-
tion might curb exponential growth rates.
Diadema antillarum have made such a substantial
recovery over the past few years that the “Diadema zone”
has been grazed to the point of bare substrate exposure in
most areas. It was also noted in this study that feeding scars
from the rigid mouth of D. antillarum were apparent on
some coral species such as Porites astreoides (Lamarck,
1816), as urchins have begun to graze on certain corals
because preferred algae have become less abundant in shal-
low waters. About 8.2% of the D. antillarum populations in
the Netherlands Antilles have been observed feeding on
coral surfaces (Bak and van Eys 1975). The zonation with
depth observed in this study was determined to be from
about 1.5 m–5.3 m, this range of depths is slightly shallow-
er than the depth range observed by Feldman (2012) which
found that the “Diadema zone” had previously been 2.5–
6.5m. In other studies, it has been concluded that D. antil-
larum have been recovering and abundant in shallow wa-
ters throughout the entire Caribbean (<6 m) (Carpenter
2006). Diadema antillarum continue to be most abundant
in this depth range because of the types of algae that are
prevalent in these areas as well as the types of substrates
that tend to occupy mid to shallow depths.
Further studies should be done in order to determine
the algal feeding preferences of D. antillarum versus other
urchin species and if that is significant in the depth zona-
tion of D. antillarum. Substrate type and complexity are
also factors that determine the areas in which D. antillarum
can be found. Out of 3,372 urchins counted during this
study, less than 5 were observed on bare sand (assumed to
be in transit), while some were found on flat, bare rock
substrates, and the remaining majority were found in cracks
and crevices or on rubble substrate. In a similar study in-
cluding rugosity measurements, it was found that there was
a strong correlation between substrate complexity, and ur-
chin density (Feldman 2012). Although it is apparent from
observation alone, further studies should continue to in-
clude substrate preferences to determine a statistically sig-
nificant effect on density.
Figure 2. The average density values for D. antillarum standard-
ized to a m-2
against depth. This graph shows that D. antillarum is
abundant in shallow depths and there are few to none below 6m.
The dashed lines represent the “Diadema zone” which ranges
from approximately 1.5–5.3 m.
Figure 3. Figure 3 shows the results of a linear regression analy-
sis with density (m-2
) as the dependent variable and depth as the
independent variable. This figure demonstrates the relationship
between urchin density and depth. The regression line shows that
there is a strong negative correlation between density and depth,
with an R2
value of 0.76 and an equation of y = -0.90x + 8.73.
KORALLION. VOL 5. 2014 3
The “Diadema zone” quantified in this study helps to
determine the present condition of D. antillarum popula-
tions. The “Diadema zone” typically contains smaller
amounts of algal coverage, and is suggestive of a reversal
in community structure. This data shows that the zonation
of D. antillarum has remained relatively the same in the
forereef from 2012–2014, but has become shallower. The
density of D. antillarum inside the “Diadema zone” is sig-
nificantly different than densities outside of this depth
zone. This demonstrates that the depths at which D. antil-
larum can be found are narrow and strict. Many similar
studies have shown that D. antillarum continue to occupy a
narrow depth range, however, based upon this study, that
depth range has changed from 2.5–6.5 m to 1.5–5.3 m. Fur-
ther studies will show whether or not this shallow zonation
will continue with time as the population continues to
grow.
There are many different factors that govern healthy
coral reef ecosystems, many of which are human-related.
Estimation of carrying capacities for reef fishes and urchins
should be established in order to prevent overfishing of
herbivorous grazers such as reef fishes and urchins. A re-
cent reversal in the D. antillarum density and surrounding
grazed areas show signs of Caribbean reef improvement as
urchin populations continue to expand. The presence and
abundance of D. antillarum is directly related to the percent
coral cover (Sammarco 1980). This relationship is due to
the limitation of competitive algae by D. antillarum. Herbi-
vore regulation by grazing is the major factor controlling
algal growth on reefs (Albert et al. 2008). Understanding
and maintaining urchin and fish populations will ensure
that corals will once again dominate Caribbean reefs.
ACKNOWLEDGMENTS
I would like to express my appreciation for the finan-
cial support of my family, and for the guidance and assis-
tance provided by E Burge. I also thank the staff of Discov-
ery Bay Marine Lab for allowing the use of their facilities
and equipment, and for providing constant aid. D Scarlett,
C Trench, O Holder, and D Edwards assisted with all div-
ing sessions, enabling the collection of data. Finally, I
thank my dive buddy M Esch who facilitated the dive por-
tion of this research.
LITERATURE CITED
Albert S, Udy J, Tibbetts IR. 2008. Responses of algal communi-
ties to gradients in herbivore biomass and water quality in
Marovo Lagoon, Solomon Islands. Coral Reefs. 27:73-82.
Alves FM, Chicharo LM, Serrao E, Abreu AD. 2003. Grazing by
Diadema antillarum (Philippe) upon communities on rocky
substrates. Scientia Marina. 67(3): 307-311.
Anthony KN, Fabricus KE. 2000. Shifting roles of heterotrophy
and autotrophy in coral energetics under varying turbidity. J
Exp Mar Bio Ecol. 252(2000): 221-253.
Bak RP, van Eys G. 1975. Predation of the sea urchin Diadema
antillarum Philippi on living coral. Oecologia. 20:111-115.
Carpenter RC, Edmunds PJ. 2006. Local and regional scale recov-
ery of Diadema promotes recruitment of scleractinian cor-
als. Ecol Letters. 9: 271-280.
Edmunds PJ, Carpenter RC. 2001. Recovery of Diadema antil-
larum reduces macroalgal cover and increases abundance of
juvenile corals on a Caribbean reef. Proc Natl Acad Sci
USA. 89(9): 5067-5071.
Feldman BA. 2012. The effects of depth rugosity on the distribu-
tion and density of Diadema antillarum at Discovery Bay,
Jamaica. Korallion. 3: 14-17.
Fitt WK, Brown BE, Warner ME, Dunne RP. 2001. Coral bleach-
ing: Interpretation of thermal tolerance limits and thermal
thresholds in tropical corals. Coral Reefs. 20: 51-65.
Keller J. 2010. Density and distribution of the long-spined sea
urchin, Diadema antillarum, with respect to rugosity at
Discovery Bay, Jamaica. Korallion. 1:31-36.
Mumby PJ, Hedley JD, Zychaluk K, Harborne AR, Blackwell
PG. 2006. Revisiting the catastrophic die-off of the urchin
Diadema antillarum of Caribbean coral reefs: Fresh insights
on resilience from a simulation model. Ecol Model. 196(1-
2): 131-148.
Sammarco PW. 1980. Diadema and its relationship to coral spat
mortality: Grazing, competition, and biological disturbance.
J Exp Mar Biol Ecol. 45: 245-272.
Sellers AJ, Casey LO, Burge EJ, Koepfler ET. 2009. Population
Growth and distribution of Diadema antillarum at Discov-
ery Bay, Jamaica. Open J Mar Bio. 3: 105-111.
Small AM, Adey WH. 2001. Reef corals, zooxanthellae and free-
living algae: A microcosm study that demonstrates synergy
between calcification and primary production. Ecol Eng. 16:
443-457.
Touse R. 2011. Density and distribution changes of Diadema
antillarum relating to depth and rugosity at Discovery Bay,
Jamaica. Korallion. 1: 14-19.
BALDWIN: DIADEMA ZONATION4
REEF COVERAGE AND SPECIES RICHNESS WITH RESPECT TO WATER
DEPTH AT DISCOVERY BAY, JAMAICA
Melanie M. Esch
Department of Marine Science, Coastal Carolina University, PO Box 261954, Conway, SC 29526
ABSTRACT
Recently, the community structure of the fore reef at Discovery Bay, Jamaica has been macroalgal dominated. Factors
important in controlling coral distribution in Jamaica include: hurricanes, coral bleaching, herbivorous fish, urchins, and
light. With less events in recent years that would inhibit the growth and expansion of corals, the reef may be transitioning
from its algal state. Living coral cover at 3 m–12 m depth has increased by 5% since 2006 and is now approximately 20%.
At Dairy Bull (a study site east of Discovery Bay), the corals dominated the reef at an average of 43% coverage at 9 m–12
m depth. The species richness increases during the transition from shallow to mid-waters and then is consistent to a depth
of 12 m. The coral coverage at the fore reef in Discovery Bay, Jamaica, is increasing, and may undergo a shift in domi-
nance within the next decade as a result of increasing amounts of grazing fish from the input of a fish sanctuary, the return
of Diadema antillarum, and the controlling of coral bleaching.
KEYWORDS: Percent coverage, coral community, macroalgae, depth zonation
This research was conducted as part of Coastal Carolina Universi-
ty’s classes MSCI 477, Ecology of Coral Reefs, and MSCI 499,
Directed Undergraduate Research in Discovery Bay, Jamaica, 14
–31 May 2014. Contact e-mail: mmesch@coastal.edu
INTRODUCTION
CORAL REEFS are one of the most highly productive
ecosystems on the planet. Their biological diversity
makes them crucial to the survival of tropical marine eco-
systems (Hoegh-Guldberg 1999). Coral reefs throughout
the Caribbean have several factors inhibiting the population
growth of many species. Overfishing, coral bleaching, sea-
level rise, predation, and hurricane damage are some short
term and long term conditions that weaken the development
of reefs which inhibit them to remain at a diversity equilib-
rium suited for this environment. The reefs of Discovery
Bay in northern Jamaica have shifted population dominance
over the 20th century from coral dominant to macroalgae
dominant due to natural and anthropogenic events (Idjadi et
al. 2006).
Hurricane Allen impacted the Discovery Bay area in
1980, affecting the coral reef communities in Jamaica. It
had been over 60 years since the last large hurricane hit
Discovery Bay. Prior to the destruction of the hurricane, the
percent cover of corals in the fore reef was 54% at a depth
of 30 m (Houston 1985). Immediately after impact, the
coral coverage was reduced to only 10% (Moses 2008).
Idjadi et al. (2006) found the percent coral cover in Dairy
Bull to be 23%, and increased to 54% after another nine
years in 2004. However, the coral coverage in the west
forereef did not recover as well as Dairy Bull. The west
forereef has had more time to recover and diversify its pop-
ulations since the Idjadi et al. (2006) study was conducted,
with fewer major resilience factors (events causing stress to
the corals) inhibiting the growth and production of the eco-
system.
Coral bleaching is another inhibiting factor that has
influenced the reefs at Discovery Bay. Bleaching occurs
when a coral’s thermal tolerance is exceeded (Hoegh-
Guldberg 1999). In 2005, the Caribbean experienced a
mass bleaching event. During this time, the temperature of
the shallow waters that the corals live in increased past the
thermal tolerance of the corals. This thermal stress stops the
process of photosynthesis within the organism causing it to
lose its color by releasing zooxanthellae making the body
of the coral turn white. All corals within Crabbe’s (2010)
study showed a significant decrease in abundance follow-
ing the bleaching event. Prior to this event, they had con-
sistently been recovering since Hurricane Allen (Crabbe
2010). Potential sea temperature rise throughout the 21st
century by 1–2°C could be extremely detrimental to coral
reefs (Hoegh-Guldberg 1999). The decline of reef systems
will also decrease tourism and fishing in tropical communi-
ties which will be detrimental to the success of local com-
munities that are dependent on funds from these sectors.
Over the summer of 1983, nearly the entire population
of Diadema antillarum died in a mass mortality event
caused by disease. The black spiny sea urchin had popula-
tions up to 71 urchins per m². A waterborne disease, dis-
tributed throughout the Caribbean by ocean currents infect-
ed and killed the urchins within 10 days (Moses 2008).
With this die off of the urchins, the algal population in-
creased rapidly. The urchins had been the primary herbi-
vores of the reef ecosystem in Discovery Bay; keeping a
population balance between the macroalgae and the corals.
The macroalgae coverage at shallower depths of the reef
KORALLION. VOL 5. 2014 5
increased nearly 20% between 5–15 m (Liddell and Ohl-
horst 1986).
Overfishing has also become a major issue effecting the
algae population on the reef. With the high fish demand in
Jamaica, local fishermen have stressed the fish populations.
With the decline in numbers of herbivorous fish and the
near extinction of the D. antillarum in Discovery Bay, the
algae community has taken over new niches on the reefs
(Moses 2008).
The diversity of coral correlates with the light gradient
in the water. All corals need sunlight to survive and photo-
synthesize, so the species richness decreases with depth.
Alves de Guimaraens et al. (1994) found that in Discovery
Bay the maximum diversity occurs at 6 m where the envi-
ronmental conditions are most favorable.
In the Idjadi et al. study in 2006, the fore reef of the bay
had a coral coverage of 15% and 60% coverage of algae.
However, at Dairy Bull the coral coverage is much higher
at 43% with an algae cover of only 6%.
Concluding this study, reef coverage and species rich-
ness was determined to show change in diversity. The cov-
erage of the two reefs, the fore reef and Dairy Bull, were
compared to past studies conducted in the same locations to
see if the reefs at Discovery Bay have continued to recover
since 2006.
METHODS
This study was conducted at two different sites near the
Discovery Bay Marine Lab; Dairy Bull and the west fore-
reef. Data was collected from May 19–24 of 2014. Both
sites had the same growth factors such as light, food, and
water quality. Both were less than 1 km off the shoreline
and had easy access to the DBML for frequent data collec-
tion. The reef complexity is similar at both sites, however
depths vary. The reef at Dairy Bull is essentially a constant
same depth because it is on a flatter shelf. Only one transect
of quadrats was collected starting at 7 m and continuing to
9 m. This data was included in the total coverage averages,
but was also separated and compared to the west fore reef.
The west fore reef was around 600 m long and provided
many sub-sites for research (Figure 1). Dairy Bull which,
was similar in length at 500 m, (Idjadi et al. 2006), but on
the opposite side of the channel was also used to collect
data.
Transects were placed parallel and perpendicular to the
shoreline between 3–12 m depth. A 1 m × 1 m quadrat
started at zero meters on each transect and then skipped one
meter before the next quadrat was placed. Pictures of each
quadrat were taken, along with pictures of each species
within the quadrat. Percent coverage of all four substrates
(coral, macroalgae, sponge, bare) were recorded and at
which depth the quadrat was placed. When considering
dead or bleached corals, these were represented as bare
coverage and not included in coral coverage. Data was col-
lected from 11 transects totaling 83 quadrats. Quadrat
depths were rounded to 3 m, 7 m, 9 m, and 12 m. This was
done to eliminate error when recording depth and to com-
pare more easily to other studies. Averages and standard
deviations were calculated to determine complete reef cov-
erage. Species richness refers to the number of species in a
community. For this study, the species richness showed the
number of species at each depth, as well as the change in
richness from shallow to mid-depth water.
RESULTS
The percent coverage of coral and algae changed with
depth (Figure 2). At 3 m corals dominated the reef with
25% coverage and algae covered only 6%. At 7 m the cov-
erage was very similar for coral and algae; coral was at
27% coverage and algae was at 29% coverage. At a depth
of 9 m, algae began to dominate the reef at 60% coverage
and coral only covered 14% of the reef. At the deepest rec-
orded depth of 12 m, algae still dominated the reef with a
coverage percent of 65% and coral was only at 12%. The
remaining coverage percentage at each depth was from the
averages of the bare substrate and sponges, but were not
important to this study.
When totaling the coverage at all depths, the overall
coverage of the forereef between 3 m and 12 m is algae
dominated (Figure 3). Algae coverage was 41% and coral
coverage was 20%. This data included the transect from
Dairy Bull.
The species richness of corals of Discovery Bay in-
creases from 3 m to 7 m and then is consistent up to 12 m
deep (Table 1). Some species of coral change with depth.
Porites astreoides and Acropora palmata were abundant in
shallow waters, whereas Meandrina meandrites, Scolymia
spp. and Dichocoenia spp. were only found in the mid-
waters (Table 1). At Dairy Bull, the average percent cover-
age was 42% and the average algae coverage was 6%
(Figure 4). This reef was a coral dominated reef.
Figure 1. The two locations of the reef survey, the forereef and
Dairy Bull.
ESCH: CORAL COVERAGE AND DIVERSITY6
fishing sanctuary within the bay in 2010. Research is cur-
rently being conducted on the effectiveness of the sanctu-
ary, but this may allow the population of herbivorous fish
to increase inside of the bay and eventually migrate out to
the forereef. Lastly, the amount of time since the last large
bleaching event has allowed the shallow water corals to
rebound and become more abundant.
Overall the forereef coverage of coral has increased
from 15% to 20% (Idjadi et al. 2006). This indicates that
the reef is on the verge of transitioning from an algal state
to a coral state, and within the next decade may become a
coral dominated reef. The data of the reef at Dairy Bull
showed that the percent coverage of coral was 43%, which
was a decrease of 12% since 2006 (Idjadi et al. 2006).
However, this may be because only one transect was taken
at Dairy Bull. If time and transportation had allowed further
data collection on this reef, than the results may be more
similar to previous studies.
Species richness increased to 3 m but was then continu-
ous until 12 m. The peak diversity was found at 7 m. Alves
de Guimaraens et al. (1994) found similar results with a
maximum diversity at 6 m. This supports the hypothesis of
the coverage transitional zone as competition between cor-
als and macroalgae at this depth is optimal. Looking at the
corals that are found only in shallow waters such as D. stri-
gosa and A. palmata these must require a higher intensity
of light than corals found in the mid-water such as M. me-
andrites and E. fastigiata. Further studies could compare
deeper waters to determine the effects of sunlight on coral
diversity.
Overall, this study supported Idjadi et al. (2006) in
showing that the forereef at Discovery Bay is still under an
algal dominance. In future years this may change to a coral
dominated reef depending on the inhibiting factors dis-
cussed throughout this study. The species richness hypothe-
sis was supported with the data collected and was also con-
sistent with the other studies discussed in this paper.
Figure 2. Reef coverage averages at each depth gradient of the
forereef. Error bars show the standard deviation of each coverage
category.
Figure 3. Percent coverage of the forereef between 3 m and 12 m.
Error bars show standard deviation.
Figure 4. Reef coverage at Dairy Bull. Error bars show standard
deviation.
DISCUSSION
In the 3 m water region of this study, coral dominated
the reef with almost 5 times greater the coverage than al-
gae. At 7 m depth the coverage of both algae and coral was
just below 30%. This is the transition depth for reef domi-
nation. Beyond 7 m the reef is algae dominated with >60%
coverage until 12 m depth.
A few factors can be taken into account for the coral
domination in the shallow waters on the reef. In 2006,
Bechtel et al. found that the D. antillarum population occu-
pied a percent area of 32% from a nearly 0% coverage after
the mortality event in 1983. The return of the urchin popu-
lation has controlled the abundance of macroalgae on the
rocky substrates in the shallow waters of the reef (Alves et
al. 2003). Another influence was the introduction of the
KORALLION. VOL 5. 2014 7
ACKNOWLEDGEMENTS
I thank all of the staff at the Discovery Bay Marine Lab
who all helped me with my study in a variety of ways. A
special thank you to the boat crew D Scarlett, O Holder, D
Edwards for assisting with diving. The entire Coastal Caro-
lina University group for supporting and encouraging pro-
gress with my study. My mom for using her credit card.
Lastly, my dive buddy A Baldwin for helping collect my
data and holding my unruly quadrat when needed.
Depths 3 m 7 m 9 m 12 m
Siderastrea radians +++ ++ +++ +++
Siderastrea siderea +++ ++ +
Porites astreoides +++ +++ +++
Porites porites +++ + ++ +++
Montastraea annularis +++ +++ +++
Montastraea
cavernosa
+ + +++
Agaricia agaricites +++ +++ +++ +++
Agaricia fragilis +
Millepora complanata +++ ++ + +
Millepora alcicornis + +
Eusmilia fastigiata + + ++
Meandrina meandrites + + +++
Scolymia spp. +
Dichocoenia spp. +
Diploria
labyrinthiformis
+ ++ ++
Diploria strigosa +++ ++ +
Colpophyllia natans ++
Isophyllastrea rigida + +
Madracis decactis +++ +++ +++ +++
Madracis auretenra ++ + ++
Acropora palmata +
Total: 11 16 15 15
Table 1. Species richness at depth gradients and all species abun-
dance found at each depth. Abundant (+++): >20%, common
(++): 2–19%, and rare (+): <2%.
LITERATURE CITED
Alves de Guimaraens M, Corbett C, Combells C. 1994. Species
diversity and richness of reef building corals and macroal-
gae of reef communities in Discovery Bay, Jamaica. Acta
Biologica Leopoldensia. 16(1): 41-50.
Alves F, Chicharo L, Serrao E, Abreu A. 2003. Grazing by Di-
adema antillarum (Philippi) upon algal communities on
rocky substrates. Sci Mar. 67(3): 307-311.
Andres N, Witman J. 1995. Trends in community structure on a
Jamaican reef. Mar Ecol Prog Ser. 118: 305-310.
Bechtel J, Gayle P, Kaufman L. 2006. The return of Diadema
antillarum to Discovery Bay: Patterns of distribution and
abundance. Proceedings of 10th International Coral Reef
Symposium. 367-375.
Crabbe M. 2010. Coral ecosystem resilience, conservation and
management on the reefs of Jamaica in the face of anthropo-
genic activities and climate change. Diversity. 2: 881-896.
Hoegh-Guldberg O. 1999. Climate change, coral bleaching and
the future of the world’s coral reefs. Mar Freshwater Res.
50: 839-866.
Huston M. 1985. Patterns of species diversity in relation to depth
at Discovery Bay, Jamaica. Bull Mar Sci. 37(3): 928-935.
Idjadi J, Lee S, Bruno J, Precht W, Allen-Requa L, Edmunds P.
2006. Rapid phase-shift reversal on a Jamaican coral reef.
Coral Reefs. 25(2): 209-211.
Liddell W, Ohlhorst S. 1986. Changes in benthic community
composition following the mass mortality of Diadema at
Jamaica. J Exp Mar Biol Ecol. 95: 271-278.
Moses C. 2008. Field Guide for Geology and Biology of Jamaican
Coral Reefs. SCUBAnauts International. 1-23.
ESCH: CORAL COVERAGE AND DIVERSITY8
Samantha M. Cook
Department of Marine Science, Coastal Carolina University, PO Box 261954, Conway, SC 29526
ABSTRACT
Discovery Bay, Jamaica presents a localized model of severe over-fishing to a coral reef ecosystem. In 2010, Discov-
ery Bay implemented a fish sanctuary with the hopes of rebuilding the fish stock within the bay. This study aimed to assess
differences between the fish communities within the sanctuary and the unprotected forereef using the Roving Diver Tech-
nique. 19 surveys lasting 20 minutes each were completed over the course of nine days. seven were performed within the
protected sanctuary and 12 were performed in the unprotected forereef. From this, percent sighting frequency, density
score, and abundance score were calculated and compared using a one-way ANOVA. It was found that there was no signifi-
cant difference between the surveys taken within and outside the bay. The size and number of four fish species important
to the fishery were also observed to see whether fish inside the sanctuary are reaching maturity. While the size data could
not be used, it was found that there was no significant difference between number of Sparisoma viride, Scarus taeniopterus,
or Cephalopholis cruentatas within two zones. There was a significant difference between the number of Haemulon sciu-
rus. This is thought to be due to their nocturnal migration. An ordination plot shows independent clustering of the two com-
munity structures. While it cannot be said with certainty that recovery to the fish stock is occurring, a difference in the com-
munity structure between the two areas was observed.
KEYWORDS: diversity, abundance, over-fishing, roving diver technique, Haemulon sciurus
This research was conducted as part of Coastal Carolina Universi-
ty’s classes MSCI 477, Ecology of Coral Reefs, and MSCI 499,
Directed Undergraduate Research in Discovery Bay, Jamaica, 14
–31 May 2014. Contact e-mail: smcook@coastal.edu
INTRODUCTION
CORAL REEFS offer one of the most biologically di-
verse ecosystems on the planet, with an estimated
biodiversity of 1–9 million species (Knowlton 2001). Dis-
covery Bay, Jamaica is dominated by some of the most
studied reefs anywhere in the Caribbean. The north shore
has a macroalgae- dominated fringing reef that runs 1.2 km
along Discovery Bay (Gayle and Woodley 1998). The bay
itself has a deep water channel in the center with shallow
sandy lagoons surrounding it, along with scattered coral
heads and patch reefs (Gayle and Woodley 1998). Over
the years these reefs have been marked with a series of
large-scale disturbances including Hurricane Allen in
1980, Hurricane Gilbert in 1988, and a continuous decima-
tion of herbivorous fish populations due to overfishing
(Andres and Witman 1995). Over-exploitation of fisheries
is not limited to just Jamaican waters but it is also seen as a
worldwide problem. Pauly et al. (1998) states that this
global crisis is due to economics and governance with a
natural fluctuation that is driven by demand. This fluctua-
tion, along with a lack of regulation and management, can
result in severe over-fishing of coral reefs.
While this occurs worldwide, Jamaica is a clear local-
ized model. The Jamaican near-shore fishery is mainly
artisanal, consisting of open canoes and swimmers who use
traps, hook-and-line, spears, and gill-nets (Andres and Wit-
man 1995). The intense local fishing has caused the Jamai-
can north coast coral reef to be among one of the most
overfished reefs in the English-Speaking Caribbean
(Andres and Witman 1995). Instead of quality fish such as
grouper and snapper, smaller, younger fish of other species
are being captured, and as a result, the breeding stock is
being seriously damaged (Woodley and Sary 2000). Haw-
kins and Roberts (2004) measured that the fishing intensity
around Discovery Bay (fishers/km reef) is 7.14, more than
double the next greatest (St. Lucia at 3.23). The Jamaican
fisheries are economically driven, however, they produce a
very low economic return. In 1988, the Discovery Bay Ma-
rine Lab implemented the Fisheries Improvement Program,
which aimed to work with and educate local fishermen with
the goal of hopefully implementing fishery management
measures. In 1994, the Alloa Discovery Bay Fishermen’s
Association agreed to section off an area of shallow water
on the west side of the bay which became known as the
Discovery Bay Fisheries Reserve. The success of the Re-
serve, shown by rebounding fish numbers, drove a petition
for its expansion and the desire to eventually change it into
a Fish Sanctuary. Unfortunately, after 1998 a lack of funds
made it impossible for a patrol to enforce the protection of
the bay and the indicators of overfishing once again began
to occur (Woodley and Sary 2000).
In 2010, the Ministry of Agriculture and Fisheries
stepped in along with seven state and non-governmental
OBSERVING THE EFFECTIVENESS OF THE DISCOVERY BAY FISH
SANCTUARY USING REEF SURVEY TECHNIQUES
KORALLION. VOL 5. 2014 9
bodies, including the Alloa Discovery Bay Fishermen’s
Association, to create a community-based movement that
would create nine fish sanctuaries on the island (Jamaican
Information Service 2010). These sanctuaries, including
Discovery Bay, were deigned as no fishing zones for the
protection of juvenile fish in hopes of rebuilding the fish
population to sustainable levels. They are considered Spe-
cial Fishery Conservation Areas (SFCA) under Section 18
of the Fishing Industry Act of 1975 and, as such, unauthor-
ized fishing activities within them are punishable by law.
The Discovery Bay Fish Sanctuary consists of every-
thing south of Old Man Head on the west forereef to Fort
Port on the east forereef. The fringing reef located outside
of the bay does not fall under protection and artisanal fish-
erman launch daily from the southeastern corner of the bay
as well as from the fishermans’ beach near the Discovery
Bay Marine Lab to fish the surrounding area outside of the
bay. The Discovery Bay Fish Sanctuary and its surrounding
reef presents the opportunity to study two similar over-
fished environments in which one has been changed in an
attempt to remedy the problem.
The focus of this study was to observe fish popula-
tions in two areas of Discovery Bay using the Roving Div-
er Technique. To determine the effects of overfishing, as
well as add on to an existing database, the fish survey was
conducted using the Reef Environmental Education Foun-
dation’s guidelines on a number of dive sites both in the
Fish Sanctuary and on the fringing reef surrounding the
boundaries of the bay. It was suspected that a more diverse
population with larger and older fish will be within the Fish
Sanctuary and that the surrounding fringing reef would
contain a less diverse population consisting of younger
fish.
Discovery Bay has played a key role in the regulation
of fisheries that make up Jamaica’s waters. The 2010 ac-
tion to make the inner bay a fish sanctuary while keeping
the surrounding area open to local fishermen presents the
unique opportunity to measure on how effectively the plan
has been to rebuild the fish population.
METHODS
Nineteen REEF surveys were conducted over nine
days during May 2014 at the Discovery Bay Marine Lab,
Jamaica. Locations of dive sites were split between pro-
tected and unprotected areas within and surrounding the
bay.
The fish survey was conducted using the Rover Div-
ing Technique (RDT). The Reef Environmental Education-
al Foundation favors this technique because it is unobtru-
sive and does not require many tools to get an accurate
reading on the fish population (Pattengill-Semmens and
Semmens 2003). It is especially useful for coral reefs
where fish are easily recognizable by distinctive markings
(Schmitt and Sullivan 1996). At each dive site, observa-
tions were made freely and each fish species seen was rec-
orded using a REEF identification slate. Because of time
constraints, surveys only occurred during the day. Each fish
was recorded based on four log10 abundance categories.
These include: single (1), few (2–10), many (11–100), and
abundant (>100) (Pattengill-Semmens and Semmens 2003).
At the end of the campaign, the survey data was submitted
to REEF via an online form. At the completion of each
dive, the dive site name, survey start time, visibility, aver-
age depth, water temperature, and habitat type was all rec-
orded for later analysis. Table 1 shows the name of the dive
site, the number surveys performed at the site, the average
depth, the total time, and the total species seen (Schmitt and
Sullivan 1996).
Sizes and specific counts of observed princess parrot-
fish (Scarus taeniopterus), Graysby grouper
(Cephalopholis cruentatus), French grunts (Haemulon
sciurus), and stoplight parrotfish (Sparisoma viride) were
also recorded. They were measured in approximations of 5
centimeters to respect the unobtrusive nature of a REEF
fish survey.
The data collected in the surveys was observed in
three sections, (1) total data gathered, (2) information gath-
ered outside of the bay, and (3) information gathered within
the fish sanctuary. Analysis was based off of REEF analy-
sis techniques as well as a more in depth statistical analysis.
Percent sighting frequency, density score, and abundance
score were calculated to observe the effectiveness of the
sanctuary. Percent sighting frequency (%SF) is the percent-
age of all dives in which the species or family was record-
Surveys
(no.)
Total
time
(min)
Avg.
depth
(m)
Total
species
Unprotected
Rio Bueno 1 20 27
M1 2 40 6.1 32
Shallow LTS 2 40 6.1 36
Dancing
Lady
3 60 6.1 40
LTS 3 60 6.1 41
Dairy Bull 1 20 9.1 30
Protected
Dorm Shore 2 40 12.1 32
Red Buoy 2 40 12.1 31
East Back
Reef
1 20 6.1 33
Back Reef 1 20 3 20
Little Blue
Hole
1 20 9.1 23
Table 1. Number of surveys performed at each site including total
observation time, average depth, and the total species counted.
The average depth at Rio Bueno was not collected.
COOK: FISH SANCTUARY EFFECTIVENESS10
DISCUSSION
The hypothesis stated at the beginning of the survey
predicted a more diverse population (with larger and older
fish) within the Fish Sanctuary than that of the surrounding
fringing reef, which was believed to contain a less diverse
population consisting of younger fish. Unfortunately, the
limited amount of size data collected within the time con-
straints made it unreliable to be used as a proxy for age. It
is to be noted though, that larger fish, especially princess
parrotfish and stoplight parrotfish, were seen within the bay
consistently at both Red Buoy and Dorm Shore. These ob-
servations imply that juvenile fish are able to reach maturi-
KORALLION. VOL 5. 2014
ed. It was calculated using the formula:
%SF= Dives species or family was recorded/Total
number of dives
Density score (Den) is the weighted average index
calculated for each family based on the frequency of obser-
vation in different abundance categories. It was calculated
as:
Den=((S)+(2F)+(3M)+(4A))/S+F+M+A
in which S, F, M, and A all represent frequency categories
(single, few, many, and abundant, respectively) and n is
equal to the total number of dives. This number is between
1 and 4 and indicates the abundance value of each species.
Abundance score (%SF x Den) was used to account for
density, frequency of occurrence, and zero observations
(Schmitt and Sullivan 1996). A statistical review examin-
ing %SF, density score, and abundance in protected and
unprotected areas was preformed using a one-way ANOVA
(Schmitt and Sullivan 1996 ). %SF was also observed for
the overall population. Species were divided into three cat-
egories: frequent (≥ 70%), common (7%<x<20%), and un-
common visitors (>20%).
Efficiency was examined (by clustering) using an or-
dination plot to observe community structure, species rich-
ness, and Simpson and Shannon diversity indexes. A stress
value, between 0 and 1, was calculated an indication of the
amount of scatter between points in the ordination plot.
Stress values below 0.2 are considered to give a relatively
accurate picture of the arrangement of data. The population
in relation to number of specific fisheries in the two areas
was assessed using the one-way ANOVA test.
RESULTS
Over the course of nine days, 11 sites were examined
for a total of 380 minutes. Of the 11 sites, five were within
the protected zone of the bay while six were on the unpro-
tected fore reef. At the end of the survey, the unprotected
zone had been surveyed for 240 minutes and the protected
zone for 140 minutes. The data from both sites was used to
discern the overall % sighting frequency. Within the 11
sites, 79 species were observed. Of these, 11 species were
considered to be frequent, 32 species were considered to be
common, and 24 species were considered uncommon visi-
tors (Table 2). A one-way ANOVA showed that there was
no significant difference between the protected and unpro-
tected zones in regards to % sighting frequency (p = 0.23),
density score (p = 0.30), or abundance score (p = 0.36).
While sizes of princess parrotfish, stoplight parrotfish,
Graysby grouper, and French grunt were observed, it was
determined that not enough information had been gathered
to make any reliable observations. Instead, the number of
each species inside and outside of the bay was compared by
way of a one-way ANOVA. It was seen that there was no
significant difference for the princess parrotfish (p = 0.47),
the stoplight parrotfish (p = 0.47), or the Graysby grouper
(p = 0.29). The abundance of French grunt was statistically
different with a p-value of 0.04.
An ordination plot was used to compare the similarity
of the community structure between the protected and un-
protected areas. It can be seen in Figure 1 that there is clear
separation between the two, with clustering occurring for
the protected and unprotected zones independent of one
another. The ordination value had a stress value of 0.14 and
from this the Simpson Diversity Index was also calculated.
The unprotected zone had an average of 0.77 while the pro-
tected zone had an average of 0.85. A one-way ANOVA
showed that there was a statistical significance between the
two (p = 0.01). The breakdown of diversity for each site
can be seen in Table 3. The Shannon Diversity Index was
also calculated. The protected zone had an average of 2.4
while the unprotected zone had an average of 2.3. A one-
way ANOVA showed that there was no significant differ-
ence between the two (p = 0.34) (Table 3). Species richness
was calculated as well. The protected zone had an average
of 23.87 while the unprotected zone had an average of
26.67 (Table 3). A one-way ANOVA showed that there
was no significant difference between the two.
11
Figure 1. Ordination plot showing independent clustering of the
community structures inside and outside of the sanctuary. A stress
level of 0.14 was found. Diamonds represent inside the bay, while
squares represent outside the bay.
COOK: FISH SANCTUARY EFFECTIVENESS12Table2.Allspeciesobservedoverthedurationofthesurvey.Frequentrepresentsa%SightingFrequencyof≥70%,common7%<x<20%,anduncommonvisitors>20%.Com-
monnames,scientificnames,andauthoritiesareincluded.
FrequentCommonUncommon
CommonNameScientificnameAuthorityCommonNameScientificNameAuthorityCommonNameScientificNameAuthority
BluechromisChromiscyanea(Poey,1860)FairybassletGrammaloretoPoey,1868FrenchangelfishPomacanthusparu(Bloch,1787)
BicolordamselfishStegastespartitus(Poey,1868)SaddleblennyMalacoctenustriangulatusSpringer,1959RockbeautyHolacanthustricolor(Bloch,1795)
StoplightparrotfishSparisomaviride(Bonnaterre,1788)FoureyebutterflyfishChaetodoncapistratusLinnaeus,1758GreatbarracudaSphyraenabarracuda(EdwardsinCatesby,
1771)
StripedparrotfishScarusiserti(Bloch,1789)BrownchromisChromismultilineata(Guichenot,1853)BandedbutterflyfishChaetodonstriatusLinnaeus,1758
PrincessparrotfishScarustaeniopterusDesmarestinBoryde
Saint-Vincent,1831
BeaugregoryStegastesleucostictus(Müller&Troschelin
Schomburgk,1848)
LongsnoutbutterflyfishPrognathodesaculeatus(Poey,1860)
SharpnosepufferCanthigasterrostrata(Bloch,1786)DuskydamselfishStegastesadustus(TroschelinMüller,
1865)
CocoadamselfishStegastesvariabilis(Castelnau,1855)
SharknosegobyElacatinusevelynae(Böhlke&Robins,1968)LongfindamselfishStegastesdiencaeus(Jordan&Rutter,1897)SergantmajorAbudefdufsaxatilis(Linnaeus,1758)
HarlequinbassSerranustigrinus(Bloch,1790)ThreespotdamselfishStegastesplanifrons(CuvierinCuvier&
Valenciennes,1830)
SpotteddrumEquetuspunctatus(Bloch&Schneider,
1801)
BlueheadwrasseThalassomabifasciatum(Bloch,1791)YellowtaildamselfishMicrospathodonchrysurus(CuvierinCuvier&
Valenciennes,1830)
SpottedmorayGymnothoraxmoringa(Cuvier,1829)
YellowheadwrasseHalichoeresgarnoti(ValenciennesinCuvier
&Valenciennes,1839)
SpottedgoatfishPseudupeneusmaculatus(Bloch,1793)YellowgoatfishMulloidichthysmartinicus(CuvierinCuvier&
Valenciennes,1829)
NeongobyElacatinusoceanopsJordan,1904CaesargruntHaemuloncarbonariumPoey,1860
GraysbyCephalopholiscruentata(Lacepède,1802)ConeyCephalopholisfulva(Linnaeus,1758)
FrenchgruntHaemulonflavolineatum(Desmarest,1823)BlackmargateAnisotremussurinamensis(Bloch,1791)
BarredhamletHypoplectruspuella(CuvierinCuvier&
Valenciennes,1828)
TomtateHaemulonaurolineatumCuvierinCuvier&
Valenciennes,1830
IndigohamletHypoplectrusindigo(Poey,1851)RainbowparrotfishScarusguacamaiaCuvier,1829
BarjackCaranxruber(Bloch,1793)YellowtailparrotfishScarushypselopterusBleeker,1853
QueenparrotfishScarusvetulaBloch&Schneider,1801BalloonfishDiodonholocanthusLinnaeus,1758
RedbandparrotfishSparisomaaurofrenatum(ValenciennesinCuvier
&Valenciennes,1840)
PorcupinefishDiodonhystrixLinnaeus,1758
RedtailparrotfishSparisomachrysopterum(Bloch&Schneider,
1801)
SouthernstingrayDasyatisamericanaHildebrand&
Schroeder,1928
TobaccofishSerranustabacarius(CuvierinCuvier&
Valenciennes,1829)
LongjawsquirrelfishNeoniphonmarianus(CuvierinCuvier&
Valenciennes,1829)
YellowtailsnapperOcyuruschrysurus(Bloch,1791)ClownwrasseHalichoeresmaculipinna(Müller&Troschelin
Schomburgk,1848)
BlackbarsoldierfishMyripristisjacobusCuvierinCuvier&
Valenciennes,1829
GlasseyesnapperHeteropriacanthus
cruentatus
(Lacepède,1801)
LongspinesquirrelfishHolocentrusrufus(Walbaum,1792)MackerelscadDecapterusmacarellus(CuvierinCuvier&
Valenciennes,1833)
SquirrelfishHolocentrusadscensionis(Osbeck,1765)
BluetangAcanthuruscoeruleusBloch&Schneider,1801
DoctorfishAcanthuruschirurgus(Bloch,1787)
OceansurgeonAcanthurusbahianusCastelnau,1855
BlackdurgonMelichthysniger(Bloch,1786)
CreolewrasseClepticusparrae(Bloch&Schneider,
1801)
SlipperydickHalichoeresbivittatus(Bloch,1791)
TrumpetfishAulostomusmaculatusValenciennes,1837
RedlionfishPteroisvolitans(Linnaeus,1758)
cate a rebounding fish stock. It was seen that there was no
statistical difference between the princess parrotfish, stop-
light parrotfish, or Graysby grouper but there was statistical
significance seen between the French grunt population
within the protected and unprotected zones. While fishes
belonging to the family Haemulidae are severely overfished
in Jamaica, it’s believed that more French grunts were seen
within the bay primarily due to the time when the surveys
occurred. Grunts are nocturnal predators who leave the bay
to forage on the forereef and surrounding sandflats at night
(Burke 1995). Because all surveys occurred during the day,
few grunts were seen on the fore reef and larger schools
were seen within the bay. The correlation between the pro-
tected zone and the number of French grunts cannot be
determined with certainty because of this nocturnal migra-
tory pattern.
A similar, long-term monitoring project is occurring
in Oracabessa Bay, a designated fish sanctuary also located
on Jamaica’s northern coast. In October 2011, a baseline
survey was completed within the sanctuary. They also
found a high biomass of parrotfish (159 g/100 m2
) and sur-
geonfish (39.85 g/100 m2
) with lower biomasses within the
grunts and groupers (1.93 g/100 m2
and 14.99 g/100 m2
respectively) (Anonymous 2011). An examination of size
showed that parrotfish, grunts, and groupers fell into the
juvenile to sub-adult class ranges, most likely due to over-
fishing. In 2012, a follow up showed that within the sanctu-
ary there was a 287.2% change in the fish biomass and a
15.95% change in the overall size of the fishes
(Anonymous 2012). This implies that with a larger data
pool, the sanctuary at Discovery Bay may also show similar
results indicative of recovery.
An ordination plot was used to look at the similarity
of the community structures between the protected and
unprotected areas in Discovery Bay. As seen in Figure 1,
there is a clear separation between the two. The low stress
value of 0.14 indicates that the fish communities sustained
within each are significantly different. The Simpson Diver-
sity Index was also calculated, and a one-way ANOVA
showed that the biodiversity between the protected and
unprotected areas was different. However, the species rich-
ness and Shannon Diversity Index did not show a signifi-
cant difference. A further insight to the makeup of the fish
communities within the two areas would need to be deter-
mined before a conclusion was made about the similarity of
diversity between the two locations.
ACKNOWLEDGMENTS
This study could not have been completed without the
continuous help of the Discovery Bay Marine Lab. Special
thanks to the dive team who got us where we needed to be
and kept an ever-optimistic attitude. Thank you also to Dr.
E Burge whom was forever patient with my never-ending
stream of questions. Thanks to B Hinze who was the most
amazing dive buddy a person could ask for and to all the
Table 3. Species richness, Shannon Diversity Index, and Simpson
Diversity Index for each survey performed within the protected
and unprotected zones. There was statistical significance seen
between the Simpson Diversity Index within and outside the bay
but not for the Species Richness or the Shannon Diversity Index.
ty within the sanctuary. This is promising as Hughes (1994)
discussed that over the last 30 to 40 years that herbivores
such as scarids (parrotfish) and acanthurids (surgeonfish)
have increased in number over predatory species, but de-
creased in size. This is seen especially along north shore,
where half the species are caught below the minimum re-
productive size (Hughes 1994). Further surveys consisting
of longer than the 20-minute maximum time should be tak-
en to get a more accurate idea of the general size of the
fishes within the bay.
In place of age proxy by size, the overall count of
individual fish belonging to certain fisheries was analyzed
in hopes of seeing a larger number within the bay to indi-
KORALLION. VOL 5. 2014 13
Species
Richness
Shannon
Index
Simpson
Index
Unprotected
5/17 Rio Bueno 27 2.2 0.92
5/17 M1 25 2.1 0.92
5/18 M1 34 2.1 0.75
5/18 Shallow LTS 33 2.4 0.82
5/20 Dancing Lady 32 2.4 0.93
5/20 Shallow LTS 25 2.3 0.94
5/21 LTS 20 2 0.93
5/21 Dancing Lady 28 2.3 0.79
5/23 Dancing Lady 28 2.3 0.78
5/23 LTS 34 2.3 0.74
5/24 Dairy Bull 30 2.1 0.78
5/25 LTS 28 2.9 0.94
Average 28.7 2.3 0.85
Protected
5/25 Dorm Shore 19 2.6 0.79
5/23 Dorm Shore 23 1.2 0.74
5/24 Red Bouy 25 2.1 0.78
5/25 East Back Reef 33 2.2 0.83
Back Reef 23 2.8 0.79
5/27 Little Blue Hole 22 2.8 0.8
5/27 Red Bouy 22 2.8 0.8
Average 23.9 2.4 0.79
participants of the 2014 Jamaica Maymester who made this
experience unforgettable. Finally, thank you to my parents
for supporting me through this entire endeavor.
LITERATURE CITED
Anonymous. 2011. Oracabessa Fish Sanctuary Baseline
Survey Assessment. 2011, October. National Environ-
mental and Planning Agency. Available from http://
www.oracabessafishsanctuary.org/
oracabessa_bay_sanctuary_legal_documents_files/
NEPA%20Baseline%20info.pdf
Anonymous. 2012. Oracabessa Bay Fish Sanctuary: Year 2- Sum-
mary Report. National Environmental and Planning Agency.
Available from http://www.oracabessafishsanctuary.org/
oracabessa_bay_sanctuary_legal_documents_files/
OBFS%202011%20Monitoring%20Data.pdf
Andres NG, Witman JD. 1995. Trends in community structure on
a Jamaican reef. Mar Ecol Prog Ser. 118:305-310.
Burke NC. 1995. Nocturnal foraging habitats of French and
bluestriped grunts, Haemulon flavolineatum and H. sciurus,
at Tobacco Caye, Belize. Environ Biol Fish. 42(4): 365-374.
Hawkins JP, Roberts CM. 2004. Effects of artisanal fishing on
Caribbean coral reefs. Conserv Biol. 18(1): 215-226
Hughes TP. 1994. Catastrophes, phase shifts, and large-scale deg-
radation of a Caribbean coral reef. Science. 265(5178): 1547
-1551.
Knowlton N. 2001. The future of coral reefs. Proc Natl Acad Sci
USA. 98(10): 5419-5425
Jamaican Information Service. 2010. No-fishing zones established
under marine-protection MOU. The Gleaner. Retrieved from
http://jamaica-gleaner.com/gleaner/20101212/business/
business4.html
Pattengill-Semmens CV, Semmens BX 2003. Conservation and
management applications of the REEF volunteer fish moni-
toring program. Environ Monit Assess 82: 43-50.
Pauly D, Christensen V, Dalsgaard J, Froese R, Torres F. 1998.
Fishing down marine food webs. Science. 279 (5352): 860-
863.
REEF. (2014) Geographic Zone Report. Retrieved from http://
www.reef.org/db/reports/geo/twa/53030028
Schmitt EF, Sullivan KM (1996). Analysis of a volunteer method
for collecting fish presence and abundance data in the Flori-
da Keys. Bull Mar Sci. 59(2): 404-416.
Special fishery conservation areas (SFCA). 2014. Web. 4 Mar
2014. Available from: http://www.moa.gov.jm/Fisheries/
fish_sanctuary.php
COOK: FISH SANCTUARY EFFECTIVENESS14
KORALLION. VOL 5. 2014
DENSITY, RESIDENCE TIME, AND INDIVIDUAL ASSOCIATION OF
FLAMINGO TONGUE SNAILS (CYPHOMA GIBBOSUM) ON GORGONIAN HOSTS
Catharine C. Gordon
Department of Marine Science, Coastal Carolina University, PO Box 261954, Conway, SC 29526
ABSTRACT
The relationship between Cyphoma gibbosum and their gorgonian hosts is a parasitic relationship. Cyphoma gibbosum
use the gorgonians as a food source, mating grounds, and substrate for egg deposition. This study increases knowledge of
the density of both C. gibbosum and their gorgonians hosts in Discovery Bay, Jamaica. The movement of the snails in terms
of residence time and association between snail pairs was examined. Samples were taken on the west forereef by SCUBA
diving. Thirteen, 8 m diameter sites were sampled and snails were marked with a microfile to track their movement. Over
the 653.45 m2
sampled, a total of 138 gorgonians and 13 C. gibbosum were observed. On average, there were 21.1 gorgoni-
ans per 100 m2
(±13.0). The gorgonian species Gorgonia flabellum was most abundant over the sample area (15.6 individu-
als per 100 m2
± 8.3). On average, there were 2.9 C. gibbosum individuals per 100 m2
(±1.0). A majority of the C. gibbo-
sum were found on G. flabellum. The residence time of the snails on a gorgonian individual ranged from 2 to 4 days. While
snails were found individually a majority of the time, there was an overall significant association between snail pairs ob-
served meaning they tended to move together.
KEYWORDS: Flamingo tongue, gorgonians, parasitism, micropredation, Discovery Bay
This research was conducted as part of Coastal Carolina Universi-
ty’s classes MSCI 477, Ecology of Coral Reefs, and MSCI 499,
Directed Undergraduate Research in Discovery Bay, Jamaica, 14
–31 May 2014. Contact e-mail: ccgordon@coastal.edu
INTRODUCTION
GORGONIAN CORALS are commonly found in tropical
shallow waters (4–10 m) in groups with multiple spe-
cies (Gerhart 1990). The primary factors which determine
the distribution of gorgonians are water movement, light,
and availability of firm substrate for settling (Kinzie 1973).
In water depths 3–9 m Gorgonia flabellum (Linnaeus,
1758), Plexaurella homomalla (Esper, 1792), and Plexaura
flexuosa (Lamouroux, 1821) are very abundant (Kinzie
1973).
Gorgonian morphology serves to maximize surface
area (Leversee 1976); G. flabellum are a large, flat and foli-
ose species and P. flexuosa have branching patterns allow-
ing them to increase their surface area. All species of gor-
gonians are loosely flexible, an adaptation which allows
them to move back and forth in the water column. Gorgoni-
ans generally orient themselves perpendicular to the domi-
nant hydrodynamic factors; this allows them to sway back
and forth in the water column and filter feed (Leversee
1976).
One of the most common gorgonian predators is the
ovulid gastropod, Cyphoma gibbosum (Linnaeus, 1758),
also known as the flamingo tongue snail (Chiappone et al.
2003). Cyphoma gibbosum are relatively small (2.5 cm
long) and most commonly found in the sub-tidal zone
(Gerhart 1986, Nowlis 1993). Flamingo tongue snails have
a pale yellow shell and a brown spotted mantle. When un-
disturbed, these snails extend their mantle up and around
their shell covering it completely. These gastropods feed on
the axial tissue and polyps of the gorgonians causing partial
colonial mortality (Chiappone et al. 2003). Gorgonians also
provide protection and serve as grounds for mating and egg
deposition for C. gibbosum (Lasker et al. 1988).
Cyphoma gibbosum gorgonian grazing habits have
notable control over the abundance of the coral population
(Lasker and Coffroth 1988). Snail populations typically
remain relatively constant with a small increase in the sum-
mer months. Because the C. gibbosum population is gener-
ally unchanging, grazing activity is also relatively constant
(Lasker and Coffroth, 1988). The grazing on the gorgoni-
ans exposes their axial skeletons leaving behind a feeding
scar discolored from the surrounding tissue (Gerhart 1990).
The exposed skeleton allows greater diversity on the reef as
it serves as colonization sites for larval organisms and algae
(Gerhart 1990). While the increased diversity is positive,
when the exposed skeleton is colonized it is sometimes
difficult for the tissue to be regenerated and could eventual-
ly cause full death of the gorgonian (Harvell and Suchanek
1987).
This study took place in Discovery Bay, Jamaica from
May 15 through May 27, 2014. Hogfish, Lachnolaimus
maximus (Walbaum, 1792) are natural predators of C. gib-
bosum and have experienced a large population decline
because of the overfishing throughout the reef, which has
15
allowed the snail population to increase (Gayle and Wood-
ley 1998, Chiappone et al. 2003). Higher densities of C.
gibbosum can lead to increased feeding on the gorgonian
hosts in turn affecting gorgonian density and growth.
In previous research, there were never more than three
snails on a single gorgonian at one time with majority of
the hosts only occupied by a single snail and only twenty-
eight percent of the surveyed gorgonians had two occupants
(Snyder 2013). Other research found that C. gibbosum are
normally found in pairs, one male and one female
(Chiappone et al. 2003). Associations between snail pairs
will be examined to resolve the discrepancy between
Snyder (2013) and Chiappone et al. (2003).
This study serves to measure the relative densities of C.
gibbosum and their gorgonian hosts. The results found in
this study were added to the data obtained by Snyder
(2013) to gain a more comprehensive picture of the Discov-
ery Bay, Jamaica area. The residence time of individual
flamingo tongue on their gorgonian hosts was measured
and predicted to be around 3.3 days based on Harvell and
Suchanek (1987). Because the study area and time were
closely associated with Snyder (2013), it was predicted
snails will not move together between gorgonians.
METHODS
All sampling occurred in Discovery Bay, Jamaica
along the coral reef where there was a high abundance of
the gorgonian host corals with snails or feeding scars pre-
sent. Because C. gibbosum occur mostly in areas where
water depth is relatively shallow, all sampling occurred in
water 8 m or less. The areas sampled were on the seaward
side of the west forereef at dive locations M1, Dancing
Lady (DL), and Long Term Site (LTS). Using SCUBA
diving, 13 circular sample sites were chosen and labeled 1–
13 (Table 1). Sites were chosen at random at a range of
depths.
Each circular site measured 8 m in diameter. A 4 m
piece of string was tied to a dead piece of coral, with ten-
sion on the string a circle was made around the marked
center point. For each circular sampling site, the number
and species of gorgonian were counted as well as the num-
ber of C. gibbosum. On gorgonians in the sample area
where flamingo tongue were present, the number of snails
per gorgonian was counted.
The depth and a compass bearing relative to the Dis-
covery Bay Marine Lab were also taken per sample site. A
plastic water bottle filled with air was tied to the center
point and labeled with the site number to mark the site.
Density was calculated for flamingo tongue snails, each
gorgonian species, and the gorgonian class overall at each
individual sample site and averaged for the overall sample
area. The percentage of gorgonians occupied by at least one
C. gibbosum was compared with the percentage unoccupied
to determine whether there was a greater majority of hosts
with or without occupants.
Residence time was calculated based on the number
of days an individual flamingo tongue was located on a
particular colony. A marking was etched onto each C. gib-
bosum in the sample area using a microfile. The procedure
used to make the markings was adapted from Lasker et al.
(1988), it entailed picking up an individual gastropod, mak-
ing the appropriate mark, and replacing the snail at the base
of the gorgonian. This procedure was used because, while
the markings are permanent, they do not alter the appear-
ance of the C. gibbosum greatly and they are not harmful to
them (Harvell and Suchanek 1987, Lasker et al. 1988). It
allowed the snails to be handled only briefly and does not
noticeably change their behavior (Harvell and Suchanek
1987). The coral where the flamingo tongue was present
was also marked. Markings were made on the first day of
sampling at each location. In the following days, sites were
revisited to see whether the marked individual had moved
from the original colony.
The number of gastropods per gorgonian was record-
ed to determine whether C. gibbosum move together be-
tween colonies. In the following days, paired individuals
were observed. The number of times the snails were seen
together and the total number of times they were observed
(whether they are together or apart) was recorded. The as-
sociation formula, A1,2 = O1,2 / Omax where A1,2 is the asso-
ciation, O1,2 is the number of times snail 1 was observed
with snail 2, and Omax is the total number of times snail 1 or
2 was observed (whichever was observed more was used)
Site Location
Depth
(m)
Compass Bearing
1 M1 16 210o
NE
2 LTS 17 180o
N
3 LTS 19 200o
NE
4 DL 22 210o
NE
5 DL 14 210o
NE
6 LTS 14 200o
NE
7 DL 18 200o
NE
8 DL 24 180o
N
9 DL 15 220o
NE
10 DL 11 230o
NE
11 LTS 19 200o
NE
12 DL 23 210o
NE
13 DL 17 210o
NE
Table 1. Site number, location, depth, and compass bearing rela-
tive to the Discovery Bay Marine Lab for each randomly chosen
sample site.
GORDON: FLAMINGO TONGUE RESIDENCE TIME16
KORALLION. VOL 5. 2014
was used (Lasker and Coffroth 1988). If A1,2 is greater than
0.5 then there is a significant association between the snail
pair. From the pairs, the average A1,2 value and standard
deviation was calculated to see if there was an overall sig-
nificance in the association between gastropod pairs.
RESULTS
A total area of 653.45 m2
was sampled during this
study. In the sample area, a total of 138 gorgonians of five
different species were observed. A total of 13 C. gibbosum
individuals were observed on nine different gorgonian indi-
viduals. Nine C. gibbosum were found on G. flabellum, two
were found on both P. flexuosa and Eunicea sp., and no
snails were found on any other surveyed gorgonians.
On average, there were 21.1 gorgonians per 100 m2
(±
13.0) (average ± standard deviation). Gorgonia flabellum
was most abundant with 15.6 individuals per 100 m2
(±
8.3). Plexuara flexuosa were found with 5.7 individuals per
100 m2
(± 4.4). Pseudoptergorgia sp. and Eunicea sp. were
similarly abundant with 3.0 individuals per 100 m2
(± 1.4)
and 2.1 individuals per 100 m2
(± 1.4) respectively. Plexau-
rella homomalla was least abundant with 0.3 individuals
per 100 m2
(± 0).
On average, there were 2.9 C. gibbosum per 100 m2
(±
1.0). In the sample area, 6.52% of the gorgonians sampled
were occupied by at least one flamingo tongue snail. The
majority of gorgonians in the sample area were not occu-
pied by any snail (93.48%) though many had feeding scars
present.
Because each site was not visited on a daily basis it
was not possible to calculate a residence time for each C.
gibbosum individual, instead a range was calculated for the
Snail Marking 19-May 20-May 21-May 23-May 24-May 25-May 27-May
1 l Intial Absent
2 ll Initial Present Absent Absent
3 llllll Initial Present Present
4 lll Initial Absent
5 llll Initial Absent Absent
6 lllll Initial Present Present
7 lllllll Initial Absent
8 ll/l Initial Absent
9 l/l Initial Present
10 ll/ll Initial Present
11 lll/lll Initial Absent
12 llll/llll Initial Absent
13 lll/lll Initial Absent
overall sample population. The minimum residence time
for the sample population was 2 days while the maximum
residence time was 4 days (Table 2). Of the 13 snails ob-
served, a majority were found on G. flabellum (Figure 2).
No snails were observed on Pseudopterogorgia sp. or P.
homomalla.
Of the thirteen snails observed, four pairs of snails
were observed together. Snails observed together both at
initial marking period and in the following days were con-
sidered to be paired and used to calculate the association
variable (A1,2). The average association variable was 0.708
(± 0.344). Because the average association variable was
greater than 0.5 the data represents a significant association
between the paired C. gibbosum individuals.
DISCUSSION
The results are consistent with the results of Snyder
(2013) as G. flabellum were most abundant and P. flexuosa
second most abundant. Snyder (2013) found the density of
C. gibbosum to be 9.9 individuals per 100 m2
(± 7.7), which
is approximately five times greater than snail density in this
study. This discrepancy is plausible because Snyder sought
out sites where at least one flamingo tongue snail was pre-
sent whereas areas with high gorgonian densities were used
for sites in this study.
Snyder (2013) found a higher abundance of corals to
be occupied by C. gibbosum, 20% compared to 6.52% in
this study. This discrepancy is because Snyder surveyed
more individual sites (26 compared to 13). While the per-
cent occupancy differed greatly, the Gorgoniidae family
was occupied most often in both studies.
Table 2. Table of marked snails and the dates they were observed. Initial represents the day the snail was initially marked, present and
absent in the following days represents the dates the sites were revisited and whether or not the snail was present on the original coral. All
snails were observed between 0700 and 1200. The minimum residence time was 2 days (snail 5) and the maximum was 4 days (snail 3).
17
The average number of snails and density of the C.
gibbosum at each site is comparable to the values of flamin-
go tongue snail observed in the Florida Keys (Chiappone et
al. 2003). The density of C. gibbosum in the Florida Keys
ranged from 0 (± 0) to 4.2 (± 1.2) individuals per 100 m2
and there were 2.00 individuals per 100 m2
(± 1.31) on av-
erage (Chiappone et al. 2003). The maximum density from
the Florida Keys was greater than the values in this study,
but the average densities of C. gibbosum are closely relat-
ed.
Since the sample size of gorgonians, flamingo tongue
snails, and the area of the reef sampled were small, the re-
sults could differ greatly if a larger sample was used. The
small sample size could also attribute to the differences
between this study and Snyder (2013). Obtaining a larger
sample size was difficult due to the time constraints of this
study.
The residence time of C. gibbosum ranged from 2 to 4
days, which was a fairly short residence time that supported
the hypothesis of this study. Harvell and Suchanek (1987)
also studied residence time but returned to each site on a
daily basis and had an average residence time of 3.3 days.
Their average residence time falls within the range of this
study confirming the range is accurate. Cyphoma gibbosum
use the gorgonian hosts primarily for food but they also are
used for protection and reproduction. This is because the
snails move searching not only for more food but also for
the most protected colony or one suitable for reproduction.
One pair of snails (numbers 11 and 12) were observed at
the base of coral colony near newly deposited egg cases.
The base of this coral was fairly protected from swimming
predators confirming the movement prediction. The gorgo-
nian serves other purposes than just food, which could be a
reason why the residence time is so short. To improve the
residence time data, in another study, sites would be
marked one at a time and returned to on a daily basis until
the marked gastropods were no longer present. This would
allow the calculation of an individual residence time for
each snail. Observations could be made on the activity of
the gastropods while present on the gorgonian to observe
what they use the gorgonian for most between feeding,
protection, and reproduction.
Chiappone et al. (2003) found C. gibbosum in pairs
the majority of the time; the results from this study were
not consistent with this conclusion. Of the four pairs of
snails observed in this study, all but one exhibited signifi-
cant association (A1,2 > 0.5); the average association varia-
ble also showed overall significant association between
snail pairs. Lasker and Coffroth (1988) collected associa-
tion data at 3 sites in the San Blas Islands, Panama; two of
the three sites showed significant association of C. gibbo-
sum individuals, a conclusion consistent with this study. A
possible reason for this association could be mating. It is
possible that snails 11 and 12 could be a male and female
pair who had just laid their egg case.
This study served to increase knowledge of the densi-
ty of flamingo tongue snails and gorgonians in Discovery
Bay, Jamaica. By combining the data from this study with
that of Snyder (2013), future researchers will have a more
comprehensive understanding of gorgonian and C. gibbo-
sum populations of west forereef area.
ACKNOWLEDGMENTS
I would like to thank E Burge for selecting me to partic-
ipate in MSCI 477/499 Jamaica Maymester course as well
as all the guidance he gave me on my project. I would also
like to thank S Luff, D Scarlet, and Snow for all their help
with the diving portion of my project from driving to the
boat to marking my sites. Thank you to C O’Shea for being
a supportive dive buddy and helping me to collect my data.
Finally, thank you to Coastal Carolina University and the
Discovery Bay Marine Laboratory for their support in un-
dergraduate research efforts and allowing me to use their
facilities and equipment.
LITERATURE CITED
Chiappone M, Diene H, Swanson D, Miller S. 2003. Density of
gorgonian host occupation patterns by flamingo tongue
snails (Cyphoma gibbosum) in the Florida Keys. Caribb J
Sci. 39:11 6-1 27.
Gayle PMH, Woodley JD. 1998. Discovery Bay, Jamaica. Carib-
bean coral reef seagrass and mangrove sites. Paris:
UNESCO. p. 17-33.
Gerhart DJ. 1986. Gregariousness in the gorgonian-eating gastro-
pod Cyphoma gibbosum: Tests of several possible causes.
Mar Ecol Prog Ser. 31:255-263.
Gerhart DJ. 1990. Fouling and gastropod predation: consequences
of grazing for a tropical octocoral. Mar Ecol Prog Ser. 621:
103-108.
Harvell CD, Suchanek TH. 1987. Partial predation on tropical
gorgonians by Cyphoma gibbosum (Gastropoda). Mar Ecol
Prog Ser. 38:37-44.
Kinzie RA, III. 1973. Coral reef project papers in memory of Dr.
Thomas F. Goreau. 5. The zonation of West Indian gorgoni-
ans. Bull Mar Sci. 23:93-155.
Lasker HR, Coffroth MA, Fitzgerald LM. 1988. Foraging patterns
of Cyphoma gibbosum on octocorals: The roles of host
choice and feeding preference. Biol Bull. 1 74:254-266.
Lasker HR, Coffroth MA. 1988. Temporal and spatial variability
among grazers: Variability in the distribution of the gastro-
pod Cyphoma gibbosum on octocorals. Mar Ecol Prog Ser.
43:285-295.
Leversee, GJ. 1976. Flow and feeding in fan-shaped colonies of
the gorgonian coral, Leptogorgia. Biol Bull. 151: 344-356.
Nowlis JP. 1993. Mate- and oviposition-influenced host prefer-
ence in the coral-feeding snail Cyphoma gibbosum. Ecolo-
gy. 74:1954-1969.
Snyder N. 2013. Density, prevalence, host preference, and relative
damage of flamingo tongue gastropods (Cyphoma gibbo-
sum) on gorgonian hosts in Discovery Bay, Jamaica. Koral-
lion. Coastal Carolina University Studies in Coral Reef
Ecology. 4:10-14.
GORDON: FLAMINGO TONGUE RESIDENCE TIME18
TUBE AND VASE SPONGE DIVERSITY, ABUNDANCE, AND DENSITY OF
THEIR SYMBIONT, OPHIOTHRIX SUENSONII
Tiffany M. Beheler
Department of Marine Science, Coastal Carolina University, PO Box 261954, Conway, SC 29526
ABSTRACT
Discovery Bay, Jamaica has a fringing reef which is an ideal habitat for Porifera. Sponges are the simplest multicellu-
lar organisms, as well as the most prominent, abundant, and diverse component in a Caribbean sub-rubble reef community
(Diaz and Rutzler 2001). They are a foundation species within the reef and have an important symbiotic relationship with
the brittle star Ophiothrix suensonii. The sponges in Discovery Bay are crucial to the reef and the brittle stars. They pro-
vide housing and the brittle star helps the sponge by cleaning the surface. The relationship between O. suesonii and marine
sponges benefits the health and diversity of coral reefs. During the month of May 2014, 125 sponges were surveyed at the
Discovery Bay Marine Laboratory. Of the 125 sponges surveyed, 43 brittle stars were observed. Niphates digitalis housed
30.23% of brittle stars. Past studies by Henkel and Pawlik (2005) have found that O. suensonii and N. digitalis are associat-
ed with each other. Brittle stars did not vary between site and sponge species. However, the average sponge surface area
differed intraspecifically. Xestospongia muta had the largest average surface area.
KEYWORDS: symbiotic relationship, brittle stars, density, surface area, Discovery Bay
This research was conducted as part of Coastal Carolina Universi-
ty’s classes MSCI 477, Ecology of Coral Reefs, and MSCI 499,
Directed Undergraduate Research in Discovery Bay, Jamaica, 14
–31 May 2014. Contact e-mail: tmbehele@coastal.edu
INTRODUCTION
DISCOVERY BAY, JAMAICA is home to a fringing reef
that is continuous across the mouth of the lagoon vir-
tually cutting the bay off from the sea (Gayle and Woodley
1998). The reefs found here are home to numerous phyla,
Porifera being one of them. Marine sponges thrive on coral
rubble and are very common in Discovery Bay because the
reef is composed mainly of skeletons of Acropora palmata
(Lamarck, 1816) and Millepora complanata (Lamarck,
1816) (Gayle and Woodley 1998). However, the sponge
population has not always been diverse and abundant. In
1980, Hurricane Allen struck the north coast of Discovery
Bay, negatively impacting the reefs and thus, the marine
sponges (Wilkinson and Cheshire 1988). Prior to the hurri-
cane the reef contained dense thickets of Acropora cervi-
cornis (Lamarck, 1816), and some were destroyed which
buried multiple species of sessile invertebrates (Wilkinson
and Cheshire 1988). In 1983, the sponge population was
again depleted due to an epidemic of Diadema antillarum
(Lamarck, 1814) (Gayle and Woodley 1998). This reduc-
tion led to an increase in non-crustose algae, prohibiting the
success of sponges. The sponge population has bounced
back since the decline in 1980, and has had a positive influ-
ence on the reef.
Sponges are the simplest multicellular marine organ-
isms. These sessile invertebrates are prominent on the reef
at various depths. Sponges, in some instances, have been
known to have higher species composition and diversity
compared to coral and algae. Sponges are an important
functional and structural component of coral reefs because
they provide refuge to a wide range of infauna (Henkel and
Pawlik 2005). A recent publication suggested sponges com-
prise 60% of all the sessile cryptic species making them a
crucial part of coral reefs in Curaçao and Bonaire (Diaz and
Rutzler 2001).
Even though many species seek out sponges for ref-
uge; sponges still have predators of their own. Sponges
avoid predation through physical and chemical deterrents
such as spicules which can work in conjunction with chem-
ical deterrents (Wulff 2006). These defenses make sponges
a prime habitat refuge for many different species. Different
species of small, secondary sponges, crustaceans, cnidari-
ans, echinoderms, molluscs, polychaetes, and bryozoans
have all exhibited some association with sponges (Wulff
2006). Diaz and Rutzler found 192 species of crustaceans,
ophiuroids, mollusks, and fishes inhabiting the reef spong-
es, Aplysina lacunosa (Pallas, 1766) and Aplysina archeri.
Being able to provide refuge to a large abundance of spe-
cies ensures diversity among the reef. Their association
with other organisms, by providing refuge, is one of the
characteristics that make sponges a crucial component of
coral reefs (Bell 2008).
There are several theories as to why brittle stars seek
out sponges as a preferred habitat, one of which is for pro-
tection. Brittle stars have predators from a range of phyla
but most of their predators are other echinoderms, crusta-
ceans, and fish (Warner 1971). Warner (1971) found that
39% of fish and crustaceans from the British Isles had the
brittle star Ophiothrix fragilis (Abildgard, 1789) in their
KORALLION. VOL 5. 2014 19
stomachs. Brittle stars exhibit negative phototaxis and some
species even have bioluminescence deterrents (Hendler
1984). The most effective predator deterrent is occupying
sponges. In order to temporarily separate themselves from
predators, brittle stars often utilize their negative phototaxis
by only feeding at night for extra protection (Henkel and
Pawlik 2014). Recent studies found that the predation on
brittle stars controls the distribution of brittle stars on the
reef, leading them to inhabit sponges (Henkel and Pawlik
2005).
Another reason for this brittle star and sponge associa-
tion could be competition for space. Space is limited on
coral reefs; therefore various cryptic organisms form asso-
ciations with sessile invertebrates (Henkel and Pawlik
2005). When organisms seek out sponges for a habitat it
leaves other spaces on the reef open which increases the
reef’s diversity. In addition, Turon et al. (2000) proposed
the sponge created currents carrying food particles increas-
ing food availability for the brittle star. Brittle stars feed on
seston, which fine particulate organic matter, easily carried
in the sponge created current (Warner 1971). While the
brittle star is in the sponge it can extend its arms out
through the sponge tubes, usually feeding at night (Henkel
and Pawlik 2014). It is unclear if brittle stars choose spe-
cific sponges based on phenotypic variation, the presence
of chemical defenses, or the size of the host. Their associa-
tion with marine sponges may be commensal, mutualistic,
or even parasitic (Henkel and Pawlik 2014).
Several studies have examined why brittle stars prefer
certain sponges. Between the two species of brittle star,
Ophiothrix lineata (Lyman, 1860) was the most abundant
and 99% of them were found on Callyspongia vaginalis
(Henkel and Pawlik 2005). Callyspongia vaginalis is the
most common sponge on Caribbean reefs with 79.1% of
Ophiothrix suensonii (Lütken, 1856) residing in C. vaginal-
is. In addition to living inside the sponge for protection,
Hendler (1984) found that the sponge also benefits from
having brittle stars as a resident. When the outside of the
sponge was covered with marine sediment, the resident
brittle stars cleared sediment off the sponge benefiting both
the brittle star and the sponge (Hendler 1984). This mutu-
alistic relationship also increases the survival of the brittle
star, reaffirming the protection hypothesis (Hendler 1984).
The aforementioned studies determined that their associa-
tion was commensal and even mutualistic. In addition to
being commensal, and sometimes mutualistic, Henkel and
Pawlik (2014) found that O. lineata are also larval parasites
of sponges.
The association between C. vaginalis and O. lineata
has always been thought of as mutualistic because the brit-
tle stars clean off sediments on the outside of the sponge
(Hendler 1984). However, Henkel and Pawlik (2014) want-
ed to determine if O. lineata was parasitic to C. vaginalis
and discovered that C. vaginalis individuals, without the
brittle star present, release significantly more larvae than
those with the brittle star. However, the growth of these
brittle stars did not vary between brooding and non-
brooding C. vaginalis (Henkel and Pawlik 2014). Since
fewer larvae were released from C. vaginalis individuals
with brittle stars Henkel and Pawlik (2014) concluded that
O. lineata is a larval parasite on C. vaginalis.
METHODS
During May 2014, 125 sponges from various species
were measured in Discovery Bay, Jamaica at the Discovery
Bay Marine Laboratory. There were eight different sam-
pling sites. Two locations, Dorm Shore and East Back Reef
were inside the bay and the remaining sites were located
outside of the bay (Figure 1). A total of 31 five meter tran-
sects were haphazardly placed at the different sampling
locations. Barrel and vase sponge species were measured 1
meter out from each side of the transect (10 m2
). The oscu-
lar diameter and sponge height was measured and recorded
at depth with a standard ruler. Later the surface area was
calculated by using SA = 2π × oscular radius (cm) × tube
height (cm) (Henkel and Pawlik 2005). All transects were
conducted while SCUBA diving.
Each sponge measured was observed for presence of
the brittle star O. suensonii. This was done through visual
observations without cutting open the sponges. The brittle
stars were counted if they were present and on the sponge.
In total, 43 O. suensonii were observed. Authorities and
species listed in Table 1.
An ANOVA was run to determine if there was a sig-
nificant difference in the number of brittle stars on each
species of sponge as well as if the number of brittle stars
varied between the eight different sampling locations. The
sponge and brittle stars densities at each site were convert-
ed 100 m2
. A linear regression was run to determine if there
was a relationship between the number of brittle stars and
the sponge surface area.
Figure 1. Eight sample sites were used to determine sponge diver-
sity in Discovery Bay, Jamaica; Skeggy Reef (1), LTS (2), Dorm
Shore (3), M1 (4), East Back Reef (5), Dairy Bull (6), Litman’s
Ledge (7), and East Litman’s Ledge (8).
BEHELER: SPONGE DIVERSITY20
RESULTS
The sponge species richness did not vary significantly
between the eight different sampling sites. Ten different
species of sponges were observed at the different locations
(Table 1). The species richness varied from 2 to 6 species
per site (Table 1). East Back Reef had the lowest species
richness with only having two species present; Niphates
digitalis and Aplysina fistularis (Table 1).
Brittle stars were found at all of the sampling locations
except for the East Back Reef. There was no significant
difference in brittle star densities between the seven loca-
tions (Figure 2, p-value = 0.24). M1 was home to 30.23%
of the brittle stars which was the highest percentage (Figure
2). The three sites with the smallest density were LTS, Lit-
man’s Ledge, and East Litman’s Ledge (Figure 2).
The average number of brittle stars per 100 m2
was not
significantly different between sponge species (p-value =
0.09). Ophiothrix suensonii was never observed in V. gi-
gantea, O. bartschi, N. nolitangere, and A. archeri. On
average S. zeai had a higher brittle star density; however,
N. digitalis had 30.23% of the total number of brittle stars
(Figure 3). While N. digitalis had most of the brittle stars
the average density was the second least at 3.33 brittle stars
per 100 m2
along with X. muta (Figure 3). On average A.
fistularis had the lowest density of 0.85 brittle stars per 100
m2
(Figure 3).
The sponge surface area was significantly different be-
tween all ten species of sponges (p-value < 0.00). Xes-
tospongia muta had an average surface area of 1581.45 cm2
which was the largest out of all ten species (Figure 4). The
smallest average surface area was A. fistularis and was
Figure 2. There was no significant difference between average
density of brittle stars (BS/100 m2
) and the site (p-value = 0.24).
M1 had the highest density while East Back Reef had the lowest
with a value of 0 BS/100 m2
. Dorm shore and Skeggy Reef were
close in density with 5.83 BS/100 m2
and 6 BS/100 m2
respective-
ly.
Figure 3. There was no significant difference in the average brit-
tle star density (BS/100 m2
) and sponge species (p-value = 0.09).
Four species, V. gigantean, O. bartschi, N. nolitangere, and
A.archeri did not have any brittle stars on them..
Table 1. Average sponge densities (sponges/100 m2
) at the eight different sampling locations. S. zeai and N. nolitangere were only found
at Dorm Shore, and A. archeri was only found at M1. The highest density of sponges was present at LTS (200 sponges/100 m2
). The
highest average density of sponges was A. fistularis. Species richness is also shown for each site. M1 has the highest richness.
KORALLION. VOL 5. 2014 21
Sponge Species Litman's
Ledge
LTS Dorm
Shore
Dairy
Bull
Skeggy
Reef
East Back
Reef
East Litman's
Ledge
M1 Average
Agelas conifera (Schmidt, 1870) 0 200 0 50 20 0 20 10 37.5
Alpysina archeri (Higgin, 1875) 0 0 0 0 0 0 0 10 1.25
Alpysina fistularis (Pallas, 1766) 100 10 0 100 60 70 20 40 50
Callyspongia plicifera (Lamarck, 1814) 10 10 0 0 10 0 0 30 7.5
Neofibularia nolitangere (Duchassaing & Michelotti, 1864) 0 0 10 0 0 0 0 0 1.25
Niphates digitalis (Lamarck, 1814) 10 0 10 60 30 10 30 50 25
Oceanapia bartschi (de Lubenfels, 1934) 0 0 50 60 0 0 0 0 13.75
Svenzea zeai (Alvarez, van Soest, & Rutzler, 1998) 0 0 50 0 0 0 0 0 6.25
Verongula gigantea (Hyatt, 1975) 10 10 0 0 10 0 0 0 3.75
Xestospongia muta (Schmidt, 1870) 30 0 0 0 10 0 0 10 6.25
Species Richness 5 4 4 4 6 2 3 6
Figure 4. There was a significant difference in the average sponge
surface area (cm2
) and sponge species (p-value < 0.00). The larg-
est average surface area was found in X. muta (1581.45 cm2
) and
the lowest was A. fistularis (124.25 cm2
).
124.25 cm2
(Figure 4). Two species, N. nolitangere and A.
archeri, had the same surface area of 392.07 cm2
(Figure
4). There was no significant relationship between sponge
surface area (cm2
) and the number of brittle stars (R2
=
0.01).
Table 1 shows the sponge densities at each sampling
location as well as the average density overall. The most
abundant sponges were A. fistularis which had an average
density of 50 sponges per 100 m2
(Table 1). Litman’s
Ledge and Dairy Bull had the highest densities of A. fistu-
laris which was 100 sponges per 100 m2
(Table 1). When
looking at individual sites, LTS had an A. conifer density of
200 sponges per 100 m2
which was the highest density out
of all the species as well as all the sites (Table 1). There
were two species, N. nolitangere and A. archeri, that had an
average density of 1.25 sponges/100 m2
which was the low-
est of the densities (Table 1).
DISCUSSION
Brittle stars are highly associated with sponges. Previ-
ous research has shown that they mainly seek out sponges
for refuge (Henkel and Pawlik 2005). Of the sponge species
observed 30.23% of brittle stars were found on N. digitalis
(Figure 3). This is somewhat concurrent with Henkel and
Pawlik (2005) who found that 19.4% of O. suensonii were
found on N. digitalis. The most abundant sponge in their
research was C. vaginalis which also housed the most brit-
tle stars (Henkel and Pawlik 2005). The most abundant
sponge species in Discovery Bay was A. fistularis however
it did not contain the most brittle stars. This could be be-
cause A. fistularis has chemical defenses that may hinder
the productivity of the brittle star as well as having a small
average surface area. It is known that O. suensonii seeks
out sponges for protection. The reason the brittle star
chooses N. digitalis and C. vaginalis in other studies is di-
rectly related to their physical characteristics (Henkel and
Pawlik 2005). According to Henkel and Pawlik (2005) C.
vaginalis and N. digitalis lack chemical defenses which
could be the reason the brittle stars thrive on them. Brittle
stars, such as O. suensonii will feed on the mucus that is
on the outside of the sponge and chemical sponge defens-
es can hinder their feeding productivity (Henkel and
Pawlik 2005).
According to Henkel and Pawlik (2014) densities of
O. lineata were positively correlated with the size of C.
vaginalis. This was expected in this experiment but there
was no significant relationship between the average
sponge surface area (cm2
) and brittle star densities. It has
been demonstrated by Henkel and Pawlik (2005) that
surface area is important to the brittle star. A larger sur-
face area allows for more refuge space for sponge while a
smaller oscular diameter limits the size of the predator
that can enter the sponge (Henkel and Pawlik 2005). Brit-
tle stars also exhibit negative phototaxis which could be a
reason densities were relatively low in most of the
sponge species (Hendler 1984). Surveys done at night
would increase the brittle star densities because they
actively feed at night and would easily be seen. Another
factor effecting density is brittle star spawning which
normally peaks in June (Turon et al. 2000). Juvenile brit-
tle stars typically lay on the surface of the sponge in plain
sight while the adults are more cryptic and stay inside the
tubes of the sponge (Turon et al. 2000). This could be a
reason brittle star densities were low compared to re-
search done by Henkel and Pawlik (2005).
While there was no relationship between average
sponge surface area and brittle star density, there was a
difference in sponge surface area between the ten differ-
ent species of sponges. The physical characteristics, os-
cular diameter and sponge height, of N. digitalis is simi-
lar to that of C. vaginalis which explains why in the ab-
sence of C. vaginalis, N. digitalis becomes the dominate
refuge for O. suensonii (Henkel and Pawlik 2005).
Brittle star densities in Discovery Bay are fairly
uniform between different sites and sponge species. The
most abundant sponge in Discovery Bay is A. fistularis. It
was found at all eight sites but is not highly associated
with the brittle stars most likely due to its chemical de-
fenses. Most places on the reef have similar species rich-
ness which is most likely due to similar environmental
conditions.
ACKNOWLEDGMENTS
I would like to thank the Discovery Bay Marine
Laboratory and their staff for housing us and taking care
of us during our stay. A big thank you to O Holder and D
Edwards for taking us out on the boats and assisting with
data collection. I would also like to thank M Sporre, C
Raynor, A Galarno, and S Luff for assisting me with my
research, and my classmates for making this a fun and
BEHELER: SPONGE DIVERSITY22
memorable trip. Finally, I would like to thank E Burge for
the opportunity and support throughout my project.
LITERATURE CITED
Bell JJ. 2008. The functional roles of marine sponges. Estuar
Coast Shelf Sci. 79: 341-353.
Diaz MC, Rutzler K. 2001. Sponges: An essential component of
Caribbean coral reefs. Bull Mar Sci. 69: 535-546.
Gayle P.M.H, Woodly, J.D. 1988. Discovery Bay, Jamaica. In:
Kjerfve B., editor. CARICOMP- Caribbean coral reef,
seagrass and mangrove sites. Paris: UNESCO 17-33.
Hendler G. 1984. Brittlestar color-change and phototaxis
(Echinodermata: Ophiuroidea: Ophiocomidae). Mar Ecol.
5:379-401.
Hendler G. 1984. The association of Ophiothrix lineata and Cally-
spongia vaginalis: Brittlestar-sponge cleaning symbiosis?
Mar Ecol. 5: 9-27.
Henkel TP, Pawlik JR. 2014. Cleaning mutualist or parasite?
Classifying the association between the brittle star Ophio-
thrix lineata and the Caribbean reef sponge Callyspongia
vaginalis. J Exp Mar Biol Ecol. 454: 42-48.
Henkel TP, Pawlik JR. 2005. Habitat use by sponge-dwelling
brittlestars. Mar Biol. 146:301-313.
Turon X, Codina M, Tarjuelo I, Uriz MJ, Becerro MA. 2000.
Mass recruitment of Ophiothrix fragilis (Ophiuroidea) on
sponges: Settlement patterns and post-settlement dynamics.
Mar Ecol Prog Ser. 200: 201-212.
Warner GF. 1971. On the ecology of a dense bed of the brittle-star
Ophiothrix fragilis. J Mar Biol Ass UK 51: 267-282.
Wilkinson CR, Chesire AC. 1998. Growth rate of Jamaica coral
reef sponges after hurricane allen. Biol Bull. 175: 175-179.
Wulff JL. 2006. Ecological interactions of marine sponges. Can J
Zoo. 84: 146-166.
KORALLION. VOL 5. 2014 23
STUDIES IN CORAL REEF ECOLOGY24
KORALLION. VOL 5. 2014 25
STUDIES IN CORAL REEF ECOLOGY26
This research was conducted as part of Coastal Carolina Universi-
ty’s classes MSCI 477, Ecology of Coral Reefs, and MSCI 499,
Directed Undergraduate Research in Discovery Bay, Jamaica, 14
–31 May 2014. Contact e-mail: ajgalarn@coastal.edu
DEPTH DISTRIBUTION, SIZE FREQUENCY, AND TIP COLOR POLYMORPHISM
OF THE GIANT SEA ANEMONE, CONDYLACTIS GIGANTEA, OF DISCOVERY
BAY, JAMAICA
Ashton J. Galarno
Department of Marine Science, Coastal Carolina University, PO Box 261954, Conway, SC 29526
ABSTRACT
The giant sea anemone, Condylactis gigantea, of Discovery Bay, Jamaica was studied in three areas around the
bay in a depth range from 0 to 15 meters below sea level. Tip color polymorphism, depth distribution, and size frequency of
the three populations of anemones were recorded and compared. It was observed that green morphs were more common on
the forereef and pink morphs were more popular in the lagoon and inside the bay. These observations suggest that pink
morphs are more successful at adapting because they occupy more diverse niches in comparison to the green morphs. Over-
all, there was a significant but only weak (r2
= 0.106) correlation between depth occurrence and the anemone size in the
pink tipped anemones. In the green tipped anemones, there was no correlation (r2
= 0.056) between the size and depth of
occurrence. The two most common tip color morphs, pink and green, did not have a significant difference in their depth
distributions.
KEYWORDS: Condylactis, distribution, size, polymorphism, Discovery Bay
INTRODUCTION
THIS STUDY was based out of the Discovery Bay Ma-
rine Laboratory (DBML). Discovery Bay is located in
the west-central portion of the northern coast of Jamaica.
The area of the bay is 1.4 km2
and has a maximum depth of
around 55 meters. The bay is almost entirely cut off from
the open sea because of continuous fringe reefs that spans
across the 1.2 km mouth of the bay (Gayle and Woodley
2007). The three observations sites are the lagoon, a reef
inside the bay (Dorm Shore), and the forereef. Figure 1
shows the areas of study.
The bay has great geological diversity due to the mul-
tiple ecosystems it supports and the subtropical climate.
These ecosystems include: coral reefs, sea grass beds, man-
groves, rocky platforms, sand flats, limestone shores, and
sandy beaches (Warner and Goodbody 2005). Of all of
these ecosystems, coral reef structures are one of the most
important because they provide the substratum matrix on
which many other species depend. Space is a very limiting
resource on reefs, so the competition for space is a signifi-
cant feature of coral reef ecology. Sea anemones are rela-
tively sessile carnivores that are classified as one of the
main organisms, along with reef building corals, sponges,
and algae, competing for space on coral reef structures.
Anemones consist of a large individual polyp with numer-
ous tentacles and some species contain zooxanthellae, pho-
tosynthetic endosymbionts, within their tissues. Since sea
anemones must occupy areas that are well lit and they must
be situated in a way that allows them to make use of a prey
resource, their spatial requirements are very restricted
(Sebens 1976). Coral reefs offer many substratum types
that are well suited for sea anemone habitats due to the
three dimensional nature of reefs. The giant sea anemone,
Condylactis gigantea (Weinland 1860), is generally found
in crevices of walls of rock, attached to shells, rocks, or any
other hard substrate in relatively shallow waters with access
to sunlight (Hanlon 1986). Movement allows them to ac-
cess new areas of substratum before other forms of antho-
zoans; if local conditions start to deteriorate they can
change their location (Sebens 1976). The coral reef ecosys-
tem in Discovery Bay, Jamaica is suited to sustain a large
population of the giant sea anemone, C. gigantea.
The northern coast of the country is mostly sheltered
from large oceanic swells by Cuba, which is approximately
150 km north. The bay has diurnal tides with tidal ranges
between 15 cm and 60 cm, which affect the amount of light
anemones receive because the depth of water is constantly
changing near shore. The local wind patterns determine the
standard wave regime for the area, which can range from
flat and calm to very choppy seas with waves reaching over
1.5 meters (Gayle and Woodley 2007). These large waves
are capable of re-suspending sediments from the bottom of
the shallow back reef within the bay. These sediments can
be suspended on an order of days, which restricts coral
growth. Severe degradation of coral reefs comes primarily
from large increases in sedimentation. Small particles of
KORALLION. VOL 5. 2014 27
sediment can smother organisms, like sea anemones, that
live on reefs. Sediments also reduce the light availability
for zooxanthellae that use photosynthesis, which is one of
the ways that sea anemones get their nutrients (Porter
1990). High sedimentation rates can lower the growth rate
of reef accretion, which means, in the long run, there will
be less space for sea anemones to inhabit. Sedimentation
can alter the highly complex interactions between sea
anemones and corals and any other living organism that
depends on the reef for survival. The decline in amount of
space and shelter a reef can provide leads to a drop in the
number of individuals that a reef can support. Also, heavy
sedimentation can end up killing reef building corals which
leads to the collapse of the entire framework of the reef
(Porter 1990). This can be devastating to sea anemones
because they are mostly sessile and depend entirely on the
reef to provide a stable habitat.
Condylactis gigantea inhabits a wide spectrum of cor-
al reef habitats and displays multiple phenotypes, especially
with respect to tip color. The different distributions of ge-
netic and phenotypic variations can provide insight into
local adaption. Along the coast of Discovery Bay, anemo-
nes with pink or green tips on their tentacles show distinct
distributions. The green morphs are found more abundantly
in the shallow forereef, whereas the pink morphs are found
mostly in the deeper areas and in the lagoon itself (Stoletzki
2005). Light is a vital spatially varying factor in coral reefs,
especially for the anemones that rely on photosynthetic
endosymbionts (Brown 1997). The amount of transmitted
sunlight through water depends on the clarity and depth of
the water at a certain location. An ecological trait, like tip
color in anemones, can differ depending on the radiation
level. Even though there are a variety of color morphs
found at many locations, the depth distribution suggests
that the two color morphs are adapted to different sunlight
radiation levels (Stoletzki 2005).
The purpose of this study was to investigate the rela-
tionship between size, depth distribution, and tip color of
the giant sea anemone. It was hypothesized that there will
be differences in tip color relative to depth due to light at-
tenuation and that their size will vary with depth distribu-
tion due to different light and nutrient levels. Size is pre-
dicted to have a direct correlation with depth, in that small-
er anemones will be deeper due to less light attenuation.
METHODS
The data was collected in May, 2014 at the Discovery
Bay Marine Laboratory in Discovery Bay, Jamaica. Thirty
different visual surveys were conducted to determine the
population density of C. gigantea. Ten surveys were con-
ducted at each sampling area; specific locations for surveys
within each are were selected for based on the presence of
C. gigantea. The first area that was observed was the shal-
low lagoon that is adjacent to the marine laboratory. The
second observational area was a reef inside the bay called
Dorm Shore. The third area observed was the front side of
the forereef, which is located outside of the bay. A sample
area is defined as a circle with a radius of 2 meters that was
measured by using a transect tape. Sample areas were set
by a 3 foot long rebar pole that was hammered into the sub-
strate and the transect tape was attached to the pole at one
end and the other end of the tape was pulled in a circle. By
means of SCUBA diving and snorkeling, every individual
sea anemone in the study area was counted and measured.
The depth range that was used was from sea level, 0 m, to
15 m. The depth at which each sea anemone is located was
recorded with an OCEANIC Pro Plus 3 dive computer. A
dive flashlight was used to determine the actual tip colors
of each individual anemone; this is to account for light ab-
sorption as depth increases. To obtain the dimensions of the
anemone diameter, a tentacle tip was pinched causing the
anemone to contract, and then a ruler was used to measure
the diameter along the longest axis of the ellipsoidally
(Wirtz 1996).
An analysis of variance, ANOVA, was done to ana-
lyze the differences between the group means of depth and
size at the three sampled locations. A two sample t-test
assuming equal variances was also used to test the signifi-
cance between the sampling characteristics. The correlation
between the disk size of individuals and how the sizes var-
ied with depth was determined through a test of linear re-
gression. The average sizes and depths of the pink morphs
were compared to those of the green morphs.Figure 1. A map of Discovery Bay, Jamaica that shows the local
bathymetry where the data were collected. The arrows point to the
3 locations, the lagoon, forereef, and inside the bay (Dorm Shore),
where data were collected.
GALARNO: CONDYLACTIS POLYMORPHISM AND DISTRIBUTION28
RESULTS
In total there were 240 anemones measured, 180 pink
tipped and 60 green tipped. Of the 180 pink tipped anemo-
nes, two were found on the forereef, 101 were counted in
the lagoon, and 77 were seen at Dorm Shore. There were
26 green tipped anemones found in both the lagoon and on
Dorm Shore and 8 were found on the forereef. There was
no statistical significance between the tip colors at all three
sampling locations (ANOVA; p-value = 0.37, f-calc =
1.39). There was not a significant difference in the tip col-
ors between the forereef and lagoon (t-test; p-value = 0.56,
df = 2, t-stat = 0.686). Between the forereef and Dorm
Shore there was no significant difference between the tip
colors (t-test; p-value = 0.62, df = 2, t-stat = 0.583). There
was a significant difference between the tip colors of the
lagoon and Dorm Shore (t-test; p-value = 0.034, df = 2, t-
stat = 5.25).
The average diameter of all C. gigantea surveyed was
19.98 cm, the maximum was 53 cm and the minimum was
3 cm (Figure 2). The size distribution of sea anemones rela-
tive to tip color was not significantly different between the
forereef and Dorm Shore (t-test; p-value = 0.619, df = 2, t-
stat = -0.58). There was no significant difference in the size
relative to tip color between the forereef and lagoon (t-test;
p-value = 0.396, df = 2, t-stat = -1.07). Between the lagoon
and Dorm Shore, there was no significant difference be-
tween tip color and size of anemone (t-test; p-value =
0.908, df = 2, t-stat = 0.131). There were no significant
differences between the means for diameter size of anemo-
nes relative to tip color between the three locations
(ANOVA; p-value = 0.15, f-calc = 3.89; Figure 3).
The average depth of all C. gigantea surveyed was
4.566 m, the minimum depth was 0.762 m and the maxi-
mum depth was 14.63 m. There was no significance relat-
ing to the depth distribution of anemones relative to tip
color between the forereef and lagoon (t-test; p-value =
0.69, df = 2, t-stat = -0.46). Between the forereef and Dorm
Figure 2. Size frequency of the total pink and green tipped anem-
ones found at all three sampling locations.
Shore there was no significance between depth and tip col-
or (t-test; p-value = 0.347, df = 2, t-stat = -1.22). There was
also no significance between the lagoon and Dorm Shore (t
-test; p-value = 0.994, df = 2, t-stat = -0.008). Comparing
all three locations showed that there were no significant
relationships between the average depths of occurrence
relative to tip color (ANOVA; p-value = 0.075, f-calc =
6.96; Figure 4).
The linear regression plot for the green tipped anemo-
nes on the forereef showed that there was a very weak cor-
relation between anemone size and their depth of occur-
rence (r2
= 0.22; Figure 5). However, there were only two
pink tipped anemones found on the forereef, so a linear
regression line could not accurately be plotted. There was
no correlation between the pink tipped anemones in the
lagoon (r2
= 0.06). The green tipped anemones in the la-
goon had no correlation between size and depth distribution
(r2
= 0.009, Figure 6). On the Dorm Shore reef, the pink
tipped anemones showed no correlation (r2
= 0.062). The
Figure 3. Average size of pink and green tipped anemones rela-
tive to their location.
Figure 4. Average depths of occurrence relative to tip color at all
three of the sampling locations.
KORALLION. VOL 5. 2014 29
green tipped anemones found on Dorm Shore showed an
incredibly weak or almost no correlation (r2
= 0.13; Figure
7). When the location was disregarded the pink tipped
anemones had a very weak correlation between size and
depth of occurrence (r2
= 0.16). Overall, the green tipped
anemones showed no correlation between depth and size (r2
= 0.056; Figure 8).
Figure 5. Linear regression plot for the pink and green tipped
anemones found on the forereef. There were two pink tipped
anemones in this area, so the regression line can be disregarded
for accuracy purposes. The green tipped anemone r2
value is .22
and the equation is y = -1.27x + 33.37.
Figure 6. Linear regression plot for the pink and green tipped
anemones found in the lagoon. There was no correlation for pink
or green tip color, with r2
values of 0.06 and 0.009 respectively.
Figure 7. Scatter plot for the pink and green tipped sea anemones
found off of Dorm Shore. The r2
value for the pink tipped anemo-
nes was 0.062 and for the green tipped it was 0.13, neither of
which have a correlation between size and depth. The linear re-
gression equation for pink tipped anemones is y = -1.79x +38.85
and the equation for green tipped anemones is y = -2.40x +43.94.
Figure 8. Linear regression plot for all of the pink and green
tipped anemones that were observed in the study. The r2
value for
the pink tipped was 0.106, which is very weakly correlated. The r2
value for the green tipped was 0.056, which shows that there is no
correlation between size and depth occurrence. The regression
equations for pink and green anemones are y = 0.763x + 16.67
and y = 0.46x + 17.27, respectively.
DISCUSSION
In Discovery Bay, Jamaica, there was a considerable
amount of spatial variation between green and pink tip col-
or morphs of C. gigantea observed in the lagoon, on the
forereef, and on Dorm Shore. Regardless of depth, the pink
tipped anemones were found to be much more prevalent in
all areas, except on the forereef. Previous research done by
Stoletzki and Schierwater (2005) showed that pink tipped
anemones were found more often in the lagoon or at deeper
depths, whereas green tipped anemones were found in areas
with a more constant access to sunlight, like the forereef.
GALARNO: CONDYLACTIS POLYMORPHISM AND DISTRIBUTION30
The observation that tip color and depth did not correlate
suggests that color polymorphism is not an adaption to dif-
ferences in light attenuation, which agrees with the results
that were found in a similar study done in the Canary Is-
lands (Wirtz 1996). Mudron (2010) found that the number
of pink morphs and green morphs in the lagoon, inside the
bay, and on the forereef were not influenced by their depth
of occurrence. Surveying and observing the anemones in
three different types of environments gives a greater insight
to the distribution of the two color morphs and may indi-
cate that their presence is not limited to depth as previously
thought.
Though there were 10 sample areas observed on the
forereef, regardless of tip color, there was only a small
amount of anemones found in this area. The prevalence of
pink tipped anemones in more diverse environments sug-
gests that they are more capable than green morphs at
adapting to new niches. A higher occurrence could also
suggest that pink morphs are better suited to handle differ-
ent stresses than green morphs. The relationship of this
variable is not pertinent because a numerical prevalence in
each area was not discussed (Stoletzki and Schierwater
2005). Conclusions as to the correlation between depth and
tip color of C. gigantea cannot be determined without addi-
tional future observations.
The observation that size and depth did not correlate
suggests that light and nutrient levels do not determine the
size of anemones at any depth. None of the anemone sizes
correlated with their depth of occurrence indicating that all
sizes of individuals are possible regardless of depth. These
results are consistent with another study where the size of
Stichodactyla gigantea (Forsskal, 1775) did not correlate
with depth (Hattori and Kobyashi 2008). There was no cor-
relation between the size of anemone and their tip color. It
was previously thought that age could be a determining
factor of anemone tip color polymorphism (Medioni et al.
2001), however, age and size were not correlated in this
study so it cannot currently be determined if the age/size
relationship affects the tip color of anemones. In the future,
possible studies could be done to determine what causes tip
color polymorphism in sea anemones by studying their age,
size, diet, and behavioral patterns.
ACKNOWLEDGMENTS
First I would like to thank my diving and snorkeling
partner, M Miller, who pointed out to me many anemones
that I may have otherwise overlooked. I would also like to
thank D ‘Skeggy’ Edwards and O ‘Snow’ Holder at the
Discovery Bay Marine Laboratory for helping to point out
the best locations for studying giant sea anemones. A spe-
cial thanks to all of the rest of the staff at the marine lab for
hosting us and letting us make this our home away from
home for the duration of our trip. Lastly, I would like to
thank E Burge, of Coastal Carolina University, for giving
me the opportunity to complete this research and his rec-
ommendations and continued support throughout my entire
project.
LITERATURE CITED
Brown B. 1997. Adaptions of reef corals to physical environmen-
tal stress. Adv Mar Biol. 31: 222-301.
Gayle PMH, Woodley JD. 1998. Discovery Bay, Jamaica In:
Kjerfve B (ed) CARICOMP- Caribbean coral reef, seagrass
and mangrove sites. Coastal region and small island papers.
3. UNESCO, Paris.
Hanlon R, Hixon R 1986. Behavioral associations of coral reef
fishes with the sea anemone Condylactis gigantea in the Dry
Tortugas, Florida. Bull Mar Sci. 39(1):130-134.
Hattori A, Kobayashi M. 2008. Incorporating fine-scale seascape
composition in an assessment of habitat quality for the giant
sea anemone Stichodactlya gigantea in a coral reef shore
zone. Ecol Res. 24: 415-422.
Medioni E, LeComte Finiger R, Louviero N, Planes S. 2001. Ge-
netic and demographic variation among colour morphs of
cabrilla sea bass. J Fish Biol. 58: 1113-1124.
Murdon M. 2010. Differentiation of the sea anemone Condylactis
gigantea color morphs by habitat and genetics. Korallion. 1:
1-13.
Porter JW. 1972. Patterns of species diversity in Caribbean reef
corals. Mar Ecol Prog Ser. 53: 745–748.
Sebens K. 1976. The ecology of Caribbean sea anemones in Pana-
ma: Utilization of space on a coral reef. Coel Ecol Beh. 67-
77.
Stoletzki N, Schierwater B. 2005. Genetic and color morph differ-
entiation in the Caribbean sea anemone Condylactis gigan-
tea. Mar Biol. 147: 747–754.
Warner G, Goodbody I. 2005. Chapter 1.4. Jamaica. Caribbean
Marine Biodiversity: The Known and the Unknown. DES-
tech Pub. Inc. 57-70.
Wirtz P. 1996. The sea anemone, Telmatactis cricoides, from
Madeira and the Canary Islands: Size frequency, depth dis-
tribution and colour polymorphism. Arquipélago. Life Mar
Sci. 14A: 1-5.
Woodley JD, Chornesky EA, Clifford PA, Jackson JCB, Kaufman
LS, Knowlton N, Land JC, Pearson MP, Wulff JL, Curtis
ASG, Dallmeyer MD, Jupp BP, Koehl MAR, Neigel J,
Sides EM. 1981. Hurricane Allen’s impact on Jamaican
coral reefs. Science. 214:749-755.
Woodley JD. 1989. The effects of Hurricane Gilbert on coral reefs
at Discovery Bay. In: Assessment of the Economic Impacts
of Hurricane Gilbert on Coastal and Marine Resources in
Jamaica (edited by P. Bacon), pp. 79-82. CEP Technical
Report No. 4, UNEP Car Envi Pro, Kingston, Jamaica, 87.
KORALLION. VOL 5. 2014 31
32 STUDIES IN CORAL REEF ECOLOGY
33KORALLION. VOL 5. 2014
34 STUDIES IN CORAL REEF ECOLOGY
KORALLION. VOL 5. 2014
A COMPARISON OF THE RIO BUENO AND DISCOVERY BAYS BASED ON
FECAL COLIFORM CONCENTRATION IN RELATION TO FLUVIAL INPUT AND
SURROUNDING HUMAN DEVELOPMENT
Megan E. Miller
Department of Marine Science, Coastal Carolina University, PO Box 261954, Conway, SC 29526
ABSTRACT
A study was conducted on the northern coast of Jamaica in two different bays differing in the amount of fluvial input
and development. Discovery Bay, Jamaica experiences no fluvial input, but human development surrounds the perimeter of
the bay. Rio Bueno Bay experiences heavy amounts of fluvial input from the Dornoch Head River, which flows through
mountainous and rural land before draining into the bay. Samples were collected at haphazard locations around the perime-
ter of each bay as well as locations at the mouth of each bay, at the headwaters of the Dornoch Head River, and at locations
on the river. Samples were taken at the mouth of each bay to show that coliform levels decreased in areas that were far from
human development and fluvial input. Once the total coliform concentrations were found for each site, an analysis of vari-
ance (ANOVA) was used to compare statistical differences between the first sample day in each bay and the second sample
day in each bay. Two paired T-tests were used to compare the coliform levels from the first and second sample days in each
bay. Coliform levels were higher in areas near human development and fluvial input. Sample areas ranged in values from 0
CFU/100 mL (colony forming units per 100 mL) to 2400 CFU/100 mL. Coliform levels were highest in Rio Bueno Bay
near the mouth of the Dornoch Head River.
KEYWORDS: E. coli, water quality, ColiScan, runoff, bacterial contamination
This research was conducted as part of Coastal Carolina Universi-
ty’s classes MSCI 477, Ecology of Coral Reefs, and MSCI 499,
Directed Undergraduate Research in Discovery Bay, Jamaica, 14
–31 May 2014. Contact e-mail: memiller@coastal.edu
INTRODUCTION
FECAL COLIFORMS occur in the ocean, bays and other
water bodies through anthropogenic inputs. Non-point
sources of these coliforms can be storm water runoff, septic
systems, sanitary sewers and also wildlife (Steets and Hold-
en 2003). Fecal coliforms can consist of Escherichia coli
and other types of coliforms. Escherichia coli is an enteric
bacterium (Todar 2012). They are anaerobic Gram-negative
rods that live in the intestinal tracts of healthy and diseased
animals. They can grow in media containing glucose re-
gardless of the presence of oxygen. The bacteria can re-
spond to environmental signals such as chemicals, pH, and
temperature. Escherichia coli is consistently present in the
human gastrointestinal tract (Todar 2012). This presence
led to the use of the bacterium as an indicator of fecal pol-
lution and water contamination (Todar 2012). The bacteria
are not always pathogenic, but are found copiously in wa-
ters with human contributions (Noble et al. 2003). The
most commonly measured bacterial indicators are total col-
iforms, fecal coliforms and enterococci (Noble et al. 2003).
Fecal coliforms and E. coli are used to monitor fecal con-
taminations of water bodies around the world (Bai and
Lung 2005). Because of the different levels of fluvial input
and human development, the levels of fecal coliforms and
E. coli in each bay are expected to vary.
Jamaica is the third largest island in the Greater Antil-
les (Gayle and Woodley 1998). The island is 235 kilome-
ters long and 99 kilometers wide. Jamaica experiences a
subtropical climate, which is generally marked by two wet
and two dry seasons. Persistent rains occur between the
months of October and December, with the rains lasting for
a least a week. June and July are found to be the driest
months (Gayle and Woodley et al. 1998). Discovery Bay is
located on the northern side of Jamaica. It is a bay with no
direct fluvial input. The town of Discovery Bay is on the
southern slope of the bay. Port Rhoades is located on the
southwestern corner of the bay. This port is the loading
facility of a bauxite company. Groundwater enters the bay
through deep cracks in the basement limestone (Gayle and
Woodley 1998).
Rio Bueno Bay, also located on Jamaica’s northern
coast, is approximately 4 kilometers from Discovery Bay.
Rio Bueno Bay differs in both development levels and flu-
vial inputs. The Rio Bueno Bay receives significant inputs
of fluvial terrigenous sediments (Mallela et al. 2004). Be-
fore flowing into the bay, the Dornoch Head River runs
through mountainous and rural land, into the town of Rio
Bueno. The Dornoch Head River finally flows into the bay.
The bay is a high-energy open-coast surf zone. There is a
lot of sediment generation because of the high-energy
coast. Longshore drift and local currents are among the
35
hydrodynamic processes that affect the bay (Mallela et al.
2004). The bay is a highly variable environment because of
the fluvial input; the surface waters in the bay can fluctuate
between marine and brackish (Malella et al. 2004). After
heavy rainfalls in the area, a highly turbid freshwater plume
extends from the mouth of the Dornoch Head River and
across the bay. The plume can persist there for weeks at a
time (Malella et al. 2004). In general, the perimeter of the
bay is undeveloped. There is no major town or industrial
area surrounding the bay.
Because of the fluvial inputs in the Rio Bueno Bay,
fecal coliform concentrations were expected to be higher.
In Discovery Bay, because there is no direct fluvial input,
fecal coliform levels were lower than that of Rio Bueno
Bay. However, because there is human development along
the perimeter of Discovery Bay, fecal coliform concentra-
tions were expected to be more uniform and consistent
around the bay.
The objective of this study was to compare the fecal
coliform levels in a bay with one major fluvial input versus
a bay with no fluvial input. This is the first study compar-
ing both the Rio Bueno Bay fecal coliform levels to the
Discovery Bay fecal coliform levels.
METHODS
A total of 50 15 mL samples were taken at the perime-
ters of Rio Bueno Bay and Discovery Bay between May 17
and 25, 2014, making a total of 100 samples. Twelve sam-
ples were taken at the mouth of each bay to account for the
difference between coliform levels around the perimeter
and coliform levels in the open bay. Fifteen samples were
collected while rafting down the Dornoch Head River, and
one sample was collected at the headwaters of the Dornoch
Head River. These methods were adapted from the Coastal
Carolina University Waccamaw Watershed Academy.
Samples were collected in sterile 15 mL centrifuge
tubes The tubes were submersed approximately two to six
inches into the water until full. In order to avoid contamina-
tion, the inside of the cap and bottle were not touched by
human hands or any foreign substances. The samples were
kept on ice while being transferred back to the lab and plat-
ed within 24 hours of being collected.
At the conclusion of the incubation period, samples
were analyzed to determine fecal coliform concentrations.
A volume of 3 mL of each sample was pipetted into a bottle
of defrosted ColiScan Plus EasyGel media. The mixture
was inverted, and poured into a petri dish. The petri dish
was then incubated in the lab between 29.1 and 31.1 ̊C for
18 to 24 hours.. Blue colonies, pink colonies and glowing
colonies were counted to determine fecal coliform concen-
tration in the sample. Pink colonies indicated coliform
growth, while blue colonies indicated E. coli growth
(MicrologyLabs.com). An ultraviolet light was used to de-
termine which colonies were glowing. A glowing colony
was indicative of E. coli. Therefore, any colony with E. coli
had a slightly glowing ring around it (MicrologyLabs.com).
Each sample was evaluated and colonies were counted
to determine colony forming units (CFU/100 mL). The
formula, total colony count x (100/3), was used to deter-
mine CFU/100 mL. To find the fecal coliform concentra-
tion in Coliform Units per 100 mL (CFU/100 mL), the total
amount of colonies on a plate were counted. Colonies had
to have a diameter larger than 0.5 mm, a size similar to a
period (.), in order to be considered in the count. The total
amount of colonies was then multiplied by 100 divided by
the number of millimeters of sample water pipetted into the
media. Once the colony forming units (CFU/100 mL) were
calculated for each site, the values were log base 10 trans-
formed.
In order to compare sample sites between the two
different bays on the first and second sample days, a single
factor ANOVA was used. A paired T-test was used to com-
pare values from the first and second sample days in each
bay. To compare differences in colony forming units at
sites in Rio Bueno and Discovery bays on first sample day,
a single factor ANOVA was used and another single factor
ANOVA was used to compare the colony forming units on
the second sample days in each bay.
RESULTS
During the two week period of sampling, coliforms
were found in waters of the Rio Bueno and Discovery
Bays. Coliform levels varied greatly, with some sample
sites having no coliforms and some sample sites having
many coliforms. Coliforms ranged from 0 CFU/100 mL to
2300 CFU/100 mL.
Sites in Rio Bueno Bay varied in coliform concentra-
tions (Figure 1). Coliform concentrations also varied in
Discovery Bay (Figure 2). Samples taken while floating on
a raft down the Dornoch Head River are denoted in Figure
3. The sample vial was inserted into the water and the loca-
tion was marked by GPS. The distribution was more uni-
form with coliforms consistently occurring around the pe-
rimeter of the bay near the shoreline, closer to human de-
velopment.
A single factor ANOVA, with a p-value of 0.007,
showed a significant difference in the amount of coliforms
in Discovery Bay and Rio Bueno Bay on the first days of
sampling. A second single factor ANOVA, with a p-value
of 0.708, showed no significant difference on the second
days of sampling. A paired T-test showed a significant dif-
ference in coliform levels in Rio Bueno Bay from the first
and second days of sampling. A T-stat value of (5.220) was
greater than the T-crit value of (2.064), showing a signifi-
cant difference on each sample day in Rio Bueno Bay. A
paired T-test showed no significant difference in coliform
levels in Discovery Bay on the first and second sample
days. A T-stat value of (1.116) was less than the T-crit val-
ue of (2.064.)
MILLER: FECAL COLIFORM COMPARISON36
DISCUSSION
Coliforms were found in water samples taken in Rio
Bueno and Discovery Bays on the northern coast of Jamai-
ca. The levels of coliforms in the surface waters varied in
each bay. Because of the development surrounding the pe-
rimeter of Discovery Bay, coliforms were consistently
found in the surface waters, but not in great numbers. The
fluvial input into Rio Bueno Bay caused increased coliform
levels near the mouth of the river. Coliform levels were
lower in areas further from the mouth of the river.
Rio Bueno Bay has steady input of terrigenous sedi-
ment and freshwater from the Dornoch Head River. Be-
Figure 1. Satellite map showing the 50 sampling locations in Rio
Bueno Bay. Colored points of different sizes on the map corre-
spond with different values of colony forming units. The points
also correspond with their GPS coordinates. Larger points in
shades of purple indicate higher values, while smaller points in
shades of blue indicate lower levels of colony forming units.
Figure 2. Satellite map showing the 50 sampling locations in
Discovery Bay. Colored points of different sizes on the map cor-
respond with different values of colony forming units. The points
also correspond with their GPS coordinates. Larger points in
shades of orange or green indicate higher values, while smaller
points in shades of light blue indicate lower levels of colony
forming units.
Figure 3. Satellite map shows the 15 sampling locations in the
Dornoch Head River. Samples were taken on May 26th of 2014.
Colored points of different sizes on the map correspond with dif-
ferent values of colony forming units. The points also correspond
with their GPS coordinates. Larger points in shades of purple
indicate higher values, while smaller points in shades of blue indi-
cate lower levels of colony forming units.
KORALLION. VOL 5. 2014 37
cause of the fluvial input of freshwater and sediment, coli-
forms survive in the surface waters around the perimeter of
Rio Bueno Bay. A study by Gerba and McLeod (1976)
showed that sediment can prolong the survival time of fecal
coliforms in marine waters. The study showed that the sedi-
ment can even support their growth in the water in spite of
the presence of other competing organisms (Gerba and
McLeod 1976). Eschericha coli rapidly died away in wa-
ters from a site that was not polluted with sediment. The
nutrients in the sediment prolonged the growth. The salinity
of the water did not appear to affect the growth of the or-
ganism. These findings support the results shown in this
study conducted in Rio Bueno and Discovery Bays.
Differences in fecal coliform levels between the sam-
pling days in Rio Bueno Bay can be explained by differ-
ences in rainfall. The first sample taken on May 17th was
not preceded by heavy amounts of rainfall. During the time
frame between samples, heavy rains occurred. Increases in
precipitation increased the amount of freshwater and terri-
genous sediment deposited into the bay by the Dornoch
Head River. This increase in precipitation could have
caused the significant difference in coliform levels on the
first and second sampling days. A study by Ackerman and
Weisberg (2003) showed that increased rainfall caused and
increase in bacterial concentrations. The largest increase in
bacteria occurred on the first day after the storm
(Ackerman 2003). Conversely, the lack of a significant
difference between coliform levels in Discovery Bay can be
attributed to consecutive sampling days without precipita-
tion. In days following rain, the bacterial counts returned to
the original numbers (Ackerman 2003). Because there was
not a gap in sampling and there was no precipitation during
the two sample days, less freshwater runoff drained into the
bay. With less freshwater runoff, there are less coliforms
(Ackerman 2003).
In order to improve results, future studies could take
samples from each bay on the same days. The samples
could be taken consecutively as well as after periods of
heavy precipitation.
ACKNOWLEDGMENTS
I would first and foremost like to thank E Burge for
providing this wonderful opportunity, for being helpful and
patient during the research process, and for driving the boat
on my sample days. I would also like to thank T Beheler
and A Kammerer for writing down the GPS coordinates for
100 of my sample sites. Thank you to the entire staff of the
Discovery Bay Marine Laboratory for permitting the use of
the lab and for the assistance in the field.
LITERATURE CITED
Ackerman, D, Weisberg, S. 2003. Relationship between rainfall
and beach bacterial concentrations on Santa Monica bay
beaches. J Water Health, 1: 85-89.
Bai S, Lung W. 2005. Modeling sediment impact on the transport
of fecal bacteria. Water Res. 39(20):5232–5240.
FAQ. MicrologyLabs.com. Micrology Labs, 1998. <http://
www.micrologylabs.com/page/64/FAQ#tweleve>.
Gayle PMH, Woodley JD. 1998. Discovery Bay, Jamaica In:
Kjerfve B (ed) CARICOMP- Caribbean coral reef, seagrass
and mangrove sites. Coastal region and small island papers.
3. UNESCO, Paris.
Gerba CP, McLeod JS. 1976. Effect of sediments on the survival
of Escherichia coli in marine waters. Appl Environ Micro-
biol. 32(1):114.
Malella J, Perry C, Haley M. 2004. Reef morphology and commu-
nity structure along a fluvial gradient, Rio Bueno, Jamaica.
Caribb J Sci. 40(3):299-311.
Noble RT, Moore DF, Leecaster MK, McGee CD, Weisberg SB.
2003. Comparison of total coliform, fecal coliform, and
enterococcus bacterial indicator response for ocean recrea-
tional water quality testing. Water Res. 37(7):1637-1643.
Streets BM, Holden PA. 2003. A mechanistic model of runoff-
associated fecal coliform fate and transport through a
coastal lagoon. Water Res. 37:589–608.
Todar K. 2012. Pathogenic E. coli. Bacteriology. Madison: Uni-
versity of Wisconsin. p. 1. http://textbookofbacteriology.net/
e.coli.html.
MILLER: FECAL COLIFORM COMPARISON38
KORALLION. VOL 5. 2014
WATER COLUMN PROFILE AND PHYSICAL/BIOLOGICAL ANALYSIS OF
CRATER LAKE, DISCOVERY BAY, JAMAICA
Andrew J. Kammerer
Department of Marine Science, Coastal Carolina University, PO Box 261954, Conway, SC 29526
ABSTRACT
Crater Lake is a 400 m diameter, limestone collapsed cavern lake to the east of Discovery Bay, Jamaica. Little to no
investigation or research has been performed on the lake. Water samples were collected on two occasions from the surface
to a depth of 31.1 m. The lake was found to be extremely stratified in terms of temperature and salinity. Surface waters
were warm and fresh (29.8°C, 2.5 ppt). Salinity and temperature declined quickly to about 5 m. A zone of maximum salin-
ity and higher temperature was evident between about 9 and 18 m. Beyond this zone salinity and temperature drop as fresh
cool spring water rising from the bottom of the lake mixes with intrusive seawater.
KEYWORDS: Crater Lake, Discovery Bay, temperature, salinity
INTRODUCTION
JAMAICA is part of the Greater Antilles island chain,
located in the central Caribbean Sea. It lies about 200
km south of Cuba, 900 km north of Columbia, 1100 km
east of the Yucatan Peninsula, and 400 km west of Haiti.
The Cayman Trench lies about 100 km to the north, and
runs east, west. The trench has a maximum depth of 7,686
m. Jamaica lies on the Enriquillo-Plantain Garden fault
zone, on the border between the North American and Carib-
bean plates.
Most of the island is made up of limestone from the
Tertiary period. On the north coast, this limestone is topped
with Pleistocene reef deposits (Gayle and Woodley 1998).
The mountains of Jamaica are over 2000 m high. The cli-
mate is tropical/subtropical. Jamaica experiences mixed
tides; spring tides tend to be diurnal, while neap tides are
predominantly semi-diurnal (Gayle and Woodley 1998).
Crater Lake is a collapsed cavern lake, located on the
north, west-central side of Jamaica. This lake has also been
referred to by the names of St. George’s Lake and
Hopewell Pond (from here on referred to as Crater Lake). It
is 4 km east from the Discovery Bay Marine Lab, and less
than 1 km from the ocean. The diameter of the lake ranges
from 350 m to 470 m. Crater Lake is reported to be about
60 m deep. The lake is encircled by mangrove trees, and is
filled with groundwater from rainfall that falls over the
northern half of the mountains and funnels down into the
lake (Day 1976). The ocean is potentially another water
source for lake, thought to cause haline stratification.
As rain falls it absorbs carbon dioxide from the atmos-
phere, and more as it passes through soil. This process turns
the groundwater into a weak form of carbonic acid. When
this acid comes in contact with limestone, it slowly chemi-
cally erodes the stone. As the eroded areas grow, mechani-
cal erosion of the increasing amount of ground water adds
to the process. This process over time creates large under-
ground networks of caves and caverns in limestone. When
a large cavern nears the surface, the weight of the top roof
section of the cavern can become too heavy for the walls to
support. When this happens the roof may collapse, and a
collapsed-cavern lake is formed.
In the exploration of Crater Lake, the objectives to be
addressed were: What was the temperature range of the
lake? What was the salinity range of the lake? Was there a
halocline and if so, what was its depth? Did the salinity
and/or halocline vary tidally? What were the predominant
organisms living in the lake? What was the level of dis-
solved oxygen at different depths in the lake?
METHODS
The site studied was Crater Lake (also referred to as St.
George’s Lake/Hopewell Pond). Crater Lake was located
on the north, west-central coast of Jamaica. The lake was 4
km east of Discovery Bay, and 1 km south from the Carib-
bean Sea. The lake was formed from a collapsed cavern,
and is connected to surrounding cave systems, including
Green Grotto caves. The lake also is believed to be con-
nected to the Caribbean Sea, causing it to be partially sa-
line.
Water samples were collected from Crater Lake on two
occasions. Plastic sample bottles with numbered caps were
used to collect water samples at depth. The bottles were
flooded at the surface. When the target depth for each wa-
ter sample was reached, the bottle was inverted and filled
with air from a backup regulator, then turned right side up,
allowed to fill with water and was capped. The number on
the cap, depth, and temperature from a mercury thermome-
This research was conducted as part of Coastal Carolina Universi-
ty’s classes MSCI 477, Ecology of Coral Reefs, and MSCI 499,
Directed Undergraduate Research in Discovery Bay, Jamaica. 14–
–31 May 2014. Contact e-mail: ajkammere@coastal.edu
39
ter were all recorded on a dive slate. On the first sampling
occasion, temperature values were taken from a dive com-
puter and were found to be less accurate than those taken
with the mercury thermometer on the second sampling oc-
casion.
To obtain salinity values and dissolved oxygen values, a
YSI unit was used to analyze water samples from varying
depths immediately upon return to the surface. These val-
ues were recorded along with the depth of the sample and
ambient water temperature. The collected data was then
plotted and analyzed.
Biota in the lake was determined by observation, photo-
graphs, and sample collection.
RESULTS
Crater Lake was surrounded by red mangroves
(Rhizophra mangle). The prop roots of these trees have
created a peat overhang around the circumference of the
lake. The overhang begins at the surface and extends to a
depth of 3–5 m. The substrate along the shallower perime-
ter of the lake is very soft, fine-grained sediment composed
of detritus and leaf litter. Fallen trees were observed fre-
quently around the edge of the lake. The substrate slopes
down sharply from approximately 5 to 25 m. At about 25 m
the slope levels out and the substrate transitions from soft
sediment to large, boulder sized limestone rubble. The
depth of the lake is reported to be 56 m. The maximum
depth reached while diving was 31.1 m due to SCUBA and
light restrictions. The slope of bottom at that depth had
become significantly less drastic.
Mangrove prop roots and fallen trees were encrusted
with bivalve and sponge communities. The primary bivalve
present was identified to be Brachidontes exustus
(Linneaus, 1758) (Webber 2009). Communities of small
grass shrimp, crayfish, minnows, and hydrozoans surround-
ed the prop root and fallen tree structure.
Surface waters were the warmest at 29.8°C. From the
surface to a depth of 6.1 m the water temperature drops to
25.1°C. From approximately 5 m to 12 m the temperature
is consistent at 25°C. Beyond 12 m the temperature in-
creases to 25.2°C and remains constant to the maximum
sampled depth of 31.1 m (Figure 1).
Salinity at the surface was the freshest at 2.5 ppt. From
the surface to a depth of 9.1 m the salinity changes rapidly
from 2.5 ppt to 18.3 ppt. From 9.1 m to 18 m salinity was
greatest at 18 ppt. From 18 m to 31.1 m the salinity
dropped from 18 ppt to 16.8 ppt (Figure 2).
The density increased sharply from the surface to 9.1 m.
From 9.1 to 18 m the density remained constant, and then
decreased to 31.1 m (Figure 3). The deeper portion of the
water column beyond 18 m had a negative stability value.
Above 18 m the stability was positive (Figure 4).
The lake water was highly stratified. Surface water was
relatively clear, with visibility of about 4.5 m. Between
approximately 6 and 10 m a sulfide layer was present.
White precipitant was coming out of suspension in the wa-
ter column. Visibility in this layer was limited to about 1 to
2 m. Above this white precipitant layer was a coffee col-
ored film layer. Beyond the precipitate layer water clarity
improved to approximately 10 m.
DISCUSSION
Land runoff and precipitation caused a higher concen-
tration of freshwater at the surface. The surface water was
Figure 1. Temperature values plotted over depth from the 5/27
sampling. These temperature values were recorded with a mercu-
ry thermometer and were more actuate than those taken from the
dive computer on the 5/21 sampling.
Figure 2. Salinity profile from both samples (5/21 and 5/27).
KAMMERER: CRATER LAKE PROFILE40
warmest from solar heating.
Salt-water intrusion presumably from the Caribbean Sea
causes increasing salinity with depth. However, fresh
groundwater intrusion in the deeper part of the lake causes
the mixing of fresh and seawater. Mixing fresh and salt-
water cause the salinity to decrease in the deeper areas of
the lake. Mixed water masses have a higher density than
the original two water masses. The higher density water
masses sink, encouraging the mixing of fresh and salt water
in the deeper areas of the lake. Freshwater springs mixing
with seawater accounts for the salinity and density profiles
observed in the water sampling (Figures 3 and 4). Water
from the surrounding hills has been traced and shown to
appear in the lake (Day 1976).
The benthic slope and topography supports the develop-
mental theory that the lake originated from a collapsed cav-
ern. The boulder sized limestone rubble observed on the
deeper substrate is most likely prevalent throughout the
lake, but has been covered by detritus and sediment in the
shallower areas and slope of the lake. If cores were to be
taken through the benthic sediment in the shallow areas of
the lake it can be predicted that limestone rubble consistent
Figure 3. Density profile from the 5/27 sample. Density values
were calculated from temperature, salinity, and depth (in lieu of
pressure 1 m ≈ 1 dbar).
Figure 4. Stability profile with depth. Stability values were cal-
culated from change in salinity with respect to change in depth.
with that observed in the deeper areas would be discovered.
Large boulder rubble is consistent with previous research
describing collapsed caverns (Sweeting 1950).
The white precipitate layer is thought to be sulfides pre-
cipitating out of suspension. The brown film floating on the
sulfide layer is believed to be a film of detritus, which is
not able to sink due to the sulfide layer having greater den-
sity. Decreasing mid-water temperature could be the cause
of the precipitation of the sulfides in that layer.
Future researchers could chemically analyze the differ-
ent layers in the lake and determine the exact sulfide in
suspension, and its cause. They could also pursue deeper
water samples and a more thorough determination of ba-
thymetry. Also cores could be taken around the lake to de-
termine the depth a contents of the sediment around the
lake, and determine if there is underlying limestone rubble.
ACKNOWLEDGMENTS
I would like to thank E Burge and S Luff for their assis-
tance in data collection and diving at the lake, Teddy for his
guidance in diving the lake, D Scarlett and Shika for trans-
portation from the Marine Lab to the lake, and the entire
Marine Lab staff for their day to day help.
LITERATURE CITED
Day M. 1976. The morphology and hydrology of some Jamaican
karst depressions. Earth Surf Proc. 1: 111-126.
D’Elia CF, Webb KL, Porter JW. 1981. Nitrate-rich groundwater
inputs to Discovery Bay, Jamaica: A significant Source of N
to Local Coral Reefs? Bull Mar Sci. 31(4): 903-910.
Gayle PMH, Woodley JD. 1998. Discovery Bay, Jamai-
ca. In: Kjerfve B, editor. CARICOMP - Caribbean coral
reef, seagrass and mangrove sites. Paris: UNESCO. p. 17-
33.
Goodfriend GA, Mitterer RM. 1993. A 45,000-yr record of a trop-
ical lowland biota: The land snail fauna from cave sediments
at Coco Ree, Jamaica. Geol Soc Am Bull. 105:18-29.
Kornicker LS, Iliffe TM. 1992. Ostracoda (Halocypridina, Clado-
copina) from anchialine caves in Jamaica, West Indies.
Smithson Contrib Zool. 530: 32 p.
Maddocks RF, Iliffe TM. 1993. Thalassocypridine ostracoda from
anchialine habitats of Jamaica. J Crustacean Biol. 13:142-
164.
Mitchell SF, Miller DJ, Maharaj R. 2003. Field guide to the geol-
ogy and geomorphology of the Tertiary limestones of the
Central Inlier and Cockpit Country. Caribb J Earth Sci. 37:
39-48.
Peck SB. 1975. The invertebrate fauna of tropical American
caves, Part III: Jamaica, an introduction. Int J Speleol. 7:
303-326.
Sweeting M. 1950. Erosion cycles and limestone caverns in the
Ingleborough District. Geogr J. 115: 63-78.
Webber M. 2009. Biodiversity of Jamaican mangrove Areas. 7: Mangrove
BiotypesVI:Common fauna. Environ F Jamaica.
KORALLION. VOL 5. 2014 41
Appendix 1. Bivalve and sponge encrusted fallen tree limb.
Appendix 2. Hydrozoan common in the shallower areas of the
lake. The bell was approximately 3-5 cm across.
Appendix 3. Sample of bivalves and sponges taken.
Appendix 4. Schools of small grass shrimp and minnows congre-
gated near fallen tree structure.
APPENDICES
Appendix 5. Sulfide precipitate layer with thin, coffee colored
film above
KAMMERER: CRATER LAKE PROFILE42
KORALLION. VOL 5. 2014
NET MOVEMENT RATES OF ACANTHOPLEURA GRANULATA WHEN SHELTER
AND FOOD ARE PRESENT WITHIN THE HABITAT
Caitlin B. Raynor
Department of Marine Science, Coastal Carolina University, PO Box 261954, Conway, SC 29526
ABSTRACT
Acanthopleura granulata are intertidal molluscs that live on rocky substrates of many coastal environments; especially
the Caribbean. Individual net movement rates of 52 chitons (A. granulata) were measured over a 14 day period within the
rocky intertidal zone of Discovery Bay Marine Laboratory, Jamaica. Measurements of weight and length were taken, and
length was used when comparing the net movement rate versus the size of each individual. The objectives of the study were
to (1) find a significant difference or correlation of net movement rates towards food and shelter (rock) with respect to the
size of A. granulata in the experimental group, and (2) a correlation between the size of A. granulata and their rate of
movement. Although this was new research for the Discovery Bay area, there was not a significant difference when the size
of the individual was compared to the net movement distance (p = 0.317) when observed in field locations. Size and net
movement rates were unable to be supported by the data (p = 0.285) in either of the experimental trials.
KEYWORDS: West Indian fuzzy chiton, Acanthopleura granulata, intertidal molluscs
INTRODUCTION
CHITONS (class Polyplacophora), are marine intertidal
and subtidal molluscs. These organisms live in cold,
warm and tropical waters on substrate, underneath boulders
(Grayson and Chapman 2004), or in crevices of rocky
shores. Acanthopleura granulata (Gmelin, 1791) common-
ly known as the West Indian fuzzy chiton are extremely
abundant in the Caribbean especially in Jamaica (Humann
et al. 2012). Chitons have an external, dorsal shell with
eight separate plates. The plates are able to overlap and
articulate well with one another which create a protection
barrier for the chiton’s soft underside. This underside con-
nects to the external shell and has a skirt or girdle used for
locomotion and is covered in short coarse hair-like spines
that give it the fuzzy appearance. Since the plates of the
shell can overlap and expand, the chiton is flexible and able
to easily move through the littoral zone. It can slowly curl
into a ball for protection; the ability to curl into a ball when
disturbed allows them to hide in unlikely places from pred-
ators and their shell acts as a shield to protect their fleshy
snail-like underside. The plates are brown in color when
not eroded or encrusted (Humann et al. 2012), this camou-
flage is another defense.
Chitons are typically very slow movers and adhere to
their habitat and the substrate to appear to be a part of the
rock as a fossil. The chitons leave behind a mucus trail
from their muscular underside, used as a foot, which allows
them to adhere to the rock and keeps them in place during
tidal changes in turbulent environments and protects them
against predation.
Chitons burrow into hollows within the rock that they
occupy which in turn protects them from their main preda-
tor; the toad fish (Chelazzi et al. 1983a). Acanthopleura
granulata is known to move in a ranging pattern; they me-
ander while feeding and have no long term resting site
preferences, but the movement could be based on kinetic
responses, and not because of random movement, which
allow a long-term permanence within their habitat distribu-
tion (Chelazzi et al. 1988). However, the resting areas for
chitons are extremely important to their lifestyle within
inter- and subtidal ranges. Another reason they create a
resting area within the hollow or scar in the rock has been
suggested to reduce water loss during low tide (Chelazzi et
al. 1983b). They do not have eyes, but have sensory organs
that help them determine where they are in the intertidal
area.
Typically, A. granulata have a high energy cost to loco-
motion ratio and very slow speed; they adopt an “isopatial”
tactic which causes them to stay in crevices or narrow areas
along the intertidal while alternating air and water exposure
during tide changes (Chelazzi et al. 1988) since they do not
experience vertical orientation within the intertidal unlike
other chitons, Acanthopleura gemmata (Blainville, 1825)
and Acanthopleura brevispinosa (Sowerby II, 1840)
(Focardi and Chelazzi 1990).
Acanthopleura granulata are nocturnal feeders and are
known to graze primarily on macroalgae. Tidal regimes do
not affect chitons because sea spray and splashes during
low tide stops them from losing water (Focardi and Chelaz-
zi 1990). This also affects their eating activity which is
This research was conducted as part of Coastal Carolina Universi-
ty’s classes MSCI 477, Ecology of Coral Reefs, and MSCI 499,
Directed Undergraduate Research in Discovery Bay, Jamaica. 14–
–31 May 2014. Contact e-mail: cbraynor@coastal.edu
43
limited to when the habitat is suitable for grazing (Chelazzi
et al. 1988). When chitons eat they use their radula to pull
the algae off the limestone substrate and deliver the food to
its mouth.
Behavioral studies of chitons have been reported over
the past 95 years (Chelazzi et al. 1983a). These previous
studies also examine movement patterns, competition for
habitat, homing behaviors, aggressive behaviors in relation
to habitat space, orientation mechanisms, and patterns in
distribution and abundance along the study areas. These
can all contribute to a chiton’s net movement rate within its
habitat and may be examined if found significant to the
current study. Other movement activity can be based on
changes in the tides, food availability, and habitat availabil-
ity or competition. If their habitat is compromised they will
find a new resting area so they do not suffer from water
loss during low tides. Food availability is a main factor for
reasons why many organisms will relocate themselves.
The current study determined if there were significant
differences in net movement rates of A. granulata. The
objective(s) of this study were to determine: (1) Was there
a significant difference or correlation of net movement
rates towards food and shelter with respect to the size of A.
granulata in the experimental group? (2) Was there a corre-
lation between the size of A. granulata and their rate of
movement?
For the current study, it was the hypothesized that if a
chiton is larger in size and weight it would have a higher
net movement rate when food and shelter were placed in
the aquarium and that the larger chitons would have a high-
er net movement rate during field observations.
METHODS
The study was conducted in the littoral zone of a jetty
area at the Discovery Bay Marine Laboratory, Jamaica,
West Indies for a 10 day period in May 2014. The rocky
coastline studied was formed by limestone rock from uplift-
ed fossil reef in the Jamaican northern coast (Therriault and
Kolasa 1999). In total, 52 chitons were observed, and size,
weight, and net movement rate within Discovery Bay were
recorded. There were two separate groups during this
study; an observation or field group and an experimental
group.
Different groups of chitons ranging from 20.0–90.0 mm
in length were haphazardly removed from the limestone
rock and taken back to the lab for measurement. Since chi-
tons are difficult to remove from the substrate, the blunt
flathead end of a dive knife was used to release their strong
suctioning underside from the rock. The knife was wedged
in between the rock and the chiton then the butt of the knife
was hit to remove the chiton as gently as possible. The or-
ganisms were measured using calipers to the nearest hun-
dredth of a mm and the weight was taken with a scale to the
nearest tenth of a g then tagged with numbers by nail
polish.
To determine if there was a significant difference be-
tween size and net movement when food and shelter is pre-
sent, a total of 20 chitons were collected and put into two
separate trials of five chitons per the two trials in respective
aquariums and used for the experimental group. One aquar-
ium had only 2 mm high of saltwater and the second tank
had 2 mm of saltwater plus rocks which they were found on
originally at the end of the tank which represent food and
shelter for the chitons. Each chitons length and weight was
recorded. Once collected and measured, the chitons were
numbered with waterproof paint and placed into an aquari-
um as an acclimation and starvation period for six hours.
After the acclimation period, each group was placed into
respective aquariums and was given at least another six
hours for movement. After the first six hours, the chitons
net movement was measured in meters from their starting
point to where they were in the tank at the end of the six
hours. The group was then released back to the jetty and a
new group was collected.
The field group was examined within two different sec-
tions of the jetty. A total of 32 chitons were collected and
three separate trials were conducted within the jetty. The
field group was collected during low tide with the same
dive knife method. Once collected, the chitons were taken
to the wet lab, measured and tagged the same as the experi-
mental group, but were immediately placed back in their
natural habitat. The rock which they were placed on was
marked for each individuals starting point. The field group
was given at least 12 hours to acclimate and the net move-
ment was measured during the next diurnal low tide. To
determine a relationship between A. granulata size and
weight to their net movement rate the data was run through
a single factor ANOVA.
RESULTS
From this study, of the 52 A. granulata (20 experi-
mental and 32 field specimens) collected, only 47 were
included in the data analysis. Of the field group, five chi-
tons were not able to be relocated after tagging and replace-
ment to their habitat. Of those 47 organisms, there was a
positive correlation when weight and length were com-
pared; the 20 organisms for the experimental group and of
the field group of 32 chitons were combined to give a R2
value of 0.9055 (Figure 1). Since there was a positive cor-
relation, the length was used when determining net move-
ment rates of the chitons for further data analysis. Of the
experimental group, the smallest individual was 28.00 mm
and 2.3 g and the largest was 73.30 mm and 40.4 g. The
field group’s smallest chiton was 20.21 mm and 1.1 g and
the largest was 84.89 mm and 41.9 g. Although five of the
field group chitons could not be relocated for net move-
ment analysis, the individual’s weight and length were still
included in the weight versus length analysis.
When the two experimental trials measurements of net
movement and length were compared, trial 1 with rock
RAYNOR: ACANTHOPLEURA GRANULATA NET MOVEMENT44
(shelter/food) inside the aquarium gave an R2
value of
0.030 and trial 2 without rock (no shelter/food) had an R2
value of 0.038. A single factor ANOVA compared the net
movement rates of the chitons when rock was in the aquari-
um versus the aquarium with no rock and it was found to
have a no significant difference (p = 0.258). Within the
field group, there was also no significant difference (p =
0.317) when a regression was done of the length of A.
granulata versus the net movement distance which is con-
sistent with the variance values (R2
) of 0.04 (Figure 2).
DISCUSSION
This study found that the presence of shelter and food
did not determine the chiton’s net movement within the
aquarium. From both the field and experimental groups, a
significant difference was not found with respect to net
movement rates based on size. Since there were no signifi-
cant differences of the A. granulata size versus net move-
KORALLION VOL 5. 2014
ment rates, it is concluded that there is no preference or
determination of the chitons movement based on food or
shelter. However, since chitons migrate as they are noctur-
nal feeders (Focardi and Chelazzi 1990) this could be a
factor that determines their net movement rates to be signif-
icant when grazing. Some reasons why there was not a
significant difference could be because there was not a con-
tinuous time interval for checking the individuals move-
ment, the number of individuals collected was small which
meant fewer trials, and the organisms may have been too
stressed or injured to move as typically seen in the habitat.
For future studies, other methods for tagging and col-
lecting the individuals may be used. Chelazzi et al. (1983)
used computerized screening processes to mark and register
the position and changes to individual home activity. With
more time intervals to check their movement, the loss of
the organisms may be fewer than was seen in the field
group and a uniform movement rate maybe be used instead
of a net movement from the starting point to the observed
resting point. Future studies can examine larger collection
numbers, differences in food preferences, population densi-
ties, and tidal migrations within different sampling loca-
tions in Discovery Bay. Eating preferences have been pre-
viously examined based on their gut content to determine
different feeding categories (Latyshev et al. 2004) but were
only found for other genera of chitons, not Acanthopleura.
Chitons are also known to feed not only on algae substanc-
es, but on diatoms, foraminiferans, red calcareous algae,
and other macrophytes (Latyshev et al. 2004). Some studies
(Littler et al. 1995) suggest that there is a chiton to coralline
alga association that contributes to the build-up of the reef
itself. However, it has been determined (Littler et al. 1995)
that if macroalgae regenerate quickly along and are typical-
ly nutritionally poor, large and well-defended, then there
will be a stable coexistence between chitons and their main
food resource. This is an important factor to examine for
future studies within Discovery Bay because chitons have
been known to have negative impacts on the habitat due to
their grazing habits (Littler and Littler 1985).
There was another species of chiton found along with
A. granulata and for future studies; these other species net
movement rates could be compared to the other chiton in
the area, Chiton viridis (Spengler, 1797). This comparison
can be used for further research in attempt to determine a
significant difference between the species net movement
and grazing times or habits. There may be competition for
space or food availability between the two species which
may cause a shift in A. granulata diet and spatial distribu-
tion. For A. granulata tide cycles do not determine its feed-
ing cycles since they live in a narrow area and do not expe-
rience large tidal migrations (Focardi and Chelazzi 1990)
but that they do graze nocturnally. In the future, other stud-
ies can examine the differences of net movement and graz-
ing habits based on the different rocky zones found
throughout Discovery Bay. Also found in Discovery Bay,
were habitats occupied by A. granulata and C. viridis that
Figure 2. Individual chitons were compared to determine if there
was a significant difference between of length versus net move-
ment during 12-hour trials. However, despite various sizes there
was no significant difference (p = 0.317).
Figure 1. Length-weight relationship between chitons of the field
group (black) and experimental group (gray). Since there was a
positive correlation, the length measurement was used when test-
ing the relationship of net movement rate through data analysis.
45
RAYNOR: ACANTHOPLEURA GRANULATA NET MOVEMENT
were extremely different. This study did not examine those
habitats due to time constraints; however future studies of
net movement rates of those individuals based on tidal
changes or the vertical incline of the rock (habitat) may
prove to be significant.
ACKNOWLEDGMENTS
I wish to thank the Discovery Bay Marine Laboratory
for contributing their equipment, wet lab, housing and car-
ing for my classmates and me during our stay. Also to O
Holder for discovering how to remove A. granulata from
the substrate with the dive knife which made this study
possible. Thank you to my classmates and Dive Master S
Luff for this a wonderful and memorable trip. I would also
like to thank M Sporre for reviewing this paper for publica-
tion. Lastly I would like to thank E Burge for his support
and advice throughout the study and for granting me the
opportunity to conduct my first individual scientific study
while in Jamaica.
LITERATURE CITED
Chelazzi G, Focardi S, Deneubourg JL, Innocenti R. 1983a. Com-
petition for the home and aggressive behaviour in the chiton
Acanthopleura gemmata (Blainville) (Mollusca: Poly-
placophora). Behav Ecol Sociobiol. 14(1): 15-20.
Chelazzi G, Focardi S, Deneubourg JL. 1983b. A comparative
study on the movement patterns of two sympatric tropical
chitons (Mollusca: Polyplacophora). Mar Biol. 74(2): 115-
125.
Chelazzi G, Focardi S, Deneubourg JL. 1988. Analysis of move-
ment patterns and orientation mechanisms in intertidal chitons
and gastropods. Behavioral Adaptation to Intertidal Life,
Book 151. Springer US. p. 173-184.
Focardi S, Chelazzi G. 1990. Ecological determinants of bioeco-
nomics in three intertidal chitons (Acanthopleura spp.). J
Anim Ecol. 59: 347-362.
Grayson JE, Chapman MG. 2004. Patterns of distribution and
abundance of chitons of the genus Ischnochiton in intertidal
boulder fields. Austral Ecol. 29(4): 363-373.
Humann, P, DeLoach N, Wilk, L. 1992. Reef Creature Identifica-
tion: Florida Caribbean Bahamas. New World Publications,
Inc. 3rd Edition p. 246.
Latyshev NA, Khardin, AS, Kasyanov, SP, Ivanova, MB. 2004. A
study on the feeding ecology of chitons using analysis of gut
contents and fatty acid markers. J Mollus Stud. 70(3): 225-
230.
Littler MM, Littler, DS. 1984. Models of tropical reef biogenesis:
The contribution of algae. Prog Phyc Res. 3: 323-355.
Littler MM, Littler DS, Taylor, PR. 1995. Selective herbivore
increases biomass of its prey: A chiton-coralline reef-building
association. Ecology. 1666-1681.
Rasmussen KA, Frankenberg EW. 1990. Intertidal bioerosion by
the chiton Acanthopleura granulata; San Salvador, Bahamas.
Bull Mar Sci. 47(3): 680-695.
Therriault, TW, Kolasa, J. 1999. Physical determinants of rich-
ness, diversity, evenness and abundance in natural aquatic
microcosms. Hydrobiologia. 412: 123-130.
46
KORALLION. VOL 5. 2014
DISTRIBUTION, LENGTH-WEIGHT RELATIONSHIP, BURROWING RATES,
SIZE FREQUENCY, AND COLORATION FREQUENCY OF DONAX
DENTICULATUS IN DISCOVERY BAY, JAMAICA
Megan A. Sporre
Department of Marine Science, Coastal Carolina University, PO Box 261954, Conway, SC 29526
ABSTRACT
Donax denticulatus is an intertidal beach clam that is widely dispersed throughout the Caribbean and found primarily
burrowed in saturated beach sand. Puerto Seco Beach is a small, sandy beach located in the southeastern corner of Discov-
ery Bay, Jamaica. The objectives of this study were to determine the distribution, calculate an estimate of population size,
determine size and color frequency of the population, and determine differences in burrowing rates of clams based on size.
In total, 553 D. denticulatus were collected along two, 8 m transects, measure, weighed, and identified by color. The bur-
rowing speed and length of a separate 100 clams was also collected. The population of D. denticulatus was most dense
within the swash zone, size frequency results show two distinct generations, the most frequent shell colors were white or
cryptic in a sandy habitat, and burrowing speed increased as length of the clam increased.
KEYWORDS: Population, allometric relationship, beach clam, Puerto Seco Beach
INTRODUCTION
DONAX DENTICULATUS (Linnaeus, 1758) is a small
beach clam that inhabits the intertidal zone of sandy
beaches in the West Indies (McClachlan et al. 1996). They
are found in the highest densities within the saturated sands
of the swash zone (Wade 1967, Jarosinski 2013). When D.
denticulatus are found in the unsaturated zones of the
beach, it is usually smaller individuals (McClachlan et al.
1996). Densities of this beach clam have varied between 10
and 4120 clams m-1
across 22 beaches in Jamaica (Wade
1967).
Discovery Bay, Jamaica is nearly cut off from the open
ocean by a fringing reef on both sides of the basin. The
entrance to the bay is used as a shipping channel and is
routinely dredged (Gayle and Woodley 1998). While the
shoreline is mostly limestone rock, a sandy beach is located
in the southeastern corner of the bay. This 400-ft stretch of
beach is called Puerto Seco Beach (Gayle and Woodley
1998).
The beach habitat is controlled by three factors: tides,
wave action, and sand (Defeo and McLachlan 2005).
Donax denticulatus thrive in sands of medium coarseness
where their muscular foot can anchor most successfully;
they also prefer sands of low organic content (Wade 1964).
Beach clams must also inhabit beaches that are exposed to
the open ocean as they use wave action and tides to main-
tain their distribution within the swash (Wade 1964). To
This research was conducted as part of Coastal Carolina Universi-
ty’s classes MSCI 477, Ecology of Coral Reefs, and MSCI 499,
Directed Undergraduate Research in Discovery Bay, Jamaica. 14
– 31 May 2014. Contact e-mail: masporre@coastal.edu
maintain their positioning, these clams migrate with the
tides; riding the waves up shore and then burrowing within
the sand using their two siphons and muscular foot to keep
from being drawn down the beach by receding waves
(Wade 1969).
There are many different color morphs of D. denticula-
tus; variety is population dependent. Wade (1967) found
that beach clam populations at Puerto Seco were dominated
by white clams. Smith (1975) found that Donax faba
(Gmelin, 1791) with the most disruptive coloration (darker
or brighter colors) were preyed on more heavily when pop-
ulation density is high, while more cryptic color morphs
(light, sand colored clams) are preyed upon when the popu-
lation density is low. Mikkelsen (1978) proposed a similar
hypothesis of reflexive selection by predators to variation in
shell color frequency; rarer color morphs may be preyed
upon less because they are harder to find when there are
many more clams of different colors on the beach.
Donax denticulatus bury themselves within the sand,
leaving just their siphons exposed at the surface to filter
feed (Wade 1969). These clams can survive for up to three
days in drying sand before dying (Wade 1967). The bur-
rowing behavior allows D. denticulatus to escape predation
while still being able to filter feed (Wade 1967). Trueman
(1971) found that the average burrowing time of D. dentic-
ulatus was between five and six seconds.
The purpose of this research was to determine the distri-
bution of D. denticulatus on Puerto Seco beach, the size
and coloration frequency of the beach clam population, the
allometric relationship between length and weight, and the
relationship between size and burrowing rate.
47
METHODS
Donax denticulatus were collected from Puerto Seco
beach on the southeastern side of Discovery Bay, Jamaica
on May 25th and 26th during a flooding tide. Two eight
meter transects were laid from the berm zone to the swash
zone. At the time of sampling approximately 50% of the
transect was considered to be the berm zone, 25% the
swash, zone and 25% the surf zone. Ten samples per zone
were haphazardly collected using a 16 cm diameter cylin-
der. The collected sand was sieved through 2 mm mesh and
remaining clams were taken. In total, 553 D. denticulatus
were collected.
The number of clams per sample were counted and nor-
malized with respect to area (clams per m2
). Each clam was
measured at its longest width to the nearest tenth of a mm
using a Vernier caliper and weighed to the nearest ten-
thousandth of a gram using an analytical scale. Coloration
of each clam was determined using methods from Mikkel-
sen (1974) and grouped into one of six predetermined cate-
gories: white, pale yellow, light purple, amber, black, or
rayed (Figure 1). Clams were placed in the rayed category
based solely on presence of rays; ray coloration and base
color were not taken into account.
Burrowing rates of D. denticulatus were calculated by
haphazardly selecting 100 clams from actively moving
clams on the beach. They were timed using hand-held stop
watches to the nearest on hundredth of a second from their
first movement until they were completely submerged in
the sand. After completely burrowing, the clams were re-
moved from the sand and measured using Vernier calipers
to the nearest tenth of a mm at their longest width. Clams
were arbitrarily grouped into three size categories, small
(8.0–11.0 mm), medium (11.1–14.0 mm), and large (14.1–
17.1 mm) based on length.
Single factor ANOVAs were run on density data, color
and size data, and zonation and size data. Chi Square tests
were performed on size frequency, color frequency, and
density. A line of best fit for a power function was deter-
mined for the allometric relationship between length and
weight.
There was a significant difference between the sizes of
D. denticulatus found in each zone (ANOVA, p < 0.01).
The berm zone had the longest average length and the surf
zone had the shortest average length, 12.72 mm ± 1.4 and
10.56 mm ± 2.6, respectively (Figure 3).
The sizes of clams measured ranged from 4 mm to 15.5
mm, the median size was 12.2 mm, and the average length
was 11.4 mm ± 2.3 (mean ± standard deviation). The histo-
gram of size frequencies shows a major peak between the
sizes of 11 mm and 13.99 mm and a minor peak between
the sizes of 7 mm and 9.99 mm (Figure 4). Thirty-one per-
cent of the population was between 12.0 and 12.99 mm.
The distribution of sizes varies significantly from a random
distribution (Chi Square, df = 12, p < 0.01).
There is a strong power function or growth curve rela-
tionship between length and weight of D. denticulatus (r2
=
0.987, y = 0.0002x3.020
) (Figure 5). The heaviest clam was
0.8053 g and 15.3 mm long while the lightest clam was
0.0150 g and 4.0 mm. The average weight was 0.3534 g ±
0.1705.
Figure 1. Donax denticulatus representing the six different color
categories. From left to right: light purple, white, pale yellow,
amber, black, and two different polymorphs considered to be in
the rayed category.
Figure 2. Densities per m2
of D. denticulatus in the three different
beach zones. There is a significant difference in densities
(ANOVA, p < 0.01). The densities are not randomly distributed
(Chi Square, df = 2, p < 0.01)
RESULTS
There was a significant difference in the densities of D.
denticulatus between the berm, swash, and surf zones
(ANOVA, p < 0.001). The highest amounts of clams per m2
were found in the swash zone, approximately 2,268 clams
per m2
(Figure 2). There density of clams in the swash zone
were over ten times greater than those found in the berm
zone and over eight times greater than the number of clams
found in the surf zone. The distribution of clams varies
significantly from a random distribution (Chi Square, df =
2, p < 0.01).
SPORRE: BEACH CLAM MORPHOLOGY AND DISTRIBUTION48
KORALLION. VOL 5. 2014
Almost half of the clams collected were white, the rarest
color polymorph (2%) was black (Figure 6). The distribu-
tion of color polymorphs is highly skewed (Chi Square, df
= 5, p < 0.001). There was a significant difference between
the lengths of the different colors (ANOVA, p < 0.01)
(Figure 7). Black clams had the shortest average length,
8.95 mm ± 3.48, while light purple clams had the longest
average length 11.69 mm ±1.98.
Figure 3. Average length of D. denticulatus found in the three
different zones of the beach. There is a significant difference be-
tween lengths in the three zones (ANOVA, p < 0.01).
Figure 4. Size frequency histogram for the distribution of sizes of
the D. denticulatus population at Puerto Seco beach. The distribu-
tion is significantly different than random (Chi Square, df = 12, p
< 0.01)
Figure 5. Growth curve relationship between length and weight of
D. denticulatus. There is a strong power function relationship (r2
=
0.987, y = 0.0002x3.020
).
Figure 6. Frequency of coloration for the population of D. dentic-
ulatus. The distribution differs significantly from random (Chi
Square, df = 5, p < 0.001).
There was a significant difference between the burrow-
ing rates of small, medium, and large clams (ANOVA, p<
0.001). On average small clams burrowed 1.8 times faster
than large clams (Figure 8). There is a weak positive corre-
lation between burrowing speed and length (r2
= 0.2011 y =
0.0.2576x + 0.0189) (Figure 9)
DISCUSSION
The population of D. denticulatus at Puerto Seco Beach
Figure 7. Average length for clams in each size category. There is
a significant difference between lengths of each color (ANOVA, p
< 0.01).
49
is found primarily in the swash zone with very low densi-
ties in both the surf and berm zones. This supports work
done by both Jarosinski (2013) and Wade (1967). Donax
denticulatus require the wave action that occurs in the
swash zone to keep the water aerated and keep organic de-
tritus suspended (Wade 1967). Based on the densities of
clams found by Wade (1967) of up to 4120 clams m-2
, the
population at Puerto Seco, approximately 2268 clams m-2
,
could be considered a small to medium sized population.
Fine grain size of the beach may be a factor in deterring a
large population from forming at Puerto Seco. If the sand is
too fine, it will be too closely packed for the clam to be
able to burrow successfully, larger grain sizes also nega-
tively impact the burrowing success of these clams (Wade
1964). The optimal grain size for burrowing is between a
Figure 8. There is a significant difference in the burrowing times
of small, medium, and large D. denticulatus (ANOVA, p < 0.01).
Figure 9. There is a weak positive correlation between length and
burrowing rate (r2
= 0.2011, y = 0.2576x + 0.0189).
grain sorting index of 0.2 and 0.4 (Wade 1964). When D.
denticulatus is not buried in the sand it will be exposed to
higher predation stress from shore birds and crabs (Wade
1967).
Clams found in the berm zone were larger than clams
found in both the swash and surf zones and the average size
of the clams decreased down the beach. These results disa-
gree with McClachlan et al. (1996) and Jarosinski (2013)
who both found that smaller individuals inhabit the berm
zone. The low sample size of small clams in all zones could
be a reason for the variation in results. Strong flood tides
may be bringing larger clams up the beach, while weaker
receding tides may be unable to carry these heavier clams
back down shore, leaving them stranded in the berm.
The size frequency distribution indicated that there are
two distinct generations of D. denticulatus within the popu-
lation at Puerto Seco. The parent generation ranges be-
tween 11 and 14.99 mm while their offspring generation
ranges between 7 and 9.99 mm. Reproduction for D. den-
ticulatus occurs as mass spawning and peaks in the months
of November, December, and January (Wade 1968). Most
clams do not survive through the first year (Wade 1968).
With maximum growth rates that reach 2.5 to 3.0 mm a
month dependent on biotic and abiotic factors (Wade
1968), the parent generation may very well be from spawn-
ing events occurring from 2012–2013 while the offspring
generation may have arisen due to spawning occurring
from 2013–2014. McClachlan et al. (1996) found distinct
juvenile cohorts from 8–9 mm during their study of D. den-
ticulatus as well as reduced recruits and spat (clams less
than 4.0 mm) from January to June. Reduced spawning
rates in April and May (Wade 1968) can also be attributed
to the small sample size of smaller clams. Future studies
focusing on growth rates and population ecology at Puerto
Seco Beach will be more useful in determining population
structure, mortality, fecundity, and survivorship.
There is an evident relationship between length and
weight of D. denticulatus. The allometric relationship of D.
denticulatus is very similar to the length-weight relation-
ship of Donax cuneatus (Linnaeus, 1758) described by Na-
yar (1955). Smaller sized clams accumulate mass at a slow-
er rate than larger clams. For D. denticulatus growth in
length will slow with age (Wade 1968), while their weight
growth will increase with age. This may occur because less
energy is spent increasing shell size and the clam is able to
use this energy to accumulate greater mass. A larger shell
also will allow for a larger muscular foot and longer si-
phons.
Cryptically colored (white, pale yellow, and rayed) D.
denticulatus are the most common among the population at
Puerto Seco. Past research on the clam population at Puerto
Seco Beach has reported almost the entirety of clams to be
dominated by white polymorphs (Wade 1967). Mikkelsen
(1978) found that a majority of Donax variabilis (Say,
1822) were similar in color to the beach sand where their
SPORRE: BEACH CLAM MORPHOLOGY AND DISTRIBUTION50
KORALLION. VOL 5. 2014
population was found. Multiple hypotheses on coloration
within the genus Donax have been proposed (Smith 1975,
Mikkelsen 1978). Donax faba with the most disruptive col-
oration suffer from increased predation when population
sizes are larger compared to when densities are lower; in
less dense populations the predation is spread more evenly
over all of the polymorphs (Smith 1975). A theory of
“reflexive selection” has been proposed, stating that colors
that occur in low frequencies may experience a release
from predation because of the inability of predators to find
them when other colors are so abundant (Mikkelsen 1978).
This release from predation will allow the frequencies of
these polymorphs to increase (Mikkelsen 1978). Lengths of
cryptically colored clams were longer than the lengths of
amber and black clams. This could be because larger and
darker clams will be easier for birds and other predators to
find. Future research may focus on the amino acid sequenc-
es that cause the variation in coloration as well as occur-
rences of color switching which has been documented to
occur with the addition of new growth rings (Wade 1968).
At least one example of a coloration change in a clam was
observed during this study.
Larger clams have slower burrowing speeds than small-
er sized clams. Burrowing time of Donax serra (Röding,
1798) and Donax sordidus (Hanley, 1845) increases as the
length of the clam increases (Nel et al. 2001). The burrow-
ing times from this research are about one to two seconds
faster than burrowing rates from Trueman (1971). Differ-
ences in burrowing rate could be affected by small sample
size as well as differences in sand grain size. The grain size
a Puerto Seco may be more favorable to burrowing than in
previous research. The weak correlation of length and bur-
rowing speed may be strengthened by increased sample
size. Future research may involve the burrowing rates of D.
denticulatus in sand of differing grain size and continued
studies of natural burrowing speeds.
ACKNOWLEDGMENTS
I would like to thank the Discovery Bay Marine Lab as
well as the University of the West Indies for the use of their
facilities and their warm hospitality. I would like to thank S
Luff, D Edwards, O Holder, and D Scarlet for their help on
and off the boats. I would also like to thank E Burge for his
patience and help. Lastly, thanks to T Beheler, C Raynor, A
Galarno, and the rest of my classmates for their help with
data collection and making this experience so enjoyable.
LITERATURE CITED
Defoe O, McClachlan A. 2005. Patterns, processes and regulatory
mechanisms in sandy beach macrofauna: A multi-scale analy-
sis. Mar Ecol Prog Ser. 295:1-20.
Gayle PMH, Woodley JD. 1998. Discovery Bay, Jamaica. In:
Kjerfve B, editor. CARICOMP – Caribbean coral reef,
seagrass, and mangrove sites. Paris: UNESCO. 17-33.
Jarosinski JM. 2013. Abundance and vertical distribution of
Donax denticulatus, Discovery Bay, Jamaica. Korallion. 4:6-
9.
McClachlan A, Dugan JE, Defoe O, Ansell AD, Hubbard DM,
Jaramillo E, Penchaszadeh PE. 1996. Beach clam fisheries.
Oceano Mar Biol: Ann Rev. 34:163-232.
Mikkelsen PS. 1978. A comparison of intertidal distribution,
growth rates and shell polychromism between two Florida
populations of the coquina clam Donax variabilis Say, 1822.
Thesis. Florida Institute of Technology. 1-88.
Nayar KN. 1955. Studies on the growth of the wedge clam, Donax
(Latona) cuneatus Linnaeus. Ind J Fish. 2(2): 325-348.
Nel R, McLachlan A, Winter DPE. 2001. The effect of grain size
on the burrowing of two Donax species. J Exp Mar Biol Ecol.
265(2): 219-238.
Smith DAS. 1975. Polymorphism and selective predation in
Donax faba Gmelin (Bilvalvia: Tellinacea). J Exp Mar Biol
Ecol. 17(2): 205-219.
Trueman ER. 1971. The control of burrowing and the migratory
behaviour of Donax denticulatus (Bivalvia: Tellinacea). J
Zool. 165(4): 453-469.
Wade, B. 1964. Notes on the ecology of Donax denticulatus
(Linné). Proc Gulf Caribb Fish. 1(7): 36-42.
Wade BA. 1967. Studies on the biology of the West Indian beach
clam, Donax denticulatus Linné. 1. Ecology. Bull Mar Sci. 17
(1):1 49-174.
Wade B. 1968. Studies on the biology of the West Indian beach
clam, Donax denticulatus Linné. 2. Life History. Bull Mar
Sci. 18 (4):876-901.
Wade B. 1969. Studies on the biology of the West Indian beach
clam, Donax denticulatus Linné. 3. Functional Morphology.
Bull Mar Sci. 19(2): 306-322.
51
STUDIES IN CORAL REEF ECOLOGY52
KORALLION. VOL 5. 2014 53
STUDIES IN CORAL REEF ECOLOGY54
KORALLION. VOL 5. 2014 55
SHELL EXCHANGE MODELS IN CARIBBEAN HERMIT CRABS,
COENOBITA CLYPEATUS: NEGOTIATOR OR AGGRESSOR
D. Cristina O’Shea
Department of Marine Science, Coastal Carolina University, PO Box 261954, Conway, SC 29526
ABSTRACT
Shell exchange behaviors in hermit crabs consist of a pair of individuals competing for a resource and often follow one
of two models. In the negotiation model, both crabs benefit from the trade and each crab attains a shell with an internal vol-
ume more suited for their body size. In the aggression model, the initiator crab forces the non-initiator to abandon its shell
and the exchange is only beneficial for the initiator crab. Populations of the Caribbean hermit crab, Coenobita clypeatus
were observed in the laboratory and shell exchange behaviors were recorded. A total of 20 shell-related interactions were
observed. Four of these interactions resulted in shell exchange following the aggression model, one resulted in shell ex-
change consistent with the negotiation model, and 15 interactions did not result in shell exchange (which is a behavior that
is also consistent with the negotiation model). Coenobita clypeatus favored the negotiation model. In the negotiation model,
the non-initiating crab refuses to vacate because its current shell is closer to the preferred size than that of the initiating
crab. In intraspecific interactions, the negotiation model is the best way to predict the outcome of shell exchange behaviors
for C. clypeatus.
KEYWORDS: Shell exchange, Caribbean hermit crab, exchange models, intraspecific interactions
INTRODUCTION
HERMIT CRABS use the abandoned shells of gastropods
as their refuge. Hermit crabs require the protection of
the shells in order to shield their vulnerable abdomen
(Hazlett 1987) and to avoid predation, cannibalism and
desiccation (Rotjan et al. 2010). According to Elwood
(1995), most species of hermit crabs have morphological
adaptations that allow them to live in gastropod shells in-
cluding a symmetrically coiled abdomen and a pair of legs
that have evolved to grasp their shell.
As hermit crabs outgrow their current shells, they are
forced to find an alternative shell that can accommodate
their increased body size. Hermit crabs traditionally get
their new shelter either by occupying an empty gastropod
shell or by exchanging shells with another crab. However,
since most shells are unavailable (some are buried and
some are occupied by living gastropods), shell exchange
becomes the primary means of new shelter acquisition
(Barnes and De Grave 2000).
The importance of shell acquisition as well as limita-
tions in shell supply requires crabs to develop numerous
mechanisms for shell selection, inspection and negotiation
(Hazlett 1990). The processes of hermit crab shell selection
and inspection are very specific (Garcia and Mantelatto
2001) and relate to individual and sexual preferences
(Hazlett and Baron 1989). These processes are of extreme
importance for hermit crabs because suitable shell features
provide better protection and represent greater chances for
survival (Briffa and Elwood 2005). Hermit crabs appear to
select shells that are light enough to carry and also large
enough to accommodate their entire body. By selecting
lighter shells, crabs can keep their metabolic energy con-
sumption low (Briffa and Elwood 2005).
According to Barnes and De Grave (2000), there are
many complex behaviors associated with the inspection and
exchange of the hermit crab shells. The process of shell
acquisition begins when a hermit crab locates a new shell
by following chemical cues released by dead conspecifics
(Thacker 1994). Hermit crabs would approach and investi-
gate any shell that shows potential for utility because useful
shells are not common (Hazlett 1989). Inspection and ex-
change behaviors vary between species but most species
tend to approach and examine a new shell using a combina-
tion of their antennae, walking legs and chelipeds. It is
common for hermit crabs to grasp an empty shell and insert
their large claw into the operculum in order to study the
interior condition of the shell (Elwood 1997). Hermit crabs
use the information obtained from visual and tactile stimuli
to make a decision regarding which shell they will use
(Hazlett 1987).
Shell exchange encounters begin with a shell-rapping
period (Elwood 1999) in which the initiator crab rapidly
and repeatedly hits its shell against the defender’s (non-
initiator) shell in a series of bouts. The defender will react
immediately by retracting into its shell and gripping the
collumella with its abdomen. The initiator will continue to
This research was conducted as part of Coastal Carolina Universi-
ty’s classes MSCI 477, Ecology of Coral Reefs, and MSCI 499,
Directed Undergraduate Research in Discovery Bay, Jamaica, 14
–31 May 2014. Contact e-mail: dcoshea@coastal.edu
56 O’SHEA: SHELL EXCHANGE IN HERMIT CRABS
strike its shell against the defender’s shell while pulling at
the chelipeds of its contestant in an attempt to coerce the
defender from the interior. The defender crab can release its
abdominal grip and allow the attacker to pull its body out
of the shell or it can resist the attack. According to a study
conducted by Briffa and Elwood (2002), successful attack-
ers rap at a higher rate and the rate of rapping is related to
the crab’s size and stamina. They concluded that larger
individuals rapped at a higher rate and therefore were more
successful than smaller crabs.
In these agonistic encounters, only one crab usually ben-
efits from the exchange. However, it is possible that both
crabs will find the endeavor mutually beneficial. In an ex-
ample given by Briffa and Elwood (2002), a large crab liv-
ing in a small shell might exchange with a smaller crab
occupying a shell that is too large.
These shell exchange interactions have been studied in
detail and often follow two models. These models are
called the negotiation exchange model and the aggression
exchange model. In the negotiation exchange model, both
crabs benefit from the trade attaining a shell with an inter-
nal volume more suited for their body size (Hazlett 1990).
A large crab in a small shell exchanging with a smaller crab
in a large shell is an example that follows the negotiation
model. However, it is also considered a negotiation model
if no shell exchange occurs because the defender crab will
not benefit from the interaction. In the aggression model,
the initiator crab forces the non-initiator to abandon its
shell and the exchange is only beneficial for the initiator
crab. In this model, the non-initiator crab would be left with
a shell that has an internal volume that is either too big or
too small for its body size. An initiator crab rapping on a
non-initiator’s shell followed by the instigator pulling the
defendant out of its shell is a clear example that follows the
aggression model. In 1987, Hazlett conducted an experi-
ment to determine the shell exchange model followed by
orange claw hermit crabs, Calcinus tibicen (Herbst, 1791)
and concluded that this species of crab normally follow the
negotiation strategy. However, some researchers have also
suggested that interspecific as well as intraspecific aggres-
sion is the most common behavior exhibited by hermit
crabs (Elwood and Stewart 1985).
Coenobita clypeatus (Herbst, 1791) known as Caribbean
hermit crab is a terrestrial crab that lives in vacant Nerite
peloronta (Linnaeus, 1758), Eutrochatella costata (Gray,
1824) and Littorina littorea (Children, 1834) shells. Coeno-
bita clypeatus is found on tropical and subtropical islands
in the Pacific, Indian and Atlantic Oceans (Morrison and
Spiller 2006). Coenobita clypeatus is also found throughout
the Caribbean as far north as the Florida Keys and Bermuda
and as far south as Venezuela.
The objective of this research was to determine if C.
clypeatus favors the negotiation or the aggression model
when competing for a desired shell. According to Hazlett
(1990), most research supports the idea that the Caribbean
hermit crabs behave in a way that is consistent with the
negotiation model.
The laboratory experiments were designed to test the
hypothesis that the Caribbean hermit crab behave similarly
to C. tibicen as well as to Hawaiian hermit crab, Calcinus
hazletti (Haig and McLaughlin, 1984) and that C. clypeatus
favors the negotiation model instead of the aggression
model. However, according to the aggression model of
shell exchange (Hazlet 1989), hostilite interactions were
expected if the initiator crab was considerably larger and
therefore capable of rapping at a higher a rate than the non-
initiator crab (Briffa and Elwood 2002).
METHODS
The fieldwork was conducted at the Discovery Bay
Marine Laboratory in Discovery Bay, Jamaica between
May 15th and May 30th 2014. Approximately 50 Caribbe-
an hermit crabs were collected from an area surrounding
the Discovery Bay Laboratory. The crabs were visually
separated by size (small, medium and large), placed in
holding tanks and left undisturbed for 24 hours.
Empty shells (collected from the surrounding mangrove
area) were measured (greatest length, aperture length, aper-
ture width) and weighed. Shell sizes were chosen to cover
the size range of crabs used in the experiment.
Since “the internal volume of the shell appears to be the
most important parameter used by crabs in shell
choice” (Hazlett 1990), the relationship between crab
weight and desired shell size was determined. The internal
volume of each shell was obtained by subtracting the
weight of the empty shell from the weight of the shell filled
with salt water with a known density of 1.02 g/cm3
; a meth-
od adapted from Hazlett’s (1990) study of Hawaiian hermit
crabs. However, in order to determine the internal volume
of the shell, Hazlett used dry sand instead of salt water. All
the measurements for the internal volume of the shell fell
between nine different categories. Once the internal volume
of each shell was obtained (Table 1), specific plastic color
confetti was glued outside of each shell according to its
specific value.
In previous research, such as Hazlett’s (1990), the inter-
nal volume of the shell was correlated to the crab’s body
size. However, due to the small size of C. clypeatus found
in Discovery Bay, measuring the chelipeds was impossible
without harming the crabs. Instead, it was determined that
using the weight of the crab (which is directly proportional
to its size) was a safer way to handle the crabs and would
still yield comparable data. To determine the shell size that
crabs prefer in relation to their weight, a free access experi-
ment was conducted (Hazlett 1990). The group of 50 crabs
was divided into five sets of 10 crabs each (n = 50) in order
to give each set access to a considerable number of empty
shells. For this experiment each set was placed inside a
plastic holding container (6 × 4 × 4 in) for a settling period
of 30 minutes. After the settling period, the crabs were
KORALLION. VOL 5. 2014 57
placed into a large observation tank (24 × 12 × 12 in) with
50 empty shells of different sizes and known volumes. The
hermit crabs had access to all empty shells for a period of 2
hours. After that time, they were separated into two groups:
those that chose a new shell and those that did not switch
shells. The crabs that transitioned into new marked shells
had their shells cracked using a bench vise and weighted
using a high precision electronic scale. The data obtained
from this set of crabs was used to run a regression line and
to determine the relationship between crab weight and pre-
ferred shell size. The crabs that did not move into a new
shell had their shells cracked, were placed (naked) inside a
large container and were given free access to new marked
and empty shells. All 50 crabs were used for the shell ex-
change experiment and were kept in separate containers
according to size when not under observation.
For the shell exchange experiment 10 sets of five crabs
(n = 50) were placed (one set of five crabs per trial) in one
large holding tank (24 × 12 × 12 in) and were observed for
60 minutes. Two parameters for crab interactions were es-
tablished in order to analyze crab behavior appropriately.
According to the first parameter, crab-pair interactions
were only considered shell exchange behavior when rap-
ping was observed and the initiator-crab continuously
tapped the shell of the non-initiator. According to the sec-
ond parameter, interactions concluded when the initiator
crab released the shell of the defender, walked away and no
shell exchange occurred or when the non-initiator crab va-
cated its shell and an exchange followed.
Negotiation model was considered if the non-initiator
crab obtained a shell closer to its preferred size or shell
exchange did not occurred because the non-initiator crab
would have no benefit from the exchange (Hazlett 1990). It
was considered aggression model behavior if the initiator
was larger than the non-initiator as well as if the non-
initiator did not benefit from the exchange.
RESULTS
After measuring the internal volume of about 100 empty
shells (collected from the surrounding mangrove), it was
determined that all internal volumes fell in one of nine cate-
gories. The categories for internal volume in relation to
marking color were: pink (confetti) = 0.098 cm3
; gold (confetti) =
0.196 cm3
; red (confetti) = 0.294 cm3
; blue (confetti) = 0.882 cm3
;
silver (confetti) = 2.059 cm3
; purple (confetti) = 0.392 cm3
; blue/
green (confetti) = 0.490 cm3
; green (confetti) = 0.588 cm3
and
purple/red (confetti) = 5.588 cm3
.
During the free-access experiment, a total of 30 crabs
selected a new marked-shell and 20 crabs did not vacate
their existing shell. The 30 crabs that voluntarily chose a
new shell had body weights that ranged from 0.07 g to 3.1
g. After running a linear regression, it was determined that
for the crab’s size range analyzed, there was not a statisti-
cally significant correlation between the weight of the crab
and the internal volume of its shell (R square = 0.01142; p-
value = 0.60335) (Figure 1).
For shell exchange behavior, 50 crabs were observed
for a total of 600 minutes over a period of one and a half
weeks. A total of 20 shell-related interactions were ob-
served. Of these 20 interactions, 15 resulted in no shell ex-
change that was consistent with a negotiator behavior, four
crab pair-interactions resulted in shell exchange that was
consistent with an aggressive behavior and one interaction
yielded shell exchange that was considered negotiation be-
havior (Table 1).
DISCUSSION
The interactions reported in this paper demonstrate that
C. clypeatus favors the negotiation over the aggression
model. A total of 15 shell-exchange interactions resulted in
no shell exchange and one interaction resulted in shell ex-
change. In other words, in 75% of the interactions the de-
fender crab refused to vacate its shell because doing so
would have represented a loss in shell fit and in 5 % of the
interactions, the defender crab was forced out of its shell
but benefited from the exchange acquiring a shell that was
more suitable to its body size. It can be said that 80% of the
interactions followed a negotiation model that involved a
mutual gain of resources for both initiator and defender
crabs. These behaviors are consistent with the negotiation
model in which the non-initiator refuses to vacate because
its current shell is closer to its preferred size than the shell
of the initiator crab. According to a couple of studies con-
ducted by Elwood and his colleagues, Caribbean hermit
crabs only exchange shells when both individuals benefit
from this trade. The shell-exchange behaviors observed in
Caribbean hermit crabs in Discovery Bay, Jamaica were
similar to the results obtained by Hazlett in his research on
Hawaiian hermit crabs. Hazlett (1990) experimented with
five hermit crab species including Clibanarius zebra (Dana,
1852), Calcinus laevimanus (Randall, 1840), Calcinus lat-
ens (Dana, 1852), Calcinus seuratic (Dana, 1851) and Cal-
Figure 1. Linear regression performed to determine the relation-
ship between the C. clypeatus’ body weight (g) and the preferred
internal volume of their shell.
O’SHEA: SHELL EXCHANGE IN HERMIT CRABS
cinus elegans (Milne-Edwards, 1836). Out of 255 shell-
related interactions, 144 were intraspecific and 111 were
interspecific. According to Hazlett (1990), approximately
69% to 78% of the intraspecific interactions followed the
negotiation model and 87% to 100% of the interspecific
interactions were characteristic of the negotiation model.
Hazlett concluded that overall; the negotiation model cor-
rectly predicted the outcome of the interactions 71.6% of
the cases. After conducting multiple studies on several spe-
cies of hermit crabs, Hazlett states that the negotiation
model is the best way to predict the outcome of shell-
exchange interactions not only for C. clypeatus but also for
about 15 species of hermit crabs.
Aggression between crabs was observed in all crab-pair
interactions. These interactions began with an initiator crab
approaching the non-initiator and grabbing the defender’s
shell. In some crab-pair interactions, the initiator crab held
the non-initiator’s cheliped while rapping on its shell. How-
ever, although the intent of the initiating crab was hostile,
the shell exchange model was not considered to be aggres-
sive because according to Elwood (1995), shell-exchange
models take into consideration the gain or loss in shell vol-
ume of the non-initiator individual. Intraspecific interac-
Table 1. Shell-exchange interactions recorded during observation
on Caribbean hermit crab (Coenobita clypeatus).
Interaction
Number
Exchange
occurred
Shell Exchange
Model
1 No Negotiation
2 No Negotiation
3 Yes Aggression
4 No Negotiation
5 No Negotiation
6 No Negotiation
7 Yes Aggression
8 No Negotiation
9 Yes Aggression
10 No Negotiation
11 No Negotiation
12 Yes Aggression
13 Yes Negotiation
14 No Negotiation
15 No Negotiation
16 No Negotiation
17 No Negotiation
18 No Negotiation
19 No Negotiation
20 No Negotiation
tions in this study were characterized by an aggressive be-
havior that was not always initiated by the larger crab. This
intraspecific hostility is not consistent with the hypothesis
stating that an aggressive behavior was going to be ob-
served if the initiator crab was considerably larger than the
non-initiator crab.
Taking the gain or loss in shell volume for the defender
into consideration, only four interactions were considered
aggressive behavior since the non-initiator crab did not
benefit from the exchange and did not gain in shell fit.
These behaviors are consistent with the hermit crab’s shell
exchange behavior described by Hazlett in one of his re-
search on Hawaiian hermit crabs. In his experiment, Hazlett
noted that out of 14 interactions recorded, 11 resulted in no
shell exchange and were considered negotiation behavior;
one interaction resulted in shell exchange and was consid-
ered negotiation behavior as well. Only three interactions
resulted in no shell exchange following an aggressive be-
havior.
Determining which shell exchange model hermit crabs
prefer or which is the most successful strategy was Haz-
lett’s motivation behind his study in 1981. Hazlett ex-
plained that the reason hermit crabs favor the mutual gain
model is the high probability that small crabs will be occu-
pying larger shells. The reason for this phenomenon is the
fact that there are more small crabs than large ones in any
population of hermit crabs. Consequently, the chances of a
small crab finding a new shell from a snail that recently
died are much greater. According to Hazlett, it is unlikely
that the shell found by the small crab would be the appro-
priate size therefore it is expected that this small crab
would exchange shells with a larger crab at a later time
(Hazlett 1981).
The results obtained from the relationship between
weight and shell internal volume were not consistent with
other studies that found these two measurements to be the
best way to determine the shell-size preference. A possible
explanation for the lack of correlation between body weight
and shell volume is the limited range in crab sizes that were
analyzed and a disproportionate number of medium size
crabs used in the experiment. The discrepancy in shell size
selected by the crabs could also be explained by the limited
range of internal volumes of available shells. According to
Hazlett (1992), crabs can modify their preferences regard-
ing shell size according the the availability of empty shells
(Hazlett 1992). It is possible that a smaller crab settles for a
shell with an internal volume greater than its ideal volume
or that a larger crab selects a shell with an internal volume
smaller than it would normally choose. In one of his studies
on hermit crabs, Hazlett concluded that on average, occu-
pied shells are smaller than the preferred size (Hazlett
1981). In a study conducted by Bartness on the influence of
shell on hermit crab growth, he observed that shell type and
size affect the hermit crab’s growth significantly. While
light shells allow a significantly higher growth rate (p <
58
KORALLION. VOL 5. 2014
0.05, t-test), shells with a smaller internal volume limits
this growth and even reverses it. Bertness stated that it is
possible that a hermit crab that selected a shell with an in-
ternal volume too small for its body to reduce its body size
(become smaller) next time it molts (Bertness 1981).
Although the volume of the shell is of critical im-
portance to hermit crabs, additional parameters such as
shell weight, aperture size, aperture shape may also be con-
sidered in shell selection (Hazlett 1981). If C. clypeatus
from Discovery Bay, selects its shells according to a pa-
rameter other than the internal volume of the shell, the ex-
perimental regression model would not show a significant
relationship between body weight and shell volume.
ACKNOWLEDGMENTS
I would like to thank M O’Shea for his exceptional
editing and writing skills and willingness to help me time
after time. Many thanks to D Scarlett for attempting to help
me clean up snail shells and letting me use the Hulk.
Thanks to O Holder, “Snow”, for helping me collect shells
and letting me be the captain of the boat. Special thanks to
the Ecology of Coral Reefs students who help me collect
crabs at night and were always enthusiastic to watch the
crabs exchange shells with me. Thanks to E Burge for his
valuable input and suggestions.
LITERATURE CITED
Barnes DKA, De Grave S. 2000. Ecology of tropical hermit crabs
at Quirimba Island, Mozambique: Niche width and resource
allocation. Mar Ecol Prog Ser. 206: 171-179.
Bertness MD. 1981. The influence of shell-type on hermit crab
growth rate and clutch size (Decapoda, Anomura). Crusta-
ceana. 40(2): 197-205.
Briffa M, Elwood RW. 2000. The power of shell rapping influ-
ences rates of eviction in hermit crabs. Behav Ecol Sociobiol.
3: 288-293.
Briffa M, Elwood RW. 2002. Power of shell-rapping signals influ-
ences physiological costs and subsequent decisions during
hermit crab fights. Proc Roy Soc B-Biol Sci. 269: 2331-2336.
Briffa M, Elwood RW. 2005. Metabolic consequences of shell
choice in Pagurus bernhardus: Do hermit crabs prefer cryptic
or portable shells? Behav Ecol Sociobiol. 59: 143-148.
Elwood RW. 1995. Motivational change during resource assess-
ment by hermit crabs. J Exp Mar Bio Ecol. 193: 41-55.
Elwood RW, Stewart A. 1985. The timing of decisions during
shell investigation by the hermit crab, Pagurus bernhardus.
Anim Behav. 33: 620-627.
Garcia RB, Mantelatto FLM. 2001. Shell selection by the tropical
hermit crab Calcinus tibicen (Herbst, 1791) (Anomura, Diog-
enidae) from Southern Brazil. J Exp Mar Bio Ecol. 265: 1–14.
Hazlett BA. 1981. The behavioral ecology of hermit crabs. Annu
Rev Ecol Evol Syst. 12: 1-22.
Hazlett BA. 1987. Information transfer during shell exchange in
the hermit crab Clibanarius antillensis. Anim Behav. 35: 218-
226.
Hazlett BA. 1989. Shell exchanges in the hermit crabs Calcinus
tibicen. Anim Behav. 37: 104-111.
Hazlett BA. 1990. Shell exchange in Hawaiian hermit crabs. Pac
Sci. 4: 401-406.
Hazlett BA. 1992. The effect of past experience on the size of
shells selected by hermit crabs. Anim Behav. 44: 203-205
Hazlett BA, Baron LC. 1989. Influence of shells on mating be-
havior in the hermit crab Calcinus tibicen. Behav Ecol Socio-
biol. 24: 369-376.
Morrison LW, Spiller DA. 2006. Land hermit crab (Coenobita
clypeatus) densities and patterns of gastropod shell use on
small Bahamian islands. J Biogeogr. 33: 314-322.
Rotjan RD, Chabot JR, Lewis SM. 2010. Social context of shell
acquisition in Coenobita clypeatus hermit crabs. Behav Ecol.
21: 639–646.
Thacker RW. 1994. Volatile shell-investigation cues of land her-
mit crabs: Effect of shell fit, detection of cues from other her-
mit crab species, and cue isolation. J Chem Ecol. 20(7): 457-
1482.
59
STUDIES IN CORAL REEF ECOLOGY60
For additional information visit www.ecologyofcoralreefs.com

Korllian Paper

  • 1.
    KorallionKorallion Ecology of CoralReefsEcology of Coral Reefs Discovery Bay, JamaicaDiscovery Bay, Jamaica Volume V, Maymester 2014Volume V, Maymester 2014
  • 2.
    Suggested citations forKorallion Volume Sporre MA, Raynor CB, Kammerer AJ, and EJ Burge, editors. 2014. Korallion. Coastal Carolina Studies in Coral Reef Ecology. 5: 72 pp. Individual paper (example) Baldwin, A. 2014. Population density and depth zonation of the long-spined sea urchin, Diadema antillarum, in Discovery Bay, Jamaica. Korallion. Coastal Carolina University Studies in Coral Reef Ecology. Sporre MA, Raynor CB, Kammerer AJ, and EJ Burge, eds. 5:1–4
  • 3.
    FOREWORD C OASTAL CAROLINA UNIVERSITYis a comprehensive, public university with one of the largest undergraduate ma- rine science programs on the east coast. In 2014 the university added a doctoral program in Marine Science— Coastal Marine Systems Science to the educational offerings at Coastal. Located in Conway, South Carolina, just minutes from Myrtle Beach, we are renowned for offering hands-on opportunities to students directly in the field. Our faculty are research-active in the laboratory and in the field and offer numerous opportunities to involve students in this research. The Department of Marine Science also offers three study abroad courses that give selected students the experience of conducting research while abroad. For almost 30 years, students and faculty from Coastal Carolina have traveled to the University of the West Indies Discovery Bay Marine Lab (DBML), in Discovery Bay, Jamaica. Here students learn about and gain first hand experience with coral reef ecosystems. Students participate in a three credit course, MSCI 477: Ecology of Coral Reefs, where they learn about reef structure, productivity, and diversity, while getting to directly observe what they learn through diving on the reef. The students also prepare and conduct an independent, faculty-supervised, research project that fulfills three cred- its of MSCI 499: Directed Undergraduate Research. The students prepare for the trip, which occurs annually in May, by spending time during the spring semester re- searching and preparing their projects. Once at DBML, students take part in diving, researching, learning, and enjoying the tropical coral reefs. They meet the natives, learn the culture, and get a real taste of Jamaica. As the trip ends, the last dives are logged and presentations and projects are finished. For most participants their Jamaican experience ends here, but com- pilation of this volume of papers occurs in the fall semester following our trip to Jamaica. Two to three of the students vol- unteer and are chosen to be editors, enrolling in MSCI 399: Scientific Publishing, during the fall semester to create this volume. The following papers are a compilation of the exceptional student research projects that collectively make up the fifth volume of Korallion. As the editors, we found this process to be sometimes frustrating but extremely rewarding and fun. We are proud of each paper, and with the authors we worked very hard to create a work that will be beneficial to those who follow in our footsteps. Working on this volume reminded us of the great experiences and the cherished memories we have from our time in Discovery Bay. We hope that this collection will contribute to the scientific community and be help- ful to the students who are selected for the trips in years to come. i
  • 4.
    STUDENT EDITORS Caitlin B.Raynor Class of 2015 Caitlin is from Laurel, Maryland and graduating with a B.S. in Marine Science. After graduation she plans to pursue a Masters of Teaching in middle level science. She hopes to become an aquarist with the goal of edu- cating the public about the marine world. Her favorite memory from Jamaica is a dive she had at Dancing Lady with Tiffany, Megan, and Ashton, when they spent the entire dive laughing through their regulators trying to spear lionfish. Andrew J. Kammerer Class of 2014 AJ is from southern New Jersey, and is graduating with a B.S. in Marine Science. He is attending graduate school at Coastal Carolina University starting in 2015, pursuing a masters degree focusing in radar related ocean wave measurements. All of his favorite memories from Jamaica involved climbing up things and jumping off of them, as well as being in the water, diving every day, as much as possible. Megan A. Sporre Class of 2015 Megan is from Bel Air, Maryland and graduating with honors and dual B.S. degrees in Marine Science and Bi- ology. After graduation she plans to attend graduate school in the Pacific Northwest focusing on the popula- tion genetics of pinnipeds. Her favorite memory from Jamaica was the last dive at Runaway Bay. The under- water canyon was breathtaking. STUDIES IN CORAL REEF ECOLOGYii
  • 5.
    FACULTY AND STAFF ErinJ. Burge Associate Professor, Marine Science eburge@coastal.edu Dr. Erin Burge has been involved with the Jamaica coral reef ecolo- gy program since 2007. He has been a certified SCUBA diver since 1988 and completed over 240 scientific dives in and around Discov- ery Bay. His research interests include environmental immunology, molecular physiology, and molecular biology of marine inverte- brates and fishes. At Coastal Carolina University, Dr. Burge has participated in projects ranging from using underwater videos to monitor grouper populations, molecular tools to detect parasites, and evaluating ecological changes on Caribbean coral reefs. For more information visit his faculty web page (www.coastal.edu/ marine/erinburge/ and www.ecologyofcoralreefs.com Steve Luff Dive Safety Officer and Instructor sluff@coastal.edu Steve Luff has been diving since 1977 and became a SCUBA in- structor in 1993. Steve is an alumnus of the Ecology of Coral Reefs program (‘96) and a graduate of the Marine Science program at Coastal Carolina University. He serves as the scientific dive safety officer and SCUBA program instructor for CCU. His attention to safe diving practices and almost 20 years of experience diving the north-central coast of Jamaica have given him a unique knowledge of the local diving conditions, environments, and marine life that are valuable assets to the students conducting field research and data collection during MSCI 477: Ecology of Coral Reefs KORALLION. VOL 5. 2014 Dwayne “Skeggy” Edwards Coxswain Naval Feurtado Driver Daniel Scarlett DBML Dive Safety Officer Oneil “Snow” Holder DBML Diver iii
  • 6.
    STUDENT PARTICIPANTS Tiffany M.Beheler Class of 2014 Tiffany is from Roanoke, Virginia and graduated with a degree in Marine Sci- ence with a minor in Biology. Tiffany hopes to pursue a Masters in Australia focusing on coral reef ecology. Her fa- vorite memory from Jamaica was her last dive with AJ, Cait, and Meg. They got to dive with a green sea turtle at Runaway Bay Canyon. Catharine C. Gordon Class of 2016 Catharine is from Iowa City, Iowa, majoring in marine science with a minor in biology. Her career goals include becoming a head aquarist and dive master. Her favorite memo- ries from the trip are Dunn’s River Falls and the bonfire with the lab staff. These were times when the group bonded and they got to see the culture of Jamaica. Megan E. Miller Class of 2015 Megan is from Pittsburgh, Pennsyl- vania and pursuing a degree in Ma- rine Science with a minor in Biolo- gy. After graduation she plans to apply for the Peace Corps or to be a fisheries observer in Alaska. Her favorite memory from Jamaica is diving. She loved waking up every morning and going to dive, it was beautiful and calming. Lanie M. Esch Class of 2015 Melanie is from Grand Rap- ids, Michigan and came to Coastal Carolina to study ma- rine biology. She will gradu- ate with a B.S. in Marine Sci- ence and a minor in biology. She plans to apply for gradu- ate school in the spring of 2016. Her favorite memory of Jamaica was the first dive at Dairy Bull. The beauty of the reef reminded her of why she loves what she studies and plans to do with her future. Sam M. Cook Class of 2015 Sam is from Crescent Township, Pennsylva- nia. She will be graduating with a B.S. in Ma- rine Science and a double minor in Biology and Environmental Science. She plans to attend graduate school for environmental management or policy and pursue a career related to that field. Her favorite memory was getting to see a nurse shark on the forereef. STUDIES IN CORAL REEF ECOLOGYiv
  • 7.
    STUDENT PARTICIPANTS Ariana A.Baldwin Class of 2015 Ariana is a Marine Science major and is originally from Crofton, Maryland. After graduating, Ariana hopes to attend graduate school to continue her career in scien- tific diving. Her favorite memory from the Jamaica was being able to dive mul- tiple times every day and visiting Bioluminescent Bay. Ashton J. Galarno Class of 2015 Ashton is from Columbus, Indiana and majoring in marine science with minors in biology and Spanish. She plans to start graduate school the following year, pursuing a masters degree and/or PhD in marine biology, focusing on coral reef ecology. One of her favorite memories from Jamaica was lionfish 'hunting' with Tiffany, Megan, and Caitlin. Brandon Hinze Class of 2015 Brandon is a Psychology major with a minor in Marine Science from Potosi, Missouri. After gradu- ation in May, he plans to become a marine animal behaviorist. Some of his favorite memories were of the people on the trip along with the staff at DBML. He also enjoyed the combination of waking up each morning to the ocean in a com- pletely stress-free environment surrounded by amazing people. D. Cristina O’Shea Class of 2014 Cristina was born in Manizales, Co- lombia and graduated from CCU with a B.S. in Marine Science and a minor in Biology. She hopes to attend Texas A&M University to pursue a Masters degree in Marine Biology specializing in the physiological and behavioral mechanisms that allow marine mam- mals to dive to great depths for pro- longed periods of time. She loved the disposition of the Jamaican people and their hospitality. vKORALLION. VOL 5. 2014
  • 8.
    TABLE OF CONTENTS POPULATIONDENSITY AND DEPTH ZONATION OF THE LONG-SPINED SEA URCHIN, DIADEMA ANTILLARUM, IN DISCOVERY BAY, JAMAICA Ariana A. Baldwin……………………….…………….…1 REEF COVERAGE AND SPECIES RICHNESS WITH RESPECT TO WATER DEPTH AT DISCOVERY BAY, JAMAICA Melanie M. Esch……………………….…………………5 OBSERVING THE EFFECTIVENESS OF THE DISCOVERY BAY FISH SANCTUARY USING REEF SURVEY TECH- NIQUES Samantha M. Cook.……………………….………………9 DENSITY, RESIDENCE TIME, AND INDIVIDUAL ASSOCIA- TION OF FLAMINGO TONGUE SNAILS (CYPHOMA GIBBO- SUM) ON GORGONIAN HOSTS Catharine C. Gordon…..……………………..…….……15 STUDIES IN CORAL REEF ECOLOGYvi
  • 9.
    TUBE AND VASESPONGE DIVERSITY, ABUNDANCE, AND DENSITY OF THEIR SYMBIONT, OPHIOTHRIX SUENSONII Tiffany M. Beheler…………………………………….…19 TABLE OF CONTENTS DEPTH DISTRIBUTION, SIZE FREQUENCY, AND TIP COLOR POLYMORPHISM OF THE GIANT SEA ANEMONE, CONDY- LACTIS GIGANTEA, OF DISCOVERY BAY, JAMAICA Ashton J. Galarno……………………………..…….……27 A COMPARISON OF THE RIO BUENO AND DISCOVERY BAYS BASED ON FECAL COLIFORM CONCENTRATION IN RELATION TO FLUVIAL INPUT AND SURROUNDING HUMAN DEVELOPMENT Megan E. Miller…..………………………..……….……35 WATER COLUMN PROFILE AND PHYSICAL/BIOLOGICAL ANALYSIS OF CRATER LAKE, DISCOVERY BAY, JAMAICA Andrew J. Kammerer..…………………….…..…………39 KORALLION. VOL 5. 2014 vii
  • 10.
    TABLE OF CONTENTS NETMOVEMENT RATES OF ACANTHOPLEURA GRANULATA WHEN SHELTER AND FOOD ARE PRESENT WITHIN THE HABITAT Caitlin B. Raynor…..……………………………….……43 DISTRIBUTION, LENGTH-WEIGHT RELATIONSHIP, BUR- ROWING RATES, SIZE FREQUENCY, AND COLORATION FREQUENCY OF DONAX DENTICULATUS IN DISCOVERY BAY, JAMAICA Megan A. Sporre…..………………………….……….…47 SHELL EXCHANGE MODELS IN CARIBBEAN HERMIT CRABS, COENOBITA CLYPEATUS: NEGOTIATOR OR AG- GRESSOR D. Cristina O’Shea…..…………………………….……55 STUDIES IN CORAL REEF ECOLOGYviii
  • 11.
    This research wasconducted as part of Coastal Carolina Universi- ty’s classes MSCI 477, Ecology of Coral Reefs, and MSCI 499, Directed Undergraduate Research in Discovery Bay, Jamaica, 14 –31 May 2014. Contact e-mail: aabaldwin@coastal.edu POPULATION DENSITY AND DEPTH ZONATION OF THE LONG-SPINED SEA URCHIN, DIADEMA ANTILLARUM, IN DISCOVERY BAY, JAMAICA Ariana A. Baldwin Department of Marine Science, Coastal Carolina University, PO Box 261954, Conway, SC 29526 ABSTRACT: Many corals require photosynthesis from symbiotic zooxanthellae that are embedded in their internal tissues. Without primary production from these symbionts, many corals are unable to surpass maintenance metabolism requirements, thus substantial reef accretion depends on the presence of zooxanthellae and the availability of light. Benthic shallow water grazers such as the long-spined sea urchin, Diadema antillarum, effectively limit the growth of macroalgae that outcompete corals for space, light, and nutrients. Diadema antillarum is considered a keystone species in Caribbean reefs as this urchin regulates algal growth in shallow reef ecosystems. Diadema antillarum populations throughout the Caribbean have been slowly recovering from massive die-off events in the early 1980s and 1990s. In the absence of grazing, many Caribbean reefs have transitioned from a state of coral dominance to a state of macroalgal dominance. This study shows the density of D. antillarum with depth and quantifies the “Diadema zone” on the western forereef of Discovery Bay, Jamaica. The data obtained in this study shows that Diadema populations on the forereef have increased from 2010–2014 , and the depth range where they are most abundant has become slightly shallower. KEYWORDS: Diadema zone, keystone species, algal growth regulation, population recovery INTRODUCTION CORAL REEFS are delicate ecosystems heavily influ- enced by factors such as light availability, surface temperature, water quality, and essential symbiotic relation- ships. Symbiotic zooxanthellae derive energy from light to provide tropical corals with energy, thus substantial reef growth depends on the abundance of light (Anthony and Fabricus 2000). In most reefs, macroalgae dominate zoo- xanthellae in biomass, resulting in limited zooxanthellae photosynthesis (Small and Adey 2001). Extensive compe- tition with algae may cause the coral to expel zooxanthellae from its internal tissues, known as bleaching (Fitt et al 2001). Benthic shallow-water grazers such as Diadema antillarum (Philippi, 1845) regulate percent algal cover by feeding on competitive algae. Without this regulation, al- gal growth rates greatly exceed those of the corals, result- ing in competition and possible coral bleaching or mortali- ty. Multiple experiments by Sammarco (1980) demonstrate that algal cover and the presence of D. antillarum are in- versely related. In the absence of D. antillarum, corals suf- fered severe competitive losses to other benthic organisms and coralline algae. Because D. antillarum effectively mod- erates competition and algal cover, this urchin has been characterized as a keystone species in shallow reef ecosys- tems. Diadema antillarum has a substantial impact on the structure of these ecosystems and there may be grave con- sequences if the abundance of D. antillarum changes sig- nificantly. The management and understanding of the ef- fects of sea urchin populations on shallow reef ecosystems may help to prevent further declination of corals, and may be a key in avoiding catastrophic ecosystem changes (Alves et al. 2003). Over the past few decades, a predominant issue in Car- ibbean reef ecology is the transition of coral dominance to macroalgal dominance. Discovery Bay has been a study site since the 1950s and is at the forefront of reports show- ing a trend in the shift of reefs to macroalgal dominance. Throughout the 1950s, Jamaican reefs were characterized by few macroalgae with scleractinian coverage on about 90% of substrates (Edmunds and Carpenter 2001). In 1983, a disease event devastated the predominant Caribbean ur- chin, D. antillarum (Mumby et al. 2006). Two major hurri- canes occurring in the 1990s in combination with the dis- ease event caused a substantial loss of local Diadema. Sub- sequently, coral cover has been recorded to less than 10% and macroalgae reaches depths up to 35 meters (Edmunds and Carpenter 2001). Although numbers of D. antillarum have been slowly increasing over the last two decades, Car- ibbean reefs have continued to deteriorate (Mumby et al. 2006). This decline in Caribbean reef systems can be at- tributed to both natural and anthropogenic factors; global pollution, sea temperature rise, dominance of algae, and centuries of overfishing are some of the causes for reef degradation in combination with smaller-scale local sources (Mumby et al. 2006). The fringing reef system of Discovery Bay is located on the northern coast of the Caribbean island, Jamaica. The KORALLION. VOL 5. 2014 1
  • 12.
    reef sits abovea narrow shelf, sheltering the lagoon from oceanic swells. The bay lies in close proximity to a popu- lated, industrial town. Anthropogenic factors such as over- fishing, tourism, pollution, and runoff as well as sedimenta- tion and disease associated with bauxite shipping vessels have caused large amounts of reef degradation in this area. Overfishing has led to the decline of local herbivorous fish populations, and the rise of noncrustose algae (Mumby et al. 2006). This harmful algal bloom persists in shallow coastal Jamaican waters as local D. antillarum populations have had only a small recovery. However, local populations in small patches in Caribbe- an reefs have seen a rise nearing populations recorded in the late 1970s and early 1980s. From 1992–1996 there was a significant increase in D. antillarum with abundant local population sizes in shallow coastal water. Three similar studies from 2010–2012 recorded the average density of D. antillarum in shallow reef areas in Discovery Bay, Jamaica. The results of these studies show the gradual increase in D. antillarum populations over a recent 3-year span. Keller (2010) found an average of 2.77 urchins per square meter, Touse (2011) found an average of 3.23 urchins per square meter, and Feldman (2012) found an average of 4.78 ur- chins per square meter. Although the increase in D. antil- larum since the die-off events has been slow, if these trends continue, and populations of this herbivorous echinoid con- tinue to expand spatially, macroalgae cover will decrease, giving rise to a dominance of coral cover once again (Edmunds and Carpenter 2001). METHODS The methods used in the study were adapted from stud- ies done by Sellers (2009), Keller (2010), Touse (2011), and Feldman (2012). Diadema antillarum was sampled by SCUBA diving sessions using a transect and count method. Nineteen 30 m transect belts were placed between 2.0–14.0 m deep. Depth readings were recorded using dive gauges, and substrate type was also noted. Transects were placed both parallel and perpendicular to the western forereef region in three permanent mooring stations on the outskirts of the opening of Discovery Bay, including M1, Dancing Lady, and LTS (Long-term site). Eight transects were placed parallel to the forereef, facing southeast. The parallel transects were placed in shallow areas where D. antillarum appeared to be most abundant, these transects were sectioned off every 6 m and D. antil- larum within 2 m of the transect were identified, counted and recorded. Perpendicular transects were placed at vari- ous depths facing North to South and sectioned off every 3 m, urchins were counted within 1 m of the transect. Depths were determined for blocks along the transect using dive gauges. The data obtained in the study was then used to calculate the density of D. antillarum at each depth block. Density values were calculated by dividing the num- ber of urchins found by the standardized sample area and then these numbers were averaged to give the average den- sity at each depth block. The average densities with depth were then compared to the averages obtained from 2010– 2012 and graphed to show the growth or retraction of the local population size. Finally, an ANOVA test was run in order to demonstrate a significant difference between the numbers of urchins counted inside and outside of the deter- mined zone. RESULTS This study assessed the population density and distribu- tion with depth of D. antillarum in Discovery Bay, Jamai- ca; an area that has been extensively studied for over fifty years. Analysis of the data collected in this study showed that the average density across all transects was 4.15 ur- chins m-2 (STDEV=3.15), which is lower than the average densities observed in previous years. However, in this study, more transects were placed in deeper locations to demonstrate a strong correlation with depth. An average taken between all transects placed in closer proximity to the “Diadema zone” gave a density of 5.59 (STDEV= 2.65), compared to an average density of 4.78 observed by Feld- man in 2012 (Standard deviation unknown). The average densities per year observed from 2010-2014 have consist- ently increased with each consecutive year (Figure 1). Figure 1. The average D. antillarum density in the Diadema zone per year from 2010–2014 is shown in the graph above. There was an average of 2.77 urchins per square meter observed in 2010 with a standard deviation of 2.02, 3.23 urchins m-2 with a standard de- viation of 2.63 in 2011, 4.78 urchins m-2 (standard deviation un- known) in 2012, and an average of 5.59 urchins m-2 with a stand- ard deviation of 2.65 in 2014. BALDWIN: DIADEMA ZONATION The highest density recorded was 9.47 urchins m-2 at approximately 1.5 m, compared to a maximum of 7 urchins recorded per square meter in previous years. The lowest density recorded per square meter was 0 urchins at all depths observed below 7 m. Using the average densities calculated for each depth category, the “Diadema zone” 2
  • 13.
    spans from about1.5 m –5.3 m (Figure 2). Standard devia- tions in this survey tend to be relatively high because D. antillarum cluster together in small patches and densities are highly variable at any given location. Transects were also placed in areas with varying substrate types, thus in locations within the same depth range, different numbers of urchins were found based on the bottom composition. Den- sities inside and outside of this range of depths were signif- icantly different, with a p-value of 0.0. A linear regression was run to test the correlation between depth and density of D. antillarum. There was a strong negative correlation with density as depth increased based on the regression analysis (Figure 3). DISCUSSION Diadema antillarum populations throughout the Carib- bean have been slowly recovering after the die-off events that occurred in the early 1980s and 1990s. The data ob- tained in this study and similar studies in Discovery Bay demonstrate that local D. antillarum populations have been increasing over the past four years. Since 2010, the average density has increased from 2.77 m-2 (Keller 2010) to 5.59 m -2 in 2014. Diadema antillarum has few natural predators in Jamaican reefs, although local fishermen often use them as bait in fish pots. Without large storm events and the ab- sence of species-wide diseases, the D. antillarum popula- tion in Discovery Bay should continue to grow as space and food remain available. However, due to the fact that D. antillarum occupy such a narrow depth range and tend to be arranged in a clustered formation, intraspecific competi- tion might curb exponential growth rates. Diadema antillarum have made such a substantial recovery over the past few years that the “Diadema zone” has been grazed to the point of bare substrate exposure in most areas. It was also noted in this study that feeding scars from the rigid mouth of D. antillarum were apparent on some coral species such as Porites astreoides (Lamarck, 1816), as urchins have begun to graze on certain corals because preferred algae have become less abundant in shal- low waters. About 8.2% of the D. antillarum populations in the Netherlands Antilles have been observed feeding on coral surfaces (Bak and van Eys 1975). The zonation with depth observed in this study was determined to be from about 1.5 m–5.3 m, this range of depths is slightly shallow- er than the depth range observed by Feldman (2012) which found that the “Diadema zone” had previously been 2.5– 6.5m. In other studies, it has been concluded that D. antil- larum have been recovering and abundant in shallow wa- ters throughout the entire Caribbean (<6 m) (Carpenter 2006). Diadema antillarum continue to be most abundant in this depth range because of the types of algae that are prevalent in these areas as well as the types of substrates that tend to occupy mid to shallow depths. Further studies should be done in order to determine the algal feeding preferences of D. antillarum versus other urchin species and if that is significant in the depth zona- tion of D. antillarum. Substrate type and complexity are also factors that determine the areas in which D. antillarum can be found. Out of 3,372 urchins counted during this study, less than 5 were observed on bare sand (assumed to be in transit), while some were found on flat, bare rock substrates, and the remaining majority were found in cracks and crevices or on rubble substrate. In a similar study in- cluding rugosity measurements, it was found that there was a strong correlation between substrate complexity, and ur- chin density (Feldman 2012). Although it is apparent from observation alone, further studies should continue to in- clude substrate preferences to determine a statistically sig- nificant effect on density. Figure 2. The average density values for D. antillarum standard- ized to a m-2 against depth. This graph shows that D. antillarum is abundant in shallow depths and there are few to none below 6m. The dashed lines represent the “Diadema zone” which ranges from approximately 1.5–5.3 m. Figure 3. Figure 3 shows the results of a linear regression analy- sis with density (m-2 ) as the dependent variable and depth as the independent variable. This figure demonstrates the relationship between urchin density and depth. The regression line shows that there is a strong negative correlation between density and depth, with an R2 value of 0.76 and an equation of y = -0.90x + 8.73. KORALLION. VOL 5. 2014 3
  • 14.
    The “Diadema zone”quantified in this study helps to determine the present condition of D. antillarum popula- tions. The “Diadema zone” typically contains smaller amounts of algal coverage, and is suggestive of a reversal in community structure. This data shows that the zonation of D. antillarum has remained relatively the same in the forereef from 2012–2014, but has become shallower. The density of D. antillarum inside the “Diadema zone” is sig- nificantly different than densities outside of this depth zone. This demonstrates that the depths at which D. antil- larum can be found are narrow and strict. Many similar studies have shown that D. antillarum continue to occupy a narrow depth range, however, based upon this study, that depth range has changed from 2.5–6.5 m to 1.5–5.3 m. Fur- ther studies will show whether or not this shallow zonation will continue with time as the population continues to grow. There are many different factors that govern healthy coral reef ecosystems, many of which are human-related. Estimation of carrying capacities for reef fishes and urchins should be established in order to prevent overfishing of herbivorous grazers such as reef fishes and urchins. A re- cent reversal in the D. antillarum density and surrounding grazed areas show signs of Caribbean reef improvement as urchin populations continue to expand. The presence and abundance of D. antillarum is directly related to the percent coral cover (Sammarco 1980). This relationship is due to the limitation of competitive algae by D. antillarum. Herbi- vore regulation by grazing is the major factor controlling algal growth on reefs (Albert et al. 2008). Understanding and maintaining urchin and fish populations will ensure that corals will once again dominate Caribbean reefs. ACKNOWLEDGMENTS I would like to express my appreciation for the finan- cial support of my family, and for the guidance and assis- tance provided by E Burge. I also thank the staff of Discov- ery Bay Marine Lab for allowing the use of their facilities and equipment, and for providing constant aid. D Scarlett, C Trench, O Holder, and D Edwards assisted with all div- ing sessions, enabling the collection of data. Finally, I thank my dive buddy M Esch who facilitated the dive por- tion of this research. LITERATURE CITED Albert S, Udy J, Tibbetts IR. 2008. Responses of algal communi- ties to gradients in herbivore biomass and water quality in Marovo Lagoon, Solomon Islands. Coral Reefs. 27:73-82. Alves FM, Chicharo LM, Serrao E, Abreu AD. 2003. Grazing by Diadema antillarum (Philippe) upon communities on rocky substrates. Scientia Marina. 67(3): 307-311. Anthony KN, Fabricus KE. 2000. Shifting roles of heterotrophy and autotrophy in coral energetics under varying turbidity. J Exp Mar Bio Ecol. 252(2000): 221-253. Bak RP, van Eys G. 1975. Predation of the sea urchin Diadema antillarum Philippi on living coral. Oecologia. 20:111-115. Carpenter RC, Edmunds PJ. 2006. Local and regional scale recov- ery of Diadema promotes recruitment of scleractinian cor- als. Ecol Letters. 9: 271-280. Edmunds PJ, Carpenter RC. 2001. Recovery of Diadema antil- larum reduces macroalgal cover and increases abundance of juvenile corals on a Caribbean reef. Proc Natl Acad Sci USA. 89(9): 5067-5071. Feldman BA. 2012. The effects of depth rugosity on the distribu- tion and density of Diadema antillarum at Discovery Bay, Jamaica. Korallion. 3: 14-17. Fitt WK, Brown BE, Warner ME, Dunne RP. 2001. Coral bleach- ing: Interpretation of thermal tolerance limits and thermal thresholds in tropical corals. Coral Reefs. 20: 51-65. Keller J. 2010. Density and distribution of the long-spined sea urchin, Diadema antillarum, with respect to rugosity at Discovery Bay, Jamaica. Korallion. 1:31-36. Mumby PJ, Hedley JD, Zychaluk K, Harborne AR, Blackwell PG. 2006. Revisiting the catastrophic die-off of the urchin Diadema antillarum of Caribbean coral reefs: Fresh insights on resilience from a simulation model. Ecol Model. 196(1- 2): 131-148. Sammarco PW. 1980. Diadema and its relationship to coral spat mortality: Grazing, competition, and biological disturbance. J Exp Mar Biol Ecol. 45: 245-272. Sellers AJ, Casey LO, Burge EJ, Koepfler ET. 2009. Population Growth and distribution of Diadema antillarum at Discov- ery Bay, Jamaica. Open J Mar Bio. 3: 105-111. Small AM, Adey WH. 2001. Reef corals, zooxanthellae and free- living algae: A microcosm study that demonstrates synergy between calcification and primary production. Ecol Eng. 16: 443-457. Touse R. 2011. Density and distribution changes of Diadema antillarum relating to depth and rugosity at Discovery Bay, Jamaica. Korallion. 1: 14-19. BALDWIN: DIADEMA ZONATION4
  • 15.
    REEF COVERAGE ANDSPECIES RICHNESS WITH RESPECT TO WATER DEPTH AT DISCOVERY BAY, JAMAICA Melanie M. Esch Department of Marine Science, Coastal Carolina University, PO Box 261954, Conway, SC 29526 ABSTRACT Recently, the community structure of the fore reef at Discovery Bay, Jamaica has been macroalgal dominated. Factors important in controlling coral distribution in Jamaica include: hurricanes, coral bleaching, herbivorous fish, urchins, and light. With less events in recent years that would inhibit the growth and expansion of corals, the reef may be transitioning from its algal state. Living coral cover at 3 m–12 m depth has increased by 5% since 2006 and is now approximately 20%. At Dairy Bull (a study site east of Discovery Bay), the corals dominated the reef at an average of 43% coverage at 9 m–12 m depth. The species richness increases during the transition from shallow to mid-waters and then is consistent to a depth of 12 m. The coral coverage at the fore reef in Discovery Bay, Jamaica, is increasing, and may undergo a shift in domi- nance within the next decade as a result of increasing amounts of grazing fish from the input of a fish sanctuary, the return of Diadema antillarum, and the controlling of coral bleaching. KEYWORDS: Percent coverage, coral community, macroalgae, depth zonation This research was conducted as part of Coastal Carolina Universi- ty’s classes MSCI 477, Ecology of Coral Reefs, and MSCI 499, Directed Undergraduate Research in Discovery Bay, Jamaica, 14 –31 May 2014. Contact e-mail: mmesch@coastal.edu INTRODUCTION CORAL REEFS are one of the most highly productive ecosystems on the planet. Their biological diversity makes them crucial to the survival of tropical marine eco- systems (Hoegh-Guldberg 1999). Coral reefs throughout the Caribbean have several factors inhibiting the population growth of many species. Overfishing, coral bleaching, sea- level rise, predation, and hurricane damage are some short term and long term conditions that weaken the development of reefs which inhibit them to remain at a diversity equilib- rium suited for this environment. The reefs of Discovery Bay in northern Jamaica have shifted population dominance over the 20th century from coral dominant to macroalgae dominant due to natural and anthropogenic events (Idjadi et al. 2006). Hurricane Allen impacted the Discovery Bay area in 1980, affecting the coral reef communities in Jamaica. It had been over 60 years since the last large hurricane hit Discovery Bay. Prior to the destruction of the hurricane, the percent cover of corals in the fore reef was 54% at a depth of 30 m (Houston 1985). Immediately after impact, the coral coverage was reduced to only 10% (Moses 2008). Idjadi et al. (2006) found the percent coral cover in Dairy Bull to be 23%, and increased to 54% after another nine years in 2004. However, the coral coverage in the west forereef did not recover as well as Dairy Bull. The west forereef has had more time to recover and diversify its pop- ulations since the Idjadi et al. (2006) study was conducted, with fewer major resilience factors (events causing stress to the corals) inhibiting the growth and production of the eco- system. Coral bleaching is another inhibiting factor that has influenced the reefs at Discovery Bay. Bleaching occurs when a coral’s thermal tolerance is exceeded (Hoegh- Guldberg 1999). In 2005, the Caribbean experienced a mass bleaching event. During this time, the temperature of the shallow waters that the corals live in increased past the thermal tolerance of the corals. This thermal stress stops the process of photosynthesis within the organism causing it to lose its color by releasing zooxanthellae making the body of the coral turn white. All corals within Crabbe’s (2010) study showed a significant decrease in abundance follow- ing the bleaching event. Prior to this event, they had con- sistently been recovering since Hurricane Allen (Crabbe 2010). Potential sea temperature rise throughout the 21st century by 1–2°C could be extremely detrimental to coral reefs (Hoegh-Guldberg 1999). The decline of reef systems will also decrease tourism and fishing in tropical communi- ties which will be detrimental to the success of local com- munities that are dependent on funds from these sectors. Over the summer of 1983, nearly the entire population of Diadema antillarum died in a mass mortality event caused by disease. The black spiny sea urchin had popula- tions up to 71 urchins per m². A waterborne disease, dis- tributed throughout the Caribbean by ocean currents infect- ed and killed the urchins within 10 days (Moses 2008). With this die off of the urchins, the algal population in- creased rapidly. The urchins had been the primary herbi- vores of the reef ecosystem in Discovery Bay; keeping a population balance between the macroalgae and the corals. The macroalgae coverage at shallower depths of the reef KORALLION. VOL 5. 2014 5
  • 16.
    increased nearly 20%between 5–15 m (Liddell and Ohl- horst 1986). Overfishing has also become a major issue effecting the algae population on the reef. With the high fish demand in Jamaica, local fishermen have stressed the fish populations. With the decline in numbers of herbivorous fish and the near extinction of the D. antillarum in Discovery Bay, the algae community has taken over new niches on the reefs (Moses 2008). The diversity of coral correlates with the light gradient in the water. All corals need sunlight to survive and photo- synthesize, so the species richness decreases with depth. Alves de Guimaraens et al. (1994) found that in Discovery Bay the maximum diversity occurs at 6 m where the envi- ronmental conditions are most favorable. In the Idjadi et al. study in 2006, the fore reef of the bay had a coral coverage of 15% and 60% coverage of algae. However, at Dairy Bull the coral coverage is much higher at 43% with an algae cover of only 6%. Concluding this study, reef coverage and species rich- ness was determined to show change in diversity. The cov- erage of the two reefs, the fore reef and Dairy Bull, were compared to past studies conducted in the same locations to see if the reefs at Discovery Bay have continued to recover since 2006. METHODS This study was conducted at two different sites near the Discovery Bay Marine Lab; Dairy Bull and the west fore- reef. Data was collected from May 19–24 of 2014. Both sites had the same growth factors such as light, food, and water quality. Both were less than 1 km off the shoreline and had easy access to the DBML for frequent data collec- tion. The reef complexity is similar at both sites, however depths vary. The reef at Dairy Bull is essentially a constant same depth because it is on a flatter shelf. Only one transect of quadrats was collected starting at 7 m and continuing to 9 m. This data was included in the total coverage averages, but was also separated and compared to the west fore reef. The west fore reef was around 600 m long and provided many sub-sites for research (Figure 1). Dairy Bull which, was similar in length at 500 m, (Idjadi et al. 2006), but on the opposite side of the channel was also used to collect data. Transects were placed parallel and perpendicular to the shoreline between 3–12 m depth. A 1 m × 1 m quadrat started at zero meters on each transect and then skipped one meter before the next quadrat was placed. Pictures of each quadrat were taken, along with pictures of each species within the quadrat. Percent coverage of all four substrates (coral, macroalgae, sponge, bare) were recorded and at which depth the quadrat was placed. When considering dead or bleached corals, these were represented as bare coverage and not included in coral coverage. Data was col- lected from 11 transects totaling 83 quadrats. Quadrat depths were rounded to 3 m, 7 m, 9 m, and 12 m. This was done to eliminate error when recording depth and to com- pare more easily to other studies. Averages and standard deviations were calculated to determine complete reef cov- erage. Species richness refers to the number of species in a community. For this study, the species richness showed the number of species at each depth, as well as the change in richness from shallow to mid-depth water. RESULTS The percent coverage of coral and algae changed with depth (Figure 2). At 3 m corals dominated the reef with 25% coverage and algae covered only 6%. At 7 m the cov- erage was very similar for coral and algae; coral was at 27% coverage and algae was at 29% coverage. At a depth of 9 m, algae began to dominate the reef at 60% coverage and coral only covered 14% of the reef. At the deepest rec- orded depth of 12 m, algae still dominated the reef with a coverage percent of 65% and coral was only at 12%. The remaining coverage percentage at each depth was from the averages of the bare substrate and sponges, but were not important to this study. When totaling the coverage at all depths, the overall coverage of the forereef between 3 m and 12 m is algae dominated (Figure 3). Algae coverage was 41% and coral coverage was 20%. This data included the transect from Dairy Bull. The species richness of corals of Discovery Bay in- creases from 3 m to 7 m and then is consistent up to 12 m deep (Table 1). Some species of coral change with depth. Porites astreoides and Acropora palmata were abundant in shallow waters, whereas Meandrina meandrites, Scolymia spp. and Dichocoenia spp. were only found in the mid- waters (Table 1). At Dairy Bull, the average percent cover- age was 42% and the average algae coverage was 6% (Figure 4). This reef was a coral dominated reef. Figure 1. The two locations of the reef survey, the forereef and Dairy Bull. ESCH: CORAL COVERAGE AND DIVERSITY6
  • 17.
    fishing sanctuary withinthe bay in 2010. Research is cur- rently being conducted on the effectiveness of the sanctu- ary, but this may allow the population of herbivorous fish to increase inside of the bay and eventually migrate out to the forereef. Lastly, the amount of time since the last large bleaching event has allowed the shallow water corals to rebound and become more abundant. Overall the forereef coverage of coral has increased from 15% to 20% (Idjadi et al. 2006). This indicates that the reef is on the verge of transitioning from an algal state to a coral state, and within the next decade may become a coral dominated reef. The data of the reef at Dairy Bull showed that the percent coverage of coral was 43%, which was a decrease of 12% since 2006 (Idjadi et al. 2006). However, this may be because only one transect was taken at Dairy Bull. If time and transportation had allowed further data collection on this reef, than the results may be more similar to previous studies. Species richness increased to 3 m but was then continu- ous until 12 m. The peak diversity was found at 7 m. Alves de Guimaraens et al. (1994) found similar results with a maximum diversity at 6 m. This supports the hypothesis of the coverage transitional zone as competition between cor- als and macroalgae at this depth is optimal. Looking at the corals that are found only in shallow waters such as D. stri- gosa and A. palmata these must require a higher intensity of light than corals found in the mid-water such as M. me- andrites and E. fastigiata. Further studies could compare deeper waters to determine the effects of sunlight on coral diversity. Overall, this study supported Idjadi et al. (2006) in showing that the forereef at Discovery Bay is still under an algal dominance. In future years this may change to a coral dominated reef depending on the inhibiting factors dis- cussed throughout this study. The species richness hypothe- sis was supported with the data collected and was also con- sistent with the other studies discussed in this paper. Figure 2. Reef coverage averages at each depth gradient of the forereef. Error bars show the standard deviation of each coverage category. Figure 3. Percent coverage of the forereef between 3 m and 12 m. Error bars show standard deviation. Figure 4. Reef coverage at Dairy Bull. Error bars show standard deviation. DISCUSSION In the 3 m water region of this study, coral dominated the reef with almost 5 times greater the coverage than al- gae. At 7 m depth the coverage of both algae and coral was just below 30%. This is the transition depth for reef domi- nation. Beyond 7 m the reef is algae dominated with >60% coverage until 12 m depth. A few factors can be taken into account for the coral domination in the shallow waters on the reef. In 2006, Bechtel et al. found that the D. antillarum population occu- pied a percent area of 32% from a nearly 0% coverage after the mortality event in 1983. The return of the urchin popu- lation has controlled the abundance of macroalgae on the rocky substrates in the shallow waters of the reef (Alves et al. 2003). Another influence was the introduction of the KORALLION. VOL 5. 2014 7
  • 18.
    ACKNOWLEDGEMENTS I thank allof the staff at the Discovery Bay Marine Lab who all helped me with my study in a variety of ways. A special thank you to the boat crew D Scarlett, O Holder, D Edwards for assisting with diving. The entire Coastal Caro- lina University group for supporting and encouraging pro- gress with my study. My mom for using her credit card. Lastly, my dive buddy A Baldwin for helping collect my data and holding my unruly quadrat when needed. Depths 3 m 7 m 9 m 12 m Siderastrea radians +++ ++ +++ +++ Siderastrea siderea +++ ++ + Porites astreoides +++ +++ +++ Porites porites +++ + ++ +++ Montastraea annularis +++ +++ +++ Montastraea cavernosa + + +++ Agaricia agaricites +++ +++ +++ +++ Agaricia fragilis + Millepora complanata +++ ++ + + Millepora alcicornis + + Eusmilia fastigiata + + ++ Meandrina meandrites + + +++ Scolymia spp. + Dichocoenia spp. + Diploria labyrinthiformis + ++ ++ Diploria strigosa +++ ++ + Colpophyllia natans ++ Isophyllastrea rigida + + Madracis decactis +++ +++ +++ +++ Madracis auretenra ++ + ++ Acropora palmata + Total: 11 16 15 15 Table 1. Species richness at depth gradients and all species abun- dance found at each depth. Abundant (+++): >20%, common (++): 2–19%, and rare (+): <2%. LITERATURE CITED Alves de Guimaraens M, Corbett C, Combells C. 1994. Species diversity and richness of reef building corals and macroal- gae of reef communities in Discovery Bay, Jamaica. Acta Biologica Leopoldensia. 16(1): 41-50. Alves F, Chicharo L, Serrao E, Abreu A. 2003. Grazing by Di- adema antillarum (Philippi) upon algal communities on rocky substrates. Sci Mar. 67(3): 307-311. Andres N, Witman J. 1995. Trends in community structure on a Jamaican reef. Mar Ecol Prog Ser. 118: 305-310. Bechtel J, Gayle P, Kaufman L. 2006. The return of Diadema antillarum to Discovery Bay: Patterns of distribution and abundance. Proceedings of 10th International Coral Reef Symposium. 367-375. Crabbe M. 2010. Coral ecosystem resilience, conservation and management on the reefs of Jamaica in the face of anthropo- genic activities and climate change. Diversity. 2: 881-896. Hoegh-Guldberg O. 1999. Climate change, coral bleaching and the future of the world’s coral reefs. Mar Freshwater Res. 50: 839-866. Huston M. 1985. Patterns of species diversity in relation to depth at Discovery Bay, Jamaica. Bull Mar Sci. 37(3): 928-935. Idjadi J, Lee S, Bruno J, Precht W, Allen-Requa L, Edmunds P. 2006. Rapid phase-shift reversal on a Jamaican coral reef. Coral Reefs. 25(2): 209-211. Liddell W, Ohlhorst S. 1986. Changes in benthic community composition following the mass mortality of Diadema at Jamaica. J Exp Mar Biol Ecol. 95: 271-278. Moses C. 2008. Field Guide for Geology and Biology of Jamaican Coral Reefs. SCUBAnauts International. 1-23. ESCH: CORAL COVERAGE AND DIVERSITY8
  • 19.
    Samantha M. Cook Departmentof Marine Science, Coastal Carolina University, PO Box 261954, Conway, SC 29526 ABSTRACT Discovery Bay, Jamaica presents a localized model of severe over-fishing to a coral reef ecosystem. In 2010, Discov- ery Bay implemented a fish sanctuary with the hopes of rebuilding the fish stock within the bay. This study aimed to assess differences between the fish communities within the sanctuary and the unprotected forereef using the Roving Diver Tech- nique. 19 surveys lasting 20 minutes each were completed over the course of nine days. seven were performed within the protected sanctuary and 12 were performed in the unprotected forereef. From this, percent sighting frequency, density score, and abundance score were calculated and compared using a one-way ANOVA. It was found that there was no signifi- cant difference between the surveys taken within and outside the bay. The size and number of four fish species important to the fishery were also observed to see whether fish inside the sanctuary are reaching maturity. While the size data could not be used, it was found that there was no significant difference between number of Sparisoma viride, Scarus taeniopterus, or Cephalopholis cruentatas within two zones. There was a significant difference between the number of Haemulon sciu- rus. This is thought to be due to their nocturnal migration. An ordination plot shows independent clustering of the two com- munity structures. While it cannot be said with certainty that recovery to the fish stock is occurring, a difference in the com- munity structure between the two areas was observed. KEYWORDS: diversity, abundance, over-fishing, roving diver technique, Haemulon sciurus This research was conducted as part of Coastal Carolina Universi- ty’s classes MSCI 477, Ecology of Coral Reefs, and MSCI 499, Directed Undergraduate Research in Discovery Bay, Jamaica, 14 –31 May 2014. Contact e-mail: smcook@coastal.edu INTRODUCTION CORAL REEFS offer one of the most biologically di- verse ecosystems on the planet, with an estimated biodiversity of 1–9 million species (Knowlton 2001). Dis- covery Bay, Jamaica is dominated by some of the most studied reefs anywhere in the Caribbean. The north shore has a macroalgae- dominated fringing reef that runs 1.2 km along Discovery Bay (Gayle and Woodley 1998). The bay itself has a deep water channel in the center with shallow sandy lagoons surrounding it, along with scattered coral heads and patch reefs (Gayle and Woodley 1998). Over the years these reefs have been marked with a series of large-scale disturbances including Hurricane Allen in 1980, Hurricane Gilbert in 1988, and a continuous decima- tion of herbivorous fish populations due to overfishing (Andres and Witman 1995). Over-exploitation of fisheries is not limited to just Jamaican waters but it is also seen as a worldwide problem. Pauly et al. (1998) states that this global crisis is due to economics and governance with a natural fluctuation that is driven by demand. This fluctua- tion, along with a lack of regulation and management, can result in severe over-fishing of coral reefs. While this occurs worldwide, Jamaica is a clear local- ized model. The Jamaican near-shore fishery is mainly artisanal, consisting of open canoes and swimmers who use traps, hook-and-line, spears, and gill-nets (Andres and Wit- man 1995). The intense local fishing has caused the Jamai- can north coast coral reef to be among one of the most overfished reefs in the English-Speaking Caribbean (Andres and Witman 1995). Instead of quality fish such as grouper and snapper, smaller, younger fish of other species are being captured, and as a result, the breeding stock is being seriously damaged (Woodley and Sary 2000). Haw- kins and Roberts (2004) measured that the fishing intensity around Discovery Bay (fishers/km reef) is 7.14, more than double the next greatest (St. Lucia at 3.23). The Jamaican fisheries are economically driven, however, they produce a very low economic return. In 1988, the Discovery Bay Ma- rine Lab implemented the Fisheries Improvement Program, which aimed to work with and educate local fishermen with the goal of hopefully implementing fishery management measures. In 1994, the Alloa Discovery Bay Fishermen’s Association agreed to section off an area of shallow water on the west side of the bay which became known as the Discovery Bay Fisheries Reserve. The success of the Re- serve, shown by rebounding fish numbers, drove a petition for its expansion and the desire to eventually change it into a Fish Sanctuary. Unfortunately, after 1998 a lack of funds made it impossible for a patrol to enforce the protection of the bay and the indicators of overfishing once again began to occur (Woodley and Sary 2000). In 2010, the Ministry of Agriculture and Fisheries stepped in along with seven state and non-governmental OBSERVING THE EFFECTIVENESS OF THE DISCOVERY BAY FISH SANCTUARY USING REEF SURVEY TECHNIQUES KORALLION. VOL 5. 2014 9
  • 20.
    bodies, including theAlloa Discovery Bay Fishermen’s Association, to create a community-based movement that would create nine fish sanctuaries on the island (Jamaican Information Service 2010). These sanctuaries, including Discovery Bay, were deigned as no fishing zones for the protection of juvenile fish in hopes of rebuilding the fish population to sustainable levels. They are considered Spe- cial Fishery Conservation Areas (SFCA) under Section 18 of the Fishing Industry Act of 1975 and, as such, unauthor- ized fishing activities within them are punishable by law. The Discovery Bay Fish Sanctuary consists of every- thing south of Old Man Head on the west forereef to Fort Port on the east forereef. The fringing reef located outside of the bay does not fall under protection and artisanal fish- erman launch daily from the southeastern corner of the bay as well as from the fishermans’ beach near the Discovery Bay Marine Lab to fish the surrounding area outside of the bay. The Discovery Bay Fish Sanctuary and its surrounding reef presents the opportunity to study two similar over- fished environments in which one has been changed in an attempt to remedy the problem. The focus of this study was to observe fish popula- tions in two areas of Discovery Bay using the Roving Div- er Technique. To determine the effects of overfishing, as well as add on to an existing database, the fish survey was conducted using the Reef Environmental Education Foun- dation’s guidelines on a number of dive sites both in the Fish Sanctuary and on the fringing reef surrounding the boundaries of the bay. It was suspected that a more diverse population with larger and older fish will be within the Fish Sanctuary and that the surrounding fringing reef would contain a less diverse population consisting of younger fish. Discovery Bay has played a key role in the regulation of fisheries that make up Jamaica’s waters. The 2010 ac- tion to make the inner bay a fish sanctuary while keeping the surrounding area open to local fishermen presents the unique opportunity to measure on how effectively the plan has been to rebuild the fish population. METHODS Nineteen REEF surveys were conducted over nine days during May 2014 at the Discovery Bay Marine Lab, Jamaica. Locations of dive sites were split between pro- tected and unprotected areas within and surrounding the bay. The fish survey was conducted using the Rover Div- ing Technique (RDT). The Reef Environmental Education- al Foundation favors this technique because it is unobtru- sive and does not require many tools to get an accurate reading on the fish population (Pattengill-Semmens and Semmens 2003). It is especially useful for coral reefs where fish are easily recognizable by distinctive markings (Schmitt and Sullivan 1996). At each dive site, observa- tions were made freely and each fish species seen was rec- orded using a REEF identification slate. Because of time constraints, surveys only occurred during the day. Each fish was recorded based on four log10 abundance categories. These include: single (1), few (2–10), many (11–100), and abundant (>100) (Pattengill-Semmens and Semmens 2003). At the end of the campaign, the survey data was submitted to REEF via an online form. At the completion of each dive, the dive site name, survey start time, visibility, aver- age depth, water temperature, and habitat type was all rec- orded for later analysis. Table 1 shows the name of the dive site, the number surveys performed at the site, the average depth, the total time, and the total species seen (Schmitt and Sullivan 1996). Sizes and specific counts of observed princess parrot- fish (Scarus taeniopterus), Graysby grouper (Cephalopholis cruentatus), French grunts (Haemulon sciurus), and stoplight parrotfish (Sparisoma viride) were also recorded. They were measured in approximations of 5 centimeters to respect the unobtrusive nature of a REEF fish survey. The data collected in the surveys was observed in three sections, (1) total data gathered, (2) information gath- ered outside of the bay, and (3) information gathered within the fish sanctuary. Analysis was based off of REEF analy- sis techniques as well as a more in depth statistical analysis. Percent sighting frequency, density score, and abundance score were calculated to observe the effectiveness of the sanctuary. Percent sighting frequency (%SF) is the percent- age of all dives in which the species or family was record- Surveys (no.) Total time (min) Avg. depth (m) Total species Unprotected Rio Bueno 1 20 27 M1 2 40 6.1 32 Shallow LTS 2 40 6.1 36 Dancing Lady 3 60 6.1 40 LTS 3 60 6.1 41 Dairy Bull 1 20 9.1 30 Protected Dorm Shore 2 40 12.1 32 Red Buoy 2 40 12.1 31 East Back Reef 1 20 6.1 33 Back Reef 1 20 3 20 Little Blue Hole 1 20 9.1 23 Table 1. Number of surveys performed at each site including total observation time, average depth, and the total species counted. The average depth at Rio Bueno was not collected. COOK: FISH SANCTUARY EFFECTIVENESS10
  • 21.
    DISCUSSION The hypothesis statedat the beginning of the survey predicted a more diverse population (with larger and older fish) within the Fish Sanctuary than that of the surrounding fringing reef, which was believed to contain a less diverse population consisting of younger fish. Unfortunately, the limited amount of size data collected within the time con- straints made it unreliable to be used as a proxy for age. It is to be noted though, that larger fish, especially princess parrotfish and stoplight parrotfish, were seen within the bay consistently at both Red Buoy and Dorm Shore. These ob- servations imply that juvenile fish are able to reach maturi- KORALLION. VOL 5. 2014 ed. It was calculated using the formula: %SF= Dives species or family was recorded/Total number of dives Density score (Den) is the weighted average index calculated for each family based on the frequency of obser- vation in different abundance categories. It was calculated as: Den=((S)+(2F)+(3M)+(4A))/S+F+M+A in which S, F, M, and A all represent frequency categories (single, few, many, and abundant, respectively) and n is equal to the total number of dives. This number is between 1 and 4 and indicates the abundance value of each species. Abundance score (%SF x Den) was used to account for density, frequency of occurrence, and zero observations (Schmitt and Sullivan 1996). A statistical review examin- ing %SF, density score, and abundance in protected and unprotected areas was preformed using a one-way ANOVA (Schmitt and Sullivan 1996 ). %SF was also observed for the overall population. Species were divided into three cat- egories: frequent (≥ 70%), common (7%<x<20%), and un- common visitors (>20%). Efficiency was examined (by clustering) using an or- dination plot to observe community structure, species rich- ness, and Simpson and Shannon diversity indexes. A stress value, between 0 and 1, was calculated an indication of the amount of scatter between points in the ordination plot. Stress values below 0.2 are considered to give a relatively accurate picture of the arrangement of data. The population in relation to number of specific fisheries in the two areas was assessed using the one-way ANOVA test. RESULTS Over the course of nine days, 11 sites were examined for a total of 380 minutes. Of the 11 sites, five were within the protected zone of the bay while six were on the unpro- tected fore reef. At the end of the survey, the unprotected zone had been surveyed for 240 minutes and the protected zone for 140 minutes. The data from both sites was used to discern the overall % sighting frequency. Within the 11 sites, 79 species were observed. Of these, 11 species were considered to be frequent, 32 species were considered to be common, and 24 species were considered uncommon visi- tors (Table 2). A one-way ANOVA showed that there was no significant difference between the protected and unpro- tected zones in regards to % sighting frequency (p = 0.23), density score (p = 0.30), or abundance score (p = 0.36). While sizes of princess parrotfish, stoplight parrotfish, Graysby grouper, and French grunt were observed, it was determined that not enough information had been gathered to make any reliable observations. Instead, the number of each species inside and outside of the bay was compared by way of a one-way ANOVA. It was seen that there was no significant difference for the princess parrotfish (p = 0.47), the stoplight parrotfish (p = 0.47), or the Graysby grouper (p = 0.29). The abundance of French grunt was statistically different with a p-value of 0.04. An ordination plot was used to compare the similarity of the community structure between the protected and un- protected areas. It can be seen in Figure 1 that there is clear separation between the two, with clustering occurring for the protected and unprotected zones independent of one another. The ordination value had a stress value of 0.14 and from this the Simpson Diversity Index was also calculated. The unprotected zone had an average of 0.77 while the pro- tected zone had an average of 0.85. A one-way ANOVA showed that there was a statistical significance between the two (p = 0.01). The breakdown of diversity for each site can be seen in Table 3. The Shannon Diversity Index was also calculated. The protected zone had an average of 2.4 while the unprotected zone had an average of 2.3. A one- way ANOVA showed that there was no significant differ- ence between the two (p = 0.34) (Table 3). Species richness was calculated as well. The protected zone had an average of 23.87 while the unprotected zone had an average of 26.67 (Table 3). A one-way ANOVA showed that there was no significant difference between the two. 11 Figure 1. Ordination plot showing independent clustering of the community structures inside and outside of the sanctuary. A stress level of 0.14 was found. Diamonds represent inside the bay, while squares represent outside the bay.
  • 22.
    COOK: FISH SANCTUARYEFFECTIVENESS12Table2.Allspeciesobservedoverthedurationofthesurvey.Frequentrepresentsa%SightingFrequencyof≥70%,common7%<x<20%,anduncommonvisitors>20%.Com- monnames,scientificnames,andauthoritiesareincluded. FrequentCommonUncommon CommonNameScientificnameAuthorityCommonNameScientificNameAuthorityCommonNameScientificNameAuthority BluechromisChromiscyanea(Poey,1860)FairybassletGrammaloretoPoey,1868FrenchangelfishPomacanthusparu(Bloch,1787) BicolordamselfishStegastespartitus(Poey,1868)SaddleblennyMalacoctenustriangulatusSpringer,1959RockbeautyHolacanthustricolor(Bloch,1795) StoplightparrotfishSparisomaviride(Bonnaterre,1788)FoureyebutterflyfishChaetodoncapistratusLinnaeus,1758GreatbarracudaSphyraenabarracuda(EdwardsinCatesby, 1771) StripedparrotfishScarusiserti(Bloch,1789)BrownchromisChromismultilineata(Guichenot,1853)BandedbutterflyfishChaetodonstriatusLinnaeus,1758 PrincessparrotfishScarustaeniopterusDesmarestinBoryde Saint-Vincent,1831 BeaugregoryStegastesleucostictus(Müller&Troschelin Schomburgk,1848) LongsnoutbutterflyfishPrognathodesaculeatus(Poey,1860) SharpnosepufferCanthigasterrostrata(Bloch,1786)DuskydamselfishStegastesadustus(TroschelinMüller, 1865) CocoadamselfishStegastesvariabilis(Castelnau,1855) SharknosegobyElacatinusevelynae(Böhlke&Robins,1968)LongfindamselfishStegastesdiencaeus(Jordan&Rutter,1897)SergantmajorAbudefdufsaxatilis(Linnaeus,1758) HarlequinbassSerranustigrinus(Bloch,1790)ThreespotdamselfishStegastesplanifrons(CuvierinCuvier& Valenciennes,1830) SpotteddrumEquetuspunctatus(Bloch&Schneider, 1801) BlueheadwrasseThalassomabifasciatum(Bloch,1791)YellowtaildamselfishMicrospathodonchrysurus(CuvierinCuvier& Valenciennes,1830) SpottedmorayGymnothoraxmoringa(Cuvier,1829) YellowheadwrasseHalichoeresgarnoti(ValenciennesinCuvier &Valenciennes,1839) SpottedgoatfishPseudupeneusmaculatus(Bloch,1793)YellowgoatfishMulloidichthysmartinicus(CuvierinCuvier& Valenciennes,1829) NeongobyElacatinusoceanopsJordan,1904CaesargruntHaemuloncarbonariumPoey,1860 GraysbyCephalopholiscruentata(Lacepède,1802)ConeyCephalopholisfulva(Linnaeus,1758) FrenchgruntHaemulonflavolineatum(Desmarest,1823)BlackmargateAnisotremussurinamensis(Bloch,1791) BarredhamletHypoplectruspuella(CuvierinCuvier& Valenciennes,1828) TomtateHaemulonaurolineatumCuvierinCuvier& Valenciennes,1830 IndigohamletHypoplectrusindigo(Poey,1851)RainbowparrotfishScarusguacamaiaCuvier,1829 BarjackCaranxruber(Bloch,1793)YellowtailparrotfishScarushypselopterusBleeker,1853 QueenparrotfishScarusvetulaBloch&Schneider,1801BalloonfishDiodonholocanthusLinnaeus,1758 RedbandparrotfishSparisomaaurofrenatum(ValenciennesinCuvier &Valenciennes,1840) PorcupinefishDiodonhystrixLinnaeus,1758 RedtailparrotfishSparisomachrysopterum(Bloch&Schneider, 1801) SouthernstingrayDasyatisamericanaHildebrand& Schroeder,1928 TobaccofishSerranustabacarius(CuvierinCuvier& Valenciennes,1829) LongjawsquirrelfishNeoniphonmarianus(CuvierinCuvier& Valenciennes,1829) YellowtailsnapperOcyuruschrysurus(Bloch,1791)ClownwrasseHalichoeresmaculipinna(Müller&Troschelin Schomburgk,1848) BlackbarsoldierfishMyripristisjacobusCuvierinCuvier& Valenciennes,1829 GlasseyesnapperHeteropriacanthus cruentatus (Lacepède,1801) LongspinesquirrelfishHolocentrusrufus(Walbaum,1792)MackerelscadDecapterusmacarellus(CuvierinCuvier& Valenciennes,1833) SquirrelfishHolocentrusadscensionis(Osbeck,1765) BluetangAcanthuruscoeruleusBloch&Schneider,1801 DoctorfishAcanthuruschirurgus(Bloch,1787) OceansurgeonAcanthurusbahianusCastelnau,1855 BlackdurgonMelichthysniger(Bloch,1786) CreolewrasseClepticusparrae(Bloch&Schneider, 1801) SlipperydickHalichoeresbivittatus(Bloch,1791) TrumpetfishAulostomusmaculatusValenciennes,1837 RedlionfishPteroisvolitans(Linnaeus,1758)
  • 23.
    cate a reboundingfish stock. It was seen that there was no statistical difference between the princess parrotfish, stop- light parrotfish, or Graysby grouper but there was statistical significance seen between the French grunt population within the protected and unprotected zones. While fishes belonging to the family Haemulidae are severely overfished in Jamaica, it’s believed that more French grunts were seen within the bay primarily due to the time when the surveys occurred. Grunts are nocturnal predators who leave the bay to forage on the forereef and surrounding sandflats at night (Burke 1995). Because all surveys occurred during the day, few grunts were seen on the fore reef and larger schools were seen within the bay. The correlation between the pro- tected zone and the number of French grunts cannot be determined with certainty because of this nocturnal migra- tory pattern. A similar, long-term monitoring project is occurring in Oracabessa Bay, a designated fish sanctuary also located on Jamaica’s northern coast. In October 2011, a baseline survey was completed within the sanctuary. They also found a high biomass of parrotfish (159 g/100 m2 ) and sur- geonfish (39.85 g/100 m2 ) with lower biomasses within the grunts and groupers (1.93 g/100 m2 and 14.99 g/100 m2 respectively) (Anonymous 2011). An examination of size showed that parrotfish, grunts, and groupers fell into the juvenile to sub-adult class ranges, most likely due to over- fishing. In 2012, a follow up showed that within the sanctu- ary there was a 287.2% change in the fish biomass and a 15.95% change in the overall size of the fishes (Anonymous 2012). This implies that with a larger data pool, the sanctuary at Discovery Bay may also show similar results indicative of recovery. An ordination plot was used to look at the similarity of the community structures between the protected and unprotected areas in Discovery Bay. As seen in Figure 1, there is a clear separation between the two. The low stress value of 0.14 indicates that the fish communities sustained within each are significantly different. The Simpson Diver- sity Index was also calculated, and a one-way ANOVA showed that the biodiversity between the protected and unprotected areas was different. However, the species rich- ness and Shannon Diversity Index did not show a signifi- cant difference. A further insight to the makeup of the fish communities within the two areas would need to be deter- mined before a conclusion was made about the similarity of diversity between the two locations. ACKNOWLEDGMENTS This study could not have been completed without the continuous help of the Discovery Bay Marine Lab. Special thanks to the dive team who got us where we needed to be and kept an ever-optimistic attitude. Thank you also to Dr. E Burge whom was forever patient with my never-ending stream of questions. Thanks to B Hinze who was the most amazing dive buddy a person could ask for and to all the Table 3. Species richness, Shannon Diversity Index, and Simpson Diversity Index for each survey performed within the protected and unprotected zones. There was statistical significance seen between the Simpson Diversity Index within and outside the bay but not for the Species Richness or the Shannon Diversity Index. ty within the sanctuary. This is promising as Hughes (1994) discussed that over the last 30 to 40 years that herbivores such as scarids (parrotfish) and acanthurids (surgeonfish) have increased in number over predatory species, but de- creased in size. This is seen especially along north shore, where half the species are caught below the minimum re- productive size (Hughes 1994). Further surveys consisting of longer than the 20-minute maximum time should be tak- en to get a more accurate idea of the general size of the fishes within the bay. In place of age proxy by size, the overall count of individual fish belonging to certain fisheries was analyzed in hopes of seeing a larger number within the bay to indi- KORALLION. VOL 5. 2014 13 Species Richness Shannon Index Simpson Index Unprotected 5/17 Rio Bueno 27 2.2 0.92 5/17 M1 25 2.1 0.92 5/18 M1 34 2.1 0.75 5/18 Shallow LTS 33 2.4 0.82 5/20 Dancing Lady 32 2.4 0.93 5/20 Shallow LTS 25 2.3 0.94 5/21 LTS 20 2 0.93 5/21 Dancing Lady 28 2.3 0.79 5/23 Dancing Lady 28 2.3 0.78 5/23 LTS 34 2.3 0.74 5/24 Dairy Bull 30 2.1 0.78 5/25 LTS 28 2.9 0.94 Average 28.7 2.3 0.85 Protected 5/25 Dorm Shore 19 2.6 0.79 5/23 Dorm Shore 23 1.2 0.74 5/24 Red Bouy 25 2.1 0.78 5/25 East Back Reef 33 2.2 0.83 Back Reef 23 2.8 0.79 5/27 Little Blue Hole 22 2.8 0.8 5/27 Red Bouy 22 2.8 0.8 Average 23.9 2.4 0.79
  • 24.
    participants of the2014 Jamaica Maymester who made this experience unforgettable. Finally, thank you to my parents for supporting me through this entire endeavor. LITERATURE CITED Anonymous. 2011. Oracabessa Fish Sanctuary Baseline Survey Assessment. 2011, October. National Environ- mental and Planning Agency. Available from http:// www.oracabessafishsanctuary.org/ oracabessa_bay_sanctuary_legal_documents_files/ NEPA%20Baseline%20info.pdf Anonymous. 2012. Oracabessa Bay Fish Sanctuary: Year 2- Sum- mary Report. National Environmental and Planning Agency. Available from http://www.oracabessafishsanctuary.org/ oracabessa_bay_sanctuary_legal_documents_files/ OBFS%202011%20Monitoring%20Data.pdf Andres NG, Witman JD. 1995. Trends in community structure on a Jamaican reef. Mar Ecol Prog Ser. 118:305-310. Burke NC. 1995. Nocturnal foraging habitats of French and bluestriped grunts, Haemulon flavolineatum and H. sciurus, at Tobacco Caye, Belize. Environ Biol Fish. 42(4): 365-374. Hawkins JP, Roberts CM. 2004. Effects of artisanal fishing on Caribbean coral reefs. Conserv Biol. 18(1): 215-226 Hughes TP. 1994. Catastrophes, phase shifts, and large-scale deg- radation of a Caribbean coral reef. Science. 265(5178): 1547 -1551. Knowlton N. 2001. The future of coral reefs. Proc Natl Acad Sci USA. 98(10): 5419-5425 Jamaican Information Service. 2010. No-fishing zones established under marine-protection MOU. The Gleaner. Retrieved from http://jamaica-gleaner.com/gleaner/20101212/business/ business4.html Pattengill-Semmens CV, Semmens BX 2003. Conservation and management applications of the REEF volunteer fish moni- toring program. Environ Monit Assess 82: 43-50. Pauly D, Christensen V, Dalsgaard J, Froese R, Torres F. 1998. Fishing down marine food webs. Science. 279 (5352): 860- 863. REEF. (2014) Geographic Zone Report. Retrieved from http:// www.reef.org/db/reports/geo/twa/53030028 Schmitt EF, Sullivan KM (1996). Analysis of a volunteer method for collecting fish presence and abundance data in the Flori- da Keys. Bull Mar Sci. 59(2): 404-416. Special fishery conservation areas (SFCA). 2014. Web. 4 Mar 2014. Available from: http://www.moa.gov.jm/Fisheries/ fish_sanctuary.php COOK: FISH SANCTUARY EFFECTIVENESS14
  • 25.
    KORALLION. VOL 5.2014 DENSITY, RESIDENCE TIME, AND INDIVIDUAL ASSOCIATION OF FLAMINGO TONGUE SNAILS (CYPHOMA GIBBOSUM) ON GORGONIAN HOSTS Catharine C. Gordon Department of Marine Science, Coastal Carolina University, PO Box 261954, Conway, SC 29526 ABSTRACT The relationship between Cyphoma gibbosum and their gorgonian hosts is a parasitic relationship. Cyphoma gibbosum use the gorgonians as a food source, mating grounds, and substrate for egg deposition. This study increases knowledge of the density of both C. gibbosum and their gorgonians hosts in Discovery Bay, Jamaica. The movement of the snails in terms of residence time and association between snail pairs was examined. Samples were taken on the west forereef by SCUBA diving. Thirteen, 8 m diameter sites were sampled and snails were marked with a microfile to track their movement. Over the 653.45 m2 sampled, a total of 138 gorgonians and 13 C. gibbosum were observed. On average, there were 21.1 gorgoni- ans per 100 m2 (±13.0). The gorgonian species Gorgonia flabellum was most abundant over the sample area (15.6 individu- als per 100 m2 ± 8.3). On average, there were 2.9 C. gibbosum individuals per 100 m2 (±1.0). A majority of the C. gibbo- sum were found on G. flabellum. The residence time of the snails on a gorgonian individual ranged from 2 to 4 days. While snails were found individually a majority of the time, there was an overall significant association between snail pairs ob- served meaning they tended to move together. KEYWORDS: Flamingo tongue, gorgonians, parasitism, micropredation, Discovery Bay This research was conducted as part of Coastal Carolina Universi- ty’s classes MSCI 477, Ecology of Coral Reefs, and MSCI 499, Directed Undergraduate Research in Discovery Bay, Jamaica, 14 –31 May 2014. Contact e-mail: ccgordon@coastal.edu INTRODUCTION GORGONIAN CORALS are commonly found in tropical shallow waters (4–10 m) in groups with multiple spe- cies (Gerhart 1990). The primary factors which determine the distribution of gorgonians are water movement, light, and availability of firm substrate for settling (Kinzie 1973). In water depths 3–9 m Gorgonia flabellum (Linnaeus, 1758), Plexaurella homomalla (Esper, 1792), and Plexaura flexuosa (Lamouroux, 1821) are very abundant (Kinzie 1973). Gorgonian morphology serves to maximize surface area (Leversee 1976); G. flabellum are a large, flat and foli- ose species and P. flexuosa have branching patterns allow- ing them to increase their surface area. All species of gor- gonians are loosely flexible, an adaptation which allows them to move back and forth in the water column. Gorgoni- ans generally orient themselves perpendicular to the domi- nant hydrodynamic factors; this allows them to sway back and forth in the water column and filter feed (Leversee 1976). One of the most common gorgonian predators is the ovulid gastropod, Cyphoma gibbosum (Linnaeus, 1758), also known as the flamingo tongue snail (Chiappone et al. 2003). Cyphoma gibbosum are relatively small (2.5 cm long) and most commonly found in the sub-tidal zone (Gerhart 1986, Nowlis 1993). Flamingo tongue snails have a pale yellow shell and a brown spotted mantle. When un- disturbed, these snails extend their mantle up and around their shell covering it completely. These gastropods feed on the axial tissue and polyps of the gorgonians causing partial colonial mortality (Chiappone et al. 2003). Gorgonians also provide protection and serve as grounds for mating and egg deposition for C. gibbosum (Lasker et al. 1988). Cyphoma gibbosum gorgonian grazing habits have notable control over the abundance of the coral population (Lasker and Coffroth 1988). Snail populations typically remain relatively constant with a small increase in the sum- mer months. Because the C. gibbosum population is gener- ally unchanging, grazing activity is also relatively constant (Lasker and Coffroth, 1988). The grazing on the gorgoni- ans exposes their axial skeletons leaving behind a feeding scar discolored from the surrounding tissue (Gerhart 1990). The exposed skeleton allows greater diversity on the reef as it serves as colonization sites for larval organisms and algae (Gerhart 1990). While the increased diversity is positive, when the exposed skeleton is colonized it is sometimes difficult for the tissue to be regenerated and could eventual- ly cause full death of the gorgonian (Harvell and Suchanek 1987). This study took place in Discovery Bay, Jamaica from May 15 through May 27, 2014. Hogfish, Lachnolaimus maximus (Walbaum, 1792) are natural predators of C. gib- bosum and have experienced a large population decline because of the overfishing throughout the reef, which has 15
  • 26.
    allowed the snailpopulation to increase (Gayle and Wood- ley 1998, Chiappone et al. 2003). Higher densities of C. gibbosum can lead to increased feeding on the gorgonian hosts in turn affecting gorgonian density and growth. In previous research, there were never more than three snails on a single gorgonian at one time with majority of the hosts only occupied by a single snail and only twenty- eight percent of the surveyed gorgonians had two occupants (Snyder 2013). Other research found that C. gibbosum are normally found in pairs, one male and one female (Chiappone et al. 2003). Associations between snail pairs will be examined to resolve the discrepancy between Snyder (2013) and Chiappone et al. (2003). This study serves to measure the relative densities of C. gibbosum and their gorgonian hosts. The results found in this study were added to the data obtained by Snyder (2013) to gain a more comprehensive picture of the Discov- ery Bay, Jamaica area. The residence time of individual flamingo tongue on their gorgonian hosts was measured and predicted to be around 3.3 days based on Harvell and Suchanek (1987). Because the study area and time were closely associated with Snyder (2013), it was predicted snails will not move together between gorgonians. METHODS All sampling occurred in Discovery Bay, Jamaica along the coral reef where there was a high abundance of the gorgonian host corals with snails or feeding scars pre- sent. Because C. gibbosum occur mostly in areas where water depth is relatively shallow, all sampling occurred in water 8 m or less. The areas sampled were on the seaward side of the west forereef at dive locations M1, Dancing Lady (DL), and Long Term Site (LTS). Using SCUBA diving, 13 circular sample sites were chosen and labeled 1– 13 (Table 1). Sites were chosen at random at a range of depths. Each circular site measured 8 m in diameter. A 4 m piece of string was tied to a dead piece of coral, with ten- sion on the string a circle was made around the marked center point. For each circular sampling site, the number and species of gorgonian were counted as well as the num- ber of C. gibbosum. On gorgonians in the sample area where flamingo tongue were present, the number of snails per gorgonian was counted. The depth and a compass bearing relative to the Dis- covery Bay Marine Lab were also taken per sample site. A plastic water bottle filled with air was tied to the center point and labeled with the site number to mark the site. Density was calculated for flamingo tongue snails, each gorgonian species, and the gorgonian class overall at each individual sample site and averaged for the overall sample area. The percentage of gorgonians occupied by at least one C. gibbosum was compared with the percentage unoccupied to determine whether there was a greater majority of hosts with or without occupants. Residence time was calculated based on the number of days an individual flamingo tongue was located on a particular colony. A marking was etched onto each C. gib- bosum in the sample area using a microfile. The procedure used to make the markings was adapted from Lasker et al. (1988), it entailed picking up an individual gastropod, mak- ing the appropriate mark, and replacing the snail at the base of the gorgonian. This procedure was used because, while the markings are permanent, they do not alter the appear- ance of the C. gibbosum greatly and they are not harmful to them (Harvell and Suchanek 1987, Lasker et al. 1988). It allowed the snails to be handled only briefly and does not noticeably change their behavior (Harvell and Suchanek 1987). The coral where the flamingo tongue was present was also marked. Markings were made on the first day of sampling at each location. In the following days, sites were revisited to see whether the marked individual had moved from the original colony. The number of gastropods per gorgonian was record- ed to determine whether C. gibbosum move together be- tween colonies. In the following days, paired individuals were observed. The number of times the snails were seen together and the total number of times they were observed (whether they are together or apart) was recorded. The as- sociation formula, A1,2 = O1,2 / Omax where A1,2 is the asso- ciation, O1,2 is the number of times snail 1 was observed with snail 2, and Omax is the total number of times snail 1 or 2 was observed (whichever was observed more was used) Site Location Depth (m) Compass Bearing 1 M1 16 210o NE 2 LTS 17 180o N 3 LTS 19 200o NE 4 DL 22 210o NE 5 DL 14 210o NE 6 LTS 14 200o NE 7 DL 18 200o NE 8 DL 24 180o N 9 DL 15 220o NE 10 DL 11 230o NE 11 LTS 19 200o NE 12 DL 23 210o NE 13 DL 17 210o NE Table 1. Site number, location, depth, and compass bearing rela- tive to the Discovery Bay Marine Lab for each randomly chosen sample site. GORDON: FLAMINGO TONGUE RESIDENCE TIME16
  • 27.
    KORALLION. VOL 5.2014 was used (Lasker and Coffroth 1988). If A1,2 is greater than 0.5 then there is a significant association between the snail pair. From the pairs, the average A1,2 value and standard deviation was calculated to see if there was an overall sig- nificance in the association between gastropod pairs. RESULTS A total area of 653.45 m2 was sampled during this study. In the sample area, a total of 138 gorgonians of five different species were observed. A total of 13 C. gibbosum individuals were observed on nine different gorgonian indi- viduals. Nine C. gibbosum were found on G. flabellum, two were found on both P. flexuosa and Eunicea sp., and no snails were found on any other surveyed gorgonians. On average, there were 21.1 gorgonians per 100 m2 (± 13.0) (average ± standard deviation). Gorgonia flabellum was most abundant with 15.6 individuals per 100 m2 (± 8.3). Plexuara flexuosa were found with 5.7 individuals per 100 m2 (± 4.4). Pseudoptergorgia sp. and Eunicea sp. were similarly abundant with 3.0 individuals per 100 m2 (± 1.4) and 2.1 individuals per 100 m2 (± 1.4) respectively. Plexau- rella homomalla was least abundant with 0.3 individuals per 100 m2 (± 0). On average, there were 2.9 C. gibbosum per 100 m2 (± 1.0). In the sample area, 6.52% of the gorgonians sampled were occupied by at least one flamingo tongue snail. The majority of gorgonians in the sample area were not occu- pied by any snail (93.48%) though many had feeding scars present. Because each site was not visited on a daily basis it was not possible to calculate a residence time for each C. gibbosum individual, instead a range was calculated for the Snail Marking 19-May 20-May 21-May 23-May 24-May 25-May 27-May 1 l Intial Absent 2 ll Initial Present Absent Absent 3 llllll Initial Present Present 4 lll Initial Absent 5 llll Initial Absent Absent 6 lllll Initial Present Present 7 lllllll Initial Absent 8 ll/l Initial Absent 9 l/l Initial Present 10 ll/ll Initial Present 11 lll/lll Initial Absent 12 llll/llll Initial Absent 13 lll/lll Initial Absent overall sample population. The minimum residence time for the sample population was 2 days while the maximum residence time was 4 days (Table 2). Of the 13 snails ob- served, a majority were found on G. flabellum (Figure 2). No snails were observed on Pseudopterogorgia sp. or P. homomalla. Of the thirteen snails observed, four pairs of snails were observed together. Snails observed together both at initial marking period and in the following days were con- sidered to be paired and used to calculate the association variable (A1,2). The average association variable was 0.708 (± 0.344). Because the average association variable was greater than 0.5 the data represents a significant association between the paired C. gibbosum individuals. DISCUSSION The results are consistent with the results of Snyder (2013) as G. flabellum were most abundant and P. flexuosa second most abundant. Snyder (2013) found the density of C. gibbosum to be 9.9 individuals per 100 m2 (± 7.7), which is approximately five times greater than snail density in this study. This discrepancy is plausible because Snyder sought out sites where at least one flamingo tongue snail was pre- sent whereas areas with high gorgonian densities were used for sites in this study. Snyder (2013) found a higher abundance of corals to be occupied by C. gibbosum, 20% compared to 6.52% in this study. This discrepancy is because Snyder surveyed more individual sites (26 compared to 13). While the per- cent occupancy differed greatly, the Gorgoniidae family was occupied most often in both studies. Table 2. Table of marked snails and the dates they were observed. Initial represents the day the snail was initially marked, present and absent in the following days represents the dates the sites were revisited and whether or not the snail was present on the original coral. All snails were observed between 0700 and 1200. The minimum residence time was 2 days (snail 5) and the maximum was 4 days (snail 3). 17
  • 28.
    The average numberof snails and density of the C. gibbosum at each site is comparable to the values of flamin- go tongue snail observed in the Florida Keys (Chiappone et al. 2003). The density of C. gibbosum in the Florida Keys ranged from 0 (± 0) to 4.2 (± 1.2) individuals per 100 m2 and there were 2.00 individuals per 100 m2 (± 1.31) on av- erage (Chiappone et al. 2003). The maximum density from the Florida Keys was greater than the values in this study, but the average densities of C. gibbosum are closely relat- ed. Since the sample size of gorgonians, flamingo tongue snails, and the area of the reef sampled were small, the re- sults could differ greatly if a larger sample was used. The small sample size could also attribute to the differences between this study and Snyder (2013). Obtaining a larger sample size was difficult due to the time constraints of this study. The residence time of C. gibbosum ranged from 2 to 4 days, which was a fairly short residence time that supported the hypothesis of this study. Harvell and Suchanek (1987) also studied residence time but returned to each site on a daily basis and had an average residence time of 3.3 days. Their average residence time falls within the range of this study confirming the range is accurate. Cyphoma gibbosum use the gorgonian hosts primarily for food but they also are used for protection and reproduction. This is because the snails move searching not only for more food but also for the most protected colony or one suitable for reproduction. One pair of snails (numbers 11 and 12) were observed at the base of coral colony near newly deposited egg cases. The base of this coral was fairly protected from swimming predators confirming the movement prediction. The gorgo- nian serves other purposes than just food, which could be a reason why the residence time is so short. To improve the residence time data, in another study, sites would be marked one at a time and returned to on a daily basis until the marked gastropods were no longer present. This would allow the calculation of an individual residence time for each snail. Observations could be made on the activity of the gastropods while present on the gorgonian to observe what they use the gorgonian for most between feeding, protection, and reproduction. Chiappone et al. (2003) found C. gibbosum in pairs the majority of the time; the results from this study were not consistent with this conclusion. Of the four pairs of snails observed in this study, all but one exhibited signifi- cant association (A1,2 > 0.5); the average association varia- ble also showed overall significant association between snail pairs. Lasker and Coffroth (1988) collected associa- tion data at 3 sites in the San Blas Islands, Panama; two of the three sites showed significant association of C. gibbo- sum individuals, a conclusion consistent with this study. A possible reason for this association could be mating. It is possible that snails 11 and 12 could be a male and female pair who had just laid their egg case. This study served to increase knowledge of the densi- ty of flamingo tongue snails and gorgonians in Discovery Bay, Jamaica. By combining the data from this study with that of Snyder (2013), future researchers will have a more comprehensive understanding of gorgonian and C. gibbo- sum populations of west forereef area. ACKNOWLEDGMENTS I would like to thank E Burge for selecting me to partic- ipate in MSCI 477/499 Jamaica Maymester course as well as all the guidance he gave me on my project. I would also like to thank S Luff, D Scarlet, and Snow for all their help with the diving portion of my project from driving to the boat to marking my sites. Thank you to C O’Shea for being a supportive dive buddy and helping me to collect my data. Finally, thank you to Coastal Carolina University and the Discovery Bay Marine Laboratory for their support in un- dergraduate research efforts and allowing me to use their facilities and equipment. LITERATURE CITED Chiappone M, Diene H, Swanson D, Miller S. 2003. Density of gorgonian host occupation patterns by flamingo tongue snails (Cyphoma gibbosum) in the Florida Keys. Caribb J Sci. 39:11 6-1 27. Gayle PMH, Woodley JD. 1998. Discovery Bay, Jamaica. Carib- bean coral reef seagrass and mangrove sites. Paris: UNESCO. p. 17-33. Gerhart DJ. 1986. Gregariousness in the gorgonian-eating gastro- pod Cyphoma gibbosum: Tests of several possible causes. Mar Ecol Prog Ser. 31:255-263. Gerhart DJ. 1990. Fouling and gastropod predation: consequences of grazing for a tropical octocoral. Mar Ecol Prog Ser. 621: 103-108. Harvell CD, Suchanek TH. 1987. Partial predation on tropical gorgonians by Cyphoma gibbosum (Gastropoda). Mar Ecol Prog Ser. 38:37-44. Kinzie RA, III. 1973. Coral reef project papers in memory of Dr. Thomas F. Goreau. 5. The zonation of West Indian gorgoni- ans. Bull Mar Sci. 23:93-155. Lasker HR, Coffroth MA, Fitzgerald LM. 1988. Foraging patterns of Cyphoma gibbosum on octocorals: The roles of host choice and feeding preference. Biol Bull. 1 74:254-266. Lasker HR, Coffroth MA. 1988. Temporal and spatial variability among grazers: Variability in the distribution of the gastro- pod Cyphoma gibbosum on octocorals. Mar Ecol Prog Ser. 43:285-295. Leversee, GJ. 1976. Flow and feeding in fan-shaped colonies of the gorgonian coral, Leptogorgia. Biol Bull. 151: 344-356. Nowlis JP. 1993. Mate- and oviposition-influenced host prefer- ence in the coral-feeding snail Cyphoma gibbosum. Ecolo- gy. 74:1954-1969. Snyder N. 2013. Density, prevalence, host preference, and relative damage of flamingo tongue gastropods (Cyphoma gibbo- sum) on gorgonian hosts in Discovery Bay, Jamaica. Koral- lion. Coastal Carolina University Studies in Coral Reef Ecology. 4:10-14. GORDON: FLAMINGO TONGUE RESIDENCE TIME18
  • 29.
    TUBE AND VASESPONGE DIVERSITY, ABUNDANCE, AND DENSITY OF THEIR SYMBIONT, OPHIOTHRIX SUENSONII Tiffany M. Beheler Department of Marine Science, Coastal Carolina University, PO Box 261954, Conway, SC 29526 ABSTRACT Discovery Bay, Jamaica has a fringing reef which is an ideal habitat for Porifera. Sponges are the simplest multicellu- lar organisms, as well as the most prominent, abundant, and diverse component in a Caribbean sub-rubble reef community (Diaz and Rutzler 2001). They are a foundation species within the reef and have an important symbiotic relationship with the brittle star Ophiothrix suensonii. The sponges in Discovery Bay are crucial to the reef and the brittle stars. They pro- vide housing and the brittle star helps the sponge by cleaning the surface. The relationship between O. suesonii and marine sponges benefits the health and diversity of coral reefs. During the month of May 2014, 125 sponges were surveyed at the Discovery Bay Marine Laboratory. Of the 125 sponges surveyed, 43 brittle stars were observed. Niphates digitalis housed 30.23% of brittle stars. Past studies by Henkel and Pawlik (2005) have found that O. suensonii and N. digitalis are associat- ed with each other. Brittle stars did not vary between site and sponge species. However, the average sponge surface area differed intraspecifically. Xestospongia muta had the largest average surface area. KEYWORDS: symbiotic relationship, brittle stars, density, surface area, Discovery Bay This research was conducted as part of Coastal Carolina Universi- ty’s classes MSCI 477, Ecology of Coral Reefs, and MSCI 499, Directed Undergraduate Research in Discovery Bay, Jamaica, 14 –31 May 2014. Contact e-mail: tmbehele@coastal.edu INTRODUCTION DISCOVERY BAY, JAMAICA is home to a fringing reef that is continuous across the mouth of the lagoon vir- tually cutting the bay off from the sea (Gayle and Woodley 1998). The reefs found here are home to numerous phyla, Porifera being one of them. Marine sponges thrive on coral rubble and are very common in Discovery Bay because the reef is composed mainly of skeletons of Acropora palmata (Lamarck, 1816) and Millepora complanata (Lamarck, 1816) (Gayle and Woodley 1998). However, the sponge population has not always been diverse and abundant. In 1980, Hurricane Allen struck the north coast of Discovery Bay, negatively impacting the reefs and thus, the marine sponges (Wilkinson and Cheshire 1988). Prior to the hurri- cane the reef contained dense thickets of Acropora cervi- cornis (Lamarck, 1816), and some were destroyed which buried multiple species of sessile invertebrates (Wilkinson and Cheshire 1988). In 1983, the sponge population was again depleted due to an epidemic of Diadema antillarum (Lamarck, 1814) (Gayle and Woodley 1998). This reduc- tion led to an increase in non-crustose algae, prohibiting the success of sponges. The sponge population has bounced back since the decline in 1980, and has had a positive influ- ence on the reef. Sponges are the simplest multicellular marine organ- isms. These sessile invertebrates are prominent on the reef at various depths. Sponges, in some instances, have been known to have higher species composition and diversity compared to coral and algae. Sponges are an important functional and structural component of coral reefs because they provide refuge to a wide range of infauna (Henkel and Pawlik 2005). A recent publication suggested sponges com- prise 60% of all the sessile cryptic species making them a crucial part of coral reefs in Curaçao and Bonaire (Diaz and Rutzler 2001). Even though many species seek out sponges for ref- uge; sponges still have predators of their own. Sponges avoid predation through physical and chemical deterrents such as spicules which can work in conjunction with chem- ical deterrents (Wulff 2006). These defenses make sponges a prime habitat refuge for many different species. Different species of small, secondary sponges, crustaceans, cnidari- ans, echinoderms, molluscs, polychaetes, and bryozoans have all exhibited some association with sponges (Wulff 2006). Diaz and Rutzler found 192 species of crustaceans, ophiuroids, mollusks, and fishes inhabiting the reef spong- es, Aplysina lacunosa (Pallas, 1766) and Aplysina archeri. Being able to provide refuge to a large abundance of spe- cies ensures diversity among the reef. Their association with other organisms, by providing refuge, is one of the characteristics that make sponges a crucial component of coral reefs (Bell 2008). There are several theories as to why brittle stars seek out sponges as a preferred habitat, one of which is for pro- tection. Brittle stars have predators from a range of phyla but most of their predators are other echinoderms, crusta- ceans, and fish (Warner 1971). Warner (1971) found that 39% of fish and crustaceans from the British Isles had the brittle star Ophiothrix fragilis (Abildgard, 1789) in their KORALLION. VOL 5. 2014 19
  • 30.
    stomachs. Brittle starsexhibit negative phototaxis and some species even have bioluminescence deterrents (Hendler 1984). The most effective predator deterrent is occupying sponges. In order to temporarily separate themselves from predators, brittle stars often utilize their negative phototaxis by only feeding at night for extra protection (Henkel and Pawlik 2014). Recent studies found that the predation on brittle stars controls the distribution of brittle stars on the reef, leading them to inhabit sponges (Henkel and Pawlik 2005). Another reason for this brittle star and sponge associa- tion could be competition for space. Space is limited on coral reefs; therefore various cryptic organisms form asso- ciations with sessile invertebrates (Henkel and Pawlik 2005). When organisms seek out sponges for a habitat it leaves other spaces on the reef open which increases the reef’s diversity. In addition, Turon et al. (2000) proposed the sponge created currents carrying food particles increas- ing food availability for the brittle star. Brittle stars feed on seston, which fine particulate organic matter, easily carried in the sponge created current (Warner 1971). While the brittle star is in the sponge it can extend its arms out through the sponge tubes, usually feeding at night (Henkel and Pawlik 2014). It is unclear if brittle stars choose spe- cific sponges based on phenotypic variation, the presence of chemical defenses, or the size of the host. Their associa- tion with marine sponges may be commensal, mutualistic, or even parasitic (Henkel and Pawlik 2014). Several studies have examined why brittle stars prefer certain sponges. Between the two species of brittle star, Ophiothrix lineata (Lyman, 1860) was the most abundant and 99% of them were found on Callyspongia vaginalis (Henkel and Pawlik 2005). Callyspongia vaginalis is the most common sponge on Caribbean reefs with 79.1% of Ophiothrix suensonii (Lütken, 1856) residing in C. vaginal- is. In addition to living inside the sponge for protection, Hendler (1984) found that the sponge also benefits from having brittle stars as a resident. When the outside of the sponge was covered with marine sediment, the resident brittle stars cleared sediment off the sponge benefiting both the brittle star and the sponge (Hendler 1984). This mutu- alistic relationship also increases the survival of the brittle star, reaffirming the protection hypothesis (Hendler 1984). The aforementioned studies determined that their associa- tion was commensal and even mutualistic. In addition to being commensal, and sometimes mutualistic, Henkel and Pawlik (2014) found that O. lineata are also larval parasites of sponges. The association between C. vaginalis and O. lineata has always been thought of as mutualistic because the brit- tle stars clean off sediments on the outside of the sponge (Hendler 1984). However, Henkel and Pawlik (2014) want- ed to determine if O. lineata was parasitic to C. vaginalis and discovered that C. vaginalis individuals, without the brittle star present, release significantly more larvae than those with the brittle star. However, the growth of these brittle stars did not vary between brooding and non- brooding C. vaginalis (Henkel and Pawlik 2014). Since fewer larvae were released from C. vaginalis individuals with brittle stars Henkel and Pawlik (2014) concluded that O. lineata is a larval parasite on C. vaginalis. METHODS During May 2014, 125 sponges from various species were measured in Discovery Bay, Jamaica at the Discovery Bay Marine Laboratory. There were eight different sam- pling sites. Two locations, Dorm Shore and East Back Reef were inside the bay and the remaining sites were located outside of the bay (Figure 1). A total of 31 five meter tran- sects were haphazardly placed at the different sampling locations. Barrel and vase sponge species were measured 1 meter out from each side of the transect (10 m2 ). The oscu- lar diameter and sponge height was measured and recorded at depth with a standard ruler. Later the surface area was calculated by using SA = 2π × oscular radius (cm) × tube height (cm) (Henkel and Pawlik 2005). All transects were conducted while SCUBA diving. Each sponge measured was observed for presence of the brittle star O. suensonii. This was done through visual observations without cutting open the sponges. The brittle stars were counted if they were present and on the sponge. In total, 43 O. suensonii were observed. Authorities and species listed in Table 1. An ANOVA was run to determine if there was a sig- nificant difference in the number of brittle stars on each species of sponge as well as if the number of brittle stars varied between the eight different sampling locations. The sponge and brittle stars densities at each site were convert- ed 100 m2 . A linear regression was run to determine if there was a relationship between the number of brittle stars and the sponge surface area. Figure 1. Eight sample sites were used to determine sponge diver- sity in Discovery Bay, Jamaica; Skeggy Reef (1), LTS (2), Dorm Shore (3), M1 (4), East Back Reef (5), Dairy Bull (6), Litman’s Ledge (7), and East Litman’s Ledge (8). BEHELER: SPONGE DIVERSITY20
  • 31.
    RESULTS The sponge speciesrichness did not vary significantly between the eight different sampling sites. Ten different species of sponges were observed at the different locations (Table 1). The species richness varied from 2 to 6 species per site (Table 1). East Back Reef had the lowest species richness with only having two species present; Niphates digitalis and Aplysina fistularis (Table 1). Brittle stars were found at all of the sampling locations except for the East Back Reef. There was no significant difference in brittle star densities between the seven loca- tions (Figure 2, p-value = 0.24). M1 was home to 30.23% of the brittle stars which was the highest percentage (Figure 2). The three sites with the smallest density were LTS, Lit- man’s Ledge, and East Litman’s Ledge (Figure 2). The average number of brittle stars per 100 m2 was not significantly different between sponge species (p-value = 0.09). Ophiothrix suensonii was never observed in V. gi- gantea, O. bartschi, N. nolitangere, and A. archeri. On average S. zeai had a higher brittle star density; however, N. digitalis had 30.23% of the total number of brittle stars (Figure 3). While N. digitalis had most of the brittle stars the average density was the second least at 3.33 brittle stars per 100 m2 along with X. muta (Figure 3). On average A. fistularis had the lowest density of 0.85 brittle stars per 100 m2 (Figure 3). The sponge surface area was significantly different be- tween all ten species of sponges (p-value < 0.00). Xes- tospongia muta had an average surface area of 1581.45 cm2 which was the largest out of all ten species (Figure 4). The smallest average surface area was A. fistularis and was Figure 2. There was no significant difference between average density of brittle stars (BS/100 m2 ) and the site (p-value = 0.24). M1 had the highest density while East Back Reef had the lowest with a value of 0 BS/100 m2 . Dorm shore and Skeggy Reef were close in density with 5.83 BS/100 m2 and 6 BS/100 m2 respective- ly. Figure 3. There was no significant difference in the average brit- tle star density (BS/100 m2 ) and sponge species (p-value = 0.09). Four species, V. gigantean, O. bartschi, N. nolitangere, and A.archeri did not have any brittle stars on them.. Table 1. Average sponge densities (sponges/100 m2 ) at the eight different sampling locations. S. zeai and N. nolitangere were only found at Dorm Shore, and A. archeri was only found at M1. The highest density of sponges was present at LTS (200 sponges/100 m2 ). The highest average density of sponges was A. fistularis. Species richness is also shown for each site. M1 has the highest richness. KORALLION. VOL 5. 2014 21 Sponge Species Litman's Ledge LTS Dorm Shore Dairy Bull Skeggy Reef East Back Reef East Litman's Ledge M1 Average Agelas conifera (Schmidt, 1870) 0 200 0 50 20 0 20 10 37.5 Alpysina archeri (Higgin, 1875) 0 0 0 0 0 0 0 10 1.25 Alpysina fistularis (Pallas, 1766) 100 10 0 100 60 70 20 40 50 Callyspongia plicifera (Lamarck, 1814) 10 10 0 0 10 0 0 30 7.5 Neofibularia nolitangere (Duchassaing & Michelotti, 1864) 0 0 10 0 0 0 0 0 1.25 Niphates digitalis (Lamarck, 1814) 10 0 10 60 30 10 30 50 25 Oceanapia bartschi (de Lubenfels, 1934) 0 0 50 60 0 0 0 0 13.75 Svenzea zeai (Alvarez, van Soest, & Rutzler, 1998) 0 0 50 0 0 0 0 0 6.25 Verongula gigantea (Hyatt, 1975) 10 10 0 0 10 0 0 0 3.75 Xestospongia muta (Schmidt, 1870) 30 0 0 0 10 0 0 10 6.25 Species Richness 5 4 4 4 6 2 3 6
  • 32.
    Figure 4. Therewas a significant difference in the average sponge surface area (cm2 ) and sponge species (p-value < 0.00). The larg- est average surface area was found in X. muta (1581.45 cm2 ) and the lowest was A. fistularis (124.25 cm2 ). 124.25 cm2 (Figure 4). Two species, N. nolitangere and A. archeri, had the same surface area of 392.07 cm2 (Figure 4). There was no significant relationship between sponge surface area (cm2 ) and the number of brittle stars (R2 = 0.01). Table 1 shows the sponge densities at each sampling location as well as the average density overall. The most abundant sponges were A. fistularis which had an average density of 50 sponges per 100 m2 (Table 1). Litman’s Ledge and Dairy Bull had the highest densities of A. fistu- laris which was 100 sponges per 100 m2 (Table 1). When looking at individual sites, LTS had an A. conifer density of 200 sponges per 100 m2 which was the highest density out of all the species as well as all the sites (Table 1). There were two species, N. nolitangere and A. archeri, that had an average density of 1.25 sponges/100 m2 which was the low- est of the densities (Table 1). DISCUSSION Brittle stars are highly associated with sponges. Previ- ous research has shown that they mainly seek out sponges for refuge (Henkel and Pawlik 2005). Of the sponge species observed 30.23% of brittle stars were found on N. digitalis (Figure 3). This is somewhat concurrent with Henkel and Pawlik (2005) who found that 19.4% of O. suensonii were found on N. digitalis. The most abundant sponge in their research was C. vaginalis which also housed the most brit- tle stars (Henkel and Pawlik 2005). The most abundant sponge species in Discovery Bay was A. fistularis however it did not contain the most brittle stars. This could be be- cause A. fistularis has chemical defenses that may hinder the productivity of the brittle star as well as having a small average surface area. It is known that O. suensonii seeks out sponges for protection. The reason the brittle star chooses N. digitalis and C. vaginalis in other studies is di- rectly related to their physical characteristics (Henkel and Pawlik 2005). According to Henkel and Pawlik (2005) C. vaginalis and N. digitalis lack chemical defenses which could be the reason the brittle stars thrive on them. Brittle stars, such as O. suensonii will feed on the mucus that is on the outside of the sponge and chemical sponge defens- es can hinder their feeding productivity (Henkel and Pawlik 2005). According to Henkel and Pawlik (2014) densities of O. lineata were positively correlated with the size of C. vaginalis. This was expected in this experiment but there was no significant relationship between the average sponge surface area (cm2 ) and brittle star densities. It has been demonstrated by Henkel and Pawlik (2005) that surface area is important to the brittle star. A larger sur- face area allows for more refuge space for sponge while a smaller oscular diameter limits the size of the predator that can enter the sponge (Henkel and Pawlik 2005). Brit- tle stars also exhibit negative phototaxis which could be a reason densities were relatively low in most of the sponge species (Hendler 1984). Surveys done at night would increase the brittle star densities because they actively feed at night and would easily be seen. Another factor effecting density is brittle star spawning which normally peaks in June (Turon et al. 2000). Juvenile brit- tle stars typically lay on the surface of the sponge in plain sight while the adults are more cryptic and stay inside the tubes of the sponge (Turon et al. 2000). This could be a reason brittle star densities were low compared to re- search done by Henkel and Pawlik (2005). While there was no relationship between average sponge surface area and brittle star density, there was a difference in sponge surface area between the ten differ- ent species of sponges. The physical characteristics, os- cular diameter and sponge height, of N. digitalis is simi- lar to that of C. vaginalis which explains why in the ab- sence of C. vaginalis, N. digitalis becomes the dominate refuge for O. suensonii (Henkel and Pawlik 2005). Brittle star densities in Discovery Bay are fairly uniform between different sites and sponge species. The most abundant sponge in Discovery Bay is A. fistularis. It was found at all eight sites but is not highly associated with the brittle stars most likely due to its chemical de- fenses. Most places on the reef have similar species rich- ness which is most likely due to similar environmental conditions. ACKNOWLEDGMENTS I would like to thank the Discovery Bay Marine Laboratory and their staff for housing us and taking care of us during our stay. A big thank you to O Holder and D Edwards for taking us out on the boats and assisting with data collection. I would also like to thank M Sporre, C Raynor, A Galarno, and S Luff for assisting me with my research, and my classmates for making this a fun and BEHELER: SPONGE DIVERSITY22
  • 33.
    memorable trip. Finally,I would like to thank E Burge for the opportunity and support throughout my project. LITERATURE CITED Bell JJ. 2008. The functional roles of marine sponges. Estuar Coast Shelf Sci. 79: 341-353. Diaz MC, Rutzler K. 2001. Sponges: An essential component of Caribbean coral reefs. Bull Mar Sci. 69: 535-546. Gayle P.M.H, Woodly, J.D. 1988. Discovery Bay, Jamaica. In: Kjerfve B., editor. CARICOMP- Caribbean coral reef, seagrass and mangrove sites. Paris: UNESCO 17-33. Hendler G. 1984. Brittlestar color-change and phototaxis (Echinodermata: Ophiuroidea: Ophiocomidae). Mar Ecol. 5:379-401. Hendler G. 1984. The association of Ophiothrix lineata and Cally- spongia vaginalis: Brittlestar-sponge cleaning symbiosis? Mar Ecol. 5: 9-27. Henkel TP, Pawlik JR. 2014. Cleaning mutualist or parasite? Classifying the association between the brittle star Ophio- thrix lineata and the Caribbean reef sponge Callyspongia vaginalis. J Exp Mar Biol Ecol. 454: 42-48. Henkel TP, Pawlik JR. 2005. Habitat use by sponge-dwelling brittlestars. Mar Biol. 146:301-313. Turon X, Codina M, Tarjuelo I, Uriz MJ, Becerro MA. 2000. Mass recruitment of Ophiothrix fragilis (Ophiuroidea) on sponges: Settlement patterns and post-settlement dynamics. Mar Ecol Prog Ser. 200: 201-212. Warner GF. 1971. On the ecology of a dense bed of the brittle-star Ophiothrix fragilis. J Mar Biol Ass UK 51: 267-282. Wilkinson CR, Chesire AC. 1998. Growth rate of Jamaica coral reef sponges after hurricane allen. Biol Bull. 175: 175-179. Wulff JL. 2006. Ecological interactions of marine sponges. Can J Zoo. 84: 146-166. KORALLION. VOL 5. 2014 23
  • 34.
    STUDIES IN CORALREEF ECOLOGY24
  • 35.
  • 36.
    STUDIES IN CORALREEF ECOLOGY26
  • 37.
    This research wasconducted as part of Coastal Carolina Universi- ty’s classes MSCI 477, Ecology of Coral Reefs, and MSCI 499, Directed Undergraduate Research in Discovery Bay, Jamaica, 14 –31 May 2014. Contact e-mail: ajgalarn@coastal.edu DEPTH DISTRIBUTION, SIZE FREQUENCY, AND TIP COLOR POLYMORPHISM OF THE GIANT SEA ANEMONE, CONDYLACTIS GIGANTEA, OF DISCOVERY BAY, JAMAICA Ashton J. Galarno Department of Marine Science, Coastal Carolina University, PO Box 261954, Conway, SC 29526 ABSTRACT The giant sea anemone, Condylactis gigantea, of Discovery Bay, Jamaica was studied in three areas around the bay in a depth range from 0 to 15 meters below sea level. Tip color polymorphism, depth distribution, and size frequency of the three populations of anemones were recorded and compared. It was observed that green morphs were more common on the forereef and pink morphs were more popular in the lagoon and inside the bay. These observations suggest that pink morphs are more successful at adapting because they occupy more diverse niches in comparison to the green morphs. Over- all, there was a significant but only weak (r2 = 0.106) correlation between depth occurrence and the anemone size in the pink tipped anemones. In the green tipped anemones, there was no correlation (r2 = 0.056) between the size and depth of occurrence. The two most common tip color morphs, pink and green, did not have a significant difference in their depth distributions. KEYWORDS: Condylactis, distribution, size, polymorphism, Discovery Bay INTRODUCTION THIS STUDY was based out of the Discovery Bay Ma- rine Laboratory (DBML). Discovery Bay is located in the west-central portion of the northern coast of Jamaica. The area of the bay is 1.4 km2 and has a maximum depth of around 55 meters. The bay is almost entirely cut off from the open sea because of continuous fringe reefs that spans across the 1.2 km mouth of the bay (Gayle and Woodley 2007). The three observations sites are the lagoon, a reef inside the bay (Dorm Shore), and the forereef. Figure 1 shows the areas of study. The bay has great geological diversity due to the mul- tiple ecosystems it supports and the subtropical climate. These ecosystems include: coral reefs, sea grass beds, man- groves, rocky platforms, sand flats, limestone shores, and sandy beaches (Warner and Goodbody 2005). Of all of these ecosystems, coral reef structures are one of the most important because they provide the substratum matrix on which many other species depend. Space is a very limiting resource on reefs, so the competition for space is a signifi- cant feature of coral reef ecology. Sea anemones are rela- tively sessile carnivores that are classified as one of the main organisms, along with reef building corals, sponges, and algae, competing for space on coral reef structures. Anemones consist of a large individual polyp with numer- ous tentacles and some species contain zooxanthellae, pho- tosynthetic endosymbionts, within their tissues. Since sea anemones must occupy areas that are well lit and they must be situated in a way that allows them to make use of a prey resource, their spatial requirements are very restricted (Sebens 1976). Coral reefs offer many substratum types that are well suited for sea anemone habitats due to the three dimensional nature of reefs. The giant sea anemone, Condylactis gigantea (Weinland 1860), is generally found in crevices of walls of rock, attached to shells, rocks, or any other hard substrate in relatively shallow waters with access to sunlight (Hanlon 1986). Movement allows them to ac- cess new areas of substratum before other forms of antho- zoans; if local conditions start to deteriorate they can change their location (Sebens 1976). The coral reef ecosys- tem in Discovery Bay, Jamaica is suited to sustain a large population of the giant sea anemone, C. gigantea. The northern coast of the country is mostly sheltered from large oceanic swells by Cuba, which is approximately 150 km north. The bay has diurnal tides with tidal ranges between 15 cm and 60 cm, which affect the amount of light anemones receive because the depth of water is constantly changing near shore. The local wind patterns determine the standard wave regime for the area, which can range from flat and calm to very choppy seas with waves reaching over 1.5 meters (Gayle and Woodley 2007). These large waves are capable of re-suspending sediments from the bottom of the shallow back reef within the bay. These sediments can be suspended on an order of days, which restricts coral growth. Severe degradation of coral reefs comes primarily from large increases in sedimentation. Small particles of KORALLION. VOL 5. 2014 27
  • 38.
    sediment can smotherorganisms, like sea anemones, that live on reefs. Sediments also reduce the light availability for zooxanthellae that use photosynthesis, which is one of the ways that sea anemones get their nutrients (Porter 1990). High sedimentation rates can lower the growth rate of reef accretion, which means, in the long run, there will be less space for sea anemones to inhabit. Sedimentation can alter the highly complex interactions between sea anemones and corals and any other living organism that depends on the reef for survival. The decline in amount of space and shelter a reef can provide leads to a drop in the number of individuals that a reef can support. Also, heavy sedimentation can end up killing reef building corals which leads to the collapse of the entire framework of the reef (Porter 1990). This can be devastating to sea anemones because they are mostly sessile and depend entirely on the reef to provide a stable habitat. Condylactis gigantea inhabits a wide spectrum of cor- al reef habitats and displays multiple phenotypes, especially with respect to tip color. The different distributions of ge- netic and phenotypic variations can provide insight into local adaption. Along the coast of Discovery Bay, anemo- nes with pink or green tips on their tentacles show distinct distributions. The green morphs are found more abundantly in the shallow forereef, whereas the pink morphs are found mostly in the deeper areas and in the lagoon itself (Stoletzki 2005). Light is a vital spatially varying factor in coral reefs, especially for the anemones that rely on photosynthetic endosymbionts (Brown 1997). The amount of transmitted sunlight through water depends on the clarity and depth of the water at a certain location. An ecological trait, like tip color in anemones, can differ depending on the radiation level. Even though there are a variety of color morphs found at many locations, the depth distribution suggests that the two color morphs are adapted to different sunlight radiation levels (Stoletzki 2005). The purpose of this study was to investigate the rela- tionship between size, depth distribution, and tip color of the giant sea anemone. It was hypothesized that there will be differences in tip color relative to depth due to light at- tenuation and that their size will vary with depth distribu- tion due to different light and nutrient levels. Size is pre- dicted to have a direct correlation with depth, in that small- er anemones will be deeper due to less light attenuation. METHODS The data was collected in May, 2014 at the Discovery Bay Marine Laboratory in Discovery Bay, Jamaica. Thirty different visual surveys were conducted to determine the population density of C. gigantea. Ten surveys were con- ducted at each sampling area; specific locations for surveys within each are were selected for based on the presence of C. gigantea. The first area that was observed was the shal- low lagoon that is adjacent to the marine laboratory. The second observational area was a reef inside the bay called Dorm Shore. The third area observed was the front side of the forereef, which is located outside of the bay. A sample area is defined as a circle with a radius of 2 meters that was measured by using a transect tape. Sample areas were set by a 3 foot long rebar pole that was hammered into the sub- strate and the transect tape was attached to the pole at one end and the other end of the tape was pulled in a circle. By means of SCUBA diving and snorkeling, every individual sea anemone in the study area was counted and measured. The depth range that was used was from sea level, 0 m, to 15 m. The depth at which each sea anemone is located was recorded with an OCEANIC Pro Plus 3 dive computer. A dive flashlight was used to determine the actual tip colors of each individual anemone; this is to account for light ab- sorption as depth increases. To obtain the dimensions of the anemone diameter, a tentacle tip was pinched causing the anemone to contract, and then a ruler was used to measure the diameter along the longest axis of the ellipsoidally (Wirtz 1996). An analysis of variance, ANOVA, was done to ana- lyze the differences between the group means of depth and size at the three sampled locations. A two sample t-test assuming equal variances was also used to test the signifi- cance between the sampling characteristics. The correlation between the disk size of individuals and how the sizes var- ied with depth was determined through a test of linear re- gression. The average sizes and depths of the pink morphs were compared to those of the green morphs.Figure 1. A map of Discovery Bay, Jamaica that shows the local bathymetry where the data were collected. The arrows point to the 3 locations, the lagoon, forereef, and inside the bay (Dorm Shore), where data were collected. GALARNO: CONDYLACTIS POLYMORPHISM AND DISTRIBUTION28
  • 39.
    RESULTS In total therewere 240 anemones measured, 180 pink tipped and 60 green tipped. Of the 180 pink tipped anemo- nes, two were found on the forereef, 101 were counted in the lagoon, and 77 were seen at Dorm Shore. There were 26 green tipped anemones found in both the lagoon and on Dorm Shore and 8 were found on the forereef. There was no statistical significance between the tip colors at all three sampling locations (ANOVA; p-value = 0.37, f-calc = 1.39). There was not a significant difference in the tip col- ors between the forereef and lagoon (t-test; p-value = 0.56, df = 2, t-stat = 0.686). Between the forereef and Dorm Shore there was no significant difference between the tip colors (t-test; p-value = 0.62, df = 2, t-stat = 0.583). There was a significant difference between the tip colors of the lagoon and Dorm Shore (t-test; p-value = 0.034, df = 2, t- stat = 5.25). The average diameter of all C. gigantea surveyed was 19.98 cm, the maximum was 53 cm and the minimum was 3 cm (Figure 2). The size distribution of sea anemones rela- tive to tip color was not significantly different between the forereef and Dorm Shore (t-test; p-value = 0.619, df = 2, t- stat = -0.58). There was no significant difference in the size relative to tip color between the forereef and lagoon (t-test; p-value = 0.396, df = 2, t-stat = -1.07). Between the lagoon and Dorm Shore, there was no significant difference be- tween tip color and size of anemone (t-test; p-value = 0.908, df = 2, t-stat = 0.131). There were no significant differences between the means for diameter size of anemo- nes relative to tip color between the three locations (ANOVA; p-value = 0.15, f-calc = 3.89; Figure 3). The average depth of all C. gigantea surveyed was 4.566 m, the minimum depth was 0.762 m and the maxi- mum depth was 14.63 m. There was no significance relat- ing to the depth distribution of anemones relative to tip color between the forereef and lagoon (t-test; p-value = 0.69, df = 2, t-stat = -0.46). Between the forereef and Dorm Figure 2. Size frequency of the total pink and green tipped anem- ones found at all three sampling locations. Shore there was no significance between depth and tip col- or (t-test; p-value = 0.347, df = 2, t-stat = -1.22). There was also no significance between the lagoon and Dorm Shore (t -test; p-value = 0.994, df = 2, t-stat = -0.008). Comparing all three locations showed that there were no significant relationships between the average depths of occurrence relative to tip color (ANOVA; p-value = 0.075, f-calc = 6.96; Figure 4). The linear regression plot for the green tipped anemo- nes on the forereef showed that there was a very weak cor- relation between anemone size and their depth of occur- rence (r2 = 0.22; Figure 5). However, there were only two pink tipped anemones found on the forereef, so a linear regression line could not accurately be plotted. There was no correlation between the pink tipped anemones in the lagoon (r2 = 0.06). The green tipped anemones in the la- goon had no correlation between size and depth distribution (r2 = 0.009, Figure 6). On the Dorm Shore reef, the pink tipped anemones showed no correlation (r2 = 0.062). The Figure 3. Average size of pink and green tipped anemones rela- tive to their location. Figure 4. Average depths of occurrence relative to tip color at all three of the sampling locations. KORALLION. VOL 5. 2014 29
  • 40.
    green tipped anemonesfound on Dorm Shore showed an incredibly weak or almost no correlation (r2 = 0.13; Figure 7). When the location was disregarded the pink tipped anemones had a very weak correlation between size and depth of occurrence (r2 = 0.16). Overall, the green tipped anemones showed no correlation between depth and size (r2 = 0.056; Figure 8). Figure 5. Linear regression plot for the pink and green tipped anemones found on the forereef. There were two pink tipped anemones in this area, so the regression line can be disregarded for accuracy purposes. The green tipped anemone r2 value is .22 and the equation is y = -1.27x + 33.37. Figure 6. Linear regression plot for the pink and green tipped anemones found in the lagoon. There was no correlation for pink or green tip color, with r2 values of 0.06 and 0.009 respectively. Figure 7. Scatter plot for the pink and green tipped sea anemones found off of Dorm Shore. The r2 value for the pink tipped anemo- nes was 0.062 and for the green tipped it was 0.13, neither of which have a correlation between size and depth. The linear re- gression equation for pink tipped anemones is y = -1.79x +38.85 and the equation for green tipped anemones is y = -2.40x +43.94. Figure 8. Linear regression plot for all of the pink and green tipped anemones that were observed in the study. The r2 value for the pink tipped was 0.106, which is very weakly correlated. The r2 value for the green tipped was 0.056, which shows that there is no correlation between size and depth occurrence. The regression equations for pink and green anemones are y = 0.763x + 16.67 and y = 0.46x + 17.27, respectively. DISCUSSION In Discovery Bay, Jamaica, there was a considerable amount of spatial variation between green and pink tip col- or morphs of C. gigantea observed in the lagoon, on the forereef, and on Dorm Shore. Regardless of depth, the pink tipped anemones were found to be much more prevalent in all areas, except on the forereef. Previous research done by Stoletzki and Schierwater (2005) showed that pink tipped anemones were found more often in the lagoon or at deeper depths, whereas green tipped anemones were found in areas with a more constant access to sunlight, like the forereef. GALARNO: CONDYLACTIS POLYMORPHISM AND DISTRIBUTION30
  • 41.
    The observation thattip color and depth did not correlate suggests that color polymorphism is not an adaption to dif- ferences in light attenuation, which agrees with the results that were found in a similar study done in the Canary Is- lands (Wirtz 1996). Mudron (2010) found that the number of pink morphs and green morphs in the lagoon, inside the bay, and on the forereef were not influenced by their depth of occurrence. Surveying and observing the anemones in three different types of environments gives a greater insight to the distribution of the two color morphs and may indi- cate that their presence is not limited to depth as previously thought. Though there were 10 sample areas observed on the forereef, regardless of tip color, there was only a small amount of anemones found in this area. The prevalence of pink tipped anemones in more diverse environments sug- gests that they are more capable than green morphs at adapting to new niches. A higher occurrence could also suggest that pink morphs are better suited to handle differ- ent stresses than green morphs. The relationship of this variable is not pertinent because a numerical prevalence in each area was not discussed (Stoletzki and Schierwater 2005). Conclusions as to the correlation between depth and tip color of C. gigantea cannot be determined without addi- tional future observations. The observation that size and depth did not correlate suggests that light and nutrient levels do not determine the size of anemones at any depth. None of the anemone sizes correlated with their depth of occurrence indicating that all sizes of individuals are possible regardless of depth. These results are consistent with another study where the size of Stichodactyla gigantea (Forsskal, 1775) did not correlate with depth (Hattori and Kobyashi 2008). There was no cor- relation between the size of anemone and their tip color. It was previously thought that age could be a determining factor of anemone tip color polymorphism (Medioni et al. 2001), however, age and size were not correlated in this study so it cannot currently be determined if the age/size relationship affects the tip color of anemones. In the future, possible studies could be done to determine what causes tip color polymorphism in sea anemones by studying their age, size, diet, and behavioral patterns. ACKNOWLEDGMENTS First I would like to thank my diving and snorkeling partner, M Miller, who pointed out to me many anemones that I may have otherwise overlooked. I would also like to thank D ‘Skeggy’ Edwards and O ‘Snow’ Holder at the Discovery Bay Marine Laboratory for helping to point out the best locations for studying giant sea anemones. A spe- cial thanks to all of the rest of the staff at the marine lab for hosting us and letting us make this our home away from home for the duration of our trip. Lastly, I would like to thank E Burge, of Coastal Carolina University, for giving me the opportunity to complete this research and his rec- ommendations and continued support throughout my entire project. LITERATURE CITED Brown B. 1997. Adaptions of reef corals to physical environmen- tal stress. Adv Mar Biol. 31: 222-301. Gayle PMH, Woodley JD. 1998. Discovery Bay, Jamaica In: Kjerfve B (ed) CARICOMP- Caribbean coral reef, seagrass and mangrove sites. Coastal region and small island papers. 3. UNESCO, Paris. Hanlon R, Hixon R 1986. Behavioral associations of coral reef fishes with the sea anemone Condylactis gigantea in the Dry Tortugas, Florida. Bull Mar Sci. 39(1):130-134. Hattori A, Kobayashi M. 2008. Incorporating fine-scale seascape composition in an assessment of habitat quality for the giant sea anemone Stichodactlya gigantea in a coral reef shore zone. Ecol Res. 24: 415-422. Medioni E, LeComte Finiger R, Louviero N, Planes S. 2001. Ge- netic and demographic variation among colour morphs of cabrilla sea bass. J Fish Biol. 58: 1113-1124. Murdon M. 2010. Differentiation of the sea anemone Condylactis gigantea color morphs by habitat and genetics. Korallion. 1: 1-13. Porter JW. 1972. Patterns of species diversity in Caribbean reef corals. Mar Ecol Prog Ser. 53: 745–748. Sebens K. 1976. The ecology of Caribbean sea anemones in Pana- ma: Utilization of space on a coral reef. Coel Ecol Beh. 67- 77. Stoletzki N, Schierwater B. 2005. Genetic and color morph differ- entiation in the Caribbean sea anemone Condylactis gigan- tea. Mar Biol. 147: 747–754. Warner G, Goodbody I. 2005. Chapter 1.4. Jamaica. Caribbean Marine Biodiversity: The Known and the Unknown. DES- tech Pub. Inc. 57-70. Wirtz P. 1996. The sea anemone, Telmatactis cricoides, from Madeira and the Canary Islands: Size frequency, depth dis- tribution and colour polymorphism. Arquipélago. Life Mar Sci. 14A: 1-5. Woodley JD, Chornesky EA, Clifford PA, Jackson JCB, Kaufman LS, Knowlton N, Land JC, Pearson MP, Wulff JL, Curtis ASG, Dallmeyer MD, Jupp BP, Koehl MAR, Neigel J, Sides EM. 1981. Hurricane Allen’s impact on Jamaican coral reefs. Science. 214:749-755. Woodley JD. 1989. The effects of Hurricane Gilbert on coral reefs at Discovery Bay. In: Assessment of the Economic Impacts of Hurricane Gilbert on Coastal and Marine Resources in Jamaica (edited by P. Bacon), pp. 79-82. CEP Technical Report No. 4, UNEP Car Envi Pro, Kingston, Jamaica, 87. KORALLION. VOL 5. 2014 31
  • 42.
    32 STUDIES INCORAL REEF ECOLOGY
  • 43.
  • 44.
    34 STUDIES INCORAL REEF ECOLOGY
  • 45.
    KORALLION. VOL 5.2014 A COMPARISON OF THE RIO BUENO AND DISCOVERY BAYS BASED ON FECAL COLIFORM CONCENTRATION IN RELATION TO FLUVIAL INPUT AND SURROUNDING HUMAN DEVELOPMENT Megan E. Miller Department of Marine Science, Coastal Carolina University, PO Box 261954, Conway, SC 29526 ABSTRACT A study was conducted on the northern coast of Jamaica in two different bays differing in the amount of fluvial input and development. Discovery Bay, Jamaica experiences no fluvial input, but human development surrounds the perimeter of the bay. Rio Bueno Bay experiences heavy amounts of fluvial input from the Dornoch Head River, which flows through mountainous and rural land before draining into the bay. Samples were collected at haphazard locations around the perime- ter of each bay as well as locations at the mouth of each bay, at the headwaters of the Dornoch Head River, and at locations on the river. Samples were taken at the mouth of each bay to show that coliform levels decreased in areas that were far from human development and fluvial input. Once the total coliform concentrations were found for each site, an analysis of vari- ance (ANOVA) was used to compare statistical differences between the first sample day in each bay and the second sample day in each bay. Two paired T-tests were used to compare the coliform levels from the first and second sample days in each bay. Coliform levels were higher in areas near human development and fluvial input. Sample areas ranged in values from 0 CFU/100 mL (colony forming units per 100 mL) to 2400 CFU/100 mL. Coliform levels were highest in Rio Bueno Bay near the mouth of the Dornoch Head River. KEYWORDS: E. coli, water quality, ColiScan, runoff, bacterial contamination This research was conducted as part of Coastal Carolina Universi- ty’s classes MSCI 477, Ecology of Coral Reefs, and MSCI 499, Directed Undergraduate Research in Discovery Bay, Jamaica, 14 –31 May 2014. Contact e-mail: memiller@coastal.edu INTRODUCTION FECAL COLIFORMS occur in the ocean, bays and other water bodies through anthropogenic inputs. Non-point sources of these coliforms can be storm water runoff, septic systems, sanitary sewers and also wildlife (Steets and Hold- en 2003). Fecal coliforms can consist of Escherichia coli and other types of coliforms. Escherichia coli is an enteric bacterium (Todar 2012). They are anaerobic Gram-negative rods that live in the intestinal tracts of healthy and diseased animals. They can grow in media containing glucose re- gardless of the presence of oxygen. The bacteria can re- spond to environmental signals such as chemicals, pH, and temperature. Escherichia coli is consistently present in the human gastrointestinal tract (Todar 2012). This presence led to the use of the bacterium as an indicator of fecal pol- lution and water contamination (Todar 2012). The bacteria are not always pathogenic, but are found copiously in wa- ters with human contributions (Noble et al. 2003). The most commonly measured bacterial indicators are total col- iforms, fecal coliforms and enterococci (Noble et al. 2003). Fecal coliforms and E. coli are used to monitor fecal con- taminations of water bodies around the world (Bai and Lung 2005). Because of the different levels of fluvial input and human development, the levels of fecal coliforms and E. coli in each bay are expected to vary. Jamaica is the third largest island in the Greater Antil- les (Gayle and Woodley 1998). The island is 235 kilome- ters long and 99 kilometers wide. Jamaica experiences a subtropical climate, which is generally marked by two wet and two dry seasons. Persistent rains occur between the months of October and December, with the rains lasting for a least a week. June and July are found to be the driest months (Gayle and Woodley et al. 1998). Discovery Bay is located on the northern side of Jamaica. It is a bay with no direct fluvial input. The town of Discovery Bay is on the southern slope of the bay. Port Rhoades is located on the southwestern corner of the bay. This port is the loading facility of a bauxite company. Groundwater enters the bay through deep cracks in the basement limestone (Gayle and Woodley 1998). Rio Bueno Bay, also located on Jamaica’s northern coast, is approximately 4 kilometers from Discovery Bay. Rio Bueno Bay differs in both development levels and flu- vial inputs. The Rio Bueno Bay receives significant inputs of fluvial terrigenous sediments (Mallela et al. 2004). Be- fore flowing into the bay, the Dornoch Head River runs through mountainous and rural land, into the town of Rio Bueno. The Dornoch Head River finally flows into the bay. The bay is a high-energy open-coast surf zone. There is a lot of sediment generation because of the high-energy coast. Longshore drift and local currents are among the 35
  • 46.
    hydrodynamic processes thataffect the bay (Mallela et al. 2004). The bay is a highly variable environment because of the fluvial input; the surface waters in the bay can fluctuate between marine and brackish (Malella et al. 2004). After heavy rainfalls in the area, a highly turbid freshwater plume extends from the mouth of the Dornoch Head River and across the bay. The plume can persist there for weeks at a time (Malella et al. 2004). In general, the perimeter of the bay is undeveloped. There is no major town or industrial area surrounding the bay. Because of the fluvial inputs in the Rio Bueno Bay, fecal coliform concentrations were expected to be higher. In Discovery Bay, because there is no direct fluvial input, fecal coliform levels were lower than that of Rio Bueno Bay. However, because there is human development along the perimeter of Discovery Bay, fecal coliform concentra- tions were expected to be more uniform and consistent around the bay. The objective of this study was to compare the fecal coliform levels in a bay with one major fluvial input versus a bay with no fluvial input. This is the first study compar- ing both the Rio Bueno Bay fecal coliform levels to the Discovery Bay fecal coliform levels. METHODS A total of 50 15 mL samples were taken at the perime- ters of Rio Bueno Bay and Discovery Bay between May 17 and 25, 2014, making a total of 100 samples. Twelve sam- ples were taken at the mouth of each bay to account for the difference between coliform levels around the perimeter and coliform levels in the open bay. Fifteen samples were collected while rafting down the Dornoch Head River, and one sample was collected at the headwaters of the Dornoch Head River. These methods were adapted from the Coastal Carolina University Waccamaw Watershed Academy. Samples were collected in sterile 15 mL centrifuge tubes The tubes were submersed approximately two to six inches into the water until full. In order to avoid contamina- tion, the inside of the cap and bottle were not touched by human hands or any foreign substances. The samples were kept on ice while being transferred back to the lab and plat- ed within 24 hours of being collected. At the conclusion of the incubation period, samples were analyzed to determine fecal coliform concentrations. A volume of 3 mL of each sample was pipetted into a bottle of defrosted ColiScan Plus EasyGel media. The mixture was inverted, and poured into a petri dish. The petri dish was then incubated in the lab between 29.1 and 31.1 ̊C for 18 to 24 hours.. Blue colonies, pink colonies and glowing colonies were counted to determine fecal coliform concen- tration in the sample. Pink colonies indicated coliform growth, while blue colonies indicated E. coli growth (MicrologyLabs.com). An ultraviolet light was used to de- termine which colonies were glowing. A glowing colony was indicative of E. coli. Therefore, any colony with E. coli had a slightly glowing ring around it (MicrologyLabs.com). Each sample was evaluated and colonies were counted to determine colony forming units (CFU/100 mL). The formula, total colony count x (100/3), was used to deter- mine CFU/100 mL. To find the fecal coliform concentra- tion in Coliform Units per 100 mL (CFU/100 mL), the total amount of colonies on a plate were counted. Colonies had to have a diameter larger than 0.5 mm, a size similar to a period (.), in order to be considered in the count. The total amount of colonies was then multiplied by 100 divided by the number of millimeters of sample water pipetted into the media. Once the colony forming units (CFU/100 mL) were calculated for each site, the values were log base 10 trans- formed. In order to compare sample sites between the two different bays on the first and second sample days, a single factor ANOVA was used. A paired T-test was used to com- pare values from the first and second sample days in each bay. To compare differences in colony forming units at sites in Rio Bueno and Discovery bays on first sample day, a single factor ANOVA was used and another single factor ANOVA was used to compare the colony forming units on the second sample days in each bay. RESULTS During the two week period of sampling, coliforms were found in waters of the Rio Bueno and Discovery Bays. Coliform levels varied greatly, with some sample sites having no coliforms and some sample sites having many coliforms. Coliforms ranged from 0 CFU/100 mL to 2300 CFU/100 mL. Sites in Rio Bueno Bay varied in coliform concentra- tions (Figure 1). Coliform concentrations also varied in Discovery Bay (Figure 2). Samples taken while floating on a raft down the Dornoch Head River are denoted in Figure 3. The sample vial was inserted into the water and the loca- tion was marked by GPS. The distribution was more uni- form with coliforms consistently occurring around the pe- rimeter of the bay near the shoreline, closer to human de- velopment. A single factor ANOVA, with a p-value of 0.007, showed a significant difference in the amount of coliforms in Discovery Bay and Rio Bueno Bay on the first days of sampling. A second single factor ANOVA, with a p-value of 0.708, showed no significant difference on the second days of sampling. A paired T-test showed a significant dif- ference in coliform levels in Rio Bueno Bay from the first and second days of sampling. A T-stat value of (5.220) was greater than the T-crit value of (2.064), showing a signifi- cant difference on each sample day in Rio Bueno Bay. A paired T-test showed no significant difference in coliform levels in Discovery Bay on the first and second sample days. A T-stat value of (1.116) was less than the T-crit val- ue of (2.064.) MILLER: FECAL COLIFORM COMPARISON36
  • 47.
    DISCUSSION Coliforms were foundin water samples taken in Rio Bueno and Discovery Bays on the northern coast of Jamai- ca. The levels of coliforms in the surface waters varied in each bay. Because of the development surrounding the pe- rimeter of Discovery Bay, coliforms were consistently found in the surface waters, but not in great numbers. The fluvial input into Rio Bueno Bay caused increased coliform levels near the mouth of the river. Coliform levels were lower in areas further from the mouth of the river. Rio Bueno Bay has steady input of terrigenous sedi- ment and freshwater from the Dornoch Head River. Be- Figure 1. Satellite map showing the 50 sampling locations in Rio Bueno Bay. Colored points of different sizes on the map corre- spond with different values of colony forming units. The points also correspond with their GPS coordinates. Larger points in shades of purple indicate higher values, while smaller points in shades of blue indicate lower levels of colony forming units. Figure 2. Satellite map showing the 50 sampling locations in Discovery Bay. Colored points of different sizes on the map cor- respond with different values of colony forming units. The points also correspond with their GPS coordinates. Larger points in shades of orange or green indicate higher values, while smaller points in shades of light blue indicate lower levels of colony forming units. Figure 3. Satellite map shows the 15 sampling locations in the Dornoch Head River. Samples were taken on May 26th of 2014. Colored points of different sizes on the map correspond with dif- ferent values of colony forming units. The points also correspond with their GPS coordinates. Larger points in shades of purple indicate higher values, while smaller points in shades of blue indi- cate lower levels of colony forming units. KORALLION. VOL 5. 2014 37
  • 48.
    cause of thefluvial input of freshwater and sediment, coli- forms survive in the surface waters around the perimeter of Rio Bueno Bay. A study by Gerba and McLeod (1976) showed that sediment can prolong the survival time of fecal coliforms in marine waters. The study showed that the sedi- ment can even support their growth in the water in spite of the presence of other competing organisms (Gerba and McLeod 1976). Eschericha coli rapidly died away in wa- ters from a site that was not polluted with sediment. The nutrients in the sediment prolonged the growth. The salinity of the water did not appear to affect the growth of the or- ganism. These findings support the results shown in this study conducted in Rio Bueno and Discovery Bays. Differences in fecal coliform levels between the sam- pling days in Rio Bueno Bay can be explained by differ- ences in rainfall. The first sample taken on May 17th was not preceded by heavy amounts of rainfall. During the time frame between samples, heavy rains occurred. Increases in precipitation increased the amount of freshwater and terri- genous sediment deposited into the bay by the Dornoch Head River. This increase in precipitation could have caused the significant difference in coliform levels on the first and second sampling days. A study by Ackerman and Weisberg (2003) showed that increased rainfall caused and increase in bacterial concentrations. The largest increase in bacteria occurred on the first day after the storm (Ackerman 2003). Conversely, the lack of a significant difference between coliform levels in Discovery Bay can be attributed to consecutive sampling days without precipita- tion. In days following rain, the bacterial counts returned to the original numbers (Ackerman 2003). Because there was not a gap in sampling and there was no precipitation during the two sample days, less freshwater runoff drained into the bay. With less freshwater runoff, there are less coliforms (Ackerman 2003). In order to improve results, future studies could take samples from each bay on the same days. The samples could be taken consecutively as well as after periods of heavy precipitation. ACKNOWLEDGMENTS I would first and foremost like to thank E Burge for providing this wonderful opportunity, for being helpful and patient during the research process, and for driving the boat on my sample days. I would also like to thank T Beheler and A Kammerer for writing down the GPS coordinates for 100 of my sample sites. Thank you to the entire staff of the Discovery Bay Marine Laboratory for permitting the use of the lab and for the assistance in the field. LITERATURE CITED Ackerman, D, Weisberg, S. 2003. Relationship between rainfall and beach bacterial concentrations on Santa Monica bay beaches. J Water Health, 1: 85-89. Bai S, Lung W. 2005. Modeling sediment impact on the transport of fecal bacteria. Water Res. 39(20):5232–5240. FAQ. MicrologyLabs.com. Micrology Labs, 1998. <http:// www.micrologylabs.com/page/64/FAQ#tweleve>. Gayle PMH, Woodley JD. 1998. Discovery Bay, Jamaica In: Kjerfve B (ed) CARICOMP- Caribbean coral reef, seagrass and mangrove sites. Coastal region and small island papers. 3. UNESCO, Paris. Gerba CP, McLeod JS. 1976. Effect of sediments on the survival of Escherichia coli in marine waters. Appl Environ Micro- biol. 32(1):114. Malella J, Perry C, Haley M. 2004. Reef morphology and commu- nity structure along a fluvial gradient, Rio Bueno, Jamaica. Caribb J Sci. 40(3):299-311. Noble RT, Moore DF, Leecaster MK, McGee CD, Weisberg SB. 2003. Comparison of total coliform, fecal coliform, and enterococcus bacterial indicator response for ocean recrea- tional water quality testing. Water Res. 37(7):1637-1643. Streets BM, Holden PA. 2003. A mechanistic model of runoff- associated fecal coliform fate and transport through a coastal lagoon. Water Res. 37:589–608. Todar K. 2012. Pathogenic E. coli. Bacteriology. Madison: Uni- versity of Wisconsin. p. 1. http://textbookofbacteriology.net/ e.coli.html. MILLER: FECAL COLIFORM COMPARISON38
  • 49.
    KORALLION. VOL 5.2014 WATER COLUMN PROFILE AND PHYSICAL/BIOLOGICAL ANALYSIS OF CRATER LAKE, DISCOVERY BAY, JAMAICA Andrew J. Kammerer Department of Marine Science, Coastal Carolina University, PO Box 261954, Conway, SC 29526 ABSTRACT Crater Lake is a 400 m diameter, limestone collapsed cavern lake to the east of Discovery Bay, Jamaica. Little to no investigation or research has been performed on the lake. Water samples were collected on two occasions from the surface to a depth of 31.1 m. The lake was found to be extremely stratified in terms of temperature and salinity. Surface waters were warm and fresh (29.8°C, 2.5 ppt). Salinity and temperature declined quickly to about 5 m. A zone of maximum salin- ity and higher temperature was evident between about 9 and 18 m. Beyond this zone salinity and temperature drop as fresh cool spring water rising from the bottom of the lake mixes with intrusive seawater. KEYWORDS: Crater Lake, Discovery Bay, temperature, salinity INTRODUCTION JAMAICA is part of the Greater Antilles island chain, located in the central Caribbean Sea. It lies about 200 km south of Cuba, 900 km north of Columbia, 1100 km east of the Yucatan Peninsula, and 400 km west of Haiti. The Cayman Trench lies about 100 km to the north, and runs east, west. The trench has a maximum depth of 7,686 m. Jamaica lies on the Enriquillo-Plantain Garden fault zone, on the border between the North American and Carib- bean plates. Most of the island is made up of limestone from the Tertiary period. On the north coast, this limestone is topped with Pleistocene reef deposits (Gayle and Woodley 1998). The mountains of Jamaica are over 2000 m high. The cli- mate is tropical/subtropical. Jamaica experiences mixed tides; spring tides tend to be diurnal, while neap tides are predominantly semi-diurnal (Gayle and Woodley 1998). Crater Lake is a collapsed cavern lake, located on the north, west-central side of Jamaica. This lake has also been referred to by the names of St. George’s Lake and Hopewell Pond (from here on referred to as Crater Lake). It is 4 km east from the Discovery Bay Marine Lab, and less than 1 km from the ocean. The diameter of the lake ranges from 350 m to 470 m. Crater Lake is reported to be about 60 m deep. The lake is encircled by mangrove trees, and is filled with groundwater from rainfall that falls over the northern half of the mountains and funnels down into the lake (Day 1976). The ocean is potentially another water source for lake, thought to cause haline stratification. As rain falls it absorbs carbon dioxide from the atmos- phere, and more as it passes through soil. This process turns the groundwater into a weak form of carbonic acid. When this acid comes in contact with limestone, it slowly chemi- cally erodes the stone. As the eroded areas grow, mechani- cal erosion of the increasing amount of ground water adds to the process. This process over time creates large under- ground networks of caves and caverns in limestone. When a large cavern nears the surface, the weight of the top roof section of the cavern can become too heavy for the walls to support. When this happens the roof may collapse, and a collapsed-cavern lake is formed. In the exploration of Crater Lake, the objectives to be addressed were: What was the temperature range of the lake? What was the salinity range of the lake? Was there a halocline and if so, what was its depth? Did the salinity and/or halocline vary tidally? What were the predominant organisms living in the lake? What was the level of dis- solved oxygen at different depths in the lake? METHODS The site studied was Crater Lake (also referred to as St. George’s Lake/Hopewell Pond). Crater Lake was located on the north, west-central coast of Jamaica. The lake was 4 km east of Discovery Bay, and 1 km south from the Carib- bean Sea. The lake was formed from a collapsed cavern, and is connected to surrounding cave systems, including Green Grotto caves. The lake also is believed to be con- nected to the Caribbean Sea, causing it to be partially sa- line. Water samples were collected from Crater Lake on two occasions. Plastic sample bottles with numbered caps were used to collect water samples at depth. The bottles were flooded at the surface. When the target depth for each wa- ter sample was reached, the bottle was inverted and filled with air from a backup regulator, then turned right side up, allowed to fill with water and was capped. The number on the cap, depth, and temperature from a mercury thermome- This research was conducted as part of Coastal Carolina Universi- ty’s classes MSCI 477, Ecology of Coral Reefs, and MSCI 499, Directed Undergraduate Research in Discovery Bay, Jamaica. 14– –31 May 2014. Contact e-mail: ajkammere@coastal.edu 39
  • 50.
    ter were allrecorded on a dive slate. On the first sampling occasion, temperature values were taken from a dive com- puter and were found to be less accurate than those taken with the mercury thermometer on the second sampling oc- casion. To obtain salinity values and dissolved oxygen values, a YSI unit was used to analyze water samples from varying depths immediately upon return to the surface. These val- ues were recorded along with the depth of the sample and ambient water temperature. The collected data was then plotted and analyzed. Biota in the lake was determined by observation, photo- graphs, and sample collection. RESULTS Crater Lake was surrounded by red mangroves (Rhizophra mangle). The prop roots of these trees have created a peat overhang around the circumference of the lake. The overhang begins at the surface and extends to a depth of 3–5 m. The substrate along the shallower perime- ter of the lake is very soft, fine-grained sediment composed of detritus and leaf litter. Fallen trees were observed fre- quently around the edge of the lake. The substrate slopes down sharply from approximately 5 to 25 m. At about 25 m the slope levels out and the substrate transitions from soft sediment to large, boulder sized limestone rubble. The depth of the lake is reported to be 56 m. The maximum depth reached while diving was 31.1 m due to SCUBA and light restrictions. The slope of bottom at that depth had become significantly less drastic. Mangrove prop roots and fallen trees were encrusted with bivalve and sponge communities. The primary bivalve present was identified to be Brachidontes exustus (Linneaus, 1758) (Webber 2009). Communities of small grass shrimp, crayfish, minnows, and hydrozoans surround- ed the prop root and fallen tree structure. Surface waters were the warmest at 29.8°C. From the surface to a depth of 6.1 m the water temperature drops to 25.1°C. From approximately 5 m to 12 m the temperature is consistent at 25°C. Beyond 12 m the temperature in- creases to 25.2°C and remains constant to the maximum sampled depth of 31.1 m (Figure 1). Salinity at the surface was the freshest at 2.5 ppt. From the surface to a depth of 9.1 m the salinity changes rapidly from 2.5 ppt to 18.3 ppt. From 9.1 m to 18 m salinity was greatest at 18 ppt. From 18 m to 31.1 m the salinity dropped from 18 ppt to 16.8 ppt (Figure 2). The density increased sharply from the surface to 9.1 m. From 9.1 to 18 m the density remained constant, and then decreased to 31.1 m (Figure 3). The deeper portion of the water column beyond 18 m had a negative stability value. Above 18 m the stability was positive (Figure 4). The lake water was highly stratified. Surface water was relatively clear, with visibility of about 4.5 m. Between approximately 6 and 10 m a sulfide layer was present. White precipitant was coming out of suspension in the wa- ter column. Visibility in this layer was limited to about 1 to 2 m. Above this white precipitant layer was a coffee col- ored film layer. Beyond the precipitate layer water clarity improved to approximately 10 m. DISCUSSION Land runoff and precipitation caused a higher concen- tration of freshwater at the surface. The surface water was Figure 1. Temperature values plotted over depth from the 5/27 sampling. These temperature values were recorded with a mercu- ry thermometer and were more actuate than those taken from the dive computer on the 5/21 sampling. Figure 2. Salinity profile from both samples (5/21 and 5/27). KAMMERER: CRATER LAKE PROFILE40
  • 51.
    warmest from solarheating. Salt-water intrusion presumably from the Caribbean Sea causes increasing salinity with depth. However, fresh groundwater intrusion in the deeper part of the lake causes the mixing of fresh and seawater. Mixing fresh and salt- water cause the salinity to decrease in the deeper areas of the lake. Mixed water masses have a higher density than the original two water masses. The higher density water masses sink, encouraging the mixing of fresh and salt water in the deeper areas of the lake. Freshwater springs mixing with seawater accounts for the salinity and density profiles observed in the water sampling (Figures 3 and 4). Water from the surrounding hills has been traced and shown to appear in the lake (Day 1976). The benthic slope and topography supports the develop- mental theory that the lake originated from a collapsed cav- ern. The boulder sized limestone rubble observed on the deeper substrate is most likely prevalent throughout the lake, but has been covered by detritus and sediment in the shallower areas and slope of the lake. If cores were to be taken through the benthic sediment in the shallow areas of the lake it can be predicted that limestone rubble consistent Figure 3. Density profile from the 5/27 sample. Density values were calculated from temperature, salinity, and depth (in lieu of pressure 1 m ≈ 1 dbar). Figure 4. Stability profile with depth. Stability values were cal- culated from change in salinity with respect to change in depth. with that observed in the deeper areas would be discovered. Large boulder rubble is consistent with previous research describing collapsed caverns (Sweeting 1950). The white precipitate layer is thought to be sulfides pre- cipitating out of suspension. The brown film floating on the sulfide layer is believed to be a film of detritus, which is not able to sink due to the sulfide layer having greater den- sity. Decreasing mid-water temperature could be the cause of the precipitation of the sulfides in that layer. Future researchers could chemically analyze the differ- ent layers in the lake and determine the exact sulfide in suspension, and its cause. They could also pursue deeper water samples and a more thorough determination of ba- thymetry. Also cores could be taken around the lake to de- termine the depth a contents of the sediment around the lake, and determine if there is underlying limestone rubble. ACKNOWLEDGMENTS I would like to thank E Burge and S Luff for their assis- tance in data collection and diving at the lake, Teddy for his guidance in diving the lake, D Scarlett and Shika for trans- portation from the Marine Lab to the lake, and the entire Marine Lab staff for their day to day help. LITERATURE CITED Day M. 1976. The morphology and hydrology of some Jamaican karst depressions. Earth Surf Proc. 1: 111-126. D’Elia CF, Webb KL, Porter JW. 1981. Nitrate-rich groundwater inputs to Discovery Bay, Jamaica: A significant Source of N to Local Coral Reefs? Bull Mar Sci. 31(4): 903-910. Gayle PMH, Woodley JD. 1998. Discovery Bay, Jamai- ca. In: Kjerfve B, editor. CARICOMP - Caribbean coral reef, seagrass and mangrove sites. Paris: UNESCO. p. 17- 33. Goodfriend GA, Mitterer RM. 1993. A 45,000-yr record of a trop- ical lowland biota: The land snail fauna from cave sediments at Coco Ree, Jamaica. Geol Soc Am Bull. 105:18-29. Kornicker LS, Iliffe TM. 1992. Ostracoda (Halocypridina, Clado- copina) from anchialine caves in Jamaica, West Indies. Smithson Contrib Zool. 530: 32 p. Maddocks RF, Iliffe TM. 1993. Thalassocypridine ostracoda from anchialine habitats of Jamaica. J Crustacean Biol. 13:142- 164. Mitchell SF, Miller DJ, Maharaj R. 2003. Field guide to the geol- ogy and geomorphology of the Tertiary limestones of the Central Inlier and Cockpit Country. Caribb J Earth Sci. 37: 39-48. Peck SB. 1975. The invertebrate fauna of tropical American caves, Part III: Jamaica, an introduction. Int J Speleol. 7: 303-326. Sweeting M. 1950. Erosion cycles and limestone caverns in the Ingleborough District. Geogr J. 115: 63-78. Webber M. 2009. Biodiversity of Jamaican mangrove Areas. 7: Mangrove BiotypesVI:Common fauna. Environ F Jamaica. KORALLION. VOL 5. 2014 41
  • 52.
    Appendix 1. Bivalveand sponge encrusted fallen tree limb. Appendix 2. Hydrozoan common in the shallower areas of the lake. The bell was approximately 3-5 cm across. Appendix 3. Sample of bivalves and sponges taken. Appendix 4. Schools of small grass shrimp and minnows congre- gated near fallen tree structure. APPENDICES Appendix 5. Sulfide precipitate layer with thin, coffee colored film above KAMMERER: CRATER LAKE PROFILE42
  • 53.
    KORALLION. VOL 5.2014 NET MOVEMENT RATES OF ACANTHOPLEURA GRANULATA WHEN SHELTER AND FOOD ARE PRESENT WITHIN THE HABITAT Caitlin B. Raynor Department of Marine Science, Coastal Carolina University, PO Box 261954, Conway, SC 29526 ABSTRACT Acanthopleura granulata are intertidal molluscs that live on rocky substrates of many coastal environments; especially the Caribbean. Individual net movement rates of 52 chitons (A. granulata) were measured over a 14 day period within the rocky intertidal zone of Discovery Bay Marine Laboratory, Jamaica. Measurements of weight and length were taken, and length was used when comparing the net movement rate versus the size of each individual. The objectives of the study were to (1) find a significant difference or correlation of net movement rates towards food and shelter (rock) with respect to the size of A. granulata in the experimental group, and (2) a correlation between the size of A. granulata and their rate of movement. Although this was new research for the Discovery Bay area, there was not a significant difference when the size of the individual was compared to the net movement distance (p = 0.317) when observed in field locations. Size and net movement rates were unable to be supported by the data (p = 0.285) in either of the experimental trials. KEYWORDS: West Indian fuzzy chiton, Acanthopleura granulata, intertidal molluscs INTRODUCTION CHITONS (class Polyplacophora), are marine intertidal and subtidal molluscs. These organisms live in cold, warm and tropical waters on substrate, underneath boulders (Grayson and Chapman 2004), or in crevices of rocky shores. Acanthopleura granulata (Gmelin, 1791) common- ly known as the West Indian fuzzy chiton are extremely abundant in the Caribbean especially in Jamaica (Humann et al. 2012). Chitons have an external, dorsal shell with eight separate plates. The plates are able to overlap and articulate well with one another which create a protection barrier for the chiton’s soft underside. This underside con- nects to the external shell and has a skirt or girdle used for locomotion and is covered in short coarse hair-like spines that give it the fuzzy appearance. Since the plates of the shell can overlap and expand, the chiton is flexible and able to easily move through the littoral zone. It can slowly curl into a ball for protection; the ability to curl into a ball when disturbed allows them to hide in unlikely places from pred- ators and their shell acts as a shield to protect their fleshy snail-like underside. The plates are brown in color when not eroded or encrusted (Humann et al. 2012), this camou- flage is another defense. Chitons are typically very slow movers and adhere to their habitat and the substrate to appear to be a part of the rock as a fossil. The chitons leave behind a mucus trail from their muscular underside, used as a foot, which allows them to adhere to the rock and keeps them in place during tidal changes in turbulent environments and protects them against predation. Chitons burrow into hollows within the rock that they occupy which in turn protects them from their main preda- tor; the toad fish (Chelazzi et al. 1983a). Acanthopleura granulata is known to move in a ranging pattern; they me- ander while feeding and have no long term resting site preferences, but the movement could be based on kinetic responses, and not because of random movement, which allow a long-term permanence within their habitat distribu- tion (Chelazzi et al. 1988). However, the resting areas for chitons are extremely important to their lifestyle within inter- and subtidal ranges. Another reason they create a resting area within the hollow or scar in the rock has been suggested to reduce water loss during low tide (Chelazzi et al. 1983b). They do not have eyes, but have sensory organs that help them determine where they are in the intertidal area. Typically, A. granulata have a high energy cost to loco- motion ratio and very slow speed; they adopt an “isopatial” tactic which causes them to stay in crevices or narrow areas along the intertidal while alternating air and water exposure during tide changes (Chelazzi et al. 1988) since they do not experience vertical orientation within the intertidal unlike other chitons, Acanthopleura gemmata (Blainville, 1825) and Acanthopleura brevispinosa (Sowerby II, 1840) (Focardi and Chelazzi 1990). Acanthopleura granulata are nocturnal feeders and are known to graze primarily on macroalgae. Tidal regimes do not affect chitons because sea spray and splashes during low tide stops them from losing water (Focardi and Chelaz- zi 1990). This also affects their eating activity which is This research was conducted as part of Coastal Carolina Universi- ty’s classes MSCI 477, Ecology of Coral Reefs, and MSCI 499, Directed Undergraduate Research in Discovery Bay, Jamaica. 14– –31 May 2014. Contact e-mail: cbraynor@coastal.edu 43
  • 54.
    limited to whenthe habitat is suitable for grazing (Chelazzi et al. 1988). When chitons eat they use their radula to pull the algae off the limestone substrate and deliver the food to its mouth. Behavioral studies of chitons have been reported over the past 95 years (Chelazzi et al. 1983a). These previous studies also examine movement patterns, competition for habitat, homing behaviors, aggressive behaviors in relation to habitat space, orientation mechanisms, and patterns in distribution and abundance along the study areas. These can all contribute to a chiton’s net movement rate within its habitat and may be examined if found significant to the current study. Other movement activity can be based on changes in the tides, food availability, and habitat availabil- ity or competition. If their habitat is compromised they will find a new resting area so they do not suffer from water loss during low tides. Food availability is a main factor for reasons why many organisms will relocate themselves. The current study determined if there were significant differences in net movement rates of A. granulata. The objective(s) of this study were to determine: (1) Was there a significant difference or correlation of net movement rates towards food and shelter with respect to the size of A. granulata in the experimental group? (2) Was there a corre- lation between the size of A. granulata and their rate of movement? For the current study, it was the hypothesized that if a chiton is larger in size and weight it would have a higher net movement rate when food and shelter were placed in the aquarium and that the larger chitons would have a high- er net movement rate during field observations. METHODS The study was conducted in the littoral zone of a jetty area at the Discovery Bay Marine Laboratory, Jamaica, West Indies for a 10 day period in May 2014. The rocky coastline studied was formed by limestone rock from uplift- ed fossil reef in the Jamaican northern coast (Therriault and Kolasa 1999). In total, 52 chitons were observed, and size, weight, and net movement rate within Discovery Bay were recorded. There were two separate groups during this study; an observation or field group and an experimental group. Different groups of chitons ranging from 20.0–90.0 mm in length were haphazardly removed from the limestone rock and taken back to the lab for measurement. Since chi- tons are difficult to remove from the substrate, the blunt flathead end of a dive knife was used to release their strong suctioning underside from the rock. The knife was wedged in between the rock and the chiton then the butt of the knife was hit to remove the chiton as gently as possible. The or- ganisms were measured using calipers to the nearest hun- dredth of a mm and the weight was taken with a scale to the nearest tenth of a g then tagged with numbers by nail polish. To determine if there was a significant difference be- tween size and net movement when food and shelter is pre- sent, a total of 20 chitons were collected and put into two separate trials of five chitons per the two trials in respective aquariums and used for the experimental group. One aquar- ium had only 2 mm high of saltwater and the second tank had 2 mm of saltwater plus rocks which they were found on originally at the end of the tank which represent food and shelter for the chitons. Each chitons length and weight was recorded. Once collected and measured, the chitons were numbered with waterproof paint and placed into an aquari- um as an acclimation and starvation period for six hours. After the acclimation period, each group was placed into respective aquariums and was given at least another six hours for movement. After the first six hours, the chitons net movement was measured in meters from their starting point to where they were in the tank at the end of the six hours. The group was then released back to the jetty and a new group was collected. The field group was examined within two different sec- tions of the jetty. A total of 32 chitons were collected and three separate trials were conducted within the jetty. The field group was collected during low tide with the same dive knife method. Once collected, the chitons were taken to the wet lab, measured and tagged the same as the experi- mental group, but were immediately placed back in their natural habitat. The rock which they were placed on was marked for each individuals starting point. The field group was given at least 12 hours to acclimate and the net move- ment was measured during the next diurnal low tide. To determine a relationship between A. granulata size and weight to their net movement rate the data was run through a single factor ANOVA. RESULTS From this study, of the 52 A. granulata (20 experi- mental and 32 field specimens) collected, only 47 were included in the data analysis. Of the field group, five chi- tons were not able to be relocated after tagging and replace- ment to their habitat. Of those 47 organisms, there was a positive correlation when weight and length were com- pared; the 20 organisms for the experimental group and of the field group of 32 chitons were combined to give a R2 value of 0.9055 (Figure 1). Since there was a positive cor- relation, the length was used when determining net move- ment rates of the chitons for further data analysis. Of the experimental group, the smallest individual was 28.00 mm and 2.3 g and the largest was 73.30 mm and 40.4 g. The field group’s smallest chiton was 20.21 mm and 1.1 g and the largest was 84.89 mm and 41.9 g. Although five of the field group chitons could not be relocated for net move- ment analysis, the individual’s weight and length were still included in the weight versus length analysis. When the two experimental trials measurements of net movement and length were compared, trial 1 with rock RAYNOR: ACANTHOPLEURA GRANULATA NET MOVEMENT44
  • 55.
    (shelter/food) inside theaquarium gave an R2 value of 0.030 and trial 2 without rock (no shelter/food) had an R2 value of 0.038. A single factor ANOVA compared the net movement rates of the chitons when rock was in the aquari- um versus the aquarium with no rock and it was found to have a no significant difference (p = 0.258). Within the field group, there was also no significant difference (p = 0.317) when a regression was done of the length of A. granulata versus the net movement distance which is con- sistent with the variance values (R2 ) of 0.04 (Figure 2). DISCUSSION This study found that the presence of shelter and food did not determine the chiton’s net movement within the aquarium. From both the field and experimental groups, a significant difference was not found with respect to net movement rates based on size. Since there were no signifi- cant differences of the A. granulata size versus net move- KORALLION VOL 5. 2014 ment rates, it is concluded that there is no preference or determination of the chitons movement based on food or shelter. However, since chitons migrate as they are noctur- nal feeders (Focardi and Chelazzi 1990) this could be a factor that determines their net movement rates to be signif- icant when grazing. Some reasons why there was not a significant difference could be because there was not a con- tinuous time interval for checking the individuals move- ment, the number of individuals collected was small which meant fewer trials, and the organisms may have been too stressed or injured to move as typically seen in the habitat. For future studies, other methods for tagging and col- lecting the individuals may be used. Chelazzi et al. (1983) used computerized screening processes to mark and register the position and changes to individual home activity. With more time intervals to check their movement, the loss of the organisms may be fewer than was seen in the field group and a uniform movement rate maybe be used instead of a net movement from the starting point to the observed resting point. Future studies can examine larger collection numbers, differences in food preferences, population densi- ties, and tidal migrations within different sampling loca- tions in Discovery Bay. Eating preferences have been pre- viously examined based on their gut content to determine different feeding categories (Latyshev et al. 2004) but were only found for other genera of chitons, not Acanthopleura. Chitons are also known to feed not only on algae substanc- es, but on diatoms, foraminiferans, red calcareous algae, and other macrophytes (Latyshev et al. 2004). Some studies (Littler et al. 1995) suggest that there is a chiton to coralline alga association that contributes to the build-up of the reef itself. However, it has been determined (Littler et al. 1995) that if macroalgae regenerate quickly along and are typical- ly nutritionally poor, large and well-defended, then there will be a stable coexistence between chitons and their main food resource. This is an important factor to examine for future studies within Discovery Bay because chitons have been known to have negative impacts on the habitat due to their grazing habits (Littler and Littler 1985). There was another species of chiton found along with A. granulata and for future studies; these other species net movement rates could be compared to the other chiton in the area, Chiton viridis (Spengler, 1797). This comparison can be used for further research in attempt to determine a significant difference between the species net movement and grazing times or habits. There may be competition for space or food availability between the two species which may cause a shift in A. granulata diet and spatial distribu- tion. For A. granulata tide cycles do not determine its feed- ing cycles since they live in a narrow area and do not expe- rience large tidal migrations (Focardi and Chelazzi 1990) but that they do graze nocturnally. In the future, other stud- ies can examine the differences of net movement and graz- ing habits based on the different rocky zones found throughout Discovery Bay. Also found in Discovery Bay, were habitats occupied by A. granulata and C. viridis that Figure 2. Individual chitons were compared to determine if there was a significant difference between of length versus net move- ment during 12-hour trials. However, despite various sizes there was no significant difference (p = 0.317). Figure 1. Length-weight relationship between chitons of the field group (black) and experimental group (gray). Since there was a positive correlation, the length measurement was used when test- ing the relationship of net movement rate through data analysis. 45
  • 56.
    RAYNOR: ACANTHOPLEURA GRANULATANET MOVEMENT were extremely different. This study did not examine those habitats due to time constraints; however future studies of net movement rates of those individuals based on tidal changes or the vertical incline of the rock (habitat) may prove to be significant. ACKNOWLEDGMENTS I wish to thank the Discovery Bay Marine Laboratory for contributing their equipment, wet lab, housing and car- ing for my classmates and me during our stay. Also to O Holder for discovering how to remove A. granulata from the substrate with the dive knife which made this study possible. Thank you to my classmates and Dive Master S Luff for this a wonderful and memorable trip. I would also like to thank M Sporre for reviewing this paper for publica- tion. Lastly I would like to thank E Burge for his support and advice throughout the study and for granting me the opportunity to conduct my first individual scientific study while in Jamaica. LITERATURE CITED Chelazzi G, Focardi S, Deneubourg JL, Innocenti R. 1983a. Com- petition for the home and aggressive behaviour in the chiton Acanthopleura gemmata (Blainville) (Mollusca: Poly- placophora). Behav Ecol Sociobiol. 14(1): 15-20. Chelazzi G, Focardi S, Deneubourg JL. 1983b. A comparative study on the movement patterns of two sympatric tropical chitons (Mollusca: Polyplacophora). Mar Biol. 74(2): 115- 125. Chelazzi G, Focardi S, Deneubourg JL. 1988. Analysis of move- ment patterns and orientation mechanisms in intertidal chitons and gastropods. Behavioral Adaptation to Intertidal Life, Book 151. Springer US. p. 173-184. Focardi S, Chelazzi G. 1990. Ecological determinants of bioeco- nomics in three intertidal chitons (Acanthopleura spp.). J Anim Ecol. 59: 347-362. Grayson JE, Chapman MG. 2004. Patterns of distribution and abundance of chitons of the genus Ischnochiton in intertidal boulder fields. Austral Ecol. 29(4): 363-373. Humann, P, DeLoach N, Wilk, L. 1992. Reef Creature Identifica- tion: Florida Caribbean Bahamas. New World Publications, Inc. 3rd Edition p. 246. Latyshev NA, Khardin, AS, Kasyanov, SP, Ivanova, MB. 2004. A study on the feeding ecology of chitons using analysis of gut contents and fatty acid markers. J Mollus Stud. 70(3): 225- 230. Littler MM, Littler, DS. 1984. Models of tropical reef biogenesis: The contribution of algae. Prog Phyc Res. 3: 323-355. Littler MM, Littler DS, Taylor, PR. 1995. Selective herbivore increases biomass of its prey: A chiton-coralline reef-building association. Ecology. 1666-1681. Rasmussen KA, Frankenberg EW. 1990. Intertidal bioerosion by the chiton Acanthopleura granulata; San Salvador, Bahamas. Bull Mar Sci. 47(3): 680-695. Therriault, TW, Kolasa, J. 1999. Physical determinants of rich- ness, diversity, evenness and abundance in natural aquatic microcosms. Hydrobiologia. 412: 123-130. 46
  • 57.
    KORALLION. VOL 5.2014 DISTRIBUTION, LENGTH-WEIGHT RELATIONSHIP, BURROWING RATES, SIZE FREQUENCY, AND COLORATION FREQUENCY OF DONAX DENTICULATUS IN DISCOVERY BAY, JAMAICA Megan A. Sporre Department of Marine Science, Coastal Carolina University, PO Box 261954, Conway, SC 29526 ABSTRACT Donax denticulatus is an intertidal beach clam that is widely dispersed throughout the Caribbean and found primarily burrowed in saturated beach sand. Puerto Seco Beach is a small, sandy beach located in the southeastern corner of Discov- ery Bay, Jamaica. The objectives of this study were to determine the distribution, calculate an estimate of population size, determine size and color frequency of the population, and determine differences in burrowing rates of clams based on size. In total, 553 D. denticulatus were collected along two, 8 m transects, measure, weighed, and identified by color. The bur- rowing speed and length of a separate 100 clams was also collected. The population of D. denticulatus was most dense within the swash zone, size frequency results show two distinct generations, the most frequent shell colors were white or cryptic in a sandy habitat, and burrowing speed increased as length of the clam increased. KEYWORDS: Population, allometric relationship, beach clam, Puerto Seco Beach INTRODUCTION DONAX DENTICULATUS (Linnaeus, 1758) is a small beach clam that inhabits the intertidal zone of sandy beaches in the West Indies (McClachlan et al. 1996). They are found in the highest densities within the saturated sands of the swash zone (Wade 1967, Jarosinski 2013). When D. denticulatus are found in the unsaturated zones of the beach, it is usually smaller individuals (McClachlan et al. 1996). Densities of this beach clam have varied between 10 and 4120 clams m-1 across 22 beaches in Jamaica (Wade 1967). Discovery Bay, Jamaica is nearly cut off from the open ocean by a fringing reef on both sides of the basin. The entrance to the bay is used as a shipping channel and is routinely dredged (Gayle and Woodley 1998). While the shoreline is mostly limestone rock, a sandy beach is located in the southeastern corner of the bay. This 400-ft stretch of beach is called Puerto Seco Beach (Gayle and Woodley 1998). The beach habitat is controlled by three factors: tides, wave action, and sand (Defeo and McLachlan 2005). Donax denticulatus thrive in sands of medium coarseness where their muscular foot can anchor most successfully; they also prefer sands of low organic content (Wade 1964). Beach clams must also inhabit beaches that are exposed to the open ocean as they use wave action and tides to main- tain their distribution within the swash (Wade 1964). To This research was conducted as part of Coastal Carolina Universi- ty’s classes MSCI 477, Ecology of Coral Reefs, and MSCI 499, Directed Undergraduate Research in Discovery Bay, Jamaica. 14 – 31 May 2014. Contact e-mail: masporre@coastal.edu maintain their positioning, these clams migrate with the tides; riding the waves up shore and then burrowing within the sand using their two siphons and muscular foot to keep from being drawn down the beach by receding waves (Wade 1969). There are many different color morphs of D. denticula- tus; variety is population dependent. Wade (1967) found that beach clam populations at Puerto Seco were dominated by white clams. Smith (1975) found that Donax faba (Gmelin, 1791) with the most disruptive coloration (darker or brighter colors) were preyed on more heavily when pop- ulation density is high, while more cryptic color morphs (light, sand colored clams) are preyed upon when the popu- lation density is low. Mikkelsen (1978) proposed a similar hypothesis of reflexive selection by predators to variation in shell color frequency; rarer color morphs may be preyed upon less because they are harder to find when there are many more clams of different colors on the beach. Donax denticulatus bury themselves within the sand, leaving just their siphons exposed at the surface to filter feed (Wade 1969). These clams can survive for up to three days in drying sand before dying (Wade 1967). The bur- rowing behavior allows D. denticulatus to escape predation while still being able to filter feed (Wade 1967). Trueman (1971) found that the average burrowing time of D. dentic- ulatus was between five and six seconds. The purpose of this research was to determine the distri- bution of D. denticulatus on Puerto Seco beach, the size and coloration frequency of the beach clam population, the allometric relationship between length and weight, and the relationship between size and burrowing rate. 47
  • 58.
    METHODS Donax denticulatus werecollected from Puerto Seco beach on the southeastern side of Discovery Bay, Jamaica on May 25th and 26th during a flooding tide. Two eight meter transects were laid from the berm zone to the swash zone. At the time of sampling approximately 50% of the transect was considered to be the berm zone, 25% the swash, zone and 25% the surf zone. Ten samples per zone were haphazardly collected using a 16 cm diameter cylin- der. The collected sand was sieved through 2 mm mesh and remaining clams were taken. In total, 553 D. denticulatus were collected. The number of clams per sample were counted and nor- malized with respect to area (clams per m2 ). Each clam was measured at its longest width to the nearest tenth of a mm using a Vernier caliper and weighed to the nearest ten- thousandth of a gram using an analytical scale. Coloration of each clam was determined using methods from Mikkel- sen (1974) and grouped into one of six predetermined cate- gories: white, pale yellow, light purple, amber, black, or rayed (Figure 1). Clams were placed in the rayed category based solely on presence of rays; ray coloration and base color were not taken into account. Burrowing rates of D. denticulatus were calculated by haphazardly selecting 100 clams from actively moving clams on the beach. They were timed using hand-held stop watches to the nearest on hundredth of a second from their first movement until they were completely submerged in the sand. After completely burrowing, the clams were re- moved from the sand and measured using Vernier calipers to the nearest tenth of a mm at their longest width. Clams were arbitrarily grouped into three size categories, small (8.0–11.0 mm), medium (11.1–14.0 mm), and large (14.1– 17.1 mm) based on length. Single factor ANOVAs were run on density data, color and size data, and zonation and size data. Chi Square tests were performed on size frequency, color frequency, and density. A line of best fit for a power function was deter- mined for the allometric relationship between length and weight. There was a significant difference between the sizes of D. denticulatus found in each zone (ANOVA, p < 0.01). The berm zone had the longest average length and the surf zone had the shortest average length, 12.72 mm ± 1.4 and 10.56 mm ± 2.6, respectively (Figure 3). The sizes of clams measured ranged from 4 mm to 15.5 mm, the median size was 12.2 mm, and the average length was 11.4 mm ± 2.3 (mean ± standard deviation). The histo- gram of size frequencies shows a major peak between the sizes of 11 mm and 13.99 mm and a minor peak between the sizes of 7 mm and 9.99 mm (Figure 4). Thirty-one per- cent of the population was between 12.0 and 12.99 mm. The distribution of sizes varies significantly from a random distribution (Chi Square, df = 12, p < 0.01). There is a strong power function or growth curve rela- tionship between length and weight of D. denticulatus (r2 = 0.987, y = 0.0002x3.020 ) (Figure 5). The heaviest clam was 0.8053 g and 15.3 mm long while the lightest clam was 0.0150 g and 4.0 mm. The average weight was 0.3534 g ± 0.1705. Figure 1. Donax denticulatus representing the six different color categories. From left to right: light purple, white, pale yellow, amber, black, and two different polymorphs considered to be in the rayed category. Figure 2. Densities per m2 of D. denticulatus in the three different beach zones. There is a significant difference in densities (ANOVA, p < 0.01). The densities are not randomly distributed (Chi Square, df = 2, p < 0.01) RESULTS There was a significant difference in the densities of D. denticulatus between the berm, swash, and surf zones (ANOVA, p < 0.001). The highest amounts of clams per m2 were found in the swash zone, approximately 2,268 clams per m2 (Figure 2). There density of clams in the swash zone were over ten times greater than those found in the berm zone and over eight times greater than the number of clams found in the surf zone. The distribution of clams varies significantly from a random distribution (Chi Square, df = 2, p < 0.01). SPORRE: BEACH CLAM MORPHOLOGY AND DISTRIBUTION48
  • 59.
    KORALLION. VOL 5.2014 Almost half of the clams collected were white, the rarest color polymorph (2%) was black (Figure 6). The distribu- tion of color polymorphs is highly skewed (Chi Square, df = 5, p < 0.001). There was a significant difference between the lengths of the different colors (ANOVA, p < 0.01) (Figure 7). Black clams had the shortest average length, 8.95 mm ± 3.48, while light purple clams had the longest average length 11.69 mm ±1.98. Figure 3. Average length of D. denticulatus found in the three different zones of the beach. There is a significant difference be- tween lengths in the three zones (ANOVA, p < 0.01). Figure 4. Size frequency histogram for the distribution of sizes of the D. denticulatus population at Puerto Seco beach. The distribu- tion is significantly different than random (Chi Square, df = 12, p < 0.01) Figure 5. Growth curve relationship between length and weight of D. denticulatus. There is a strong power function relationship (r2 = 0.987, y = 0.0002x3.020 ). Figure 6. Frequency of coloration for the population of D. dentic- ulatus. The distribution differs significantly from random (Chi Square, df = 5, p < 0.001). There was a significant difference between the burrow- ing rates of small, medium, and large clams (ANOVA, p< 0.001). On average small clams burrowed 1.8 times faster than large clams (Figure 8). There is a weak positive corre- lation between burrowing speed and length (r2 = 0.2011 y = 0.0.2576x + 0.0189) (Figure 9) DISCUSSION The population of D. denticulatus at Puerto Seco Beach Figure 7. Average length for clams in each size category. There is a significant difference between lengths of each color (ANOVA, p < 0.01). 49
  • 60.
    is found primarilyin the swash zone with very low densi- ties in both the surf and berm zones. This supports work done by both Jarosinski (2013) and Wade (1967). Donax denticulatus require the wave action that occurs in the swash zone to keep the water aerated and keep organic de- tritus suspended (Wade 1967). Based on the densities of clams found by Wade (1967) of up to 4120 clams m-2 , the population at Puerto Seco, approximately 2268 clams m-2 , could be considered a small to medium sized population. Fine grain size of the beach may be a factor in deterring a large population from forming at Puerto Seco. If the sand is too fine, it will be too closely packed for the clam to be able to burrow successfully, larger grain sizes also nega- tively impact the burrowing success of these clams (Wade 1964). The optimal grain size for burrowing is between a Figure 8. There is a significant difference in the burrowing times of small, medium, and large D. denticulatus (ANOVA, p < 0.01). Figure 9. There is a weak positive correlation between length and burrowing rate (r2 = 0.2011, y = 0.2576x + 0.0189). grain sorting index of 0.2 and 0.4 (Wade 1964). When D. denticulatus is not buried in the sand it will be exposed to higher predation stress from shore birds and crabs (Wade 1967). Clams found in the berm zone were larger than clams found in both the swash and surf zones and the average size of the clams decreased down the beach. These results disa- gree with McClachlan et al. (1996) and Jarosinski (2013) who both found that smaller individuals inhabit the berm zone. The low sample size of small clams in all zones could be a reason for the variation in results. Strong flood tides may be bringing larger clams up the beach, while weaker receding tides may be unable to carry these heavier clams back down shore, leaving them stranded in the berm. The size frequency distribution indicated that there are two distinct generations of D. denticulatus within the popu- lation at Puerto Seco. The parent generation ranges be- tween 11 and 14.99 mm while their offspring generation ranges between 7 and 9.99 mm. Reproduction for D. den- ticulatus occurs as mass spawning and peaks in the months of November, December, and January (Wade 1968). Most clams do not survive through the first year (Wade 1968). With maximum growth rates that reach 2.5 to 3.0 mm a month dependent on biotic and abiotic factors (Wade 1968), the parent generation may very well be from spawn- ing events occurring from 2012–2013 while the offspring generation may have arisen due to spawning occurring from 2013–2014. McClachlan et al. (1996) found distinct juvenile cohorts from 8–9 mm during their study of D. den- ticulatus as well as reduced recruits and spat (clams less than 4.0 mm) from January to June. Reduced spawning rates in April and May (Wade 1968) can also be attributed to the small sample size of smaller clams. Future studies focusing on growth rates and population ecology at Puerto Seco Beach will be more useful in determining population structure, mortality, fecundity, and survivorship. There is an evident relationship between length and weight of D. denticulatus. The allometric relationship of D. denticulatus is very similar to the length-weight relation- ship of Donax cuneatus (Linnaeus, 1758) described by Na- yar (1955). Smaller sized clams accumulate mass at a slow- er rate than larger clams. For D. denticulatus growth in length will slow with age (Wade 1968), while their weight growth will increase with age. This may occur because less energy is spent increasing shell size and the clam is able to use this energy to accumulate greater mass. A larger shell also will allow for a larger muscular foot and longer si- phons. Cryptically colored (white, pale yellow, and rayed) D. denticulatus are the most common among the population at Puerto Seco. Past research on the clam population at Puerto Seco Beach has reported almost the entirety of clams to be dominated by white polymorphs (Wade 1967). Mikkelsen (1978) found that a majority of Donax variabilis (Say, 1822) were similar in color to the beach sand where their SPORRE: BEACH CLAM MORPHOLOGY AND DISTRIBUTION50
  • 61.
    KORALLION. VOL 5.2014 population was found. Multiple hypotheses on coloration within the genus Donax have been proposed (Smith 1975, Mikkelsen 1978). Donax faba with the most disruptive col- oration suffer from increased predation when population sizes are larger compared to when densities are lower; in less dense populations the predation is spread more evenly over all of the polymorphs (Smith 1975). A theory of “reflexive selection” has been proposed, stating that colors that occur in low frequencies may experience a release from predation because of the inability of predators to find them when other colors are so abundant (Mikkelsen 1978). This release from predation will allow the frequencies of these polymorphs to increase (Mikkelsen 1978). Lengths of cryptically colored clams were longer than the lengths of amber and black clams. This could be because larger and darker clams will be easier for birds and other predators to find. Future research may focus on the amino acid sequenc- es that cause the variation in coloration as well as occur- rences of color switching which has been documented to occur with the addition of new growth rings (Wade 1968). At least one example of a coloration change in a clam was observed during this study. Larger clams have slower burrowing speeds than small- er sized clams. Burrowing time of Donax serra (Röding, 1798) and Donax sordidus (Hanley, 1845) increases as the length of the clam increases (Nel et al. 2001). The burrow- ing times from this research are about one to two seconds faster than burrowing rates from Trueman (1971). Differ- ences in burrowing rate could be affected by small sample size as well as differences in sand grain size. The grain size a Puerto Seco may be more favorable to burrowing than in previous research. The weak correlation of length and bur- rowing speed may be strengthened by increased sample size. Future research may involve the burrowing rates of D. denticulatus in sand of differing grain size and continued studies of natural burrowing speeds. ACKNOWLEDGMENTS I would like to thank the Discovery Bay Marine Lab as well as the University of the West Indies for the use of their facilities and their warm hospitality. I would like to thank S Luff, D Edwards, O Holder, and D Scarlet for their help on and off the boats. I would also like to thank E Burge for his patience and help. Lastly, thanks to T Beheler, C Raynor, A Galarno, and the rest of my classmates for their help with data collection and making this experience so enjoyable. LITERATURE CITED Defoe O, McClachlan A. 2005. Patterns, processes and regulatory mechanisms in sandy beach macrofauna: A multi-scale analy- sis. Mar Ecol Prog Ser. 295:1-20. Gayle PMH, Woodley JD. 1998. Discovery Bay, Jamaica. In: Kjerfve B, editor. CARICOMP – Caribbean coral reef, seagrass, and mangrove sites. Paris: UNESCO. 17-33. Jarosinski JM. 2013. Abundance and vertical distribution of Donax denticulatus, Discovery Bay, Jamaica. Korallion. 4:6- 9. McClachlan A, Dugan JE, Defoe O, Ansell AD, Hubbard DM, Jaramillo E, Penchaszadeh PE. 1996. Beach clam fisheries. Oceano Mar Biol: Ann Rev. 34:163-232. Mikkelsen PS. 1978. A comparison of intertidal distribution, growth rates and shell polychromism between two Florida populations of the coquina clam Donax variabilis Say, 1822. Thesis. Florida Institute of Technology. 1-88. Nayar KN. 1955. Studies on the growth of the wedge clam, Donax (Latona) cuneatus Linnaeus. Ind J Fish. 2(2): 325-348. Nel R, McLachlan A, Winter DPE. 2001. The effect of grain size on the burrowing of two Donax species. J Exp Mar Biol Ecol. 265(2): 219-238. Smith DAS. 1975. Polymorphism and selective predation in Donax faba Gmelin (Bilvalvia: Tellinacea). J Exp Mar Biol Ecol. 17(2): 205-219. Trueman ER. 1971. The control of burrowing and the migratory behaviour of Donax denticulatus (Bivalvia: Tellinacea). J Zool. 165(4): 453-469. Wade, B. 1964. Notes on the ecology of Donax denticulatus (Linné). Proc Gulf Caribb Fish. 1(7): 36-42. Wade BA. 1967. Studies on the biology of the West Indian beach clam, Donax denticulatus Linné. 1. Ecology. Bull Mar Sci. 17 (1):1 49-174. Wade B. 1968. Studies on the biology of the West Indian beach clam, Donax denticulatus Linné. 2. Life History. Bull Mar Sci. 18 (4):876-901. Wade B. 1969. Studies on the biology of the West Indian beach clam, Donax denticulatus Linné. 3. Functional Morphology. Bull Mar Sci. 19(2): 306-322. 51
  • 62.
    STUDIES IN CORALREEF ECOLOGY52
  • 63.
  • 64.
    STUDIES IN CORALREEF ECOLOGY54
  • 65.
    KORALLION. VOL 5.2014 55 SHELL EXCHANGE MODELS IN CARIBBEAN HERMIT CRABS, COENOBITA CLYPEATUS: NEGOTIATOR OR AGGRESSOR D. Cristina O’Shea Department of Marine Science, Coastal Carolina University, PO Box 261954, Conway, SC 29526 ABSTRACT Shell exchange behaviors in hermit crabs consist of a pair of individuals competing for a resource and often follow one of two models. In the negotiation model, both crabs benefit from the trade and each crab attains a shell with an internal vol- ume more suited for their body size. In the aggression model, the initiator crab forces the non-initiator to abandon its shell and the exchange is only beneficial for the initiator crab. Populations of the Caribbean hermit crab, Coenobita clypeatus were observed in the laboratory and shell exchange behaviors were recorded. A total of 20 shell-related interactions were observed. Four of these interactions resulted in shell exchange following the aggression model, one resulted in shell ex- change consistent with the negotiation model, and 15 interactions did not result in shell exchange (which is a behavior that is also consistent with the negotiation model). Coenobita clypeatus favored the negotiation model. In the negotiation model, the non-initiating crab refuses to vacate because its current shell is closer to the preferred size than that of the initiating crab. In intraspecific interactions, the negotiation model is the best way to predict the outcome of shell exchange behaviors for C. clypeatus. KEYWORDS: Shell exchange, Caribbean hermit crab, exchange models, intraspecific interactions INTRODUCTION HERMIT CRABS use the abandoned shells of gastropods as their refuge. Hermit crabs require the protection of the shells in order to shield their vulnerable abdomen (Hazlett 1987) and to avoid predation, cannibalism and desiccation (Rotjan et al. 2010). According to Elwood (1995), most species of hermit crabs have morphological adaptations that allow them to live in gastropod shells in- cluding a symmetrically coiled abdomen and a pair of legs that have evolved to grasp their shell. As hermit crabs outgrow their current shells, they are forced to find an alternative shell that can accommodate their increased body size. Hermit crabs traditionally get their new shelter either by occupying an empty gastropod shell or by exchanging shells with another crab. However, since most shells are unavailable (some are buried and some are occupied by living gastropods), shell exchange becomes the primary means of new shelter acquisition (Barnes and De Grave 2000). The importance of shell acquisition as well as limita- tions in shell supply requires crabs to develop numerous mechanisms for shell selection, inspection and negotiation (Hazlett 1990). The processes of hermit crab shell selection and inspection are very specific (Garcia and Mantelatto 2001) and relate to individual and sexual preferences (Hazlett and Baron 1989). These processes are of extreme importance for hermit crabs because suitable shell features provide better protection and represent greater chances for survival (Briffa and Elwood 2005). Hermit crabs appear to select shells that are light enough to carry and also large enough to accommodate their entire body. By selecting lighter shells, crabs can keep their metabolic energy con- sumption low (Briffa and Elwood 2005). According to Barnes and De Grave (2000), there are many complex behaviors associated with the inspection and exchange of the hermit crab shells. The process of shell acquisition begins when a hermit crab locates a new shell by following chemical cues released by dead conspecifics (Thacker 1994). Hermit crabs would approach and investi- gate any shell that shows potential for utility because useful shells are not common (Hazlett 1989). Inspection and ex- change behaviors vary between species but most species tend to approach and examine a new shell using a combina- tion of their antennae, walking legs and chelipeds. It is common for hermit crabs to grasp an empty shell and insert their large claw into the operculum in order to study the interior condition of the shell (Elwood 1997). Hermit crabs use the information obtained from visual and tactile stimuli to make a decision regarding which shell they will use (Hazlett 1987). Shell exchange encounters begin with a shell-rapping period (Elwood 1999) in which the initiator crab rapidly and repeatedly hits its shell against the defender’s (non- initiator) shell in a series of bouts. The defender will react immediately by retracting into its shell and gripping the collumella with its abdomen. The initiator will continue to This research was conducted as part of Coastal Carolina Universi- ty’s classes MSCI 477, Ecology of Coral Reefs, and MSCI 499, Directed Undergraduate Research in Discovery Bay, Jamaica, 14 –31 May 2014. Contact e-mail: dcoshea@coastal.edu
  • 66.
    56 O’SHEA: SHELLEXCHANGE IN HERMIT CRABS strike its shell against the defender’s shell while pulling at the chelipeds of its contestant in an attempt to coerce the defender from the interior. The defender crab can release its abdominal grip and allow the attacker to pull its body out of the shell or it can resist the attack. According to a study conducted by Briffa and Elwood (2002), successful attack- ers rap at a higher rate and the rate of rapping is related to the crab’s size and stamina. They concluded that larger individuals rapped at a higher rate and therefore were more successful than smaller crabs. In these agonistic encounters, only one crab usually ben- efits from the exchange. However, it is possible that both crabs will find the endeavor mutually beneficial. In an ex- ample given by Briffa and Elwood (2002), a large crab liv- ing in a small shell might exchange with a smaller crab occupying a shell that is too large. These shell exchange interactions have been studied in detail and often follow two models. These models are called the negotiation exchange model and the aggression exchange model. In the negotiation exchange model, both crabs benefit from the trade attaining a shell with an inter- nal volume more suited for their body size (Hazlett 1990). A large crab in a small shell exchanging with a smaller crab in a large shell is an example that follows the negotiation model. However, it is also considered a negotiation model if no shell exchange occurs because the defender crab will not benefit from the interaction. In the aggression model, the initiator crab forces the non-initiator to abandon its shell and the exchange is only beneficial for the initiator crab. In this model, the non-initiator crab would be left with a shell that has an internal volume that is either too big or too small for its body size. An initiator crab rapping on a non-initiator’s shell followed by the instigator pulling the defendant out of its shell is a clear example that follows the aggression model. In 1987, Hazlett conducted an experi- ment to determine the shell exchange model followed by orange claw hermit crabs, Calcinus tibicen (Herbst, 1791) and concluded that this species of crab normally follow the negotiation strategy. However, some researchers have also suggested that interspecific as well as intraspecific aggres- sion is the most common behavior exhibited by hermit crabs (Elwood and Stewart 1985). Coenobita clypeatus (Herbst, 1791) known as Caribbean hermit crab is a terrestrial crab that lives in vacant Nerite peloronta (Linnaeus, 1758), Eutrochatella costata (Gray, 1824) and Littorina littorea (Children, 1834) shells. Coeno- bita clypeatus is found on tropical and subtropical islands in the Pacific, Indian and Atlantic Oceans (Morrison and Spiller 2006). Coenobita clypeatus is also found throughout the Caribbean as far north as the Florida Keys and Bermuda and as far south as Venezuela. The objective of this research was to determine if C. clypeatus favors the negotiation or the aggression model when competing for a desired shell. According to Hazlett (1990), most research supports the idea that the Caribbean hermit crabs behave in a way that is consistent with the negotiation model. The laboratory experiments were designed to test the hypothesis that the Caribbean hermit crab behave similarly to C. tibicen as well as to Hawaiian hermit crab, Calcinus hazletti (Haig and McLaughlin, 1984) and that C. clypeatus favors the negotiation model instead of the aggression model. However, according to the aggression model of shell exchange (Hazlet 1989), hostilite interactions were expected if the initiator crab was considerably larger and therefore capable of rapping at a higher a rate than the non- initiator crab (Briffa and Elwood 2002). METHODS The fieldwork was conducted at the Discovery Bay Marine Laboratory in Discovery Bay, Jamaica between May 15th and May 30th 2014. Approximately 50 Caribbe- an hermit crabs were collected from an area surrounding the Discovery Bay Laboratory. The crabs were visually separated by size (small, medium and large), placed in holding tanks and left undisturbed for 24 hours. Empty shells (collected from the surrounding mangrove area) were measured (greatest length, aperture length, aper- ture width) and weighed. Shell sizes were chosen to cover the size range of crabs used in the experiment. Since “the internal volume of the shell appears to be the most important parameter used by crabs in shell choice” (Hazlett 1990), the relationship between crab weight and desired shell size was determined. The internal volume of each shell was obtained by subtracting the weight of the empty shell from the weight of the shell filled with salt water with a known density of 1.02 g/cm3 ; a meth- od adapted from Hazlett’s (1990) study of Hawaiian hermit crabs. However, in order to determine the internal volume of the shell, Hazlett used dry sand instead of salt water. All the measurements for the internal volume of the shell fell between nine different categories. Once the internal volume of each shell was obtained (Table 1), specific plastic color confetti was glued outside of each shell according to its specific value. In previous research, such as Hazlett’s (1990), the inter- nal volume of the shell was correlated to the crab’s body size. However, due to the small size of C. clypeatus found in Discovery Bay, measuring the chelipeds was impossible without harming the crabs. Instead, it was determined that using the weight of the crab (which is directly proportional to its size) was a safer way to handle the crabs and would still yield comparable data. To determine the shell size that crabs prefer in relation to their weight, a free access experi- ment was conducted (Hazlett 1990). The group of 50 crabs was divided into five sets of 10 crabs each (n = 50) in order to give each set access to a considerable number of empty shells. For this experiment each set was placed inside a plastic holding container (6 × 4 × 4 in) for a settling period of 30 minutes. After the settling period, the crabs were
  • 67.
    KORALLION. VOL 5.2014 57 placed into a large observation tank (24 × 12 × 12 in) with 50 empty shells of different sizes and known volumes. The hermit crabs had access to all empty shells for a period of 2 hours. After that time, they were separated into two groups: those that chose a new shell and those that did not switch shells. The crabs that transitioned into new marked shells had their shells cracked using a bench vise and weighted using a high precision electronic scale. The data obtained from this set of crabs was used to run a regression line and to determine the relationship between crab weight and pre- ferred shell size. The crabs that did not move into a new shell had their shells cracked, were placed (naked) inside a large container and were given free access to new marked and empty shells. All 50 crabs were used for the shell ex- change experiment and were kept in separate containers according to size when not under observation. For the shell exchange experiment 10 sets of five crabs (n = 50) were placed (one set of five crabs per trial) in one large holding tank (24 × 12 × 12 in) and were observed for 60 minutes. Two parameters for crab interactions were es- tablished in order to analyze crab behavior appropriately. According to the first parameter, crab-pair interactions were only considered shell exchange behavior when rap- ping was observed and the initiator-crab continuously tapped the shell of the non-initiator. According to the sec- ond parameter, interactions concluded when the initiator crab released the shell of the defender, walked away and no shell exchange occurred or when the non-initiator crab va- cated its shell and an exchange followed. Negotiation model was considered if the non-initiator crab obtained a shell closer to its preferred size or shell exchange did not occurred because the non-initiator crab would have no benefit from the exchange (Hazlett 1990). It was considered aggression model behavior if the initiator was larger than the non-initiator as well as if the non- initiator did not benefit from the exchange. RESULTS After measuring the internal volume of about 100 empty shells (collected from the surrounding mangrove), it was determined that all internal volumes fell in one of nine cate- gories. The categories for internal volume in relation to marking color were: pink (confetti) = 0.098 cm3 ; gold (confetti) = 0.196 cm3 ; red (confetti) = 0.294 cm3 ; blue (confetti) = 0.882 cm3 ; silver (confetti) = 2.059 cm3 ; purple (confetti) = 0.392 cm3 ; blue/ green (confetti) = 0.490 cm3 ; green (confetti) = 0.588 cm3 and purple/red (confetti) = 5.588 cm3 . During the free-access experiment, a total of 30 crabs selected a new marked-shell and 20 crabs did not vacate their existing shell. The 30 crabs that voluntarily chose a new shell had body weights that ranged from 0.07 g to 3.1 g. After running a linear regression, it was determined that for the crab’s size range analyzed, there was not a statisti- cally significant correlation between the weight of the crab and the internal volume of its shell (R square = 0.01142; p- value = 0.60335) (Figure 1). For shell exchange behavior, 50 crabs were observed for a total of 600 minutes over a period of one and a half weeks. A total of 20 shell-related interactions were ob- served. Of these 20 interactions, 15 resulted in no shell ex- change that was consistent with a negotiator behavior, four crab pair-interactions resulted in shell exchange that was consistent with an aggressive behavior and one interaction yielded shell exchange that was considered negotiation be- havior (Table 1). DISCUSSION The interactions reported in this paper demonstrate that C. clypeatus favors the negotiation over the aggression model. A total of 15 shell-exchange interactions resulted in no shell exchange and one interaction resulted in shell ex- change. In other words, in 75% of the interactions the de- fender crab refused to vacate its shell because doing so would have represented a loss in shell fit and in 5 % of the interactions, the defender crab was forced out of its shell but benefited from the exchange acquiring a shell that was more suitable to its body size. It can be said that 80% of the interactions followed a negotiation model that involved a mutual gain of resources for both initiator and defender crabs. These behaviors are consistent with the negotiation model in which the non-initiator refuses to vacate because its current shell is closer to its preferred size than the shell of the initiator crab. According to a couple of studies con- ducted by Elwood and his colleagues, Caribbean hermit crabs only exchange shells when both individuals benefit from this trade. The shell-exchange behaviors observed in Caribbean hermit crabs in Discovery Bay, Jamaica were similar to the results obtained by Hazlett in his research on Hawaiian hermit crabs. Hazlett (1990) experimented with five hermit crab species including Clibanarius zebra (Dana, 1852), Calcinus laevimanus (Randall, 1840), Calcinus lat- ens (Dana, 1852), Calcinus seuratic (Dana, 1851) and Cal- Figure 1. Linear regression performed to determine the relation- ship between the C. clypeatus’ body weight (g) and the preferred internal volume of their shell.
  • 68.
    O’SHEA: SHELL EXCHANGEIN HERMIT CRABS cinus elegans (Milne-Edwards, 1836). Out of 255 shell- related interactions, 144 were intraspecific and 111 were interspecific. According to Hazlett (1990), approximately 69% to 78% of the intraspecific interactions followed the negotiation model and 87% to 100% of the interspecific interactions were characteristic of the negotiation model. Hazlett concluded that overall; the negotiation model cor- rectly predicted the outcome of the interactions 71.6% of the cases. After conducting multiple studies on several spe- cies of hermit crabs, Hazlett states that the negotiation model is the best way to predict the outcome of shell- exchange interactions not only for C. clypeatus but also for about 15 species of hermit crabs. Aggression between crabs was observed in all crab-pair interactions. These interactions began with an initiator crab approaching the non-initiator and grabbing the defender’s shell. In some crab-pair interactions, the initiator crab held the non-initiator’s cheliped while rapping on its shell. How- ever, although the intent of the initiating crab was hostile, the shell exchange model was not considered to be aggres- sive because according to Elwood (1995), shell-exchange models take into consideration the gain or loss in shell vol- ume of the non-initiator individual. Intraspecific interac- Table 1. Shell-exchange interactions recorded during observation on Caribbean hermit crab (Coenobita clypeatus). Interaction Number Exchange occurred Shell Exchange Model 1 No Negotiation 2 No Negotiation 3 Yes Aggression 4 No Negotiation 5 No Negotiation 6 No Negotiation 7 Yes Aggression 8 No Negotiation 9 Yes Aggression 10 No Negotiation 11 No Negotiation 12 Yes Aggression 13 Yes Negotiation 14 No Negotiation 15 No Negotiation 16 No Negotiation 17 No Negotiation 18 No Negotiation 19 No Negotiation 20 No Negotiation tions in this study were characterized by an aggressive be- havior that was not always initiated by the larger crab. This intraspecific hostility is not consistent with the hypothesis stating that an aggressive behavior was going to be ob- served if the initiator crab was considerably larger than the non-initiator crab. Taking the gain or loss in shell volume for the defender into consideration, only four interactions were considered aggressive behavior since the non-initiator crab did not benefit from the exchange and did not gain in shell fit. These behaviors are consistent with the hermit crab’s shell exchange behavior described by Hazlett in one of his re- search on Hawaiian hermit crabs. In his experiment, Hazlett noted that out of 14 interactions recorded, 11 resulted in no shell exchange and were considered negotiation behavior; one interaction resulted in shell exchange and was consid- ered negotiation behavior as well. Only three interactions resulted in no shell exchange following an aggressive be- havior. Determining which shell exchange model hermit crabs prefer or which is the most successful strategy was Haz- lett’s motivation behind his study in 1981. Hazlett ex- plained that the reason hermit crabs favor the mutual gain model is the high probability that small crabs will be occu- pying larger shells. The reason for this phenomenon is the fact that there are more small crabs than large ones in any population of hermit crabs. Consequently, the chances of a small crab finding a new shell from a snail that recently died are much greater. According to Hazlett, it is unlikely that the shell found by the small crab would be the appro- priate size therefore it is expected that this small crab would exchange shells with a larger crab at a later time (Hazlett 1981). The results obtained from the relationship between weight and shell internal volume were not consistent with other studies that found these two measurements to be the best way to determine the shell-size preference. A possible explanation for the lack of correlation between body weight and shell volume is the limited range in crab sizes that were analyzed and a disproportionate number of medium size crabs used in the experiment. The discrepancy in shell size selected by the crabs could also be explained by the limited range of internal volumes of available shells. According to Hazlett (1992), crabs can modify their preferences regard- ing shell size according the the availability of empty shells (Hazlett 1992). It is possible that a smaller crab settles for a shell with an internal volume greater than its ideal volume or that a larger crab selects a shell with an internal volume smaller than it would normally choose. In one of his studies on hermit crabs, Hazlett concluded that on average, occu- pied shells are smaller than the preferred size (Hazlett 1981). In a study conducted by Bartness on the influence of shell on hermit crab growth, he observed that shell type and size affect the hermit crab’s growth significantly. While light shells allow a significantly higher growth rate (p < 58
  • 69.
    KORALLION. VOL 5.2014 0.05, t-test), shells with a smaller internal volume limits this growth and even reverses it. Bertness stated that it is possible that a hermit crab that selected a shell with an in- ternal volume too small for its body to reduce its body size (become smaller) next time it molts (Bertness 1981). Although the volume of the shell is of critical im- portance to hermit crabs, additional parameters such as shell weight, aperture size, aperture shape may also be con- sidered in shell selection (Hazlett 1981). If C. clypeatus from Discovery Bay, selects its shells according to a pa- rameter other than the internal volume of the shell, the ex- perimental regression model would not show a significant relationship between body weight and shell volume. ACKNOWLEDGMENTS I would like to thank M O’Shea for his exceptional editing and writing skills and willingness to help me time after time. Many thanks to D Scarlett for attempting to help me clean up snail shells and letting me use the Hulk. Thanks to O Holder, “Snow”, for helping me collect shells and letting me be the captain of the boat. Special thanks to the Ecology of Coral Reefs students who help me collect crabs at night and were always enthusiastic to watch the crabs exchange shells with me. Thanks to E Burge for his valuable input and suggestions. LITERATURE CITED Barnes DKA, De Grave S. 2000. Ecology of tropical hermit crabs at Quirimba Island, Mozambique: Niche width and resource allocation. Mar Ecol Prog Ser. 206: 171-179. Bertness MD. 1981. The influence of shell-type on hermit crab growth rate and clutch size (Decapoda, Anomura). Crusta- ceana. 40(2): 197-205. Briffa M, Elwood RW. 2000. The power of shell rapping influ- ences rates of eviction in hermit crabs. Behav Ecol Sociobiol. 3: 288-293. Briffa M, Elwood RW. 2002. Power of shell-rapping signals influ- ences physiological costs and subsequent decisions during hermit crab fights. Proc Roy Soc B-Biol Sci. 269: 2331-2336. Briffa M, Elwood RW. 2005. Metabolic consequences of shell choice in Pagurus bernhardus: Do hermit crabs prefer cryptic or portable shells? Behav Ecol Sociobiol. 59: 143-148. Elwood RW. 1995. Motivational change during resource assess- ment by hermit crabs. J Exp Mar Bio Ecol. 193: 41-55. Elwood RW, Stewart A. 1985. The timing of decisions during shell investigation by the hermit crab, Pagurus bernhardus. Anim Behav. 33: 620-627. Garcia RB, Mantelatto FLM. 2001. Shell selection by the tropical hermit crab Calcinus tibicen (Herbst, 1791) (Anomura, Diog- enidae) from Southern Brazil. J Exp Mar Bio Ecol. 265: 1–14. Hazlett BA. 1981. The behavioral ecology of hermit crabs. Annu Rev Ecol Evol Syst. 12: 1-22. Hazlett BA. 1987. Information transfer during shell exchange in the hermit crab Clibanarius antillensis. Anim Behav. 35: 218- 226. Hazlett BA. 1989. Shell exchanges in the hermit crabs Calcinus tibicen. Anim Behav. 37: 104-111. Hazlett BA. 1990. Shell exchange in Hawaiian hermit crabs. Pac Sci. 4: 401-406. Hazlett BA. 1992. The effect of past experience on the size of shells selected by hermit crabs. Anim Behav. 44: 203-205 Hazlett BA, Baron LC. 1989. Influence of shells on mating be- havior in the hermit crab Calcinus tibicen. Behav Ecol Socio- biol. 24: 369-376. Morrison LW, Spiller DA. 2006. Land hermit crab (Coenobita clypeatus) densities and patterns of gastropod shell use on small Bahamian islands. J Biogeogr. 33: 314-322. Rotjan RD, Chabot JR, Lewis SM. 2010. Social context of shell acquisition in Coenobita clypeatus hermit crabs. Behav Ecol. 21: 639–646. Thacker RW. 1994. Volatile shell-investigation cues of land her- mit crabs: Effect of shell fit, detection of cues from other her- mit crab species, and cue isolation. J Chem Ecol. 20(7): 457- 1482. 59
  • 70.
    STUDIES IN CORALREEF ECOLOGY60
  • 72.
    For additional informationvisit www.ecologyofcoralreefs.com