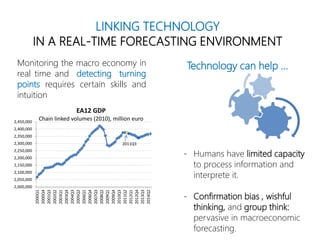
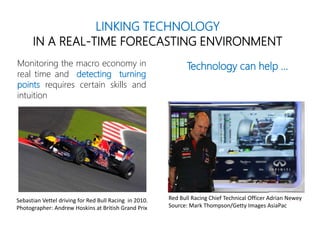
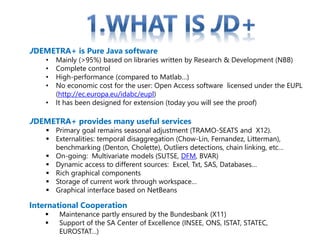
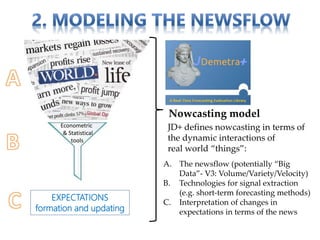
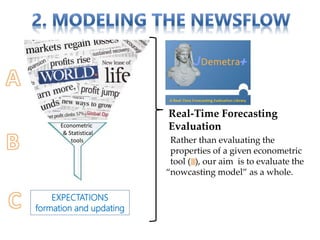
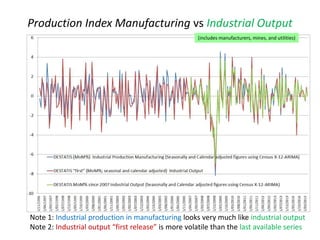
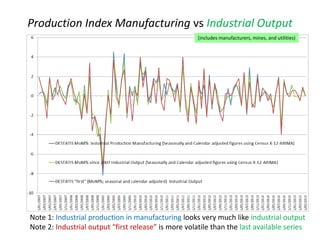
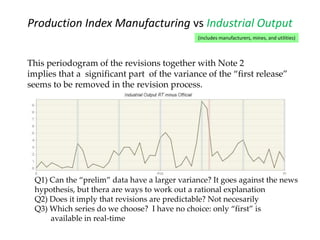
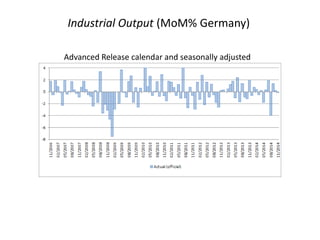
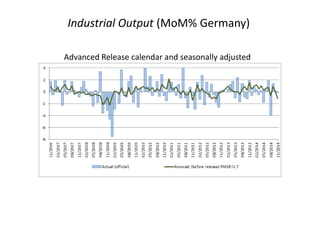
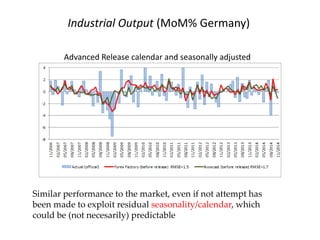
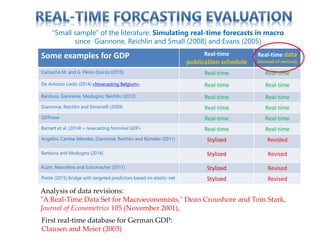
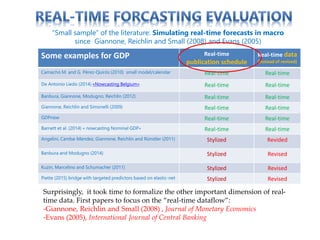
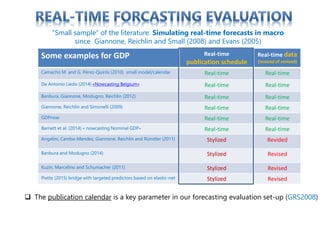
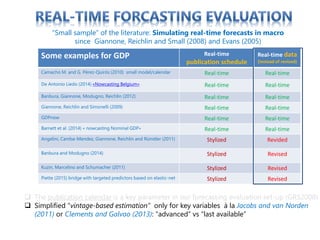
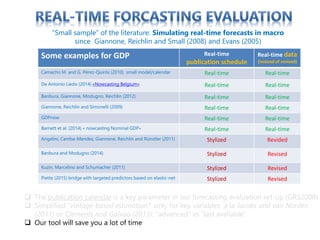
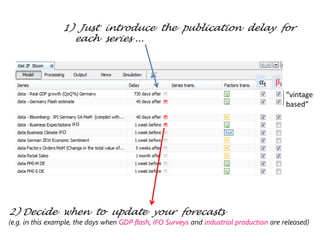
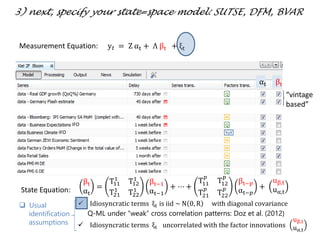
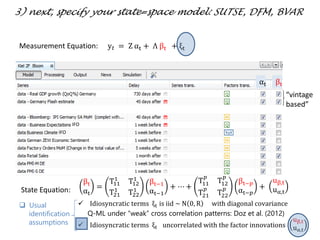
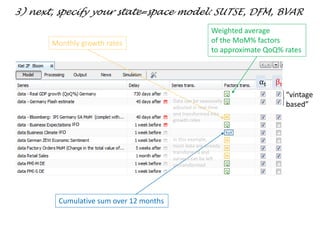
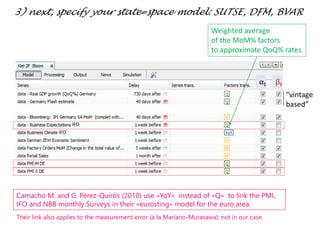
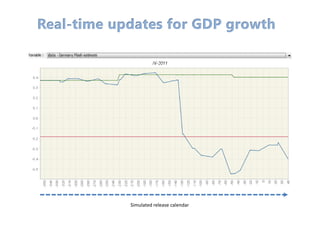
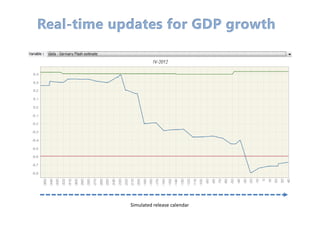
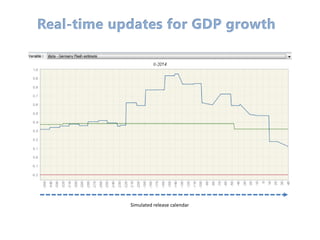
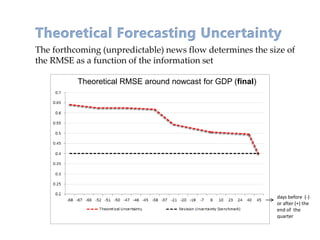
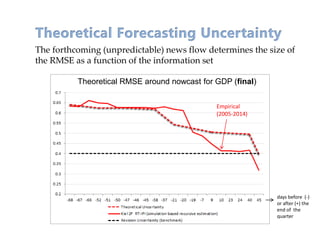
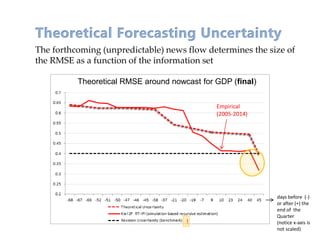
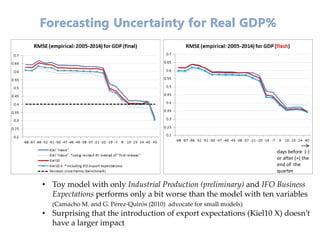
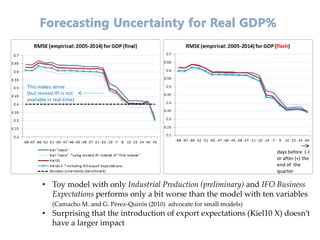
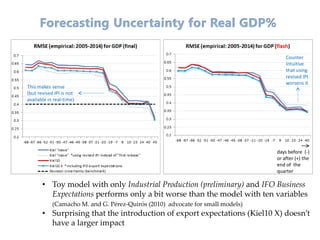
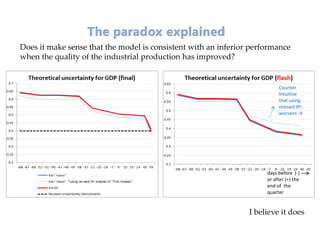
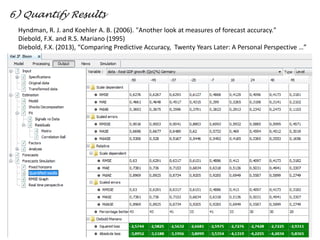
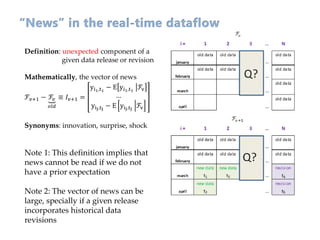
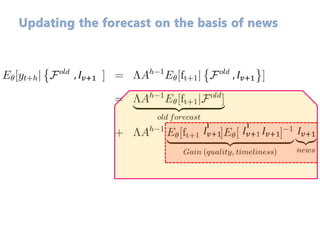
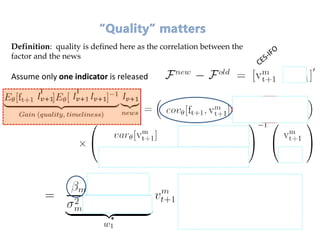
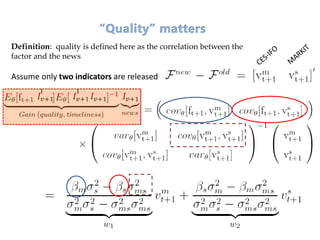
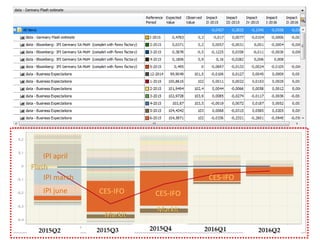
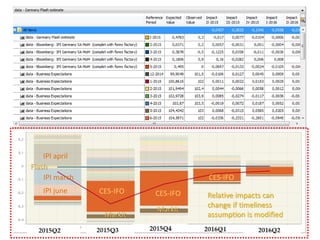
RESEARCH & DEVELOPMENT
STATISTICS (NBB)
Jean Palate
David de Antonio Liedo
Christian-Albrechts-Universität zu Kiel
Institut für Statistik und Ökonometrie
July 2015
Nowcasting German GDP
with
Licensed under the EUPL (http://ec.europa.eu/idabc/eupl).
The last updated version of the software can be downloaded here
https://github.com/jdemetra/jdemetra-app/releases/tag/v2.0.0
- Humans have limited capacity
to process information and
interprete it.
- Confirmation bias , wishful
thinking, and group think:
pervasive in macroeconomic
forecasting.
2011Q3
2,000,000
2,050,000
2,100,000
2,150,000
2,200,000
2,250,000
2,300,000
2,350,000
2,400,000
2,450,000
2000Q1
2000Q4
2001Q3
2002Q2
2003Q1
2003Q4
2004Q3
2005Q2
2006Q1
2006Q4
2007Q3
2008Q2
2009Q1
2009Q4
2010Q3
2011Q2
2012Q1
2012Q4
2013Q3
2014Q2
EA12 GDP
Chain linked volumes (2010), million euro
LINKING TECHNOLOGY
IN A REAL-TIME FORECASTING ENVIRONMENT
Monitoring the macro economy in
real time and detecting turning
points requires certain skills and
intuition
Technology can help …
LINKING TECHNOLOGY
IN A REAL-TIME FORECASTING ENVIRONMENT
Monitoring the macro economy in
real time and detecting turning
points requires certain skills and
intuition
Technology can help …
Red Bull Racing Chief Technical Officer Adrian Newey
Source: Mark Thompson/Getty Images AsiaPac
Sebastian Vettel driving for Red Bull Racing in 2010.
Photographer: Andrew Hoskins at British Grand Prix
LINKING TECHNOLOGY
IN A REAL-TIME FORECASTING ENVIRONMENT
Monitoring the macro economy in
real time and detecting turning
points requires certain skills and
intuition
Technology can help …
TODAY: real-time
simulation
Sebastian Vettel driving for Red Bull Racing in 2010.
Photographer: Andrew Hoskins at British Grand Prix
 Simulate real-time
forecasts
 Forecasting uncertainty
as a function of the news-flow
REAL-TIME FORECASTING
EVALUATION PLUG-IN
 Simulate real-time
forecasts
 Forecasting uncertainty
as a function of the news-flow
 Replace the concept of
“forecast horizon”
by “information set”
REAL-TIME FORECASTING
EVALUATION PLUG-IN
1. WHAT IS JDEMETRA (JD) +
A Real-Time Forecasting Evaluation Library
1. WHAT IS JDEMETRA (JD) +
2. MODELING THE REAL-TIME
NEWSFLOW
A Real-Time Forecasting Evaluation Library
1. WHAT IS JDEMETRA (JD) +
2. MODELING THE REAL-TIME
NEWSFLOW
3. NEXT STEPS
A Real-Time Forecasting Evaluation Library
GERMAN GDP
Defining the calendar
Estimation
In Sample analysis
Out-of-Sample (Real Time simulation)
News Analysis
JDEMETRA+ is Pure Java software
• Mainly (>95%) based on libraries written by Research & Development (NBB)
• Complete control
• High-performance (compared to Matlab…)
• No economic cost for the user: Open Access software licensed under the EUPL
(http://ec.europa.eu/idabc/eupl)
• It has been designed for extension (today you will see the proof)
JDEMETRA+ provides many useful services
 Primary goal remains seasonal adjustment (TRAMO-SEATS and X12).
 Externalities: temporal disaggregation (Chow-Lin, Fernandez, Litterman),
benchmarking (Denton, Cholette), Outliers detections, chain linking, etc…
 On-going: Multivariate models (SUTSE, DFM, BVAR)
 Dynamic access to different sources: Excel, Txt, SAS, Databases…
 Rich graphical components
 Storage of current work through workspace…
 Graphical interface based on NetBeans
International Cooperation
 Maintenance partly ensured by the Bundesbank (X11)
 Support of the SA Center of Excellence (INSEE, ONS, ISTAT, STATEC,
EUROSTAT…)
EXPECTATIONS
formation and updating
Econometric
& Statistical
tools
JD+ defines nowcasting in terms of
the dynamic interactions of
real world “things”:
A. The newsflow (potentially “Big
Data”- V3: Volume/Variety/Velocity)
B. Technologies for signal extraction
(e.g. short-term forecasting methods)
C. Interpretation of changes in
expectations in terms of the news
Nowcasting model
EXPECTATIONS
formation and updating
Econometric
& Statistical
tools Rather than evaluating the
properties of a given econometric
tool ( ), our aim is to evaluate the
“nowcasting model” as a whole.
Real-Time Forecasting
Evaluation
A quick look at Production Index Manufacturing (Germany)
Before we start
(includes manufacturers, mines, and utilities)
Production Index Manufacturing vs Industrial Output
Note 1: Industrial production in manufacturing looks very much like industrial output
(includes manufacturers, mines, and utilities)
Production Index Manufacturing vs Industrial Output
Note 1: Industrial production in manufacturing looks very much like industrial output
Note 2: Industrial output “first release” is more volatile than the last available series
Production Index Manufacturing vs Industrial Output
(includes manufacturers, mines, and utilities)
Note 1: Industrial production in manufacturing looks very much like industrial output
Note 2: Industrial output “first release” is more volatile than the last available series
Q1) Can the “prelim” data have a larger variance? It goes against the news
hypothesis, but thera are ways to work out a rational explanation
Q2) Does it imply that revisions are predictable? Not necesarily
Q3) Which series do we choose? I have no choice: only “first” is
available in real-time
This periodogram of the revisions together with Note 2
implies that a significant part of the variance of the “first release”
seems to be removed in the revision process.
Production Index Manufacturing vs Industrial Output
(includes manufacturers, mines, and utilities)
Industrial Output (MoM% Germany)
Advanced Release calendar and seasonally adjusted
Industrial Output (MoM% Germany)
Advanced Release calendar and seasonally adjusted
Similar performance to the market, even if not attempt has
been made to exploit residual seasonality/calendar, which
could be (not necesarily) predictable
Industrial Output (MoM% Germany)
Advanced Release calendar and seasonally adjusted
Some examples for GDP Real-time
publication schedule
Real-time data
(instead of revised)
Camacho M. and G. Pérez-Quirós (2010) Real-time Real-time
De Antonio Liedo (2014) «Nowcasting Belgium» Real-time Real-time
Banbura, Giannone, Modugno, Reichlin (2012) Real-time Real-time
Giannone, Reichlin and Simonelli (2009) Real-time Real-time
GDPnow Real-time Real-time
Barnett et al. (2014) « nowcasting Nominal GDP» Real-time Real-time
Angelini, Camba-Mendez, Giannone, Reichlin and Rünstler (2011) Stylized Revided
Banbura and Modugno (2014) Stylized Revised
Kuzin, Marcelino and Schumacher (2011) Stylized Revised
Piette (2015) bridge with targeted predictors based on elastic-net Stylized Revised
“Small sample” of the literature: Simulating real-time forecasts in macro
since Giannone, Reichlin and Small (2008) and Evans (2005)
Analysis of data revisions:
"A Real-Time Data Set for Macroeconomists," Dean Croushore and Tom Stark,
Journal of Econometrics 105 (November 2001),
First real-time database for German GDP:
Clausen and Meier (2003)
Some examples for GDP Real-time
publication schedule
Real-time data
(instead of revised)
Camacho M. and G. Pérez-Quirós (2010) small model/calendar Real-time Real-time
De Antonio Liedo (2014) «Nowcasting Belgium» Real-time Real-time
Banbura, Giannone, Modugno, Reichlin (2012) Real-time Real-time
Giannone, Reichlin and Simonelli (2009) Real-time Real-time
GDPnow Real-time Real-time
Barnett et al. (2014) « nowcasting Nominal GDP» Real-time Real-time
Angelini, Camba-Mendez, Giannone, Reichlin and Rünstler (2011) Stylized Revided
Banbura and Modugno (2014) Stylized Revised
Kuzin, Marcelino and Schumacher (2011) Stylized Revised
Piette (2015) bridge with targeted predictors based on elastic-net Stylized Revised
“Small sample” of the literature: Simulating real-time forecasts in macro
since Giannone, Reichlin and Small (2008) and Evans (2005)
Surprisingly, it took time to formalize the other important dimension of real-
time data. First papers to focus on the “real-time dataflow”:
-Giannone, Reichlin and Small (2008) , Journal of Monetary Economics
-Evans (2005), International Journal of Central Banking
Some examples for GDP Real-time
publication schedule
Real-time data
(instead of revised)
Camacho M. and G. Pérez-Quirós (2010) small model/calendar Real-time Real-time
De Antonio Liedo (2014) «Nowcasting Belgium» Real-time Real-time
Banbura, Giannone, Modugno, Reichlin (2012) Real-time Real-time
Giannone, Reichlin and Simonelli (2009) Real-time Real-time
GDPnow Real-time Real-time
Barnett et al. (2014) « nowcasting Nominal GDP» Real-time Real-time
Angelini, Camba-Mendez, Giannone, Reichlin and Rünstler (2011) Stylized Revided
Banbura and Modugno (2014) Stylized Revised
Kuzin, Marcelino and Schumacher (2011) Stylized Revised
Piette (2015) bridge with targeted predictors based on elastic-net Stylized Revised
 The publication calendar is a key parameter in our forecasting evaluation set-up (GRS2008)
“Small sample” of the literature: Simulating real-time forecasts in macro
since Giannone, Reichlin and Small (2008) and Evans (2005)
Some examples for GDP Real-time
publication schedule
Real-time data
(instead of revised)
Camacho M. and G. Pérez-Quirós (2010) small model/calendar Real-time Real-time
De Antonio Liedo (2014) «Nowcasting Belgium» Real-time Real-time
Banbura, Giannone, Modugno, Reichlin (2012) Real-time Real-time
Giannone, Reichlin and Simonelli (2009) Real-time Real-time
GDPnow Real-time Real-time
Barnett et al. (2014) « nowcasting Nominal GDP» Real-time Real-time
Angelini, Camba-Mendez, Giannone, Reichlin and Rünstler (2011) Stylized Revided
Banbura and Modugno (2014) Stylized Revised
Kuzin, Marcelino and Schumacher (2011) Stylized Revised
Piette (2015) bridge with targeted predictors based on elastic-net Stylized Revised
 The publication calendar is a key parameter in our forecasting evaluation set-up (GRS2008)
 Simplified “vintage-based estimation” only for key variables à la Jacobs and van Norden
(2011) or Clements and Galvao (2013): “advanced” vs “last available”
“Small sample” of the literature: Simulating real-time forecasts in macro
since Giannone, Reichlin and Small (2008) and Evans (2005)
 The publication calendar is a key parameter in our forecasting evaluation set-up (GRS2008)
 Simplified “vintage-based estimation” only for key variables à la Jacobs and van Norden
(2011) or Clements and Galvao (2013): “advanced” vs “last available”
 Our tool will save you a lot of time
“Small sample” of the literature: Simulating real-time forecasts in macro
since Giannone, Reichlin and Small (2008) and Evans (2005)
Some examples for GDP Real-time
publication schedule
Real-time data
(instead of revised)
Camacho M. and G. Pérez-Quirós (2010) small model/calendar Real-time Real-time
De Antonio Liedo (2014) «Nowcasting Belgium» Real-time Real-time
Banbura, Giannone, Modugno, Reichlin (2012) Real-time Real-time
Giannone, Reichlin and Simonelli (2009) Real-time Real-time
GDPnow Real-time Real-time
Barnett et al. (2014) « nowcasting Nominal GDP» Real-time Real-time
Angelini, Camba-Mendez, Giannone, Reichlin and Rünstler (2011) Stylized Revided
Banbura and Modugno (2014) Stylized Revised
Kuzin, Marcelino and Schumacher (2011) Stylized Revised
Piette (2015) bridge with targeted predictors based on elastic-net Stylized Revised
1) Just introduce the publication delay for
each series ...
2) Decide when to update your forecasts
(e.g. in this example, the days when GDP flash, IFO Surveys and industrial production are released)
“vintage
based”
IFO
IFO
αt βt
 Idiosyncratic terms ξt is iid ~ N 0, R with diagonal covariance
Q-ML under “weak” cross correlation patterns: Doz et al. (2012)
 Idiosyncratic terms ξt uncorrelated with the factor innovations
uβ,t
uα,t
“vintage
based”
IFO
IFO
αt βt
3) next, specify your state=space model: SUTSE, DFM, BVAR
Measurement Equation: y 𝑡 = Z αt + Λ βt + ξt
βt
αt
=
T11
1
T12
1
T21
1
T22
1
βt−1
αt−1
+ ⋯ +
T11
𝑝
T12
𝑝
T21
𝑝
T22
𝑝
βt−𝑝
αt−𝑝
+
uβ,t
uα,tState Equation:
 Usual
identification
assumptions
“vintage
based”
IFO
IFO
αt βt
3) next, specify your state=space model: SUTSE, DFM, BVAR
Weighted average
of the MoM% factors
to approximate QoQ% rates
Cumulative sum over 12 months
Monthly growth rates
Data can be seasonally
adjusted in real-time
and transformed into
growth rates
In this example,
most data are already
transformed and
surveys can be left
untransformed
“vintage
based”
IFO
IFO
αt βt
3) next, specify your state=space model: SUTSE, DFM, BVAR
Weighted average
of the MoM% factors
to approximate QoQ% rates
Camacho M. and G. Pérez-Quirós (2010) use «YoY» instead of «Q» to link the PMI,
IFO and NBB monthly Surveys in their «eurosting» model for the euro area.
Their link also applies to the measurement error (à la Mariano-Murasawa); not in our case.
… and estimate it
Principal Components
… and estimate it
Principal Components
EM algorithm
Banbura and Modugno (2010)
… and estimate it
Principal Components
EM algorithm
Banbura and Modugno (2010)
Numerical Optimization
Uses EM to initialize.
Algorithms:
- Levenberg-Marquardt
- Broyden–Fletcher–Goldfarb–Shanno
Options: - Simplified iterations
- Iterations by blocks
Final EM algorithm
… and estimate it
Principal Components
EM algorithm
Banbura and Modugno (2010)
Numerical Optimization
Uses EM to initialize.
Algorithms:
- Levenberg-Marquardt
- Broyden–Fletcher–Goldfarb–Shanno
Options: - Simplified iterations
- Iterations by blocks
Final EM algorithm
… and estimate it
Correlation of Measurement Errors
Business
Expectations IFO
Markit PMI
(Manufactures)
Correlation of Measurement Errors
GDP final
GDP flash
4) Define evaluation sample and dates at which
model parameters must be re-estimated
For univariate models, recursive estimation every month, while
multivariate models may be re-estimated once or twice per
year, depending on the application
5) Visualize results
Real GDP growth (flash)
Real GDP growth (final)
Simulated release calendar
The forthcoming (unpredictable) news flow determines the size of
the RMSE as a function of the information set
Theoretical RMSE around nowcast for GDP (final)
days before (-)
or after (+) the
end of the
quarter
The forthcoming (unpredictable) news flow determines the size of
the RMSE as a function of the information set
Theoretical RMSE around nowcast for GDP (final)
Empirical
(2005-2014)
days before (-)
or after (+) the
end of the
quarter
The forthcoming (unpredictable) news flow determines the size of
the RMSE as a function of the information set
Theoretical RMSE around nowcast for GDP (final)
Empirical
(2005-2014)
!
days before (-)
or after (+) the
end of the
Quarter
(notice x-axis is
not scaled)
• Toy model with only Industrial Production (preliminary) and IFO Business
Expectations performs only a bit worse than the model with ten variables
(Camacho M. and G. Pérez-Quirós (2010) advocate for small models)
• Surprising that the introduction of export expectations (Kiel10 X) doesn’t
have a larger impact
days before (-)
or after (+) the
end of the
quarter
This makes sense
(but revised IPI is not
available in real-time)
• Toy model with only Industrial Production (preliminary) and IFO Business
Expectations performs only a bit worse than the model with ten variables
(Camacho M. and G. Pérez-Quirós (2010) advocate for small models)
• Surprising that the introduction of export expectations (Kiel10 X) doesn’t
have a larger impact
days before (-)
or after (+) the
end of the
quarter
Counter
Intuitive
that using
revised IPI
worsens it
This makes sense
(but revised IPI is not
available in real-time)
• Toy model with only Industrial Production (preliminary) and IFO Business
Expectations performs only a bit worse than the model with ten variables
(Camacho M. and G. Pérez-Quirós (2010) advocate for small models)
• Surprising that the introduction of export expectations (Kiel10 X) doesn’t
have a larger impact
days before (-)
or after (+) the
end of the
quarter
Does it make sense that the model is consistent with an inferior performance
when the quality of the industrial production has improved?
Counter
Intuitive
that using
revised IPI
worsens it
I believe it does
days before (-)
or after (+) the
end of the
quarter
Hyndman, R. J. and Koehler A. B. (2006). "Another look at measures of forecast accuracy."
Diebold, F.X. and R.S. Mariano (1995)
Diebold, F.X. (2013), “Comparing Predictive Accuracy, Twenty Years Later: A Personal Perspective …”
6) Quantify Results
Banbura and Modugno (2010)
Journal of Applied Econometrics
Definition: unexpected component of a
given data release or revision
Mathematically, the vector of news
ℱ 𝑣+1 − ℱ𝑣
𝑜𝑙𝑑
≡ 𝐼𝑣+1 =
yi1,t1
− E yi1,t1
ℱv
…
yiJ,tJ
− E yiJ,tJ
ℱv
Synonyms: innovation, surprise, shock
Note 1: This definition implies that
news cannot be read if we do not
have a prior expectation
Note 2: The vector of news can be
large, specially if a given release
incorporates historical data
revisions
, 𝐼𝑣+1 , 𝐼𝑣+1
𝐼𝑣+1𝐼𝑣+1 𝐼𝑣+1 𝐼𝑣+1
Assume only one indicator is released
*
Definition: quality is defined here as the correlation between the
factor and the news
Assume only two indicators are released
Definition: quality is defined here as the correlation between the
factor and the news
Assume one indicator was earlier
*
Definition: timeliness refers to the habit of being available at the
forecaster’s information set earlier than other indicators
<
Weight is higher
Once Markit-PMI is published,
the news content would be
smaller (because of the correlation
with CES-IFO), so the impact
“wx news” will be smaller for the
subsequent CES-IFO release
• This simple mathematical expression has explained the importance
of timeliness ( and )
• This larger “impact” coefficient is translated into tangible phenomena:
- more citations (FT, Bloomberg)
- the ability to have an effect in market expectations
- a higher economic value
• The obvious implication: survey data providers may have incetives
to release their data as early as possible (without compromising on
their quality, which can be objectively evaluated too)
Today: 9 july 2015
15 december 2014
Today: 9 july 2015
15 december 2014
IPI june CES-IFO CES-IFO
Markit
IPI march
IPI april
Flash
Markit
CES-IFO
IPI june CES-IFO CES-IFO
Markit
IPI march
IPI april
Flash
Markit
CES-IFO
Relative impacts can
change if timeliness
assumption is modified
C Getty Images
Photo: Urban Events
You are the pilot
• Think about the most suitable forecasting model
• Understand the data and assess model fit
• Before using your model out-of-sample , use
our “simulator” to become aware of the risks
SUMMARY
Features
• Simulates forecasting scenarios using real-time data
availability (users can define the release calendar in a
simple manner)
• Check whether a new model yields statistically significant
gains in forecasting accuracy with respect to alternatives
• Robust quantification of forecast accuracy as a function of
the information available (ongoing: test release impacts)
• Many measures of forecast accuracy and possibility to
perform analysis by subsamples
(ongoing: Giacomini and Rossi, 2010)
You are the pilot
• Think about the most suitable forecasting model
• Understand the data and assess model fit
• Before using your model out-of-sample , use
our “simulator” to become aware of the risks
• Good luck!
SUMMARY
(α=5%)
Features
• Simulates forecasting scenarios using real-time data
availability (users can define the release calendar in a
simple manner)
• Check whether a new model yields statistically significant
gains in forecasting accuracy with respect to alternatives
• Robust quantification of forecast accuracy as a function of
the information available (ongoing: test release impacts)
• Many measures of forecast accuracy and possibility to
perform analysis by subsamples
(ongoing: Giacomini and Rossi, 2010)
Supplementary material
PERIODOGRAM
Decomposes the sum of squares of the
growth rates in terms of the Fourier coefficients
A quick look at Production Index Manufacturing (Germany)
(includes manufacturers,
mines, and utilities)
(includes manufacturers,
mines, and utilities)

Nowcasting German GDP growth and the real time newsflow

  • 1.
    RESEARCH & DEVELOPMENT STATISTICS(NBB) Jean Palate David de Antonio Liedo Christian-Albrechts-Universität zu Kiel Institut für Statistik und Ökonometrie July 2015 Nowcasting German GDP with Licensed under the EUPL (http://ec.europa.eu/idabc/eupl). The last updated version of the software can be downloaded here https://github.com/jdemetra/jdemetra-app/releases/tag/v2.0.0
  • 2.
    - Humans havelimited capacity to process information and interprete it. - Confirmation bias , wishful thinking, and group think: pervasive in macroeconomic forecasting. 2011Q3 2,000,000 2,050,000 2,100,000 2,150,000 2,200,000 2,250,000 2,300,000 2,350,000 2,400,000 2,450,000 2000Q1 2000Q4 2001Q3 2002Q2 2003Q1 2003Q4 2004Q3 2005Q2 2006Q1 2006Q4 2007Q3 2008Q2 2009Q1 2009Q4 2010Q3 2011Q2 2012Q1 2012Q4 2013Q3 2014Q2 EA12 GDP Chain linked volumes (2010), million euro LINKING TECHNOLOGY IN A REAL-TIME FORECASTING ENVIRONMENT Monitoring the macro economy in real time and detecting turning points requires certain skills and intuition Technology can help …
  • 3.
    LINKING TECHNOLOGY IN AREAL-TIME FORECASTING ENVIRONMENT Monitoring the macro economy in real time and detecting turning points requires certain skills and intuition Technology can help … Red Bull Racing Chief Technical Officer Adrian Newey Source: Mark Thompson/Getty Images AsiaPac Sebastian Vettel driving for Red Bull Racing in 2010. Photographer: Andrew Hoskins at British Grand Prix
  • 4.
    LINKING TECHNOLOGY IN AREAL-TIME FORECASTING ENVIRONMENT Monitoring the macro economy in real time and detecting turning points requires certain skills and intuition Technology can help … TODAY: real-time simulation Sebastian Vettel driving for Red Bull Racing in 2010. Photographer: Andrew Hoskins at British Grand Prix
  • 5.
     Simulate real-time forecasts Forecasting uncertainty as a function of the news-flow REAL-TIME FORECASTING EVALUATION PLUG-IN
  • 6.
     Simulate real-time forecasts Forecasting uncertainty as a function of the news-flow  Replace the concept of “forecast horizon” by “information set” REAL-TIME FORECASTING EVALUATION PLUG-IN
  • 7.
    1. WHAT ISJDEMETRA (JD) + A Real-Time Forecasting Evaluation Library
  • 8.
    1. WHAT ISJDEMETRA (JD) + 2. MODELING THE REAL-TIME NEWSFLOW A Real-Time Forecasting Evaluation Library
  • 9.
    1. WHAT ISJDEMETRA (JD) + 2. MODELING THE REAL-TIME NEWSFLOW 3. NEXT STEPS A Real-Time Forecasting Evaluation Library GERMAN GDP Defining the calendar Estimation In Sample analysis Out-of-Sample (Real Time simulation) News Analysis
  • 10.
    JDEMETRA+ is PureJava software • Mainly (>95%) based on libraries written by Research & Development (NBB) • Complete control • High-performance (compared to Matlab…) • No economic cost for the user: Open Access software licensed under the EUPL (http://ec.europa.eu/idabc/eupl) • It has been designed for extension (today you will see the proof) JDEMETRA+ provides many useful services  Primary goal remains seasonal adjustment (TRAMO-SEATS and X12).  Externalities: temporal disaggregation (Chow-Lin, Fernandez, Litterman), benchmarking (Denton, Cholette), Outliers detections, chain linking, etc…  On-going: Multivariate models (SUTSE, DFM, BVAR)  Dynamic access to different sources: Excel, Txt, SAS, Databases…  Rich graphical components  Storage of current work through workspace…  Graphical interface based on NetBeans International Cooperation  Maintenance partly ensured by the Bundesbank (X11)  Support of the SA Center of Excellence (INSEE, ONS, ISTAT, STATEC, EUROSTAT…)
  • 11.
    EXPECTATIONS formation and updating Econometric &Statistical tools JD+ defines nowcasting in terms of the dynamic interactions of real world “things”: A. The newsflow (potentially “Big Data”- V3: Volume/Variety/Velocity) B. Technologies for signal extraction (e.g. short-term forecasting methods) C. Interpretation of changes in expectations in terms of the news Nowcasting model
  • 12.
    EXPECTATIONS formation and updating Econometric &Statistical tools Rather than evaluating the properties of a given econometric tool ( ), our aim is to evaluate the “nowcasting model” as a whole. Real-Time Forecasting Evaluation
  • 14.
    A quick lookat Production Index Manufacturing (Germany) Before we start
  • 15.
    (includes manufacturers, mines,and utilities) Production Index Manufacturing vs Industrial Output Note 1: Industrial production in manufacturing looks very much like industrial output
  • 16.
    (includes manufacturers, mines,and utilities) Production Index Manufacturing vs Industrial Output Note 1: Industrial production in manufacturing looks very much like industrial output Note 2: Industrial output “first release” is more volatile than the last available series
  • 17.
    Production Index Manufacturingvs Industrial Output (includes manufacturers, mines, and utilities) Note 1: Industrial production in manufacturing looks very much like industrial output Note 2: Industrial output “first release” is more volatile than the last available series
  • 18.
    Q1) Can the“prelim” data have a larger variance? It goes against the news hypothesis, but thera are ways to work out a rational explanation Q2) Does it imply that revisions are predictable? Not necesarily Q3) Which series do we choose? I have no choice: only “first” is available in real-time This periodogram of the revisions together with Note 2 implies that a significant part of the variance of the “first release” seems to be removed in the revision process. Production Index Manufacturing vs Industrial Output (includes manufacturers, mines, and utilities)
  • 19.
    Industrial Output (MoM%Germany) Advanced Release calendar and seasonally adjusted
  • 20.
    Industrial Output (MoM%Germany) Advanced Release calendar and seasonally adjusted
  • 21.
    Similar performance tothe market, even if not attempt has been made to exploit residual seasonality/calendar, which could be (not necesarily) predictable Industrial Output (MoM% Germany) Advanced Release calendar and seasonally adjusted
  • 23.
    Some examples forGDP Real-time publication schedule Real-time data (instead of revised) Camacho M. and G. Pérez-Quirós (2010) Real-time Real-time De Antonio Liedo (2014) «Nowcasting Belgium» Real-time Real-time Banbura, Giannone, Modugno, Reichlin (2012) Real-time Real-time Giannone, Reichlin and Simonelli (2009) Real-time Real-time GDPnow Real-time Real-time Barnett et al. (2014) « nowcasting Nominal GDP» Real-time Real-time Angelini, Camba-Mendez, Giannone, Reichlin and Rünstler (2011) Stylized Revided Banbura and Modugno (2014) Stylized Revised Kuzin, Marcelino and Schumacher (2011) Stylized Revised Piette (2015) bridge with targeted predictors based on elastic-net Stylized Revised “Small sample” of the literature: Simulating real-time forecasts in macro since Giannone, Reichlin and Small (2008) and Evans (2005) Analysis of data revisions: "A Real-Time Data Set for Macroeconomists," Dean Croushore and Tom Stark, Journal of Econometrics 105 (November 2001), First real-time database for German GDP: Clausen and Meier (2003)
  • 24.
    Some examples forGDP Real-time publication schedule Real-time data (instead of revised) Camacho M. and G. Pérez-Quirós (2010) small model/calendar Real-time Real-time De Antonio Liedo (2014) «Nowcasting Belgium» Real-time Real-time Banbura, Giannone, Modugno, Reichlin (2012) Real-time Real-time Giannone, Reichlin and Simonelli (2009) Real-time Real-time GDPnow Real-time Real-time Barnett et al. (2014) « nowcasting Nominal GDP» Real-time Real-time Angelini, Camba-Mendez, Giannone, Reichlin and Rünstler (2011) Stylized Revided Banbura and Modugno (2014) Stylized Revised Kuzin, Marcelino and Schumacher (2011) Stylized Revised Piette (2015) bridge with targeted predictors based on elastic-net Stylized Revised “Small sample” of the literature: Simulating real-time forecasts in macro since Giannone, Reichlin and Small (2008) and Evans (2005) Surprisingly, it took time to formalize the other important dimension of real- time data. First papers to focus on the “real-time dataflow”: -Giannone, Reichlin and Small (2008) , Journal of Monetary Economics -Evans (2005), International Journal of Central Banking
  • 25.
    Some examples forGDP Real-time publication schedule Real-time data (instead of revised) Camacho M. and G. Pérez-Quirós (2010) small model/calendar Real-time Real-time De Antonio Liedo (2014) «Nowcasting Belgium» Real-time Real-time Banbura, Giannone, Modugno, Reichlin (2012) Real-time Real-time Giannone, Reichlin and Simonelli (2009) Real-time Real-time GDPnow Real-time Real-time Barnett et al. (2014) « nowcasting Nominal GDP» Real-time Real-time Angelini, Camba-Mendez, Giannone, Reichlin and Rünstler (2011) Stylized Revided Banbura and Modugno (2014) Stylized Revised Kuzin, Marcelino and Schumacher (2011) Stylized Revised Piette (2015) bridge with targeted predictors based on elastic-net Stylized Revised  The publication calendar is a key parameter in our forecasting evaluation set-up (GRS2008) “Small sample” of the literature: Simulating real-time forecasts in macro since Giannone, Reichlin and Small (2008) and Evans (2005)
  • 26.
    Some examples forGDP Real-time publication schedule Real-time data (instead of revised) Camacho M. and G. Pérez-Quirós (2010) small model/calendar Real-time Real-time De Antonio Liedo (2014) «Nowcasting Belgium» Real-time Real-time Banbura, Giannone, Modugno, Reichlin (2012) Real-time Real-time Giannone, Reichlin and Simonelli (2009) Real-time Real-time GDPnow Real-time Real-time Barnett et al. (2014) « nowcasting Nominal GDP» Real-time Real-time Angelini, Camba-Mendez, Giannone, Reichlin and Rünstler (2011) Stylized Revided Banbura and Modugno (2014) Stylized Revised Kuzin, Marcelino and Schumacher (2011) Stylized Revised Piette (2015) bridge with targeted predictors based on elastic-net Stylized Revised  The publication calendar is a key parameter in our forecasting evaluation set-up (GRS2008)  Simplified “vintage-based estimation” only for key variables à la Jacobs and van Norden (2011) or Clements and Galvao (2013): “advanced” vs “last available” “Small sample” of the literature: Simulating real-time forecasts in macro since Giannone, Reichlin and Small (2008) and Evans (2005)
  • 27.
     The publicationcalendar is a key parameter in our forecasting evaluation set-up (GRS2008)  Simplified “vintage-based estimation” only for key variables à la Jacobs and van Norden (2011) or Clements and Galvao (2013): “advanced” vs “last available”  Our tool will save you a lot of time “Small sample” of the literature: Simulating real-time forecasts in macro since Giannone, Reichlin and Small (2008) and Evans (2005) Some examples for GDP Real-time publication schedule Real-time data (instead of revised) Camacho M. and G. Pérez-Quirós (2010) small model/calendar Real-time Real-time De Antonio Liedo (2014) «Nowcasting Belgium» Real-time Real-time Banbura, Giannone, Modugno, Reichlin (2012) Real-time Real-time Giannone, Reichlin and Simonelli (2009) Real-time Real-time GDPnow Real-time Real-time Barnett et al. (2014) « nowcasting Nominal GDP» Real-time Real-time Angelini, Camba-Mendez, Giannone, Reichlin and Rünstler (2011) Stylized Revided Banbura and Modugno (2014) Stylized Revised Kuzin, Marcelino and Schumacher (2011) Stylized Revised Piette (2015) bridge with targeted predictors based on elastic-net Stylized Revised
  • 28.
    1) Just introducethe publication delay for each series ... 2) Decide when to update your forecasts (e.g. in this example, the days when GDP flash, IFO Surveys and industrial production are released) “vintage based” IFO IFO αt βt
  • 29.
     Idiosyncratic termsξt is iid ~ N 0, R with diagonal covariance Q-ML under “weak” cross correlation patterns: Doz et al. (2012)  Idiosyncratic terms ξt uncorrelated with the factor innovations uβ,t uα,t “vintage based” IFO IFO αt βt 3) next, specify your state=space model: SUTSE, DFM, BVAR Measurement Equation: y 𝑡 = Z αt + Λ βt + ξt βt αt = T11 1 T12 1 T21 1 T22 1 βt−1 αt−1 + ⋯ + T11 𝑝 T12 𝑝 T21 𝑝 T22 𝑝 βt−𝑝 αt−𝑝 + uβ,t uα,tState Equation:  Usual identification assumptions
  • 30.
     Idiosyncratic termsξt is iid ~ N 0, R with diagonal covariance Q-ML under “weak” cross correlation patterns: Doz et al. (2012)  Idiosyncratic terms ξt uncorrelated with the factor innovations uβ,t uα,t “vintage based” IFO IFO αt βt 3) next, specify your state=space model: SUTSE, DFM, BVAR Measurement Equation: y 𝑡 = Z αt + Λ βt + ξt βt αt = T11 1 T12 1 T21 1 T22 1 βt−1 αt−1 + ⋯ + T11 𝑝 T12 𝑝 T21 𝑝 T22 𝑝 βt−𝑝 αt−𝑝 + uβ,t uα,tState Equation:  Usual identification assumptions
  • 31.
    “vintage based” IFO IFO αt βt 3) next,specify your state=space model: SUTSE, DFM, BVAR Weighted average of the MoM% factors to approximate QoQ% rates Cumulative sum over 12 months Monthly growth rates Data can be seasonally adjusted in real-time and transformed into growth rates In this example, most data are already transformed and surveys can be left untransformed
  • 32.
    “vintage based” IFO IFO αt βt 3) next,specify your state=space model: SUTSE, DFM, BVAR Weighted average of the MoM% factors to approximate QoQ% rates Camacho M. and G. Pérez-Quirós (2010) use «YoY» instead of «Q» to link the PMI, IFO and NBB monthly Surveys in their «eurosting» model for the euro area. Their link also applies to the measurement error (à la Mariano-Murasawa); not in our case.
  • 33.
  • 34.
  • 35.
    Principal Components EM algorithm Banburaand Modugno (2010) … and estimate it
  • 36.
    Principal Components EM algorithm Banburaand Modugno (2010) Numerical Optimization Uses EM to initialize. Algorithms: - Levenberg-Marquardt - Broyden–Fletcher–Goldfarb–Shanno Options: - Simplified iterations - Iterations by blocks Final EM algorithm … and estimate it
  • 37.
    Principal Components EM algorithm Banburaand Modugno (2010) Numerical Optimization Uses EM to initialize. Algorithms: - Levenberg-Marquardt - Broyden–Fletcher–Goldfarb–Shanno Options: - Simplified iterations - Iterations by blocks Final EM algorithm … and estimate it
  • 39.
  • 40.
    Business Expectations IFO Markit PMI (Manufactures) Correlationof Measurement Errors GDP final GDP flash
  • 42.
    4) Define evaluationsample and dates at which model parameters must be re-estimated For univariate models, recursive estimation every month, while multivariate models may be re-estimated once or twice per year, depending on the application
  • 43.
    5) Visualize results RealGDP growth (flash)
  • 44.
  • 45.
  • 46.
  • 47.
  • 48.
  • 49.
    The forthcoming (unpredictable)news flow determines the size of the RMSE as a function of the information set Theoretical RMSE around nowcast for GDP (final) days before (-) or after (+) the end of the quarter
  • 50.
    The forthcoming (unpredictable)news flow determines the size of the RMSE as a function of the information set Theoretical RMSE around nowcast for GDP (final) Empirical (2005-2014) days before (-) or after (+) the end of the quarter
  • 51.
    The forthcoming (unpredictable)news flow determines the size of the RMSE as a function of the information set Theoretical RMSE around nowcast for GDP (final) Empirical (2005-2014) ! days before (-) or after (+) the end of the Quarter (notice x-axis is not scaled)
  • 52.
    • Toy modelwith only Industrial Production (preliminary) and IFO Business Expectations performs only a bit worse than the model with ten variables (Camacho M. and G. Pérez-Quirós (2010) advocate for small models) • Surprising that the introduction of export expectations (Kiel10 X) doesn’t have a larger impact days before (-) or after (+) the end of the quarter
  • 53.
    This makes sense (butrevised IPI is not available in real-time) • Toy model with only Industrial Production (preliminary) and IFO Business Expectations performs only a bit worse than the model with ten variables (Camacho M. and G. Pérez-Quirós (2010) advocate for small models) • Surprising that the introduction of export expectations (Kiel10 X) doesn’t have a larger impact days before (-) or after (+) the end of the quarter
  • 54.
    Counter Intuitive that using revised IPI worsensit This makes sense (but revised IPI is not available in real-time) • Toy model with only Industrial Production (preliminary) and IFO Business Expectations performs only a bit worse than the model with ten variables (Camacho M. and G. Pérez-Quirós (2010) advocate for small models) • Surprising that the introduction of export expectations (Kiel10 X) doesn’t have a larger impact days before (-) or after (+) the end of the quarter
  • 55.
    Does it makesense that the model is consistent with an inferior performance when the quality of the industrial production has improved? Counter Intuitive that using revised IPI worsens it I believe it does days before (-) or after (+) the end of the quarter
  • 56.
    Hyndman, R. J.and Koehler A. B. (2006). "Another look at measures of forecast accuracy." Diebold, F.X. and R.S. Mariano (1995) Diebold, F.X. (2013), “Comparing Predictive Accuracy, Twenty Years Later: A Personal Perspective …” 6) Quantify Results
  • 57.
    Banbura and Modugno(2010) Journal of Applied Econometrics
  • 58.
    Definition: unexpected componentof a given data release or revision Mathematically, the vector of news ℱ 𝑣+1 − ℱ𝑣 𝑜𝑙𝑑 ≡ 𝐼𝑣+1 = yi1,t1 − E yi1,t1 ℱv … yiJ,tJ − E yiJ,tJ ℱv Synonyms: innovation, surprise, shock Note 1: This definition implies that news cannot be read if we do not have a prior expectation Note 2: The vector of news can be large, specially if a given release incorporates historical data revisions
  • 59.
    , 𝐼𝑣+1 ,𝐼𝑣+1 𝐼𝑣+1𝐼𝑣+1 𝐼𝑣+1 𝐼𝑣+1
  • 60.
    Assume only oneindicator is released * Definition: quality is defined here as the correlation between the factor and the news
  • 61.
    Assume only twoindicators are released Definition: quality is defined here as the correlation between the factor and the news
  • 62.
    Assume one indicatorwas earlier * Definition: timeliness refers to the habit of being available at the forecaster’s information set earlier than other indicators < Weight is higher Once Markit-PMI is published, the news content would be smaller (because of the correlation with CES-IFO), so the impact “wx news” will be smaller for the subsequent CES-IFO release
  • 63.
    • This simplemathematical expression has explained the importance of timeliness ( and ) • This larger “impact” coefficient is translated into tangible phenomena: - more citations (FT, Bloomberg) - the ability to have an effect in market expectations - a higher economic value • The obvious implication: survey data providers may have incetives to release their data as early as possible (without compromising on their quality, which can be objectively evaluated too)
  • 64.
    Today: 9 july2015 15 december 2014
  • 65.
    Today: 9 july2015 15 december 2014
  • 66.
    IPI june CES-IFOCES-IFO Markit IPI march IPI april Flash Markit CES-IFO
  • 67.
    IPI june CES-IFOCES-IFO Markit IPI march IPI april Flash Markit CES-IFO Relative impacts can change if timeliness assumption is modified
  • 68.
    C Getty Images Photo:Urban Events You are the pilot • Think about the most suitable forecasting model • Understand the data and assess model fit • Before using your model out-of-sample , use our “simulator” to become aware of the risks SUMMARY Features • Simulates forecasting scenarios using real-time data availability (users can define the release calendar in a simple manner) • Check whether a new model yields statistically significant gains in forecasting accuracy with respect to alternatives • Robust quantification of forecast accuracy as a function of the information available (ongoing: test release impacts) • Many measures of forecast accuracy and possibility to perform analysis by subsamples (ongoing: Giacomini and Rossi, 2010)
  • 69.
    You are thepilot • Think about the most suitable forecasting model • Understand the data and assess model fit • Before using your model out-of-sample , use our “simulator” to become aware of the risks • Good luck! SUMMARY (α=5%) Features • Simulates forecasting scenarios using real-time data availability (users can define the release calendar in a simple manner) • Check whether a new model yields statistically significant gains in forecasting accuracy with respect to alternatives • Robust quantification of forecast accuracy as a function of the information available (ongoing: test release impacts) • Many measures of forecast accuracy and possibility to perform analysis by subsamples (ongoing: Giacomini and Rossi, 2010)
  • 70.
  • 71.
    PERIODOGRAM Decomposes the sumof squares of the growth rates in terms of the Fourier coefficients A quick look at Production Index Manufacturing (Germany)
  • 72.
  • 73.

Editor's Notes

  • #2  We show how JDemetra+ can be used for monitoring the German business cycle and visualizing how the real-time dataflow contributes to automatically update our perception of the economy. The formalization of the nowcasting problem, which is not specific to the use of dynamic factor models, allows to take into account timeliness and quality as key parameters that define the market impact of data releases.
  • #11 SKIP!!!
  • #12 SKIP!!!
  • #13 SKIP!!!
  • #37  - Initialize with result from EM - Initizlize with a pseudo-ML estimator
  • #43 The forth step required to evaluate the forecasts of any model: decide on the sample
  • #52 Revision uncertainty benchmark: RMSE obtained by taking the “Flash GDP” estimate as a nowcast for the “Last available” GDP
  • #57 But what is important is to summarize those forecast errors we have seen: For each information assumption you select (represented in the columns), we can compute RMSE, MAE, or MdAE If your data is in levels, and not in growth rates, you may want to look at the “percentage errors instead”, and of course you can always scale those accuracy measures using a benchmark
  • #70 …. Because there IS a risk