Download to read offline

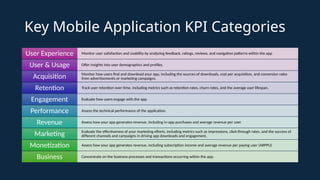
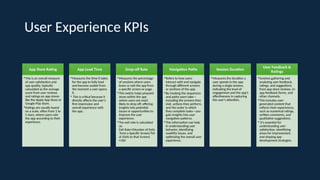

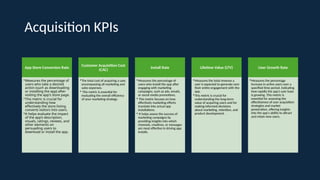
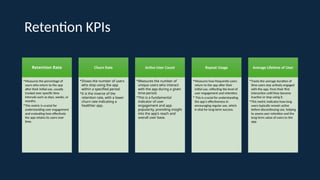


The document outlines key performance indicators (KPIs) for mobile applications, categorized into user satisfaction, user engagement, acquisition, retention, performance, revenue, marketing, and business metrics. It emphasizes the importance of metrics like app store ratings, user acquisition cost, retention rates, and revenue per user to evaluate app effectiveness and success. Additionally, it highlights the role of user demographics and feedback in optimizing user experience and the application's overall performance.