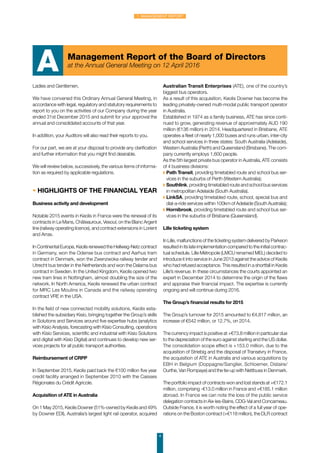
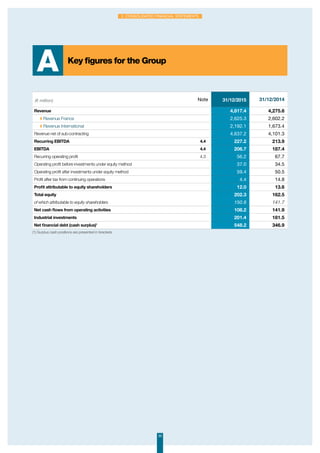
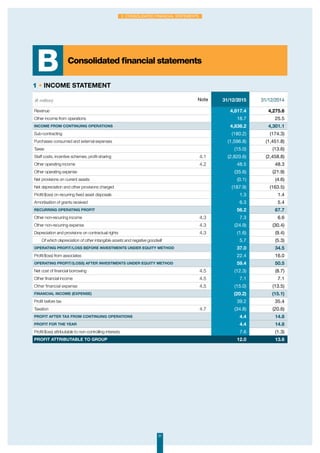
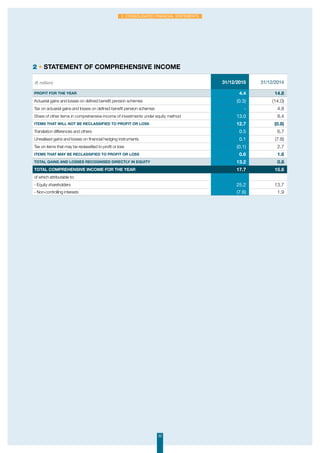
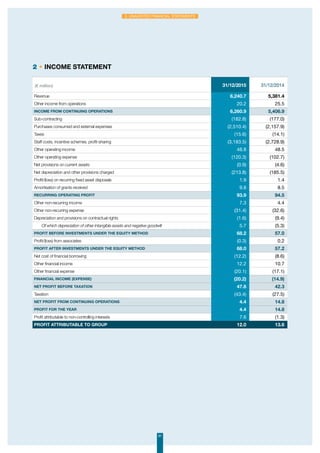
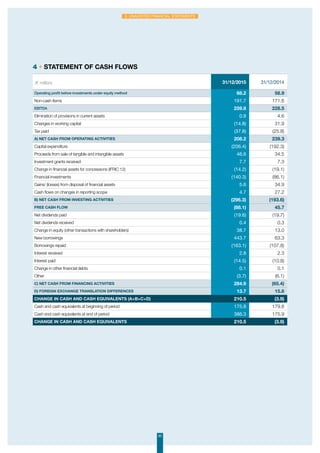
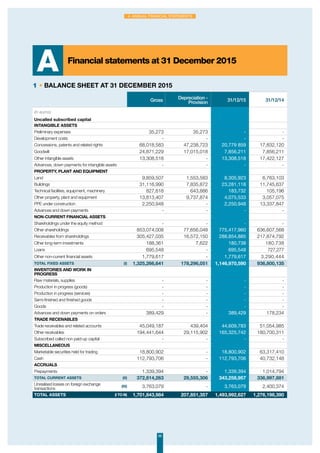
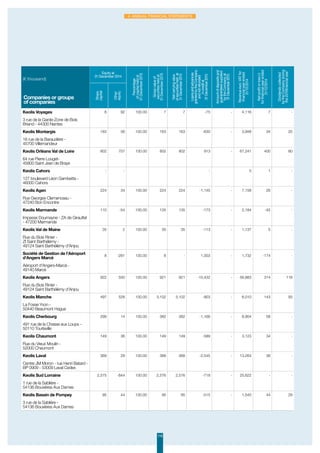
financiAL rEport 2015
keolis s.a.
CONTENTS
1. Management Report ..................................... 3
Management Report of the Board
of Directors at the Annual General Meeting
on 12 April 2016....................................................................4
Appendix 1.............................................................................9
Appendix 2.......................................................................... 26
Appendix 3.......................................................................... 27
Appendix 4.......................................................................... 27
2. consolidATED
FINANCIAL STATEMENTS ................................ 29
Key figures for the Group................................................ 30
Consolidated financial statements............................... 31
Notes to the consolidated financial
statements........................................................................... 36
Statutory auditors’ report on the
consolidated financial statements ............................... 86
3. Unaudited management
financial statements ................................ 89
Key figures........................................................................... 90
Income statement............................................................. 91
Statement of financial position...................................... 92
Statement of cash flows.................................................. 93
4. Annual Financial Statements ......... 95
Financial statements at 31 December 2015 ............. 96
Notes to the Annual Financial Statements ............. 100
Information on subsidiaries
and non-consolidated investments ........................... 113
Statutory auditors’ report
on the financial statements.......................................... 128
33
1. Management Report
A Management Report of the Board of Directors. . . . . . . . . . . . . . . . . . . . . . . . . . . . . . . . . . . . . . . . . . . . . 4
B Appendices. . . . . . . . . . . . . . . . . . . . . . . . . . . . . . . . . . . . . . . . . . . . . . . . . . . . . . . . . . . . . . . . . . . . . . . . . . . . . . . . . . 9
Appendix 1
Non-financial data. . . . . . . . . . . . . . . . . . . . . . . . . . . . . . . . . . . . . . . . . . . . . . . . . . . . . . . . . . . . . . . . . . . . . . . . . . . . . . . . . 9
Appendix 2
List of terms of office or functions performed in 2015 in other companies
by the executive officers of Keolis. . . . . . . . . . . . . . . . . . . . . . . . . . . . . . . . . . . . . . . . . . . . . . . . . . . . . . . . . . . . . . . . . . .  26
Appendix 3
Summary of delegations of powers and authorities granted by the General Assembly
of the Board with regard to capital increases. . . . . . . . . . . . . . . . . . . . . . . . . . . . . . . . . . . . . . . . . . . . . . . . . . . . . . . . . . .  27
Appendix 4
Table of earnings for the past five financial years. . . . . . . . . . . . . . . . . . . . . . . . . . . . . . . . . . . . . . . . . . . . . . . . . . . . . . .  27
CONTENTS
Management Report of the Board of Directors
at the Annual General Meeting on 12 April 2016
A
4
1. Management Report
Ladies and Gentlemen,
We have convened this Ordinary Annual General Meeting, in
accordance with legal, regulatory and statutory requirements to
report to you on the activities of our Company during the year
ended 31st December 2015 and submit for your approval the
annual and consolidated accounts of that year.
In addition, your Auditors will also read their reports to you.
For our part, we are at your disposal to provide any clarification
and further information that you might find desirable.
We will review below, successively, the various items of informa-
tion as required by applicable regulations.
• HIGHLIGHTS OF THE FINANCIAL YEAR
Business activity and development
Notable 2015 events in Keolis in France were the renewal of its
contracts in Le Mans, Châteauroux, Vesoul, on the Blanc Argent
line (railway operating licence), and contract extensions in Lorient
and Arras.
In Continental Europe, Keolis renewed the Hellweg-Netz contract
in Germany, won the Odense bus contract and Aarhus tram
contract in Denmark, won the Zwenzwoka railway tender and
Utrecht bus tender in the Netherlands and won the Dalarna bus
contract in Sweden. In the United Kingdom, Keolis opened two
new tram lines in Nottingham, almost doubling the size of the
network. In North America, Keolis renewed the urban contract
for MRC Les Moulins in Canada and the railway operating
contract VRE in the USA.
In the field of new connected mobility solutions, Keolis esta-
blished the subsidiary Kisio, bringing together the Group’s skills
in Solutions and Services around five expertise hubs (analytics
with Kisio Analysis, forecasting with Kisio Consulting, operations
with Kisio Services, scientific and industrial with Kisio Solutions
and digital with Kisio Digital) and continues to develop new ser-
vices projects for all public transport authorities.
Reimbursement of CRPP
In September 2015, Keolis paid back the €100 million five year
credit facility arranged in September 2010 with the Caisses
Régionales du Crédit Agricole.
Acquisition of ATE in Australia
On 1 May 2015, Keolis Downer (51%-owned by Keolis and 49%
by Downer EDI), Australia’s largest light rail operator, acquired
Australian Transit Enterprises (ATE), one of the country’s
biggest bus operators.
As a result of this acquisition, Keolis Downer has become the
leading privately-owned multi-modal public transport operator
in Australia.
Established in 1974 as a family business, ATE has since conti-
nued to grow, generating revenue of approximately AUD 190
million (€136 million) in 2014. Headquartered in Brisbane, ATE
operates a fleet of nearly 1,000 buses and runs urban, inter-city
and school services in three states: South Australia (Adelaide),
Western Australia (Perth) and Queensland (Brisbane). The com-
pany currently employs 1,600 people.
As the 5th largest private bus operator in Australia, ATE consists
of 4 business divisions:
◗	Path Transit, providing timetabled route and school bus ser-
vices in the suburbs of Perth (Western Australia);
◗	Southlink, providing timetabled route and school bus services
in metropolitan Adelaide (South Australia).
◗	LinkSA, providing timetabled route, school, special bus and
dial-a-ride services within 100km of Adelaide (South Australia);
◗	Hornibrook, providing timetabled route and school bus ser-
vices in the suburbs of Brisbane (Queensland).
Lille ticketing system
In Lille, malfunctions of the ticketing system delivered by Parkeon
resulted in its late implementation compared to the initial contrac-
tual schedule. Lille Métropole (LMCU renamed MEL) decided to
introduce it into service in June 2013 against the advice of Keolis
who had refused acceptance. This resulted in a shortfall in Keolis
Lille’s revenue. In these circumstances the courts appointed an
expert in December 2014 to determine the origin of the flaws
and appraise their financial impact. The expertise is currently
ongoing and will continue during 2016.
The Group’s financial results for 2015
The Group’s turnover for 2015 amounted to €4,817 million, an
increase of €542 million, or 12.7%, on 2014.
The currency impact is positive at +€73.8 million in particular due
to the depreciation of the euro against sterling and the US dollar.
The consolidation scope effect is +153.0 million, due to the
acquisition of Striebig and the disposal of Transévry in France,
the acquisition of ATE in Australia and various acquisitions by
EBH in Belgium (Doppagne/Sanglier, Schloemer, Dislaire/
Ourthe, Van Rompaye) and the tie-up with Nettbuss in Denmark.
The portfolio impact of contracts won and lost stands at +€172.1
million, comprising -€13.0 million in France and +€185.1 million
abroad. In France we can note the loss of the public service
delegation contracts in Aix-les-Bains, CDG-Val and Concarneau.
Outside France, it is worth noting the effect of a full year of ope-
rations on the Boston contract (+€118 million), the DLR contract
5
1. Management Report
in London (+€95 million) and the loss of E23 in Sweden (-€27
million).
Excluding foreign exchange impact and change in reporting
scope, revenue is up +€315 million / +7.4%.
Organic growth within existing contracts stands at +€145.7
million +3.4%, comprising -€20.2 million for France (large
networks +€11.9 million, major urban +€5.5 million, Territories
-€2.3 million, Ile-de-France +€5.0 million), and +€126.5 million
for international activities (+€4.8 million in the UK, +€33.7 million
in Continental Europe, +€15.7 million in North America and
+€72.6 million in Australia).
Recurrent consolidated EBITDA stands at €227.2 million, up
+€13.3 million, or +6.2%, on the previous year. The currency
impact accounts for -€5.2 million.
The consolidation scope effect improves recurring EBITDA by
+€19.0 million, comprising +€3.7 million in France (including
+€3.4 million for the acquisition of Striebig) and +€15.3 million
outside France (+€4.2 million for the Belgian acquisitions, +€2.8
million for the Nettbuss tie-up in Denmark and +€8.3 million for
ATE in Australia).
The organic variation of EBITDA including portfolio growth
stands at -€5.1M€ / -2.3%, with +€10,9 million coming from
France and -€3.2 million from international activities (the growth
of the UK and Continental Europe zones have not fully counter-
balanced the poor results of North America, Australia and New
Territories). An action plan has been established and is currently
being deployed to boost North America and in particular re-
establish profitability on the Boston contract.
Operational costs of the holding company are -€9.2 million
higher than in 2014, of which 4.3 million relates to the unwinding
of diesel hedges.
Recurrent operating profit stands at €56.2 million, down -€17.0
million compared to 2014. One of the reasons for this is the entry
into force of a new agreement relating to payments due on reti-
rement.
Net income (Group share) for 2015 amounts to €12.0 million as
against €13.5 million in 2014.
Cash flow generation is -€183.8 million in 2015 (including
-€119.9 million due to acquisitions) compared to -€74.3 million
in 2014.
The net debt of Keolis S.A. amounts to €223.9 million at the end
of 2015 compared to €99.4 million at the end of 2014. The
increase is essentially a consequence of the Group’s active
external growth policy.
• CONSOLIDATED FINANCIAL
STATEMENTS
The consolidated financial statements are prepared in accor-
dance with IFRS as adopted by the European Union.
Revenues from ordinary activities amount to €4,836 million.
After taking into account all operating costs, operating profit after
investments under the equity method amounts to €59 million.
Consolidated net profit (group share) amounts to €12 million.
• ANNUAL FINANCIAL STATEMENTS
The financial statements of the Company are prepared in accor-
dance with French GAAP.
Operating profit/(loss), including share of joint ventures, was
(€17,757) thousand compared with (€15,769) thousand in 2014.
Financial income amounted to €40,858 thousand as against
€17,181 thousand in 2014.
After the posting of an exceptional loss of €890 thousand and a
corporate income tax credit of €15,388 thousand, Keolis’ finan-
cial statements show a net profit of €37,600 thousand.
• SUBSIDIARIES AND HOLDINGS
Thetableattachedtoourbalancesheetprovidesallthenecessary
information concerning our company’s subsidiaries and holdings.
• NOTIFICATION OF MAJOR HOLDINGS
AND ACQUISITIONS OF CONTROL
During the financial year 2015, Keolis S.A. acquired or took
control of the following companies:
Acquisition of companies in France
Name Date Percentage
Voyages A. Fouache 15/10/2015 100% Keolis
Fouache Evasion 15/10/2015 100% Keolis
Prioris 30/10/2015 34% of shares held
by SIA
Forcity 18/03/2015 Acquisition of a
5% share
OnePark 14/10/2015 Acquisition of a
20.25% share
6
1. Management Report
• RESEARCH AND DEVELOPMENT
ACTIVITY
The company did not incur any research-related expenditure
during the year. Many development activities for new products
and services are, however, carried out closer to the operational
managers to ensure their ability to meet market requirements.
The corresponding expenses are not isolated in profit or loss and
have not been specifically monitored.
• FORESEEABLE TRENDS AND
FUTURE OUTLOOK
In France, the Group intends to consolidate its current positions
and will remain attentive to any opportunities. Keolis has entered
into exclusive negotiations with the Lyon public transport autho-
rity for the renewal of its operating contract. The Group is also
responding to invitations to tender to renew its operating
contracts for networks in Dijon, Artois-Gohelle and Laval.
Keolis wishes to develop its international footprint and will exa-
mine all the opportunities related to the chain of mobility in the
territories where it is already established and also in new
countries.
• SIGNIFICANT EVENTS SINCE
THE END OF THE YEAR
• Acquisition of Transports Daniel Meyer
In January 2016, the Keolis Group announced the acquisition of
a leading bus and coach service operator in Ile-de-France,
Transports Daniel Meyer. With this strategic external growth
transaction, Keolis reinforces its foothold in Ile-de-France and
consolidates its position for future projects relating to Grand Paris
Express. Keolis Ile-de-France, which generated 400 million euros
of turnover in 2014, operates a fleet of 1,900 vehicles across 25
depots. Established in all of the departments comprising the
Acquisition of companies abroad
Name Date Percentage
HORNIBROOK TRANSIT
MANAGEMENT PTY
LTD
27/05/2015
KEOLIS DOWNER
BUS AND
COACHLINES PTY
LTD: 100%
SOUTH WEST TRANSIT
PTY LTD
27/05/2015
HORNIBROOK
TRANSIT
MANAGEMENT
PTY LTD: 100%
AUSTRALIAN TRANSIT
ENTERPRISES PTY LTD
27/05/2015
HORNIBROOK
TRANSIT
MANAGEMENT
PTY LTD: 100%
HORNIBROOK BUS
LINES PTY LTD
27/05/2015
KEOLIS DOWNER
BUS AND
COACHLINES PTY
LTD: 83.33%
HORNIBROOK
TRANSIT
MANAGEMENT
PTY LTD: 16.67%
PATH TRANSIT PTY LTD 27/05/2015
AUSTRALIAN
TRANSIT
ENTERPRISES:
100%
SOUTHLINK PTY LTD 27/05/2015
AUSTRALIAN
TRANSIT
ENTERPRISES:
100%
LINKSA PTY LTD 27/05/2015
AUSTRALIAN
TRANSIT
ENTERPRISES:
100%
MASABI 23/10/2015 Acquisition of a
5.13% share
Establishment of companies in France
Name Date Percentage
KEOLIS BASSIN
D’ARCACHON
26/02/2015 100% Keolis S.A.
KEOLIS ORLY RUNGIS 03/03/2015 100% Keolis Seine
Val de Marne
KEOLIS ALES 11/08/2015 100% Keolis S.A.
TRANSKEO 07/10/2015
51% Keolis S.A.
49 % SNCF
Participations
KEOLIS BEAUNE 23/11/2015 100% Keolis S.A.
KEOLIS ROISSY
SERVICES
AEROPORTUAIRES
01/12/2015 100% Keolis S.A.
KEOLIS PORTE DE
L’ISERE
02/12/2015 100% Keolis S.A.
KLP02 14/12/2015 100% Keolis S.A.
KLP03 14/12/2015 100% Keolis S.A.
Establishment of companies abroad
Name Date Percentage
KEOLIS DOWNER BUS
AND COACHLINES PTY
LTD
10/03/2015
KEOLIS DOWNER
PTY LTD: 100%
KEOLIS DOWNER BUS
AND COACHLINES
PROPERTY PTY LTD
10/03/2015
KEOLIS DOWNER
BUS AND
COACHLINES PTY
LTD: 100%
KEOLIS AMEY
METROLINK LIMITED
13/11/2015
KEOLIS (UK)
LIMITED: 60%
AMEY RAIL
LIMITED: 40%
7
1. Management Report
Paris region, its 19 subsidiaries employ 4,000 people and carry
70 million passengers each year. The group Transports Daniel
Meyer has 440 employees and a fleet of 260 vehicles. It gene-
rated a turnover of 40.4 million euros in 2014. Its main line of
business is in the operation of approximately 50 timetabled bus
lines, supplemented by school buses and school outings and
charter activity.
• NON-FINANCIAL INFORMATION
In application of article of the Act of Parliament of 12 July 2010
on the national commitment to the environment, the so-called
“Grenelle” II, Keolis S.A., as a non-listed company whose
balance sheet or net revenue exceeds 100 million euros and
whose average number of permanent employees during the
financial year exceeds 500, is obliged to publish its non-financial
data in its management report.
For the benefit of readers, we publish all of this information in the
chapter “Non-financial data” appended to this document.
(Appendix 1)
It should be noted that the consolidation scope applicable to this
information has the same basis as that used for financial conso-
lidation.
Furthermore, four Keolis subsidiaries will publish their own non-
financial data insofar as they attain the thresholds for the appli-
cation of the abovementioned article 225. These subsidiaries are
Keolis Bordeaux, Keolis Lille, Keolis Lyon and Keolis Rennes.
€ thousand FY 2015 FY 2014
Breakdown by invoice due date
- Invoices due: (173) (396)
◗ from 0 to 30 days 30 203
◗ from 31 to 60 days 186 (143)
◗ over 60 days (389) (456)
Invoices not yet due 7,656 13,605
Trade payables 7,483 9,011
Amounts owing by suppliers 2,180 2,682
Supplier invoices not yet received 30,653 29,124
TOTAL 40,316 45,016
Trade payables and related
accounts 35,264 37,827
Liabilities on assets and related
accounts 5,052 7,189
TOTAL 40,316 45,016
• ALLOCATION OF PROFIT
We propose to allocate the profit for the year, amounting to
€37,599,518.44, in the following manner:
Profit for the year €37,599,518.44
DISTRIBUTABLE PROFIT €37,599,518.44
Allocation:
Miscellaneous reserves €37,599,518.44
Total €37,599,518.44
• INFORMATION ON SUPPLIER
PAYMENT SETTLEMENT
In accordance with articles L 441-6-1 and D 441-4 of the
Commercial Code, we breakdown, as at the end of the last
financial year, the balance of amounts owing to our suppliers by
due date:
8
1. Management Report
Non tax deductible expenses
We inform you that in the course of the past financial year, non-
tax deductible expenses, within the meaning of Articles 223
quater and 223 quinquies of the General Tax Code, totalled
233K€.
• SHAREHOLDINGS
On 31st December 2015, GROUPE KEOLIS S.A.S. owned
100% of the capital.
• EMPLOYEE SHARES IN THE CAPITAL
On 31st December 2015, there were no employee shares in the
Company’s capital.
• AGREEMENTS COVERED BY
ARTICLES L225-38 AND L225-102-1
OF THE COMMERCIAL CODE
1. Agreements covered by article L.225-38 of the
Commercial Code
You will be read the Statutory Auditors’ report on agreements
made during the fiscal year and authorised by your Board
pursuant to Article L225-38 of the Commercial Code.
2. Agreements covered by article L.225-102-1, last
paragraph
Pursuant to the provisions of the last paragraph of article L.225-
102-1 of the Commercial Code, we specify that during the finan-
cial year no agreements were entered into other than ordinary
transactions concluded at normal terms and conditions,
between:
◗ a director, the Chairman  CEO or the Company GROUPE
KEOLIS S.A.S., a company holding more than 10% of the
voting rights in Keolis S.A.,
And
◗ a subsidiary in which Keolis S.A. directly or indirectly holds a
share in excess of 50%.
• DIRECTORS AND CONTROL OF THE
COMPANY
1. Mode of exercise of the General Management
We report, in accordance with Article 148 of the Decree of 23rd
March 1967, that your Board of Directors has opted to combine
the functions of Chairman of the Board and CEO.
Mr. Jean-Pierre Farandou was re-appointed Chairman and CEO
during the Board of Directors’ deliberations of 3 March 2016.
2. Terms of office and functions exercised by each of the
executive officers
A list of the terms of office and functions exercised by each of
the executive officers in 2015 is appended to this report.
We hope that you will approve the above proposals and vote the
resolutions to be submitted to you.
THE BOARD OF DIRECTORS
Financialyear
Dividend
Distributedincome
eligibleforthe
allowance
Distributedincome
noteligibleforthe
allowance
2014
€19,130,937.70
€4.90 per share
- €19,130,937.70
2013
€19,130,937.70
€4.90 per share
- €19,130,937.70
2012
€19,130,937.70
€4.90 per share
- €19,130,937.70
In accordance with legal requirements, you are requested to note
that the amount of the dividend distributed and that of the cor-
responding dividend tax credit for the three previous financial
years were as follows:
Appendix 1
Non-financial dataB
1 • methodology
1.1 Background
Keolis S.A. has voluntarily published non-financial data in the
Keolis Group annual report for more than ten years.
2015 is the second financial year in which non-financial data is
published in the Keolis S.A. financial report, in application of
Article 225 of the Act of 12 July 2010 on the national commit-
ment to the environment. The entity concerned is Keolis S.A., a
non-listed company for which the balance sheet total or net
revenue is in excess of 100 million euros and for which the ave-
rage number of permanent employees throughout the financial
year exceeds 500.
In 2014, the set of indicators was revised and the reliability of the
scope improved. 2014 can therefore be considered as the year
of reference (year 0). This publication thus includes data for the
past two years: 2014 and 2015.
The references indicated at the beginning of each paragraph
refer to the articles of the Implementation Decree followed for the
purposes of this publication.
1.2 Scope
Non-financial data is consolidated on the same scope as finan-
cial data (excluding EFFIA S.A., Technical Assistance and sub-
sidiaries for which Keolis is not the majority shareholder).
The scope of consolidation for employee data is the calendar
year, from 1 January to 31 December.
Generally, social data relates to all Group staff. This scope varies
by indicator, and depends on the availability of data at the time
of this report being approved for print.
The scope for company data also covers 100% of Group staff.
The reference period for environmental data is the calendar year,
from 1 January to 31 December. If this is not the case, rules for
estimation or consolidation on a deferred timescale are pro-
posed to subsidiaries in the set of indicators.
Environmental data has been calculated from data covering 82%
of Group staff (represented by 48 subsidiaries and 42 lower-tier
subsidiaries).
This scope may also vary depending on the availability of data
at the time of this report being approved for print.
1.3 Quantitative information
We have added new qualitative data indicated in italics in the list
below. The data for some of these items is only available for
2015.
Some items of data published last year have been adjusted to
account for corrections/additions supplied after the publication
of last year’s report. These are indicated by an asterisk appended
to the updated figure.
In view of the current collection process, data that is not available
for this publication will be communicated next year.
Social responsibility / human resources
Workforce: workforce registered as at 31 December in all
Group subsidiaries and Keolis S.A.
Breakdownofworkforcebygeographicalzone:breakdown
by country of workforce registered as at 31 December.
Breakdown of workforce by age bracket: breakdown of
total Group and Keolis S.A. workforces by age bracket. The
comprehensive 2014 data supplied refers to the total Group
workforce, including Keolis S.A. and excluding Docklands Light
Railway (UK), and Keolis Deutschland (36 employees in
Germany).
9
1. Management Report
Keolis, a leading public transport operator, plays its part in sustainable development through a wide range of cor-
porate initiatives. The different aspects of this Social Responsibility are shared between the relevant departments-
Health Safety Environment, Legal, Human Resources, Purchasing and Communications. The Health, Safety and
Environment department is responsible for coordinating Social Responsibility.
Social Responsibility is an item on the agenda of Keolis’ Executive Committee at least once a month in order to
review work undertaken, approve new initiatives and select the topics to be highlighted.
In addition to this, Keolis draws on discussions with its internal and external stakeholders to define the strategy
and recommendations for the entire Group.
Percentage of women in the total workforce: percentage
of women in the total workforce of the Group and Keolis S.A.
The comprehensive 2014 data supplied refers to the total Group
workforce, including Keolis S.A. and excluding Docklands Light
Railway (UK), China (2 employees) and the United Arab Emirates
(7 employees).
Total number of new employees: the cumulative number of
new employees in France for the year, (including the integration
of new subsidiaries), regardless of type of employment contract.
Total number of departures: the cumulative number of depar-
tures in France for the year, regardless of the reason for leaving
(excluding expired fixed-term contracts but including the loss of
subsidiaries during the year).
Total number of dismissals: refers to cumulative number of
departures in France during the year relating to dismissals.
Payroll: Group personnel expenditure, including wages and
social charges, duties and taxes on remuneration and other
personnel expenses (ancillary costs, directors’ fees, employee
profit sharing, temporary staff and staff on secondment).
Change in payroll: change in payroll between years N and N-1
in gross value and expressed as a percentage.
Percentage of part-time employees: percentage of
employees with a part-time contract in the total workforce in
France as at 31 December.
Percentage of drivers: percentage of driver employees in the
total Group workforce as at 31 December.
Rate of absence for sick leave: measures the rate of sick
leave, in France.
Workplace accident frequency rate: measures the frequency
of workplace accidents declared per quarter leading to at least
one day of leave. This rate represents the average number of
workplace accidents leading to leave by a group of employees
having worked one million hours over the period considered.
Data available for this publication for France. NB: This rate
includes violent behaviour. It does not take into account all
ongoing dispute procedures.
Severity rate of workplace accidents: measures the severity
of accidents by assessing the total number of leave days due to
workplace accidents, excluding the day of the accident itself.
This represents the number of days compensated for 1,000
hours worked, in other words the number of days lost due to
temporary invalidity for 1,000 hours worked. Data available for
France.
Total number of training hours: the 2015 data relates to all of
the employees in the Group. Complete data for 2014 is only
available for France.
Number of employees having received training: 2015 data
relates to all of the employees in the Group. Complete data for
2014 is only available for France.
Total number of workers with a disability (number of
units): relates to the number of entitlement units calculated as
part of the mandatory annual declaration of the employment of
workers with a disability submitted to the Agefiph (DOETH) in
France. This entitlement unit is the full-time equivalent of a wor-
ker with a disability.
Environment
Environmental data concerns consolidated operational subsi-
diaries and not the entity Keolis S.A., which has an administrative
function and does not operate passenger transport.
Number of employees covered by an ISO 14001 certifica-
tion: relates to employees registered in the workforce at 31
December exercising an ISO 14001 certified activity.
Percentage of employees covered by an ISO 14001 certi-
fication: relates to the number of employees exercising an ISO
14001 certified activity as a proportion of the total Group work-
force.
Total quantity of hazardous waste: this measures the total
weight of hazardous waste produced over the year in question,
regardless of the type of processing. Hazardous waste is waste
defined as such in the regulations applicable to the production
site.
Total quantity of non-hazardous waste: this measures the
total weight of non-hazardous waste produced over the year in
question, regardless of the type of processing. Non-hazardous
waste is waste defined as such in the regulations applicable to
the production site.
Percentage of recovered hazardous waste: this measures
the percentage of non-hazardous waste recovered over the year
in question, regardless of the type of processing, in 24 subsidia-
ries (accounting for 44% of total Group workforce). Recovery is
a type of waste processing operation defined as such in the
regulations applicable to the production site.
Percentage of recovered non-hazardous waste: this mea-
sures the percentage of non-hazardous waste recovered over
the year in question, regardless of the type of processing, in 32
subsidiaries (accounting for 60% of total Group workforce).
Recovery is a type of waste processing activity defined as such
in the regulations applicable to the production site.
10
1. Management Report
Total water consumption of the sites: this corresponds to
the volume of drinking water purchased by the subsidiary over
the period in question, charged to buildings and processes,
excluding watering of planted areas.
Share of water consumption in water-shortage areas (per
country): this corresponds to the consumption of drinking water
in Keolis countries where water stress is very high (between 40
and 80%) or extremely high (over 80%). In 2015, these countries
were Australia and Belgium (according to the World Resources
Institute).
Traction energy consumption for commercial vehicle
fleets (in TOE, excluding rail): traction energy consumption
for commercial vehicle fleets corresponds to the quantity of
energy purchased within the framework of commercial services
(dead mileage included). The vehicles concerned are those
operated/owned by the company used for commercial services,
on behalf of others (passengers, Public Transport Authorities,
other transport providers, corporate customers). The indicator
incorporates all means of transport (bus, coach, metro, tram,
trolleybus).
Traction energy consumption for commercial railway use
(in TOE): traction energy consumption for commercial railway
use corresponds to the quantity of energy purchased within the
framework of commercial services provided by rail (electrical or
thermal traction), dead mileage included.
Energy consumption of company facilities (in TOE): energy
consumption of the sites corresponds to the quantity of energy
consumed or purchased on the sites, excluding traction energy.
CO2
emissions from commercial transport and company
facilities (in TCO2
e): Greenhouse Gases emitted by the cor-
responding use of energy.
1.4 Qualitative information
Qualitative information does not require any particular explana-
tions.
11
1. Management Report
2 • Social data
2.1 Employment
Article
code
Subject of
decree
2015 data 2014 data Indicator
I-1-a-1
– total workforce
and breakdown
of employees
by gender,
age and
geographical
location
54,749
including 1,468 Keolis S.A.
53,434*
including 1,414 Keolis S.A.
Number of
employees
registered
as at 31
December
32,630
incl. 1,468
6,107
4,038
3,879
2,468
1,482
1,250
1,133
819
432
391
108
8
4
France
Keolis S.A.
Sweden
Australia
United States
Belgium
Denmark
Netherlands
UK
Canada
Germany
India
Norway
China
United Arab Emirates
32,759*
including 1,414
6,802
3,721*
2,395
2,309
1,440
1,292
1,035*
843
403
326
100
7
2
	
France
Keolis S.A.
Sweden
United States
Belgium
Australia
Denmark
Netherlands
UK
Canada
Germany
India
Norway
China
United Arab
Emirates
Total number of
employees per
country
Group
1,701 (3%)
3,930 (7%)
5,367 (10%)
6,013 (11%)
7,512 (14%)
8,395 (15%)
9,075 (17%)
7,941 (15%)
3,294 (6%)
1,485 (3%)
Keolis S.A.
79 (5%)
202 (14%)
239 (16%)
211 (14%)
249 (17%)
185 (13%)
151 (10%)
116 (8%)
32 (2%)
4 (0%)
 or = 25 years
26 to 30 years
31 to 35 years
36 to 40 years
41 to 45 years
46 to 50 years
51 to 55 years
56 to 60 years
61 to 65 years
Over 65 years
Number of
employees per
age bracket
20.1%
Keolis S.A.: 40%
20.4%*
Keolis S.A.: 40.2%
% of women in
the total workforce
I-1-a-2
– new hires and
dismissals
6,318
of which Keolis S.A.: 269
5,552*
of which Keolis S.A.: 303
Total number of
new employees
2,910
of which Keolis S.A.: 172
2,490*
of which Keolis S.A.: 147*
Total number
of departures,
excluding expiring
fixed-term
contracts
756
of which Keolis S.A.: 38
661*
of which Keolis S.A.: 47*
Total number of
dismissals
I-1-a-3
– remuneration
and its variation
2,820.6 2,458.8* Payroll in € million
+14.7% +9.8%*
% of change in
payroll
361.8 219.5*
Change in payroll
in € million
12
1. Management Report
2.2 Organisation of work
Absenteeism is an issue monitored locally by each Keolis Group subsidiary. In addition to local action plans, Keolis Group has
defined, via its corporate project, joint areas for progress in order to permanently control the rate of absence and ensure the well-
being of employees. Time has been spent better defining the roles and responsibilities of local managers and developing their skills.
The regular monitoring of absence has also become one of their tasks.
2.3 Social relations
-	Organisation of social dialogue, particularly staff information, consultation procedures and negotiations (article I-1-
c-1)
Each Group subsidiary, regardless of the country where it is active, has employee representative bodies in accordance with local
legislation. However, the structure, prerogatives and obligations of these bodies vary greatly from one country to the next, depending
on locally applicable legislation.
In France, the management of each subsidiary chairs these representative bodies and can negotiate company-wide agreements
with the subsidiary’s trade union delegates. All subsidiaries in France with over 50 employees have a works council and committees
for health, safety and working conditions (CHSCT).
The employee relations department of Keolis Group ensures that all subsidiaries have the necessary tools for their representative
bodies to operate in optimal conditions. It regularly contributes to subjects that may have an impact on the road transport sector
and provides updates on the legal situation via a two-monthly employee newsletter. In 2015, the following were supplied to Group
subsidiaries:
◗	Legal memos relating firstly to the transfer of staff following the win or loss of an interurban transport contract, and secondly to
industrial action in urban transport,
◗	A “career interview” kit to facilitate the introduction of this new interview in subsidiaries,
◗	Employment contract templates.
In addition to this legal information, a new vocational training management solution, Sage Formation, is currently being deployed
in subsidiaries. This new tool will enable better monitoring of training followed by Group employees and career interviews conduc-
ted. Finally, a Group procedure memo relating to checking driving licences was sent out to all subsidiaries to ensure that all Group
employees tasked with driving have a valid driving licence.
•	Review of collective agreements (article I-1-c-2)
The Keolis Group has an agreement concerning how the European Works Council should function. Keolis Group subsidiaries have
come to their own agreements at local level. In addition to these agreements, Keolis has implemented numerous unilateral decisions
to ensure that a minimum set of measures applies to certain fundamental issues.
Article
code
Subject of decree 2015 data 2014 data Indicator
I-1-b-1
– organisation of
working time
16.65%
Keolis S.A.: 3.15%
16.73%*
Keolis S.A.: 3.09%*
Percentage of part-time
employees
67.5%
Keolis S.A.:0%
68.5%*
Keolis S.A.: 0%
Percentage of driver employees
II-1-b-1 – rate of absence
5.86%
Keolis S.A.: 1.39%
5.63%
Keolis S.A.: 1.23%*
Rate of absence for sick leave
13
1. Management Report
2.4 Health and safety
-	Health and safety at work (article I-1-d-1)
Following the 2014 launch of the Group’s safety approach as an essential workstream in the corporate programme, all specialist
job areas and in particular those of operations and maintenance are clearly concerned. The vast majority of subsidiaries in France
and abroad have reached level 2, qualified as ‘common practice’ on the Group’s scale of maturity. This level guarantees basic
compliance of safety management relating to employees and stakeholders, in particular our partners and subcontractors.
Training in roles and duties was extended to more than 400 managers, notably working in the operation and maintenance fields.
A safety and environment prevention guide was also distributed to more than 20,000 employees. This will be extended to interna-
tional activities in 2016.
The use of the Knowledge Management tool Keoshare by the safety and environment community enabled the exchange of best
practices and the passing down of recommendations.
Internal audits have revealed that continuous improvement is ongoing.
-	Reviewofagreementsconcludedwithtradeunionorganisationsorstaffrepresentativeorganisationsintermsofhealth
and safety at work (article I-1-d-2)
As previously stated concerning collective agreements, the Keolis Group has an agreement as to how the European Works Council
should function. Keolis Group subsidiaries have come to their own agreements at a local level. In addition to these agreements,
Keolis made a number of unilateral decisions to ensure that a minimum set of measures in relation to fundamental issues.
2.5 Training
-	Policies implemented in terms of training (article I-1-e-1)
Keolis Group considers training as a tool to benefit its employees’ development at every stage of their career path.
Keolis commits to developing the skills of each employee according to their area of expertise in order to foster their career deve-
lopment, facilitate internal mobility and master key skills for the Group’s growth. Training has therefore been designed according to
a logical career path.
To this effect Keolis developed the training path ‘D’FI’ in 2015 aimed at subsidiary directors who have just arrived in their position.
This programme is spread over a year and alternates between sessions focusing on developing leadership skills and sessions to
improve specialist knowledge. The programme is designed and delivered by in-house specialists and external trainers and coaches,
with, as a common thread, the creation of a project presented to the France Division at the end of the programme.
Keolis also devised a programme tailored for the Tram Maintenance community comprising initial training but also ongoing courses
in the areas of rolling stock and infrastructure. In 2015, approximately fifty people followed the course, which will be further deployed
in 2016.
Keolis continued to develop its courses for young managers in 2015. These courses include practical training on transport and time
spent in the subsidiaries to give them the opportunity to become familiar with the professions and activities covered by the company.
In 2015, 26 people took this course in the areas of operations, marketing and maintenance, up 36% on the previous year. Since
2015, these incubators are open to in-house applicants from our operational work areas, which facilitates the career mobility of our
supervisors.
With the launch of the Group Training Department in 2015, Keolis intends to accelerate the reinforcement of the company culture,
the development of a common base of expertise in all Group countries and the support provided to the Group in setting up in new
Article
code
Subject of decree 2015 data 2014 data Indicator
II-1-d-1
– workplace
accidents, notably
their frequency
and severity, and
occupational illness
46.09
including Keolis S.A.:
2.16
52.69*
including Keolis S.A.:
0.90*
Workplace accident frequency
rate
3.92
including Keolis S.A.:
0.03
3.86*
including Keolis S.A.:
0.01*
Severity rate of workplace
accidents
14
1. Management Report
markets. In 2015, Keolis redesigned the employee induction programme, ‘Welkome’, to better respond to the expectations of all
new Group managers. Finally, the Keolis Group actively supports basic training in the transport field. In acknowledgement of its
long-standing commitment, Olga Damiron, the Group’s former HR Director, was selected to be the sponsor of the 2015 class
graduating in the Master’s Degree of Regional and Urban Passenger Transport (TURP) at Lyon 2 Lumière University. The aim of this
degree is to train managers in managing the various facets of local mobility. This course is jointly certified by the National Public
Works School, ENTPE.
Keolis furthermore became a member in 2015 of the ‘Club des Partenaires’, created under the Chairmanship of Olivier Marembaud
(SNCF). This club brings together companies that wish to support the education of urban transport managers and specialists in
Africa through the provision of grants and the accommodation of interns. Keolis consequently provided financial assistance to
students taking the Master’s course in ‘Transport and mobility in African cities’ and will shortly be accommodating a student from
Togo within its Lyon subsidiary for a 6-month work placement.
2.6 Equality
-	Measures implemented in favour of gender equality (article I-1-f-1)
For several years, the Keolis Group has led an ambitious professional gender equality strategy, the objective being to increase mix
and ensure equality between employees. This strategy is supported by Keolis’ general management team and is at the centre of
the company’s human resources policy, in the form of three main projects:
First, Keolis makes sure that professional equality is included in organisational and human resource processes. In 2015, the Group
received four gender equality certificates for its French subsidiaries Keolis Oise, Keolis Artois Gohelle, Keolis Rennes and Keolis
Mobilité. It also launched an international workplace gender equality project with the participation of subsidiaries in the USA, Australia,
the UK and northern Europe. The primary aim of this initiative is to promote the sharing of best practice between subsidiaries, such
as the “Driven Women” campaign by the Australian subsidiary KDR Victoria. This communication campaign aimed at women led
the organisation to record a 38% increase in female employees, resulting in an award from the Melbourne city council. The second
aim of Keolis’ general equality policy is to pool the efforts of several subsidiaries to carry out far-reaching actions. For example, fifteen
Keolis subsidiaries in France came together in 2015 to organise the Girls’ day, a day spent informing young female students about
career opportunities in our Group before they made their higher education applications. KCS Boston also committed to run a
similar initiative and consequently identified and trained women ambassadors from each department in the firm.
Secondly, Keolis set up an internal network, Keolis Pluriel, which allows male and female employees, regardless of their professio-
nal sector, to take part in promoting workplace equality. In 2015 Keolis Pluriel worked on the following topic: ‘Winning over and
retaining female passengers’. The aim of the working group was to understand the expectations and needs of female passengers
so as to design services for all. A trend book collating all the group’s recommendations and suggestions for services was presented
to Keolis’ top management team. In parallel, Keolis became involved for the fourth year running, alongside the Alliance for Gender
Mix in the Firm (AME), in the organisation of the Gender Mix in the Firm network summit, held in Lyon in October. Keolis Pluriel also
took part in sporting events such as the ‘La Parisienne’ run, and organised workshops and talks aimed at employees on subjects
relating to gender equality (including work-life balance, stereotyping and female leadership). Keolis Pluriel increased its membership
by 40 in 2015, including 20 men.
Thirdly, Keolis is committed to spreading its equality approach throughout the Group, operational departments and beyond. Keolis
ensures that its subsidiaries share Group values and accompanies them to guarantee equality between all employees, wherever
they are. The company also promotes equality and diversity among its external stakeholders through transport-specific media. For
example, Autocars Planche publicised the success factors of its equality action plan as part of the Lyon TV channel TLM’s series
of reports entitled ‘Embarquez’. An article on Keolis’ female outreach programme was published in the International Association of
Public Transport’s (UITP) magazine. Finally, Keolis also discussed its approach at an international conference on gender equality
and safety, organised by the European Bank for Reconstruction and Development in Almaty, Kazakhstan.
Article
code
Subject of decree 2015 data 2014 data Indicator
I-1-e-2
– total number of
training hours
1,239,811
of which Keolis S.A.:
40,513
681,775*
of which Keolis S.A.:
37,769
Total number of hours of training
40,461
of which Keolis S.A.:
992
26,043
of which Keolis S.A.:
1,002
Number of employees having
received training
15
1. Management Report
-	Measures implemented in favour of employing people with a disability (article I-1-f-2)
Keolis ensures that all of its operational subsidiaries fulfil their legal obligations in relation to disability as required by local legislation,
and undertake proactive awareness-raising and social inclusion actions to fight against all forms of discrimination and exclusion. In
2015, KDR Gold Coast signed a partnership with the ‘Special Olympics’ to introduce a programme to welcome people with Down
syndrome or with intellectual or developmental problems. The first participant in this programme was welcomed by the subsidiary
in November 2015 for one day per week for ten weeks. He was tasked with assisting administrative employees. This programme
has the dual goal of raising awareness among the workforce about mental illness and enabling the “Special Olympics” participants
to take their first steps into the professional work environment.
In parallel, Keolis S.A. and EFFIA Synergies started developing their disability policy, basing it on an audit which took place in the
second half of the year. The two entities also raised employee awareness about the issue of purchasing from the sheltered work
sector through a day jointly coordinated with the charity Handeco. The French Paralysis Association, SNCF and Keolis Mobility
were also in attendance to promote the benefits of using this type of organisation. This initiative took place alongside a photo exhi-
bition about disability at work, produced by IMS Entreprendre pour la Cité.
Finally, through its ‘Actions for Solidarity’ programme (Coups de Coeur Solidaires) the Group rewards its employees’ involvement
in charitable work. In 2015 several prizes were awarded to charities working to promote awareness of disability and accessibility
issues. One key example is the charity Handi Cheval which offers people with disability or adjustment problems the chance to take
part in equestrian activities.
As a transport operator, Keolis also plays a major role in terms of mobility solutions for those with disabilities. The Keolis Group is
the leading carrier of passengers with reduced mobility (PRM) in France.
-	Anti-discrimination policy (article I-1-f-3)
Keolis has been a signatory of the Diversity Charter since 2006 and has been a partner of AFMD (Association Française des
Managers de la Diversité) since 2014. By signing this charter the Group has committed to promoting the employment of young
people, seniors with experience or those changing career path, job-seekers, disabled workers and people of different nationalities
and cultural backgrounds. For several years, Keolis has developed essential partnerships with organisations such as Cap Emploi,
Pôle Emploi and local missions to help people who face difficulties when entering the workforce. With the aim of offering new
opportunities to people over the age of 50 and to people in career transition, Keolis works with regional units specialised in career
transition services, the ministry of Defence or the French national police.
In 2015, the Keolis Group launched a general anti-discrimination policy based on a collaborative network and entitled ‘Diversity 
Inclusion’. Keolis has established a diversity programme for all of its subsidiaries. This programme is part of the career path for each
employee as soon as they join the Group – via an awareness-building module during the induction course – then at each succes-
sive stage of their career. Finally, Keolis builds strong partnerships with specialist researchers in the field of diversity to enhance its
underlying thinking and establish its diversity and inclusion strategy. For example Keolis partnered with Bordeaux University to work
on a project entitled ‘Young people, employment and discrimination’. Keolis also plays a part in several conferences relating to
diversity management.
2.7 Promotion of and adherence to clauses in key agreements of the International Labour Organisation
-	Eliminate discrimination in terms of employment and profession (article II-1-g-2)
In 2015 Keolis brought together a large number of people from France and abroad to write a charter setting out its commitments
to Diversity and Inclusion. These commitments relate to the following:
◗	Compliance with the employment law of the countries in which Keolis is established and with international standards in relation
to Human Rights and fundamental liberties, anti-discrimination, anti-harassment and the promotion of career equality.
◗	The creation of an equitable and inclusive work environment where each person feels recognised for their skills, commitment and
level of performance.
Article
code
Subject of decree 2015 data 2014 data Indicator
I-1-f-2
– measures
implemented in
favour of employing
disabled people
1,341.07
including Keolis S.A.:
3.77
1,451.5*
including Keolis
S.A.:3.17*.
Total number of workers with
a disability (in units)
16
1. Management Report
◗	Respect for each individual, their identity and culture within the limitations imposed by health and safety requirements and internal
regulations.
◗	The adoption of an open and empathetic approach to each person to understand their individual needs and expectations.
◗	The promotion of diversity and job equality with our stakeholders.
Keolis Group works actively against all forms of discrimination in employment based on the following principles:
◗	Priority is given to dialogue.
◗	The Group aims to train managers and all HR staff in legal matters relating to discrimination depending on local situations.
◗	Keolis Group commits to raising the awareness of managers and employees about diversity issues.
◗	Keolis encourages its managers to remain objective when faced with problems in the organisation related to diversity issues.
◗	Any problems are settled on a case-by-case basis and may lead to disciplinary action if behaviour does not comply with the values
and integration policies supported by the Group.
-	Eliminate forced or compulsory labour (article II-1-g-3)
-	Abolish child labour (article II-1-g-4)
Since 2004, Keolis Group has been a signatory of the United Nations’ Global Compact to promote and adhere to 10 principles
grouped into four categories, including Human Rights, international employment standards and anti-corruption.
3 • Information relating to corporate commitments in favour of
sustainable development
3.1 Territorial, economic and social impact of the company’s activities
-	in terms of employment and regional development (article I-3-a-1)
-	concerning neighbouring or local populations (article I-3-a-2)
Keolis has integrated an ‘Actor within the community’ project into its corporate programme. Its aim is to standardise practices by
allowing each subsidiary to build its own binding and reasoned partnership strategy. The main guidelines of these strategies are
shared by the Group and its subsidiaries: be consistent with the ‘Konformité’ programme, allow each subsidiary to build its own
approach and allow the Group to promote (internally and externally) the subsidiaries’ partnership actions.
3.2 Relations with people or organisations with an interest in the company’s activities, in particular associations
which promote inclusion, teaching establishments, environmental protection associations, consumer associations
and neighbouring populations
-	Conditions of dialogue with these people or organisations (article I-3-b-1)
In October 2015, for the fifth successive year, Keolis brought together its external stakeholders, consisting of representatives of
associations, the French government and specialist companies. The aim was to obtain feedback from these stakeholders about
our activities, our position and our corporate programme. Members of the Executive Committee were also involved. Dialogue was
very productive, particularly in relation to the provision of transport services to rural areas and responsible purchasing policies.
Within the framework of this ‘Dialogue with external stakeholders’, Keolis also provides its subsidiaries with tools and methods to
allow them to enter into and/or organise dialogue with their own stakeholders. They are thus provided with a mapping model and
prioritisation criteria to be used depending on the challenges and the goal of the dialogue entered into. The subsidiaries also have
a model of the rules to be applied.
-	Sponsorship or charitable actions (article I-3-b-2)
Sponsorship and corporate giving fall under the guidelines of two specific projects in the Group corporate programme: ‘Fairness
of practices’ and ‘Actor within the community’.
Since 2010, Keolis has been attributing annual awards as part of ‘Actions for solidarity’ ‘(Coups de coeur solidaires). The aim of this
activity is to encourage personal and voluntary commitment from Group employees to an association which acts in favour of soli-
17
1. Management Report
darity between neighbourhoods to encourage diversity, or which helps promote the inclusion of vulnerable people or those in diffi-
culty.
Applications are assessed by a panel made up of representatives of Keolis’ top management in France and employee representa-
tives. The relevance and eligibility of submissions are assessed according to the following criteria: the target audience, social and
partnership dimensions, viability and originality, creation of social ties. Three winners are awarded a grant, which is directly paid to
the associations they represent.
The judging panel distinguished three charities for its 2015 edition. The first prize was awarded to the association Les Chérubinots
which works to raise funds for a joëlette: a special chair which enables people with disabilities to take part in hiking activities. This
charity was nominated by an employee from Keolis Bordeaux. The second prize went to the association Benecontre Phalempins,
nominated by our Lille subsidiary. This charity promotes social cohesion between people living in the same neighbourhood, parti-
cularly people living on their own and the elderly. The third prize went to the charity HANDI Cheval Mayenne which works in aid of
children with physical or motor disabilities. This charity was nominated by an employee from Keolis Laval.
3.3 Sub-contractors and suppliers
-	Consideration of social and environmental issues in procurement policy (article I-3-c-1)
The Purchasing Charter, approved by the Group Executive Committee, defines the general principles of purchasing within the Group
and sets out rules regarding ethics and behaviour applicable to all internal and external actors involved in the purchasing process.
All employees acting on behalf of the Group or one of its subsidiaries must be familiar with, comply with and promote its principles
in the interests of fairness and transparency.
In compliance with the Group’s CSR commitments, all employees involved in purchasing must promote sustainable development
with their business partners. All employees involved in a purchasing process must therefore pass on these concerns to their own
suppliers and sub-contractors, encourage suppliers to develop a social and environmental progress plan, and ensure compliance
with national laws, regulations and international agreements concerning the protection of individuals (employees, sub-contractors,
product or service users) and the environment.
In 2015, the Purchasing Department enhanced its Purchasing Policy with three new workstreams to strengthen the Sustainable
and Supportive Purchasing approach:
◗ The first workstream relates to the supportive economy and local patronage, promoting supportive purchasing approach by
increasing the use of sheltered work organisations as suppliers, contributing to the local economic community and reaffirming a
local presence.
◗ The second workstream deals with environmental and safety issues by factoring into the procurement process (in particular through
supplier selection questionnaires, performance requirements, selection criteria and contracts) Keolis’ environmental policy, risks
relating to the safety of people and goods, and the protection of our data and know-how.
◗ The third and final workstream relates to supplier relations by generalising the total cost approach, ensuring transparency and
equality of treatment of suppliers by reducing the risk of reciprocal dependence and of monopoly.
Over the past few years, Keolis has developed a range of initiatives to this effect:
◗ The Group framework agreement for electricity supply includes an option allowing each subsidiary to subscribe on demand to
power from renewable energy sources.
◗ The framework agreement for waste electrical and electronic equipment (WEEE) combines environmental concerns and suppor-
tive action as it is concluded with a sheltered work organisation.
◗ The listing of a ‘green’ range of cleaning products, an organic part degreasing washer, printers with Imprim’Vert certification or
from the sheltered work sector.
◗ Various clauses specific to waste processing and environmental protection are written into framework agreements about sensitive
products (notably batteries, tyres and lubricants). Product selection takes into account any awards or certification gained.
Some types of Purchasing are currently carried out at a local level following the recommendations of the Group Purchasing
Department. These purchasing items are of significant importance in the expenditure of subsidiaries and require local contact with
suppliers. The main categories of local purchases are:
◗ Vehicle and premises cleaning
◗ Security
◗ Vehicle charter services (subcontracting)
18
1. Management Report
◗ Gardening services
◗ Maintenance of some facilities and infrastructure.
Two purchasing guides, KeoClean and Keo’Guard, have thus been created to assist subsidiaries with their procurement of cleaning
and security services. These two guides include recommendations relating to social responsibility.
- Importance of sub-contracting and consideration of social and environmental responsibility in relation to suppliers and
sub-contractors (article II-3-c-1)
Keolis also includes in its supplier selection questionnaire or in its performance requirements a certain number of questions related
to Environment and Safety. These questions are tailored to the purchasing segment concerned.
Proposals are analysed by assessing total cost. Depending on the purchasing category and the issues at stake, some assessment
grids include evaluation criteria relating to environmental and/or social aspects. This is the case for example in the procurement of
rolling stock, printers, work clothing and batteries.
3.4 Fairness of practices
-	Actions undertaken to prevent corruption (article II-3-d-1)
The Group’s growth ambitions in France increase commercial competition and therefore the exposure of managers and Keolis
entities to the risks of competition, fraud and corruption.
To minimise the risk of manager implication, and prevent financial and legal risks while continuing to develop in accordance with
business ethics, Keolis integrated the Konformité programme into its corporate programme in the form of the ‘Fairness of practices’
project. This covers three areas relating to all subsidiaries: strict compliance with free and fair competition, prevention of corruption
and fraud, and the protection of personal data.
In 2015 the Group decided to focus on the area of anti-corruption.
The Group President addressed a message to all of the Group’s managers reminding them of the principles of the Konformité
programme which should be exemplary in nature and act as a means to reduce corruption-related risks: legal, financial and repu-
tational risks. This approach also provides a response to increasingly-expressed demands from clients but also from all our stake-
holders and our employees.
All of the managers in the Group are invited to help to promote the programme, support its implementation, monitor it regularly and
raise their teams’ awareness of it.
The main manuals provided to Group managerial staff are:
◗ The Guide for Ethical Business Conduct
◗ The brochure ‘Konformité at a Glance’,
◗ The practical guide ‘The Right Attitudes to prevent corruption’.
In addition, three areas have specific Group procedures applied to them which managers are responsible for following, with the
possibility of adjustments outside France where necessary, to comply with local law if it is stricter. These directives cover the three
following subjects:
◗ Gifts and hospitality,
◗ Sponsorship and corporate giving,
◗ Donations and relations with business partners.
As part of this approach, the guide ‘Relations with Business Partners’ was widely distributed during summer 2015. It reminds
readers that the ethical standards of business conduct must be adhered to by all of the Group’s entities and their employees, but
also shared with the business partners they work with. The Group expects these partners, be they consultants, providers of intel-
lectual services or partners in joint ventures or consortia, to work with integrity and abide by all laws and regulations in force.
Employees that incur the Group’s liability through working relationships with business partners must observe the principles laid
down by this guide and communicate them to their partners. Vigilance must be exercised in three key phases of relations with
partners: the selection phase, the contract conclusion phase and the contract implementation and monitoring phase. The guide is
supplemented by a procedure for use only by Group employees.
19
1. Management Report
Awareness and training initiatives continued in 2015.
◗ A module on ‘Governance and Business Ethics’ was introduced into the new employee induction course. A more developed
version of the module was inserted into the new training programme for subsidiary directors and will be delivered face-to-face
from February 2016.
◗ In the area of awareness development, a ‘Konformité’ breakfast was held during the June 2015 Keolife Week and was reported
on by a series of Group communications tools.
◗ A talk was given at head office by the Chairman of Ethic Intelligence in October 2015 on the theme of conducting preliminary
specific anti-corruption audits before mergers and acquisitions.
Finally, initiatives were conducted to reinforce management commitment to the deployment and effective application of Group
procedures. The International zones each appointed correspondents and formulated their road map for 2016.
-	Measures taken in favour of consumers’ health and safety (article II-3-d-2)
Within the framework of Keolis Group’s activities, consumer safety means the safe operation of passenger transport services. The
security of services means prevention and measures taken with regard to external attacks and violent behaviour.
In passenger rail and metro activities, there were no passenger victims to report (excluding suicides). In the field of buses, coaches
and trams, pedestrians and passengers are more affected and continue to be more exposed. Our actions remain focused on
improving risk prevention concerning both our passengers (risks that we can manage) and our employees.
In 2015, various Group subsidiaries developed actions to improve the safety of operations. Several subsidiaries organised safety
events aimed at passengers and the general public (Rennes, Lyon, Courriers d’Ile-de-France). The corporate project focus week
entitled “KeoLife Week” was an opportunity to raise passenger awareness of the risks prevalent in public transport. A campaign
entitled ‘Rhino’ was deployed in a number of cities (in particular Brest and Caen) with the goal of passing on safety messages to
public transport customers and the broader public.
In partnership with the French Road Safety Association, a survey was conducted in the second half of 2015 relating to the wearing
of seatbelts in coaches. This coincided with the implementation on 1 September 2015 of a new law mandating the wearing of
seatbelts in coaches, and also offered insight into passenger behaviour. The findings of the survey will be published in the first half
of 2016.
Another initiative was to test an assistance mechanism aimed at coach and bus drivers called ‘Bird View’, giving them an overhead
view of their vehicle and enabling them to identify any type of risk to pedestrians or passengers. This test provided insight into driver
behaviour when at a stop or when moving away from one.
Keolis’ contribution to ensuring the security of its networks came in the form of tackling fare evasion and antisocial behaviour through
the following actions: reinforced patrols by inspection teams, the increase in video surveillance (90% of vehicles in France are now
fitted with surveillance equipment), internal communication campaigns, the intervention of liaison officers to resolve any conflicts,
the increase of its participation in community outreach offices (PIMM’S) and the maintenance of close relations with law enforcement
bodies and the public prosecutor.
In 2015, several networks equipped their inspectors with personal safety cameras in the stated aim of protecting them from anti-
social and violent behaviour. This deployment will continue throughout 2016.
20
1. Management Report
4 • Environmental information
4.1 General policy on environmental matters
Keolis offers solutions to build sustainable mobility such as promoting the growth of new forms of mobility, making our expertise
available to Public Transport Authorities or improving the environmental performance of public transport.
The Group’s Environment approach is mainly based on feedback from its subsidiaries and on an environment management system.
The Group Environment policy mentions the commitments and targets all of its activities (operations, maintenance, business,
administration). This policy applies to all Group subsidiaries and is part of its corporate project.
The Group Environment approach has been certified ISO 14001 since 2014. Initially, this certification applied to ten subsidiaries.
In 2015, four new subsidiaries were added to the certification including Keolis Commuter Services in Boston.
This joint certification has prompted proactive commitment to three issues:
◗ continuing to optimise our energy consumption,
◗ improving waste management,
◗ minimising drinking water consumption for industrial activities.
Article
code
Subject of decree 2015 data 2014 data Indicator
I-2-a-1
– organisation of the
company to take
environmental issues
into account and,
where applicable,
assessment
or certification
programmes in terms
of the environment
14,551 9,431*
Number of employees covered
by ISO 14001 certification
26.6% 17.6%*
Percentage of employees
covered by ISO 14001
certification
The sum of provisions and guarantees for risks to the environment is not relevant data in view of the Group’s activities, as they do
not pose a major environmental threat.
-	Actions taken to train and inform employees in terms of environmental protection (article I-2-a-2)
Training is developed in partnership with the Keolis Training Institute. Various training modules have been added to the Keolis training
catalogue to meet Group subsidiaries’ specific needs in terms of the environment.
Environmental issues are also incorporated into the compulsory training course for Group drivers and the induction course for all
new Keolis S.A. recruits.
Different internal communication channels exist to promote environmental approaches: France and International newsletters,
KeoAwards. In 2014, the first prize in the CSR category was awarded to Keolis Lille for substituting products used for maintenance
with products that are less harmful to the environment and health at work.
21
1. Management Report
-	Consideration of noise pollution and any other form of pollution specific to an activity (article I-2-b-3)
In light of the three specific objectives of the Group environment policy, noise pollution is not a significant environmental issue for
the Group.
In accordance with our general commitments, this subject is handled locally depending on any complaints received and/or the
regulations that apply on the sites concerned.
4.3 Sustainable use of resources
-	Water consumption and water supply depending on local factors (article I-2-c-1)
Water consumption is an important environmental issue for the Keolis Group. Because of this, minimising consumption of drinking
water for our industrial activities is one of the three specific objectives of our Environment policy.
Locally, Group subsidiaries use drinking water as well as recycled and/or rain water to wash vehicles. As at end 2015, 58 facilities
were equipped with a vehicle washing water recycling system and 14 with a rainwater collection system. In Bordeaux for example,
the improvement of vehicle washing infrastructure saved 32% in water consumption.
4.2 Pollution and waste management
-	Measures to prevent, reduce or remedy emissions in the air, water and soil seriously affecting the environment
- Measures to prevent, recycle and eliminate waste (article I-2-b-2
The Group’s Environment policy has three specific goals, one of which is to improve waste management. This issue is an important
environmental challenge for the Group.
To this end, the HSE Department provides Group subsidiaries with specific tools, such as a booklet, which can be customised, to
raise employees’ awareness to sorting waste, a waste management procedure, a template register to monitor waste production
and treatment on each site.
The subsidiary Keolis Bordeaux Métropole, which has held ISO 14001 certification since 2012, came under the Group certification
in 2015. The subsidiary conducts a truly proactive environmental protection policy, working closely with its public transport autho-
rity Bordeaux Métropole. The ISO 14001 certification thus helped to accelerate the improvement of waste sorting and recovery.
The company’s canteen started to compost its food waste, resulting in 8 tonnes being composted which otherwise would have
been discarded with other household waste. Among other initiatives, the introduction of new instructions for the use of aerosols
and thinners led to reduction in waste by 30% and 50% respectively.
Article
code
Subject of decree 2015 data 2014 data Indicator
I-2-b-2
– measures to
prevent, recycle
and eliminate waste
4,283 3,289*
Tonnes of hazardous waste
produced
6,976 Tonnes of non-hazardous waste
produced
73% Percentage of hazardous waste
recovered
46% Percentage of non-hazardous
waste recovered
The reduction in the quantity of hazardous waste produced is due to the improvement in monitoring occasional cleaning operations.
22
1. Management Report
In 2015, several Keolis Group subsidiaries are located in countries facing water shortages, i.e. Australia and Belgium (according to
the World Resources Institute).
Article
code
Subject of decree 2015 data 2014 data Indicator
I-2-c-1
– water consumption
and water supply
depending on local
factors
744,622 641,492*
Volume of water purchased
in m3
8% 7%
Share of water consumption in
areas faced with water shortages
-	Consumption of raw materials and measures taken to improve their efficient use (article I-2-c-2)
The Group’s service activity does not entail the substantial consumption of raw materials. This subject is therefore not a major
environmental issue for the Group.
-	Energy consumption, measures taken to improve energy efficiency and use of renewable energies (article I-2-c-3)
Energy consumption is the main environmental impact of our activities. Optimising our consumption is one of the objectives of
Keolis Group’s environment policy.
Keolis also made a commitment to reducing its energy consumption by 10% between 2014 and 2020. This commitment will be
illustrated by a performance indicator to take into account the change in our level of business: energy consumption per kilometre
travelled (tonnes of oil equivalent / km).
To reach this objective and support the energy transition, Keolis works in three main areas:
• Improvement of behaviour
Eco-driving to reduce fuel consumption of vehicles. Simulator training raises bus, coach and tram drivers’ awareness of the bene-
fits of eco-driving.
Smooth driving improves customer comfort and saves fuel, without having any impact on commercial speed. Keolis has also listed
a range of products suitable for buses and coaches called ‘Konfort’, to view how driving affects consumption by measuring acce-
leration and braking. Today no fewer than 3,613 vehicles are equipped with an eco-driving assistant (Konfort or similar).
• Measuring and controlling the energy efficiency of entrusted assets
A matrix of the main energy uses has been developed to help subsidiaries identify their areas for improvement.
• Supporting Public Transport Authorities in their approaches to improve the environmental performance of their fleet
and/or building renovations.
For several years, Keolis has invested in a range of solutions to reduce the environmental impacts of its activities, often being a
forerunner in the field.
The solutions implemented are tailored to the local context and the fleet: alternative energies, particle filters, recovery systems or
energy savings systems.
Keolis is particularly active in this field, calling on the entire range of alternative energies, such as bio-fuels, ethanol, products from
the gas sector and electrical energy. When purchasing vehicles, the Group always advises Public Transport Authorities to select
models which run on alternative fuels, notably biogas. In 2015, Keolis operated more than 3,800 vehicles throughout the world
running on fuels other than diesel, representing 15% of its total fleet. (By fuel type: Biodiesel (820), Bioethanol (400), Biogas (470),
Diester (500) NGV (1,090), electric (220) and hybrid (375).)
Keolis is continuing its actions in this field through active technological intelligence with manufacturers and equipment suppliers to
identify and possibly develop solutions to optimise the environmental performance of the vehicle fleet.
For example in Sweden, Keolis has been operating new hybrid buses since March 2015. These pollute 90% less than traditional
diesel buses and are exceptionally fast to recharge: in the space of a mere 6 minutes, the buses recharge their batteries to 100%
at their line terminuses and are ready to run another 8 km, at which point the biodiesel engine takes over. An added advantage is
that these buses are quieter and therefore more comfortable for passengers.
23
1. Management Report
With regard to buildings, while their energy consumption is far lower than that needed to power vehicle fleets, Keolis nonetheless
conducts activities to optimise certain types of energy consumption: heating, air conditioning, hot water, lighting and related systems
(ventilation, pumps), machine tools and compressed air machines.
Excluding heating, lighting can account for up to 50% of an electricity bill of Keolis’ infrastructure and buildings. Keolis Rennes cut
its office lighting electricity consumption by 40% by fixing rules for using lighting according to needs, regularly measuring electricity
consumption and using low energy lighting systems.
-	Land use (article II-2-c-1)
The Group’s activity does not have any significant impact on land use.
Concerning already urbanised areas, the use of public transport contributes to relieving traffic congestion from towns and cities.
For an identical number of passengers, the road footprint of the private car is nearly 20 times more than that of the tram and 5 times
more than that of the bus (source UITP).
4.4 Climate change
-	Greenhouse gas emissions (article I-2-d-1)
Carbon dioxide emissions produced by Group activities are directly related to the energy consumption of commercial vehicles, the
Group’s leading source of emissions, and to energy use by buildings (heating, lighting).
In addition to the Greenhouse Gas (GHG) Emissions Statement issued by Keolis in 2012 and repeated in 2015 relating to article 75
of the French ‘Grenelle II’ Environment Act, methods to assess and reduce CO2
emissions have been put in place at subsidiary
level, voluntarily or in compliance with regulations. Action plans to reduce these emissions must be established and assessed locally,
particularly due to the number of contracts and the types of networks operated.
In all events, actions to reduce emissions are estimated and assessed by way of an indicator which includes the notion of trip or
traveller (CO2
emissions/trip/passenger.km). The Greenhouse Gas Emissions Statement for public transport must apply to a given
geographical zone. Modal shift from private car to public transport can thus be measured. This helps to show that public transport
is a solution to reduce global GHG emissions.
In Sweden, Keolis has three wind turbines located in three different locations. Generating 9.56 GWh per year, this new source of
renewable energy produces the equivalent of 33% of its annual electricity consumption. Keolis Sverige therefore plays its part in
improving the local energy mix.
Article
code
Subject of decree 2015 data 2014 data Indicator
I-2-c-3
– energy
consumption,
measures taken
to improve energy
efficiency and
use of renewable
energies
229,266 215,932
Traction energy consumption
for commercial vehicle fleets
(excluding rail) in TOE
41,635 10,129
Traction energy consumption for
commercial railway use in TOE
21,842 15,097*
Energy consumption of company
facilities in TOE
292,743 241,158 Total energy consumption in TOE
The substantial increase in the consumption of energy for traction and that of company facilities relates to the inclusion within the
consolidation scope of a new rail subsidiary, Keolis Commuter Service in Boston.
24
1. Management Report
The overall increase in the Group’s carbon dioxide emissions for 2015 can be explained by the integration of Keolis Commuter
Services in Boston and Docklands Light Railway in London.
The American subsidiary operates locomotives running on diesel which account for 30% of all rail kilometres travelled by the Group.
The British subsidiary operates electrically-powered light rail services. In this country, the electricity emission factor is high; on ave-
rage ten times higher than in France.
- Adjusting to the consequences of climate change (article II-2-d-1)
Adjusting to climate change is not an immediate or major issue for the Keolis Group. As a public transport player, the Group may
offer recommendations for policy making, but is not a direct decision-maker in investments and other choices made by Public
Transport Authorities.
4.5 Protection of biodiversity
- Measures to preserve or develop biodiversity (article I-2-e-1)
The predominantly urban activity of the Group does not cause a significant impact on biodiversity. However, the experience and
know-how we have gathered throughout the world puts Keolis into a position where it can respond to biodiversity issues wherever
necessary.
Article
code
Subject of decree 2015 data 2014 data Indicator
I-2-d-1
– greenhouse gas
emissions;
5,751,885 671,688*
CO2
emissions from commercial
traction (excluding rail) in TCO2
e
165,817 49,644
CO2
emissions from commercial
rail traction in TCO2
e
59,049 28,184*
CO2
emissions of company
facilities in TCO2
e
976,751 769,516 Total CO2
emissions
25
1. Management Report
Appendix 2
List of terms of office or functions performed in 2015 in other
companies by the executive officers of KeolisB
26
1. Management Report
Jean-Pierre FARANDOU
President / Sole Member of
the Executive Board
GROUPE KEOLIS S.A.S.
Chairman  CEO and
Director
KEOLIS
Chairman of Board of
Directors
Union des Transports Publics
et Ferroviaires
(since 18/06/2015)
Chairman of Board of
Directors
Orchestre National
d’Ile-de-France
Michel LAMBOLEY
Director KEOLIS LYON
Director KEOLIS S.A.
Director KEOLIS BORDEAUX
Director KEOLIS BORDEAUX METROPOLE
Director KEOLIS LILLE
Member of Supervisory
Board
LION / SENECA FRANCE 1
Director EUROBUS HOLDING (Belgium)
Director KEOLIS ESPANA
Arnaud VAN TROEYEN
Director KEOLIS
Director STE. D’EXPLOITATION
AEROPORT ALBERT PICARDIE
Member of Supervisory
Board
AEROLIS
Member of the
Management Board
STÉ D’EXPLOITATION
AEROPORT DOLE JURA
Managing Director STÉ D’EXPLOITATION
AEROPORT DOLE JURA
Permanent
Representative of Keolis
KEOLIS LILLE
Director EFFIA (until 30/09/2015)
Director ONE PARK (since 14/10/2015)
Director KEOLIS TRANSIT AMERICA, INC
(until 01/07/2015)
Director 3695158 CANADA INC.
(until 01/02/2015)
Director AUTOCARS ORLEANS EXPRESS
INC. (Canada) (until 14/04/2015)
Member of the
Supervisory Board
KEOLIS NEDERLAND B.V.
Director KEOLIS DOWNER PTY LTD
Director KDR VICTORIA PTY LTD
Director KDR GOLD COAST PTY LTD
Director KEOLIS DOWNER BUS AND
COACHLINES PTY LTD (Australie)
(since 10/03/2015)
Director KEOLIS DOWNER BUS AND
COACHLINES PROPERTY PTY
LTD (since 10/03/2015)
Xavier HUBERT
Director KEOLIS
Director KEOLIS ORLEANS VAL DE LOIRE
Director KEOLIS RENNES
Director KEOLIS LILLE (until 18/11/2015)
Olga Damiron
Director KEOLIS
President / Director INSTITUT KEOLIS
Director KEOLIS RENNES
(since 10/11/2015)
Isabelle BALESTRA
Director Keolis S.A.
Director KEOLIS LILLE
(since 18/11/2015)
Patricia MEUNIER
Employee Director KEOLIS
CEO / Director CIE TRANSPORTS DE
PERPIGNAN
Director SOCIÉTÉ AUTOMOBILES DE
PROVENCE
Director CIE DES TRANSPORTS
MEDITERRANEENS
Director KEOLIS BAIE DES ANGES
Director STE DES TRANSPORTS COTE
D’AZUR RIVERA
Director KEOLIS COTE D’AZUR
Éric PATOUX
Employee Director KEOLIS
Director KEOLIS CHALONS EN
CHAMPAGNE
Director STE DES TRANSPORTS DE
L’AGGLOMERATION DE
CHAUNY
Director KEOLIS CHATEAU THIERRY
(until 26/06/2015)
Chief Executive KEOLIS CHÂTEAU THIERRY
(since 26/06/2015)
Chief Executive KEOLIS CHAUMONT
Chief Executive KEOLIS CHAUNY TERGNIER
(since 26/06/2015)
Director KEOLIS CHAUNY TERGNIER
(until 26/06/2015)
Marc VILLENEUVE
Employee Director KEOLIS
Appendix 3
Summary of delegations of powers and authorities granted by the
general assembly of the board with regard to capital increasesB
Appendix 4
Table of earnings for the past five financial years (in euros)
B
27
1. Management Report
2015 2014 2013 2012 2011 2010
1 - Capital at end of period	
a) Share capital 46,851,276 46,851,276 46,851,276 46,851,276 46,851,276 46,851,276
b) number of ordinary shares
outstanding
3,904,273 3,904,273 3,904,273 3,904,273 3,904,273 3,904,273
c) Number of future shares to be
created
- by conversion of bonds
- through the exercise of
subscription rights
2 - Transactions and earnings for the period
a) Share capital 196 787 773 186,836,372 175,946,238 166,466,450 156,170,734 155,223,584
b) Earnings before tax, profit
sharing, depreciation and
provisions
13,568,616 14,909,693 48,656,168 33,829,455 33,497,304 63,711,712
c) Tax (tax credit) on profits (15,388,189 ) (15,845,019) (10,378,714) 8,104,182 1,197,877 -327,452
d) Employee profit sharing for the
year
- - - 1,916,846 - -
e) Earnings after tax, profit sharing,
depreciation and provisions
37,599,518 25,151,149 38,731,482 59,750,217 45,477,141 20,490,765
f) Distributed earnings - 19,130,938 19,130,938 19,130,938 19,130,938 19,130,938
3 - Earnings per share
a) Earnings after tax, but before
allocations to depreciation and
provisions
7.42 7.88 15.12 6.10 8.27 16.40
b) Earnings after tax and
allocations to depreciation and
provisions
9.63 6.44 9.92 15.30 11.65 5.25
c) Dividend paid on each share
(Net dividend)
4.90 4.90 4.90 4.90 4.90
4 - Staff
a) Average numbers employed 1,408 1,363 1,262 1,228 1,215 1,186
b) Payroll 92,565,343 90,570,432 83,312,146 78,350,555 72,169,782 74,251,465
c) Amounts paid in welfare benefits
(Social Security, company benefits,
etc.)
43,295,106 42,962,595 38,219,435 36,186,552 32,579,774 33,356,699
(Arts. 133, 135 and 148 of the Commercial Companies Decree)
Nil..
29
2. consolidATED
FINANCIAL STATEMENTS
A Key figures for the Group. . . . . . . . . . . . . . .  30
B Consolidated financial statements. . . . .  31
1 • Income statement. . . . . . . . . . . . . . . . . . . . . . . . . 31
2 • Statement of comprehensive income. . . .  32
3 • Statement of financial position . . . . . . . . . 33
4 • Statement of changes in equity. . . . . . . . . . 34
5 • Statement of cash flows. . . . . . . . . . . . . . . . . 35
C Notes to the consolidated financial
statements. . . . . . . . . . . . . . . . . . . . . . . . . . . . . .  36
1 • General information . . . . . . . . . . . . . . . . . . . . . 36
2 • Summary of significant accounting
policies. . . . . . . . . . . . . . . . . . . . . . . . . . . . . . . . . . . . 36
2.1 Basis of preparation. . . . . . . . . . . . . . . . . . . . . . . . . . . 36
2.2 Changes in accounting principles. . . . . . . . . . . . . . . . 38
2.3 Use of Management estimates
in the application of the Group’s accounting
standards. . . . . . . . . . . . . . . . . . . . . . . . . . . . . . . . . . . . 38
2.4 Accounting principles. . . . . . . . . . . . . . . . . . . . . . . . . 38
3 • Highlights of financial year 2015. . . . . . . . 49
4 • Notes to the consolidated income
statement. . . . . . . . . . . . . . . . . . . . . . . . . . . . . . . . . . 50
4.1 Staff costs . . . . . . . . . . . . . . . . . . . . . . . . . . . . . . . . . . . 50
4.2 Other operating income. . . . . . . . . . . . . . . . . . . . . . . 50
4.3 Operating profit. . . . . . . . . . . . . . . . . . . . . . . . . . . . . . . 50
4.4 EBITDA calculation . . . . . . . . . . . . . . . . . . . . . . . . . . . 51
4.5 Financial income / (expense). . . . . . . . . . . . . . . . . . . 51
4.6 Share in net profit for the year from investments
under the equity method. . . . . . . . . . . . . . . . . . . . . . . 51
4.7 Taxation. . . . . . . . . . . . . . . . . . . . . . . . . . . . . . . . . . . . . . 52
5 • Notes to the consolidated statement
of financial position. . . . . . . . . . . . . . . . . . . . . . 54
5.1 Goodwill. . . . . . . . . . . . . . . . . . . . . . . . . . . . . . . . . . . . . 54
5.2. Other intangible assets . . . . . . . . . . . . . . . . . . . . . . . 55
5.3 Property, plant and equipment . . . . . . . . . . . . . . . . . 56
5.4 Investments under the equity method. . . . . . . . . . . 57
5.5 Current and non-current financial assets. . . . . . . . 58
5.6 Inventories. . . . . . . . . . . . . . . . . . . . . . . . . . . . . . . . . . . 58
5.7 Trade and other receivables. . . . . . . . . . . . . . . . . . . . 59
5.8 Cash and cash equivalents. . . . . . . . . . . . . . . . . . . . 59
5.9 Equity. . . . . . . . . . . . . . . . . . . . . . . . . . . . . . . . . . . . . . . 60
5.10 Financial debt and long term borrowings. . . . . . . 60
5.11 Financial assets and liabilities by category . . . . . 64
5.12 Risk management and financial derivatives . . . .  65
5.13 Provisions. . . . . . . . . . . . . . . . . . . . . . . . . . . . . . . . . . . 71
5.14 Operating liabilities and other debt . . . . . . . . . . . . 75
6 • Other commitments not recognised
in the statement of financial position
and contractual commitments. . . . . . . . . . 76
7 • Disputes . . . . . . . . . . . . . . . . . . . . . . . . . . . . . . . . . . . 77
8 • Related party transactions. . . . . . . . . . . . . 77
8.1 Transactions with GROUPE KEOLIS S.A.S. and
Groupe EFFIA . . . . . . . . . . . . . . . . . . . . . . . . . . . . . . . . 77
8.2 Transactions with joint ventures and associates. 77
8.3 Remuneration of the Group’s key managers. . . . . . . 77
9 • Post balance sheet events. . . . . . . . . . . . . . . 77
10 • Consolidation scope. . . . . . . . . . . . . . . . . . . . 78
10.1 Subsidiaries. . . . . . . . . . . . . . . . . . . . . . . . . . . . . . . . . 78
10.2 Joint ventures and associates. . . . . . . . . . . . . . . . . 85
Statutory auditors’ report on the
consolidated financial statements. . . . . . . . . . .  86
CONTENTS
30
2. Consolidated financial statements
(€ million) Note 31/12/2015 31/12/2014
Revenue 4,817.4 4,275.6
◗ Revenue France 2,625.3 2,602.2
◗ Revenue International 2,192.1 1,673.4
Revenue net of sub-contracting 4,637.2 4,101.3
Recurring EBITDA 4.4 227.2 213.9
EBITDA 4.4 206.7 187.4
Recurring operating profit 4.3 56.2 67.7
Operating profit before investments under equity method 37.0 34.5
Operating profit after investments under equity method 59.4 50.5
Profit after tax from continuing operations 4.4 14.8
Profit attributable to equity shareholders 12.0 13.6
Total equity 202.3 162.5
of which attributable to equity shareholders 150.8 141.7
Net cash flows from operating activities 108.2 141.9
Industrial investments 201.4 181.5
Net financial debt (cash surplus)1
548.2 346.9
(1) Surplus cash positions are presented in brackets
Key figures for the Group
A
31
2. Consolidated financial statements
1 • Income statement
(€ million) Note 31/12/2015 31/12/2014
Revenue 4,817.4 4,275.6
Other income from operations 18.7 25.5
Income from continuing operations 4,836.2 4,301.1
Sub-contracting (180.2) (174.3)
Purchases consumed and external expenses (1,596.8) (1,451.8)
Taxes (15.0) (13.6)
Staff costs, incentive schemes, profit-sharing 4.1 (2,820.6) (2,458.8)
Other operating income 4.2 48.5 48.3
Other operating expense (35.6) (21.9)
Net provisions on current assets (0.1) (4.6)
Net depreciation and other provisions charged (187.9) (163.5)
Profit/(loss) on recurring fixed asset disposals 1.3 1.4
Amortisation of grants received 6.3 5.4
Recurring operating profit 56.2 67.7
Other non-recurring income 4.3 7.3 6.6
Other non-recurring expense 4.3 (24.9) (30.4)
Depreciation and provisions on contractual rights 4.3 (1.6) (9.4)
Of which depreciation of other intangible assets and negative goodwill 5.7 (5.3)
Operating profit/loss before investments under equity method 37.0 34.5
Profit/(loss) from associates 22.4 16.0
Operating profit/(loss) after investments under equity method 59.4 50.5
Net cost of financial borrowing 4.5 (12.3) (8.7)
Other financial income 4.5 7.1 7.1
Other financial expense 4.5 (15.0) (13.5)
Financial income (expense) (20.2) (15.1)
Profit before tax 39.2 35.4
Taxation 4.7 (34.8) (20.6)
Profit after tax from continuing operations 4.4 14.8
Profit for the year 4.4 14.8
Profit/(loss) attributable to non-controlling interests 7.6 (1.3)
Profit attributable to Group 12.0 13.6
Consolidated financial statements
B
32
2. Consolidated financial statements
(€ million) 31/12/2015 31/12/2014
Profit for the year 4.4 14.8
Actuarial gains and losses on defined benefit pension schemes (0.3) (14.0)
Tax on actuarial gains and losses on defined benefit pension schemes - 4.8
Share of other items in comprehensive income of investments under equity method 13.0 8.4
Items that will not be reclassified to profit or loss 12.7 (0.8)
Translation differences and others 0.5 6.7
Unrealised gains and losses on financial hedging instruments 0.1 (7.8)
Tax on items that may be reclassified to profit or loss (0.1) 2.7
Items that may be reclassified to profit or loss 0.6 1.6
Total gains and losses recognised directly in equity 13.2 0.8
Total comprehensive income for the year 17.7 15.6
of which attributable to:
- Equity shareholders 25.2 13.7
- Non-controlling interests (7.6) 1.9
2 • Statement of comprehensive income
33
2. Consolidated financial statements
Assets
(€ million)
Note 31/12/2015 31/12/2014
Goodwill 5.1 267.3 233.6
Other intangible assets 5.2 203.9 149.7
Property, plant and equipment 5.3 711.3 620.5
Investments under the equity method 5.4 39.4 36.2
Non-current financial assets 5.5 181.0 149.8
Deferred tax asset 4.7 75.4 77.0
Non-current assets 1,478.4 1,266.9
Inventories and work in progress 5.6 82.0 78.0
Trade receivables 5.7 398.1 365.6
Other receivables 5.7 430.7 367.5
Current financial assets 5.5 18.8 19.8
Cash and cash equivalents 5.8 310.6 284.7
Current assets 1,240.3 1,115.7
TOTAL ASSETS 2,718.7 2,382.5
Liabilities
(€ million)
Note 31/12/2015 31/12/2014
Share capital 5.9 46.9 46.9
Reserves and premiums 5.9 91.9 81.3
Net profit/(loss) attributable to Group 5.9 12.0 13.6
Equity attributable to Group 150.8 141.7
Reserves attributable to non-controlling interests 59.1 19.5
Profit for the year attributable to non-controlling interests (7.6) 1.3
Equity 202.3 162.5
Non-current provisions 5.13 189.3 176.9
Non-current financial debt 5.10 571.3 138.9
Deferred tax liability 4.7 68.2 43.7
Non-current liabilities 828.8 359.5
Current provisions 5.13 55.3 52.0
Current financial debt 5.10 68.2 167.7
Bank borrowings 5.8 266.4 376.9
Trade payables and other liabilities 5.14 1,297.6 1,263.9
Current liabilities 1,687.5 1,860.5
TOTAL LIABILITIES 2,718.7 2,382.5
3 • Statement of financial position
34
2. Consolidated financial statements
(€ million)
Sharecapital
Reserves
Translationdifferences
Otherunrecognised
gains/(losses),
latents,nets
Otherunrealisedgains/
(losses),net,not
re-classifiabletoprofitorloss
Sub-total
Totalequity
AT 31 DECEMBER 2013 46.9 140.0 (11.4) 0.3 (12.2) 116.7 163.5
Attributable to Keolis S.A. shareholders 46.9 126.7 (11.6) 0.3 (12.2) 103.2 150.0
Attributable to minority shareholders in subsidiaries - 13.3 0.2 - - 13.5 13.5
Dividends paid to Keolis S.A. shareholders - (19.1) - - - (19.1) (19.1)
Change in Keolis S.A. shareholdings in its subsidiaries without
losing control - (2.8) - - - (2.8) (2.8)
OPERATIONS ATTRIBUTABLE TO KEOLIS S.A.
SHAREHOLDERS (A) - (22.0) - - - (22.0) (22.0)
Dividends paid to minority shareholders in subsidiaries - (0.3) - - - (0.3) (0.3)
Change in shareholdings in subsidiaries related to gaining /
losing control - - - - - - -
Change in shareholdings in subsidiaries without gaining/losing
control - 5.8 - - - 5.8 5.8
OPERATIONS ATTRIBUTABLE TO MINORITY
SHAREHOLDERS IN SUBSIDIARIES (B) - 5.4 - - - 5.4 5.4
Profit for the year - 14.8 - - - 14.8 14.8
Requalification of non-classifiable reserves related to mergers - (2.8) - - 2.8 - -
Gains / (losses) recognised directly in equity - - 6.7 (5.1) (0.8) 0.8 0.8
COMPREHENSIVE INCOME (C) - 12.0 6.7 (5.1) 2.0 15.6 15.6
CHANGE IN THE YEAR (A+B+C) - (4.6) 6.7 (5.1) 2.0 (1.0) (1.0)
Attributable to Keolis S.A. shareholders - (8.4) 6.1 (5.1) 2.0 (5.5) (5.5)
Attributable to minority shareholders in subsidiaries - 6.7 0.7 - - 7.3 7.3
AT 31 DECEMBER 2014 46.9 135.0 (4.3) (4.9) (10.2) 115.7 162.5
Attributable to Keolis S.A. shareholders 46.9 115.5 (5.6) (4.9) (10.2) 94.9 141.7
Attributable to minority shareholders in subsidiaries - 19.5 1.3 - (0.1) 20.8 20.8
Dividends paid to Keolis S.A. shareholders - (19.1) - - - (19.1) (19.1)
Other changes (including effects of application of IFRIC 21) - 3.0 - - - 3.0 3.0
OPERATIONS ATTRIBUTABLE TO KEOLIS S.A.
SHAREHOLDERS (A) - (16.2) - - - (16.2) (16.2)
Dividends paid to minority shareholders in subsidiaries - (0.5) - - - (0.5) (0.5)
Change in shareholdings in subsidiaries related to gaining /
losing control - - - - - - -
Change in shareholdings in subsidiaries without gaining/losing
control - 38.9 - - - 38.9 38.9
OPERATIONS ATTRIBUTABLE TO MINORITY
SHAREHOLDERS IN SUBSIDIARIES (B) - 38.4 - - - 38.4 38.4
Profit for the year - 4.4 - - - 4.4 4.4
Gains / (losses) recognised directly in equity - - 0.5 0.1 12.7 13.2 13.2
COMPREHENSIVE INCOME (C) - 4.4 0.5 0.1 12.7 17.6 17.6
CHANGE IN THE YEAR (A+B+C) - 26.6 0.5 0.1 12.7 39.8 39.8
Attributable to Keolis S.A. shareholders - (4.2) 0.4 0.1 12.7 9.0 9.0
Attributable to minority shareholders in subsidiaries - 30.8 - - - 30.8 30.8
AT 31 DECEMBER 2015 46.9 161.6 (3.8) (4.8) 2.4 155.5 202.3
Attributable to Keolis S.A. shareholders 46.9 111.3 (5.1) (4.8) 2.5 103.9 150.8
Attributable to minority shareholders in subsidiaries - 50.3 1.3 - - 51.5 51.5
4 • Statement of changes in equity
RESERVES AND OTHER
Items that may be
reclassified to profit or loss
35
2. Consolidated financial statements
(€ million) Note 31/12/2015 31/12/2014
Operating profit before investments under equity method 4.3 37.0 34.5
Non-cash items 4.4 169.8 152.9
EBITDA 4.4 206.7 187.4
Elimination of provisions on current assets - 4.6
Changes in working capital (70.6) (32.3)
Tax paid (28.0) (17.8)
A) Net cash from operating activities 108.2 141.9
Capital expenditure (201.4) (181.5)
Proceeds from the sale of tangible and intangible assets 44.5 33.9
Investment grants received 8.1 2.5
Change in financial assets for concessions (IFRIC 12) (14.2) (19.1)
Financial investments (140.1) (90.0)
Proceeds from disposal of financial assets 6.5 10.9
Cash flows on changes in reporting scope 4.7 27.2
B) Net cash from investing activities (292.0) (216.1)
Free cash flow (183.8) (74.3)
Net dividends paid (19.6) (19.7)
Net dividends received 31.8 13.3
Change in equity (other transactions with shareholders) 38.7 13.0
New borrowings 443.7 59.3
Borrowings repaid (160.2) (120.2)
Interest received 1.3 1.1
Interest paid (13.0) (9.8)
Change in other financial debts 0.1 0.1
Other (3.7) (6.2)
C) Net cash from financing activities 319.1 (69.2)
D) Foreign exchange translation differences 1.5 3.0
Change in cash and cash equivalents (A+B+C+D) 136.7 (140.4)
Cash and cash equivalents at beginning of period 5.8 (92.5) 47.9
Cash and cash equivalents at end of period 5.8 44.2 (92.5)
Change in cash and cash equivalents 136.7 (140.4)
5 • Statement of cash flows
36
2. Consolidated financial statements
1 • General information
The activity of Keolis S.A. and its subsidiaries (“the Group”) is
multimodal passenger transport. The Group operates in 9
European countries, in Canada, Australia, the United States
(Washington, California, Florida and Virginia) and India as a licen-
sed public service operator within public-private contracts.
The company Keolis S.A., the Group’s holding company, is a
société anonyme (public limited company) registered and domi-
ciled in France, with its registered office located at 20/22, rue Le
Peletier, 75320 Paris Cedex 09.
The consolidated financial statements of the Group for the finan-
cial year ended 31 December 2015 were approved by the Board
of Directors on 3 March 2016.
The financial statements of the Group are fully consolidated into
those of GROUPE KEOLIS S.A.S. which SNCF fully consoli-
dates.
2 • Summary of significant
accounting policies
2.1 Basis of preparation
The Group's consolidated financial statements for the reporting
period ending 31 December 2015 have been prepared in accor-
dance with IFRS (standards and interpretations) published by
IASB as adopted by the European Union and rendered manda-
tory from 1st January 2015. They are available at this site:
http://ec.europa.eu/internal_market/accounting/ias/index_fr.htm
The consolidated financial statements are presented in millions
of euros unless otherwise indicated.
In the absence of borrowing or equity instruments traded on a
regulated market, the Group chose not to publish information on
earnings per share (IAS 33), or information about operating seg-
ments (IFRS 8).
The assets and liabilities in the Group’s consolidated financial sta-
tements are measured and recognised according to various mea-
surement bases authorised by IFRS, primarily at the historical cost
basisofaccounting,withtheexceptionofderivativefinancialinstru-
ments and financial assets held for trading purposes or classified
as AFS (available for sale), which are measured at fair value.
2.2 Changes in accounting principles
Application of standards, amended standards and
interpretations that are mandatory as of 1st January 2015
•	Standards relative to the scope and method of consolidation
(IFRS 10, 11, 12, IAS 27 version IFRIC Interpretation 21 Levies)
IFRIC Interpretation 21 Levies identifies the obligating event,
on the liability side of the balance sheet, which triggers taxes that
fall within the scope of application of IAS 37 Provisions,
Contingent Liabilities and Contingent Assets. Taxes are outflows
of resources that represent economic benefits imposed by
public authorities by virtue of the laws or regulations.
However, the scope of application of this interpretation excludes
outflows of resources referred to in IAS 12 Income Taxes: fines
and penalties imposed for non-compliance with the laws and
regulations in effect, and payments made by the entity in the
framework of a contractual agreement with a public authority on
the acquisition of an asset or the performance of a service.
IFRIC Interpretation 21 requires the recognition of the liability
according to the due dates of the taxes and not their related
commitments. The application of this interpretation within the
Group has led solely to changes in the timing of recognition and
to the annual period used to calculate the tax related to the
corporate social solidarity contribution (C3S) in effect in France,
which had in the past been recognized on a proportional basis
in each interim period in accordance with turnover for the current
period. Henceforth, it is posted on the date of the event that
triggers the tax payment obligation, i.e. 1 January, in accordance
with the turnover of the prior calendar year.
The impact of the application of the interpretation results in
improved shareholders' equity as at 1 January 2014 in the
amount of €2.3 million. But, the impact on the 2014 profit and
loss statement is not significant. As the impact is not material,
this improvement in shareholders' equity was recognized at the
start of the 2015 financial year.
The application of IFRIC 21 at the end of December 2015 led to
a restatement of the CS3 expense posted at the end of 2014 in
the amount of €3.5 million, with a tax due date on 1 January
2015. The expense related to this tax without applying IFRIC 21
would have been €1.8 million taking account of the tax authori-
ties' changes to the valuation methods for the 2016 fiscal year.
•	Annual Improvements to IFRSs 2011-2013 Cycle
The annual Improvements to the IFRSs 2011-2013 Cycle apply
to financial years beginning on or after 1 July 2014 and mainly
relate to IFRS 3 Business Combinations and IFRS 13 Fair Value
Measurement. IFRS 3 has been amended so as to exclude the
creation of all types of joint arrangements, as defined in IFRS 11
Joint Arrangements, i.e. joint ventures and joint operations, from
its scope of application. With regard to IFRS 13, it now exceptio-
nally allows for fair value to be measured not only for a series of
Notes to the consolidated financial statements
C
37
2. Consolidated financial statements
financial assets and liabilities on a net basis, but also for the mea-
surement of the fair value of all contracts that fall under IAS 39
Financial Instruments: Recognition and Measurement, even if
they do not comply with the definition of financial assets and lia-
bilities under IAS 32 Financial Instruments: Presentation.
These improvements have no impact on the presentation of the
last financial year.
Standards, amendments to standards and interpretations
not subject to early application
In general, the Group does not apply in advance the standards
and interpretations adopted by the European Union that apply
to annual periods that start before 1 January 2015.
The Group has not applied the standards, annual improvements,
amendments to standards and interpretations that have not
been adopted by the European Union.
•	Annual Improvements to IFRSs 2010-2012 Cycle
The amendments applicable to the annual periods starting on
or after 1 February 2015 relate to IFRS 2 Share-Based
Payment, which defines a performance condition and a service
condition; IFRS 3 Business Combinations, which provides
details on the recognition of potential consideration; IFRS 8
Operating Segments (not published by the Group); IFRS 13
Fair Value Measurement, which explains the reasons for the
elimination of the paragraphs related to the valuation of short-
term receivables and payables, with no stated interest rate on
the invoice amounts; IAS 16 Property, Plant and Equipment
and IAS 38 Intangible Assets, which indicate that accumulated
depreciation is calculated on the difference between the gross
amount and the net amount accounted for; and IAS 24 Related
Party Disclosures, which stipulates that the reporting entity is
exempted from the obligation to report the amount of the remu-
neration paid to top executives, but it must indicate the amount
of fees paid to service provider entities.
•	Annual Improvements to IFRSs 2012-2014 Cycle
Amendments that apply to the annual periods starting on or after
1January2016relatetoIFRS5Non-CurrentAssetsHeldforSale
and Discontinued Operations with a view to include therein the
assets held for distribution to the owners; IFRS 7 Financial
Instruments: Disclosures, with regard to the continuing involve-
ment in a transferred asset via a service agreement and the lack
of information on the offsetting of financial assets and financial
liabilities in condensed interim financial statements; IAS 19
Employee Benefits clarifying that the discount rate should be
applied no longer at country level but according to the currency;
andIAS34InterimFinancialReporting,whichprovidesanexpla-
nationfortheexpressionelsewhereintheinterimfinancialreport.
•	Amendments to IAS 1: Presentation of Financial Statements
The amendments applicable to the annual periods starting on
or after 1 January 2016 stipulate that the application of the mate-
riality concept applies to financial statements, including the
appended notes to improve their understandability, and that
professional judgement is to be used more broadly in the infor-
mation on accounting methods included in the notes.
•	Amendments to IAS 16: Property, Plant and Equipment and
IAS 38 Intangible Assets
The amendments applicable to the annual periods starting on
or after 1 January 2016 indicate that the use of the revenue
based depreciation methods are not appropriate.
•	Limited amendments to IAS 19 Employee Benefits
The amendments applicable to the annual periods starting on
or after 1 February 2015 clarify and simplify the recognition of
contributions, which do not depend on the employee's number
of years of service to the employer, as a reduction in the service
cost in the period in which the service is rendered instead of
being allocated across the period of service.
•	Amendments to IAS 27 Equity Method in Separate Financial
Statements
The amendments applicable to the annual periods starting on
or after 1 January 2016 allow for the use of the equity method
as described in IAS 28 Investments in Associates and Joint
Ventures and no longer according to IFRS 9 Financial
Instruments to measure investments in subsidiaries, associates
and joint ventures in the separate financial statements.
•	Amendments to IFRS 11 Joint Arrangements
The amendments applicable to the annual periods starting on
or after 1 January 2016 describe the method to recognize acqui-
sitions of interests in a joint operation whose operations consti-
tute a business within the meaning of IFRS 3 Business
Combinations.
Standards applicable after 2015 and not yet approved by
the EU
The Group does not apply the following texts that did not apply
in 2015 but should become mandatory in the future:
◗ IFRS 15 – Revenues from Contracts with Customers (published
inMay2014).ThisstandardwillreplaceIAS18RevenueandIAS
11 Construction Contracts. The application of this standard
should become mandatory for the 2018 and ensuing annual
periods, subject to being adopted by the European Union;
◗ IFRS 9 – Financial Instruments (published in July 2014). This
text relates to the classification and valuation of financial instru-
ments, the deprecation of financial assets and hedge accoun-
ting. This standard will replace IAS 39 Financial Instruments;
it should become mandatory for the 2018 and ensuing annual
periods, subject to being adopted by the European Union.
38
2. Consolidated financial statements
The Group is examining these standards in order to determine
their impact on the consolidated financial statements, as well as
their practical consequences.
2.3 Use of Management estimates in the application of
the Group’s accounting standards
In order to draw up the Group’s accounts in accordance with
IAS 8 - Accounting Policies, Changes in Accounting Estimates
and Errors, management must make estimates and assump-
tions affecting the amounts stated in the financial statements.
Management has to revise such estimates in the light of changes
in the circumstances on which they are based or further to new
information. Management also has to exercise judgement in how
accounting methods are applied. As a result, future estimates
may be different from those adopted as of 31 December 2015.
The estimates and assumptions primarily concern the lengths of
contractual relations, asset impairment tests, deferred tax assets
and financial instruments, as well as provisions, in particular
provisions for pensions, litigation and losses on contracts and
recognition of amounts to be received and penalties to be paid
arising from contractual relationships.
Finally, in the absence of standards or interpretations applicable
to a specific transaction, Group management must use its best
judgement to define and implement accounting methods that
provide the most relevant and reliable information, to ensure that
the financial statements:
◗ present a true and fair view of the Group’s financial position and
cash flows;
◗ reflect the economic reality of the accounts.
2.4 Accounting principles
2.4.1 Methods of consolidation
Subsidiaries are recognised in the consolidated statements from
the date on which control thereof reverted to the Group. They
are derecognised from the date on which the Group ceased to
control them. The income and expenses of the companies are
included in the Group's income statement from the date that
control was taken, and up to the date on which the Group lost
control.
 
Fully consolidated subsidiaries
All the Group’s subsidiaries are companies it exclusively controls
directly or indirectly. The Group’s consolidated financial state-
ments include the assets, liabilities, income and expenses of
these companies.
Exclusive control exists when Keolis S.A. has power over the
entity, is exposed or has rights to variable returns, and has the
ability to affect those returns. In ascertaining whether there is
control, account is taken of the established rules of governance
and the rights held by the other shareholders in order to ensure
that they are merely protective in nature. Potential voting rights,
whether immediately exercisable or convertible, including those
held by another entity, are also analysed to determine those
conferring substantive rights in the assessment of power, in
accordance with IFRS 10 “Consolidated Financial Statements”.
Structured entities substantially controlled by the Group are fully
consolidated.
Associates and joint ventures consolidated under the
equity method
Entities in which the Group exerts significant influence without
exercising control are associates. Significant influence is presu-
med when the Group holds upwards of 20% of the voting rights.
Under the equity method, investments in associates or joint
ventures are capitalised in the consolidated balance sheet at
their cost of acquisition. The Group's share of income (loss) of
associates or joint ventures is recognised in profit or loss, whe-
reas its share of post-acquisition movements in reserves is reco-
gnised in reserves. Post-acquisition movements are posted in
adjustment to the value of the investment. The Group's share of
an associate’s or a joint venture’s losses is recognised up to the
limit of the carrying amount of the investment as well as any
possible long-term share. Additional losses are not booked as
provisions, unless the Group is legally or implicitly required to
support the said associate or joint venture.
Non-controlling investments
A non-controlling investment is the share of interest in a subsi-
diary which is not directly attributable to the parent company.
Non-controlling investments are recognised at fair value on the
takeover date.
Year-end closing timing differences
For companies whose financial year does not end on 31st
December, interim financial statements as at 31st December are
established.
Transactions eliminated in the consolidated financial
statements
Transactions between consolidated companies which have an
impact on their balance sheet or income statement are elimina-
ted. Losses on transactions between consolidated companies
that are indicative of value impairment are not eliminated. IAS 12
“Income Taxes” applies to temporary differences resulting from
the elimination of profits and losses on intra-group transactions.
2.4.2 Translation of transactions and financial statements
of foreign companies
The Group’s consolidated financial statements are prepared in
39
2. Consolidated financial statements
euros, which is the functional and reporting currency of the
parent.
Translation of the financial statements of foreign
companies
The financial statements of consolidated foreign subsidiaries,
whose functional currency is different from the euro which is the
reporting currency, are translated on the following bases:
◗ assets and liabilities are translated at the official exchange rates
prevailing at the year-end date;
◗ income and expenses are translated at the average rate for the
period, unless exchange rates fluctuate significantly;
◗ goodwill and fair value adjustments recognised on the acqui-
sition of companies whose functional currency is not the euro
are considered to be the assets and liabilities of such compa-
nies: they are thus stated in the functional currency of the said
companies and converted at the closing rate of each period;
◗ the resulting foreign exchange translation differences are reco-
gnised in consolidated equity under the item “foreign exchange
translation reserves”.
Translation of foreign currency transactions
The functional currency of Group companies is their local cur-
rency. Transactions denominated in foreign currency are trans-
lated by the subsidiaries into their functional currency at the rate
of exchange prevailing at the transaction date.
Monetary assets and liabilities denominated in foreign currency
are translated into euros at the last official year-end exchange
rate. The corresponding exchange differences are recorded in
financial income (expense).
2.4.3 Business combinations
The Group has applied IFRS 3 (Revised) since 1st January 2010.
A business combination is understood to involve the obtaining
of control. Upon acquisition of a controlling interest, the acquirer
recognises the fair value of the acquired assets and liabilities of
the acquired entity and also assesses the goodwill or profit from
them.
Non-controlling interests are recognised according to the fol-
lowing options for each combination:
◗ either based on their share in the fair value of the assets and
liabilities acquired (the so-called partial goodwill method);
◗ or at fair value of the shareholding (the so-called complete
goodwill method).
Acquisition costs are expensed in the year.
For a takeover in several stages, the investment held prior to the
establishment of control is revalued at its fair value on the date of
takeover and any profit or loss arising therefrom is recognised in
the income statement.
Commitments linked to earn-out clauses are measured at their
fair value on the acquisition date.
Adjustments to the cash consideration during the twelve months
afterthedateofacquisitionmustbeanalysedinordertodetermine:
◗ if the adjustment is linked to new factors occurring since the
acquisition of control: counterpart in profit for the year;
◗ 	if the adjustment is the result of new information collected
enabling fine-tuning of the valuation on the takeover date:
counterparty in goodwill.
The subsequent change of debt corresponding to additional
consideration beyond the twelve month period is booked in profit
for the year.
After the acquisition of control, purchases/disposals without loss
of control are treated as transactions between shareholders and
therefore directly through equity.
2.4.4 Goodwill
Goodwill on acquisition represents the excess of the cost of an
acquisition over the share acquired by the Group of the fair value
of the acquired assets and liabilities of the acquired entity on the
date of acquisition.
The goodwill recognised for an associate is included in the value
of the investment in it under “Investments under the equity
method”, in the statement of financial position.
Corrections or adjustments may be made to the fair value of
assets, liabilities and contingent liabilities acquired in the twelve
months following the acquisition, when new information arises
affecting facts and circumstances which were in evidence at this
date of acquisition. Goodwill is then corrected with retroactive
effect. Beyond that date, any change in assets acquired and
liabilities assumed is recognised in the income statement. If the
information is a result of events occurring after the date of acqui-
sition, they are recognised in profit for the year.
As goodwill cannot be amortized, it undergoes impairment tests
every year or at more frequent intervals when events or changes
in circumstances indicate possible loss in value (see 2.4.9).
Goodwill is allocated to cash generating units or groups thereof
which are likely to benefit from synergies resulting from aggre-
gation as described in note 2.4.9.
Negative goodwill is recognised in the income statement on the
date of acquisition.
2.4.5 Commitments to repurchase the non-controlling
interests in a subsidiary
The Group has given promises to non-controlling shareholders of
certain fully consolidated subsidiaries to repurchase their shares.
40
2. Consolidated financial statements
Thesepurchasecommitments(firm orconditional)of non-control-
ling interests do not transfer risks and benefits. They are reco-
gnised in financial debts against a reduction of these earnings
attributable to non-controlling interests.
Where the value of the commitment exceeds the amount of ear-
nings attributable to non-controlling interests the balance is reco-
gnised in equity attributable to Group shareholders.
The fair value of non-controlling interest buyout commitments is
reviewed at each financial accounting period end. The change in
the corresponding financial liability is booked against equity.
This provision applies to commitments to purchase non-control-
ling interests issued after the application date of revised IFRS 3,
i.e. 1st January 2010.
For those issued before that date, the change in valuation will be
booked against the associated goodwill.
2.4.6 Service concession arrangements
Presentation of the IFRIC 12 interpretation
An arrangement is included in the scope of interpretation of IFRIC
12, where the assets used to carry out the public service are
controlled by the grantor. Control is presumed when the two
conditions below are met:
◗ the grantor controls or regulates the public service, i.e. it
controls or regulates the services that must be rendered,
through the infrastructure covered by the concession and
determines to whom and at what price the service shall be
rendered; and
◗ the grantor controls the infrastructure on termination of the
contract, i.e. the right to regain possession of the infrastructure
at the end of the contract.
In its public transport activities, the Group is in particular the
holder of outsourced public service contracts.
In France, the Group operates outsourced public service
contracts, mainly in the form of operate and maintain (OM)
contracts whereby the operator is responsible for operating and
maintaining facilities owned and funded by local and regional
authorities – Public Transport Authorities (PTAs).
Pursuant to the interpretation of IFRIC 12, in this case, the ope-
rator cannot include the infrastructure controlled by the grantor
in its balance sheet as tangible assets, but either as an intangible
asset (“intangible asset model”) and/ or as a financial asset
(“financial asset model”):
◗ the “intangible asset model” applies where the operator
receives a right to charge users for the public service and thus
bears a financial risk;
◗ the “financial asset model” applies where the operator obtains
an unconditional right to receive cash or other financial asset,
either directly or indirectly through guarantees given by the
grantor on the amount of cash payments from the public ser-
vice. The remuneration is independent of the extent to which
the public uses the infrastructure.
Where the service is provided using infrastructure rented from a
third party and controlled by the grantor, the Group has reco-
gnised payments of fixed and variable fees in the IFRIC 12 asset
valuation.
Financial asset model
In service concessions, the operator receives an unconditional
right if the grantor gives it a contractual guarantee to pay:
◗ amounts specified or determined in the contract; or
◗ the shortfall, if any – between the amount received from users
of the public service and specified or determinable amounts in
the contract.
Financial assets stemming from the application of the IFRIC 12
interpretation are recorded in the statement of financial position
under “Non-current financial assets” detailed in Note 5.5. They
are recognised at amortised cost and repaid according to the
rents collected.
The financial income, calculated on the basis of the effective rate
of interest, the equivalent of the project's internal rate of return,
is recognised as revenue.
Intangible asset model
The intangible asset model applies where the operator is paid
by users or does not receive any contractual guarantee from the
grantor on the amount to be collected. The intangible asset
corresponds to the right granted by the grantor to the operator
to charge users for the public service.
Intangible assets resulting from the application of the IFRIC 12
interpretation are booked in the statement of financial position
under the heading “Other intangible fixed assets” detailed in
Note 5.2. These assets are amortised straight-line over the term
of the contract.
Within the framework of the intangible asset model, revenues
include:
◗ Turnover as and when assets or infrastructures under construc-
tion are completed;
◗ Remuneration relating to the provision of services.
Mixed or bifurcation model
Application of the financial asset model or the intangible asset
model is based on the existence of guarantees of payment given
by the grantor.
However, certain contracts may include a payment commitment
from the grantor which partially covers the investment, with the
41
2. Consolidated financial statements
balance covered through fees charged to users.
In this case, the amount guaranteed by the grantor is recognised
as a financial asset and the balance as an intangible asset.
2.4.7 Intangible assets excluding goodwill
Intangible assets are shown in the statement of financial position
at their acquisition cost less the accumulated amortisation and
impairments.
Intangible assets mainly consist of patents, licences, trademarks,
rights under contracts, pension plan assets, software and ser-
vice concession intangible assets as defined by IFRIC 12.
When contracts are awarded, the Group capitalises the costs
that match the identification criteria, and that are incurred
between the date when the contract is awarded and the date
when the operation actually starts up.
When the Group completes an acquisition, the contractual rela-
tionship between the acquired company and its client (the public
transport authority) is assessed at fair value and recognised
separately from the goodwill as a contractual right satisfying the
qualifying criteria of IAS 38 and IFRS 3.
Where their useful life is defined, intangible assets are amortised
on a straight-line basis over periods corresponding to their
expected useful life. The amortisation method and useful lives
are revised at least each financial year or when necessary. The
estimated useful lives are as follows:
◗ trademarks: between five and fifteen years;
◗ contractual rights: two to twenty years, corresponding to their
estimated useful life, allowing for a contract renewal rate when
the Group has a high renewal rate in the Cash Generating Unit
(CGU) concerned;
◗ software: one to five years;
◗ service concession assets: amortised over the term of the
contract (see 2.4.6).
2.4.8 Property, plant and equipment
Expenditure on property, plant and equipment by the Group is
recognised as an asset at its acquisition cost where it satisfies
the following criteria:
◗ it is likely that the future economic benefits relating to the asset
will fall to the Group;
◗ the cost of the asset can be reliably measured.
Property, plant and equipment are shown in the statement of
financial position at their acquisition cost less the accumulated
depreciation and impairments. The cost includes the asset’s
purchase or production cost and all the costs directly incurred
in making them usable.
Items of property, plant and equipment cease to be recognised
as assets when they are derecognised (through disposal or
retirement), or when no future economic benefit is expected from
their use or disposal. Any gain or loss arising from the dereco-
gnition of an asset from the statement of financial position (the
difference between the net income from disposal and the asset’s
carrying amount) is recognised in the income statement in the
period of its retirement.
Given the nature of the Group’s business, the activities of the
different subsidiaries do not include holding investment property
assets.
Subsequent expenditure
Subsequent expenditure incurred in replacing property, plant or
equipment is recognised under PPE only if it satisfies the fore-
going general criteria and qualify as components.
Otherwise, this expenditure is recognised in the income state-
ment as incurred.
Through its public passenger transport activity, the Group incurs
multiyear expenditure on heavy maintenance and major servicing
operations on its light rail (underground railway, tramway) and
passenger rail rolling stock. These are capitalised as assets as a
component overhaul, which is subsequently depreciated.
Furthermore, expenditure which relates to refurbishments or
leads to an increase in productive capacity and modifications
bringing new functionality or that extend lifespans are contribu-
tions that can be qualified as operator assets.
Depreciation
The residual values and useful lives of the assets are reviewed
and, where applicable, adjusted, annually or whenever lasting
changes arise in operating conditions.
To date, the residual values at the end of the useful life are
regarded as immaterial.
Land is not depreciated. Other property, plant and equipment
items are depreciated using the straight line method. The esti-
mated useful lives are as follows:
Buildings 15 - 20 years
Equipment and tooling 5 - 10 years
Office equipment and furniture 5 - 10 years
Vehicles:
Cars 5 years
Coaches and buses 10 - 15 years
Rolling stock 15 - 30 years
42
2. Consolidated financial statements
Lease agreements
As part of its various operations, the Group uses assets made
available through lease agreements.
These lease agreements are the subject of an analysis based on
the situations described and indicators provided in IAS 17 in
order to determine whether they are operating lease agreements
or finance leases.
Finance leases are agreements that transfer almost all of the risks
and benefits of the relevant asset to the lessee. All the lease
agreements that do not comply with the definition of a finance
lease are classified as operating lease agreements.
The main indicators examined by the Group to assess whether
a lease agreement transfers almost all of the risks and benefits
are as follows: the existence of an automatic ownership transfer
clause or a transfer option; the conditions under which this
clause may be exercised; a comparison between the length of
the lease and the estimated life of the asset; the uniqueness of
the asset used, and a comparison of the present value of the
minimum payments under the agreement with the fair value of
the asset.
Recognition of finance leases
At the point of initial recognition the assets treated as finance
leases are posted as tangible assets, with a corresponding finan-
cial debt. The asset is recognized at the fair value of the asset at
the start of the lease or, if it is lower, the present value of the
minimum payments under the lease.
Recognition of operating leases
Payments made under operating lease agreements are reco-
gnised as expenses in the income statement.
Government investment grants
Government grants wholly or partly covering the cost of investing
in an asset are recognised as “Trade payables and other liabili-
ties” and systematically written down in the income statement
over the useful lives of the assets concerned.
 
2.4.9 Impairment of capitalised assets and non-financial
assets
The Group performs systematic impairment tests annually (or
more frequently where value impairment is indicated) of goodwill
and other intangible assets that have indefinite useful lives, and
therefore cannot be depreciated.
For property, plant and equipment, and intangible assets with
finite useful lives, which are therefore depreciated or amortised,
an impairment test is only conducted where impairment is indi-
cated.
Cash Generating Units (CGUs) are the smallest group of assets
generating cash flows largely independently of other asset
groups. Such units or groups of units correspond to activities in
France, and internationally are mainly classed by country.
For testing purposes, the assets are aggregated within CGUs in
accordance with IAS 36 “Impairment of Assets”.
These tests compare the net carrying amount of assets with their
recoverable amount, which is the higher of the fair value less the
potential sales costs or the value in use of the asset. In the
absence of any fair value observable on an organised market,
the recoverable value of the CGUs is determined on the basis of
their value in use.
The carrying amount of each asset group tested was compared
with its value in use defined as the sum of the net cash flows
arising from the latest forecasts for each of the CGUs, drawn up
using the main assumptions and procedures set out below:
◗ medium-term plan and budgets over a 5-year timeframe,
drawn up by Management on the basis of growth and profita-
bility assumptions taking account of past performance, fore-
seeable developments in the economic environment and the
expected development of markets;
◗ extrapolation of the net cash flow of the last year or the average
of cash flows over the five previous years by applying the
growth assumptions stated in note 5.1;
◗ discounted future value of the cash flows arising from these
plans at a rate determined using the weighted average cost of
capital (WACC) of the Group.
Value impairment is recognised in the income statement, under
other non-recurring expense, if the carrying amount of a cash-
generating unit or group of such units is greater than its recove-
rable amount. The value impairment is allocated first to the
goodwill apportioned to the CGU or CGU group tested, then to
the other assets of the CGU or CGU group in proportion to their
carrying amount.
This allocation must not result in the carrying amount of an indi-
vidual asset being lower than its fair value, value in use or zero.
Impairment losses allocated to acquisition goodwill cannot be
reversed, unlike the impairment losses of other property, plant
and equipment and intangible assets.
In the event of an impairment loss being reversed, the asset’s
carrying amount is capped at the carrying amount, net of any
depreciation or amortisation without taking into account any
value impairment recognised in prior periods. When an impair-
ment loss or a reversal of an impairment loss has been reco-
gnised, the depreciation charge is adjusted for future periods so
that the adjusted carrying amount of the asset, less its residual
value, if any, is spread systematically over the remaining useful
life.
43
2. Consolidated financial statements
2.4.10 Financial assets
Purchases and sales of financial assets are accounted for at their
transaction date, the date on which the Group is committed to
the purchase or sale of the asset. On initial recognition, financial
assets are recognised in the statement of financial position at fair
value plus the transaction costs directly attributable to the
acquisition or issue of the asset (except for the category of finan-
cial assets measured at fair value, for which transaction costs
are recognised directly in the income statement).
Financial assets are derecognised from the statement of financial
position to the extent that entitlements to future cash flows have
expired or have been transferred to a third party, and the Group
has transferred virtually all the risks and benefits or the control of
such assets. Financial assets, the maturity (or intended holding
period) of which exceeds one year, are recognised under “Non-
current financial assets”.
On the date of initial recognition, according to the purpose for
which the asset is acquired, the Group classifies the financial
asset in one of the accounting categories specified by IAS 39,
“Financial Instruments: Recognition and Measurement”. The
Group does not use the “Held-to maturity investments” category.
Financial assets at fair value, recognised in profit or loss
These are financial assets acquired by the Group with the
intention of selling them in the short term.
Derivative financial instruments are also classified as held
for trading unless they are designated effective hedging instru-
ments. They are measured at fair value and their subsequent fair
value changes are recognised in the income statement.
Loans and receivables
Loans and receivables are non-derivative financial assets, the
payment of which is fixed or determinable and is not listed on a
regulated market. These assets are recognised at their fair value
plus the directly attributable costs of transaction and are then
measured at depreciated cost by the effective interest rate
method. An impairment loss is recognised whenever the esti-
mated recoverable amount is below the carrying amount.
This category includes operating receivables, deposits and
guarantees, loans and concession financial assets.
Available for sale (AFS) financial assets
These are non-derivative financial assets designated as being
available for sale, or not belonging to the other categories. They
are measured at their fair value in the statement of financial posi-
tion; changes in value are recognised in equity. When available
for sale financial assets are sold, or if there is an objective indi-
cation of impairment of these assets, any changes in fair value
that have been recognised directly in equity are transferred to
the income statement.
For listed securities, fair value is equal to market price; for unlisted
securities, reference is made to recent arm’s-length transactions
made between informed and willing parties, or to a technical
measurement based on reliable, objective information consistent
with the other estimates used by other market operators or using
discounted cash flow analysis. However, when the fair value of
a security cannot reasonably be estimated, in the last resort it is
carried at historical cost.
This category consists mainly of non-consolidated shareholdings.
Impairment of financial assets
Impairment is recognised on a financial asset or group of financial
assets where there is an objective indication of impairment
arising from one or more events that have occurred since the
initial recognition of the asset, and such impairing event has an
impact on the estimated future cash flows from the financial
asset or group of financial assets, and if its carrying value is
higher than its estimated recoverable value.
2.4.11 Inventories
Inventories consist mainly of consumables and miscellaneous
goods or supplies used for the maintenance and upkeep of
vehicles or intended for resale.
These inventories are valued at purchase cost. Impairment is
recognised to reduce the purchase cost (determined using the
weighted average cost (WAC) method or the First-in, First-out
(FIFO) method) to the net realisable value if lower. Pursuant to
IAS 2, the net realisable value is the estimated sale price in the
normal course of business, less the estimated cost for
completion and realisation of the sale.
2.4.12 Trade receivables and other debtors
Trade receivables and receivables from other debtors are initially
recognised at their fair value which, in most cases is their nomi-
nal value, given the generally short payment times. The carrying
amount is subsequently measured where required at an amor-
tised cost using the effective interest rate method, less any
impairment losses.
If there is an objective indication of impairment or a risk that the
Group may be unable to collect all the contractual amounts
(principal plus interest) on the date set in the contractual payment
schedule, an impairment loss is recognised in the income
statement. This allowance is equal to the difference between the
carrying amount and the estimated recoverable future cash
flows, discounted at the original effective rate of interest.
2.4.13 Cash and cash equivalents
This item includes cash, sight deposits and other short-term
44
2. Consolidated financial statements
deposits as well as other easily convertible liquid instruments
with negligible risk of a change in value, maturing less than three
months from the date of acquisition.
2.4.14 Corporate income tax
Keolis S.A. and its French subsidiaries are part of the tax peri-
meter of its parent company GROUPE KEOLIS S.A.S. Other tax
consolidation regimes also exist in Europe and in the USA. The
effect of these regimes is recognised in the income statement.
The income tax expense or income includes the current tax
expense or income and the deferred tax expense or income. Tax
is recognised in profit for the year unless it relates to items that
are directly recognised under equity, in which case, the tax is
recognised under equity.
Current tax is the estimated amount of tax due on the taxable
profit for the period. It also includes adjustments to the amount
of tax payable in respect of previous periods.
Deferred tax is calculated for each individual entity according to
the balance sheet approach, on the temporary differences
between the carrying amount of the assets and liabilities and
their taxation base, including assets of which the Group has
possession under finance lease agreements.
Measurement of deferred tax assets and liabilities depends on
whether the Group expects to recover or to pay the carrying
amount of the assets and liabilities, under the variable carry-
forward method, using the rates of taxation that were adopted
or virtually adopted at the reporting date. A deferred tax asset is
only recognised or maintained as an asset to the extent that the
Group is likely to benefit from future taxable profits to which the
related deductible temporary difference may be imputed.
Deferred tax assets and liabilities are not discounted.
Deferred tax assets and liabilities are offset in each taxable entity
when it recovers the asset and settles the liability on the same
due date, subject to the following conditions being met:
◗ legally enforceable right to offset,
◗ intention to settle,
◗ schedule of payments.
Deferred tax liabilities are recognised for all taxable temporary
differences, with the exception of certain differences between
the values of the Group's proportionate interests in the net assets
of subsidiaries, joint ventures and associates and their tax values.
This exception applies in particular to the income of subsidiaries
yet to be distributed, should distribution thereof to shareholders
generate taxation; if the Group has decided not to distribute
profits retained by the subsidiary in the foreseeable future, no
deferred tax liabilities are recognised.
2.4.15 Financial debt and long term borrowings
All borrowings are initially recognised at fair value, less the related
borrowing costs. Thereafter, they are recognised at amortised
cost, using the effective interest rate method, with the difference
between the cost and the redemption value recognised in the
income statement over the term of the borrowings.
The effective interest rate is the rate used to obtain the original
carrying amount of a loan by discounting the future cash inflows
or outflows over the loan’s term. The original carrying amount of
the loan includes the transaction costs of the operation and any
issuance premiums.
When a debt is reimbursed early, any non-amortised costs are
recognised as expenses.
2.4.16 Derivative financial instruments
The Group uses derivative financial instruments to manage
exposure to financial market risks resulting from its operational,
financial and investment activities:
◗ Interest rate risk;
◗ Foreign exchange risk;
◗ Commodities risk.
The derivative financial instruments are measured and reco-
gnised at fair value in the statement of financial position on the
date they are established, then on each financial year end date.
Fair value is measured by using standard valuation methods and
is based on the mid-market conditions commonly used in the
markets. The market data used is Level 2 data, as described in
IFRS 13.
The treatment of the gains and losses under the fair value revalua-
tion depends on whether or not the derivative instrument is consi-
dered a hedging instrument and the nature of the hedged item.
The changes in fair value of derivative financial instruments that
are not eligible for hedge accounting are recognised under finan-
cial income/(expense).
Certain derivative financial instruments are eligible for one of the
three hedge accounting categories defined in IAS 39:
◗ Fair value hedge;
◗ Cash flow hedge;
◗ Net investment hedge.
They are recognised in accordance with hedge accounting rules.
The criteria to apply hedge accounting are mainly:
◗ general hedging documentation that describes the Group's
exposure to the various financial risks and its hedging strategy,
◗ a hedging relationship clearly established on the date on which
each derivative financial instrument is established,
45
2. Consolidated financial statements
◗ the use of effectiveness testing to demonstrate the effectiveness
of the hedging relationship prospective to the date of establish-
ment, and retrospective to each financial close. This effective-
ness must be reliably measured and fall within 80% and 125%.
Interest rate, foreign exchange and commodity derivative finan-
cial instruments are entered into with first-class bank counter-
parties in accordance with the Group's counterparty risk
management policy. Consequently, the counterparty risk can be
regarded as negligible.
Interest rate risks relating to the variable rate portion of
its financial debt
The Group's interest rate risk exposure results from its financial
debt. The Group covers this risk by using derivative financial
instruments.
The objective of the risk management is to protect the Group's
financial income/(expense) from an increase in interest rates,
while taking advantage of a decrease in rates to the greatest
extent possible.
The interest rate hedging policy implemented consists in favou-
ring fixed rate derivative financial instruments. The management
horizon adopted is usually a rolling five years, but this can be
greater dependent upon the hedging requirement.
The derivative financial instruments which the Group uses are
standard, liquid and available on the market, namely:
◗ swaps;
◗ cap calls;
◗ sales of caps to unwind an existing cap or to realise a cap
spread;
◗ floor puts if tied with cap calls to create a symmetrical or asym-
metrical collar;
◗ floor calls, in particular to buy back floors that constitute asym-
metrical collars;
◗ swaption calls;
◗ swaption puts if tied with calls to constitute swaption collars.
Derivative financial instruments eligible for hedge accounting are
recognised under cash flow hedges. The derivative financial
instruments that are not eligible are recognised under trading.
Changes in the intrinsic value of derivative financial instruments
recognised under cash flow hedges are entirely recognised
within equity (OCI - other comprehensive income). The other
items are recognised as financial income/(expense):
◗ changes in fair value of derivative financial instruments not eli-
gible for hedge accounting (for example, the asymmetrical
portion of collars);
◗ changes in the time value of all derivative financial instruments;
◗ option premiums.
Foreign exchange risk
The Group has put in place intra-group loans denominated in
foreign currency and recognised in current accounts. In order to
cover the resulting foreign exchange risk, the Group uses deri-
vative financial instruments which allow it to fix the exchange rate
of these intra-group loans.
The Group also makes net investments in the capital of its foreign
subsidiaries in local currency. To cover the foreign exchange risks
engendered by these investments, the Group uses derivative
financial instruments in controlled amounts. Management’s
objective is to protect the balance sheet values of these invest-
ments in local currency. The foreign exchange hedging policy
implemented to achieve this objective consists of maintaining a
reference exchange rate defined for the year.
The derivative financial instruments used by the Group are stan-
dard, liquid and market-available:
◗ forward and futures sales and purchases;
◗ foreign exchange swaps;
◗ call options;
◗ put options in combination with call options to provide sym-
metric or asymmetric collars.
Most of the derivative financial instruments held by the Group
are eligible for net investment hedge accounting as described in
IAS 39. The derivative financial instruments that are not eligible
are recognised under trading.
Changes in the intrinsic value of derivative financial instruments
recognised under net investment hedges are entirely recognised
within equity (OCI). The other items are recognised as financial
income/(expense):
◗ changes in fair value of derivative financial instruments not eli-
gible for hedge accounting (for example, the asymmetrical
portion of collars);
◗ changes in the time value of all derivative financial instruments;
◗ option premiums.
Commodities price risks
Within the scope of its activities, the Group is exposed to a risk
in the fluctuation of the price of certain commodities, in particu-
lar diesel.
The diesel price fluctuation risk is generally hedged using price
indexation included in the contracts signed by Keolis S.A. and
its subsidiaries with their clients. For its diesel purchases, the
Group nonetheless bears the price risk until it is passed on to its
customers. This time lag, when it exists, usually lasts only a few
months, and up to a maximum of twenty-four months. A hedging
policy has been set up to cover this partial exposure.
46
2. Consolidated financial statements
Management’s objective for commodity risk management is to
defend the prices indexed under the contracts.
The Group covers this commodities risk using standard, liquid
and market-available derivative financial instruments, namely:
◗ swaps;
◗ cap calls;
◗ cap puts to unwind an existing cap or to realise a cap spread;
◗ floor puts if tied with cap calls to create symmetrical or asym-
metrical collars;
◗ floor calls, in particular to buy back floors that constitute asym-
metrical collars.
Derivative financial instruments eligible for hedge accounting are
recognised under cash flow hedges. The derivative financial
instruments that are not eligible are recognised under trading.
Changes in the intrinsic value of derivative financial instruments
recognised under cash flow hedges are entirely recognised
within equity (OCI). The other items are recognised as financial
income/(expense):
◗ changes in fair value of derivative financial instruments not eli-
gible for hedge accounting (for example, the asymmetrical
portion of collars);
◗ changes in the time value of all derivative financial instruments;
◗ the contango/backwardation component, corresponding to
the price difference between the forward price for swaps (or
exercise price for options) and the spot price;
◗ option premiums.
2.4.17 Provisions
Provisions for pension and post-employment
commitments (IAS19 revised)
The Group offers its employees various fringe benefits while they
are in employment or after employment. These benefits arise
under the legislation applicable in certain countries and under
contractual arrangements concluded by the Group with its
employees, and are either defined contribution plans or defined
benefit plans.
(a) Defined contribution plans
Defined contribution plans are characterised by payments to
organisations that discharge the employer from any subsequent
obligation, with the organisations taking responsibility for paying
employees their entitlements. Hence, once the contributions are
paid, no liability is reported in the Group’s financial statements.
(b) Defined benefit plans
Defined benefit plans refer to plans providing post-employment
benefits other than defined contribution plans. The Group has a
duty to accrue provisions for the benefits to be paid to serving
members of its staff, and to pay the benefits of former members
of its staff. In substance, the actuarial and investment risks lie
with the Group.
These plans mainly concern the following:
◗ pension commitments: pension annuity plans, retirement gra-
tuities, other retirement commitments and additional pension
benefits;
◗ other long term benefits: long service awards.
Description of commitments under defined benefit plans
Apart from ordinary, statutory schemes, the Group provides,
according to country and local legislation, retirement gratuity
schemes (France), defined benefit pension schemes (United
Kingdom and Canada) and pensioners’ health benefit schemes
(Canada and USA).
In France, retirement gratuities paid to the employee on leaving
employment are determined according to the national collective
labour agreement or the company agreement applying in the
business. The following are the two main collective labour agree-
ments applied within the Group:
◗ “Convention collective des transports publics urbains”
(CCN_3099) – the national collective labour agreement for
urban public transport;
◗ “Convention collective des transports routiers” (CCN_3085) –
the national road-haulage collective labour agreement.
These schemes are partly financed by insurance policies. Their
value is measured over the average term of the policies (20 years)
except in the case of Keolis S.A., which is measured on a per-
petuity basis.
Annual actuarial evaluations of the commitments of the defined
benefit schemes are carried out each year end primarily by inde-
pendent actuaries.
Commitments for pensions, additional pension benefits and
retirement gratuities are measured using a method that takes
account of the projected final end-of-career salaries (termed the
Projected Unit Credit Method) on an individual basis, which is
based on assumptions of discount rates and expected long-
term yields from the funds invested for each country, and on
assumptions regarding life expectancy, staff turnover, trends in
pay, annuity revaluations and the discounted value of payable
sums. The specific assumptions for each plan take local econo-
mic and demographic factors into account.
The value entered in the statement of financial position under pro-
visions“pensionsandotheremploymentbenefits”isthedifference
between the discounted value of the future obligations and the fair
value of the pension plan assets intended to cover them. Where
the result of this calculation is a net commitment, an obligation is
recognised as a liability in the statement of financial position.
47
2. Consolidated financial statements
When bids are won in France or abroad, the asset representing
pension rights and all other employee benefits recognised at the
start of the franchise is determined on the basis of the amount
of pension liabilities and other employee benefits over the esti-
mated life of the contract.
Actuarial gains/losses relating to post-employment benefits
resulting from experience and changes in actuarial assumptions
are recognised directly in equity in the year in which they are
incurred and are offset against the increase or decrease of the
obligation. They are set out in the statement of comprehensive
income.
In the income statement, the cost of service earned during the
financial year is included in the operating profit.
The interest cost in respect of the discounting of pensions and
similar obligations, and the income relating to the expected yields
from the pension plan assets, are recognised under financial
income and expense.
The actuarial calculations for pension and similar commitments
are mainly performed by independent actuaries.
Long service medals are valued on the same basis as pension
commitments, with the exception of the recognition of actuarial
gains and losses. Actuarial gains and losses are recognised in
the income statement.
Furthermore, the Group has implemented a long-term employee
retention scheme.
Other types of provisions
Provisions are accrued where at the end of the reporting period
there is a present legal or implicit obligation towards third parties
arising from a past event and there is a probability that an outflow
of resources embodying economic benefits will be required to
settle this obligation and a reliable estimate can be made of the
amount.
In the context of its activity, the Group is generally subject to a
contractual obligation to carry out multiyear heavy maintenance
and major servicing operations on facilities managed under a
public service agreement. The resulting maintenance and repair
costs are analysed in accordance with IAS 37 on provisions and,
where applicable, provisions are accrued for heavy maintenance
and major servicing and also for lossmaking contracts in the
event that the unavoidable costs incurred to meet the contrac-
tual obligation are greater than the economic benefits of the
contract.
In cases of restructuring, an obligation is accrued in so far as the
restructuring has been announced and is the object of a detailed
formalised plan or has been started prior to the reporting date.
Provisions due in more than one year are discounted whenever
the impact is material.
2.4.18 Payments in shares and similar payments
The Group has no share option plans or share purchase war-
rants for the benefit of its members of staff.
2.4.19 Trade payables and other accounts payable
Trade payables and other accounts payable are measured at
their fair value at initial recognition, which in most cases is their
nominal value, and otherwise at the amortised cost. Short-term
payables are recognised at their nominal amount unless dis-
counting at the market rate would have a material impact.
In the event of long payment delays, the suppliers’ debt is dis-
counted.
Other payables include deferred revenues, corresponding to
income received for services not yet provided, and investment
grants not yet credited in the income statement.
2.4.20 Revenue and other business income
Revenue and other business-related income are measured at
the fair value of the consideration received or accrued.
They are measured net of discounts and commercial benefits
given, where the service has been provided. No income is reco-
gnised where there exists significant uncertainty as to the reco-
verability of the consideration receivable or the costs incurred or
to be incurred in relation to the service, and where the Group
remains involved in managing the income.
The revenue from urban passenger transport companies is
recognised according to the terms of the contract signed with
the public transport authority, taking account of all additional
clauses and any vested rights (indexation clauses, etc).
The same applies for revenue from intercity passenger transport
companies, and other activities not under contract, recognised
according to the services provided.
Revenues include fees from value added services arising from
the Group’s knowhow. These activities (excluding transportation)
mainly relate to the management of airports and bike rental.
Other business-related income covers fees for services consis-
ting mainly of revenues classified by the Group as incidental, as
well as the remuneration of concession financial assets.
2.4.21 Other operating expenses
Since they are a recurrent feature of the activity, losses or gains
on sales of transport equipment are recognised on a separate
line, and included in profit from continuing operations.
48
2. Consolidated financial statements
2.4.22 Other operating income
Other operating income mainly comprises the CICE (tax credit
for competitiveness and employment), which was created to
help companies finance their competitiveness, in particular
through investment, research, innovation, recruitment, prospec-
tion of new markets, environmental transition and replenishment
of their working capital. It applies to remuneration not exceeding
two and a half times the minimum wage that the companies pay
their employees in the course of the calendar year. In 2015, the
tax credit rate remained unchanged at 6%.
The CICE is deducted from corporate income tax due for the
year during which the remuneration used for the calculation of
the tax credit was paid. Any non-deducted credit is treated as a
receivable from the State and can be used to pay tax due in the
three years following that in which the credit was earned. At the
end of this period, any remaining non-deducted amount is reim-
bursed to the company.
The Group holds the view that the CICE is a type of public sub-
sidy within the application of IAS 20, insofar as it is used for
financing working capital related expenditure. The CICE is reco-
gnised under operating subsidies in the line “Other operating
income” of the consolidated income statement.
2.4.23 Recurring operating profit
Recurring operating profit corresponds to the whole of the
expenses and income arising from the Group’s recurring opera-
ting activity before financing activities, the earnings of associates,
activities discontinued or being sold and taxation.
2.4.24 Operating profit or loss
Operating profit includes recurring operating profit and all tran-
sactions not directly related to the normal conduct of business,
but that cannot be directly attached to any other item in the
income statement.
Income and expenses, charges to depreciation and provisions
on non-recurring items include all non-recurring operations
where costs are significant: this applies in particular to offensive
bids, restructuring costs, disposal gains or losses on assets
other than transport equipment, the amortisation of contractual
rights and startup costs in a new country or zone, and to other
items that are by their nature non-recurring.
Effects of changes in scope recognised directly in income
include:
◗ direct acquisition costs in the case of a takeover;
◗ effects of revaluations, at fair value on the acquisition date, of
non-controlling interests previously acquired in the case of an
acquisition in stages;
◗ subsequent earn-outs;
◗ profit or loss from divestments of holdings which lead to a
change in the method of consolidation as well as, where appli-
cable, the revaluation effects of retained non-controlling inte-
rests.
2.4.25 EBITDA calculation
EBITDA is calculated based on operating profit/(loss), plus or
minus the profit or loss on asset disposals, the amounts repre-
senting depreciation and amortisation, increases and reversals
of provisions and the share of grant income released.
Recurring EBITDA corresponds to EBITDA less material non-
recurring items.
2.4.26 Financial income / (expense)
Financial expenses include interest on borrowings and financial
debt calculated using the effective interest rate method, the cost
of early loan repayments or of cancelling credit lines, the financial
interest not directly attributable to the operating margin and the
financial cost of discounting non-current liabilities.
Financial income includes income from deposits of cash or cash
equivalents and dividends received from non-consolidated com-
panies.
Other financial income and expense include net foreign exchange
gains and losses, bank commissions on credit transactions
booked as an expense and their rebilling as income, changes in
the fair value of derivative financial instruments when they are to
be recognised in the income statement and are recognised
respectively as financial income or expenses on transactions,
with the exception of changes in the fair value of hedging deri-
vatives which are recorded on the same line as the transaction
hedged within operating profit. Therefore, any change in the fair
value of derivatives, when they are not eligible for hedge accoun-
ting, and the change in value of the ineffective portion for cash
flow hedging are recognised in the financial result.
All interest on borrowings is recognised as a financial expense
as and when incurred.
2.4.27 Changes made to comparative periods
The only change in accounting principles to be noted is that
presented under paragraph 2.2 relating to the application of the
IFRIC 21 Interpretation “Levies” as of 1 January 2015.
49
2. Consolidated financial statements
3 • Highlights of financial year 2015
Acquisition of ATE in Australia
On 1 May 2015, Keolis Downer (51%-owned by Keolis and 49%
by Downer EDI), Australia’s largest light rail operator, acquired
Australian Transit Enterprises (ATE), one of the country’s biggest
bus operators.
Through this acquisition, Keolis Downer has become the leading
privately-owned multi-modal public transport operator in
Australia.
Established in 1974 as a family business, ATE has since conti-
nued to grow, generating revenue of approximately AUD 190
million (€136 million) in 2014. Headquartered in Brisbane, ATE
operates a fleet of nearly 1,000 buses and runs urban, inter-city
and school services in three states: South Australia (Adelaide),
Western Australia (Perth) and Queensland (Brisbane). The com-
pany currently employs 1,600 people.
As the 5th largest private bus operator in Australia, ATE consists
of 4 business divisions:
Path Transit, providing timetabled route and school bus services
in the suburbs of Perth (Western Australia);
Southlink, providing timetabled route and school bus services in
metropolitan Adelaide (South Australia).
LinkSA, providing timetabled route, school, special bus and dial-
a-ride services within 100 km of Adelaide (South Australia);
Hornibrook, providing timetabled route and school bus services
in the suburbs of Brisbane (Queensland).
50
2. Consolidated financial statements
4 • Notes to the consolidated income statement
4.1 Staff costs
Staff costs
4.3 Operating profit
Average number of employees
(€ million) 31/12/2015 31/12/2014
Wages and social charges (2,367.8) (2,173.6)
Taxes on remuneration (61.4) (61.1)
Other staff expenses(1)
(391.4) (224.1)
Total (2,820.6) (2,458.8)
31/12/2015 31/12/2014
Managers 2,012 1,769
Supervisory and technical staff 6,165 5,919
Clerical and manual employees, drivers 45,089 42,143
Total 53,266 49,831
The average number of staff in the companies acquired during the period is averaged over the period.
(1) Other staff expenses include incentive schemes and profit sharing.
(1) This item includes negative goodwill in Belgium amounting to €5.7 million in 2015 and €5.3 million of depreciation of goodwill in the USA in 2014.
(€ million) 31/12/2015 31/12/2014
Recurring operating profit 56.2 67.7
Non-recurring costs of offensive bids (12.4) (15.6)
Profit/(loss) on non-recurring fixed asset disposals 0.5 1.0
Amortisation of contractual rights and trademarks(1)
(1.6) (9.4)
Other non-recurring items (5.7) (9.3)
◗ Net reorganisation expenses (8.5) (6.0)
◗Change in provisions for contract losses 1.4 3.3
◗ Other 0.2 (6.6)
Total non-recurring items (19.2) (33.2)
Operating profit before investments under equity method 37.0 34.5
4.2 Other operating income
Under the CICE, the Group received €48.0 million in 2015, compared to € 48.1 million in 2014.
51
2. Consolidated financial statements
4.4 EBITDA calculation
4.5 Financial income / (expense)
(€ million) 31/12/2015 31/12/2014
Operating profit 37.0 34.5
Net depreciation and other provisions charged 187.9 163.5
Depreciation and provisions on non-recurring items 1.6 11.8
◗ Including amortisation of contractual rights and trademarks 7.3 4.1
◗ Including Belgium negative goodwill and KTA goodwill depreciation (5.7) 5.3
Amortisation of grants received (6.3) (5.4)
Reversals of operating provisions utilised on recurring items (9.2) (10.3)
Reversals of provisions utilised on non-recurring items (2.3) (4.2)
Profit/(loss) on non-recurring fixed asset disposals (0.5) (1.0)
Profit/(loss) on fixed asset disposals (1.3) (1.4)
EBITDA 206.8 187.4
Non-recurring income and expense (1)
20.5 26.6
Recurring EBITDA 227.2 213.9
(1) Non-recurring income and expense include significant offensive bid costs, major restructuring expenses and other significant exceptional items.
(€ million) 31/12/2015 31/12/2014
Net cost of financial debt (12.3) (8.7)
◗ of which Cost of gross financial debt (13.6) (9.9)
◗ of which Income from cash and cash equivalents 1.3 1.2
Other financial income and charges 7.1 7.1
Other financial charges (15.0) (13.5)
◗ of which foreign exchange impact (5.5) (1.0)
Financial income / (expense) (20.2) (15.1)
(€ million) 31/12/2015 31/12/2014
Govia (UK) 12.4 5.7
First / Keolis Transpennine (UK) 9.4 10.1
Other associates (France) 0.8 0.1
Other associates (international, excluding UK) (0.1) -
Total joint ventures and associates 22.4 16.0
4.6 Share in net profit for the year from investments under the equity method
52
2. Consolidated financial statements
4.7 Taxation
The Group has opted to present a reconciliation of its effective rate at 34.43%, rather than 38%, which is the 2015 rate including
the additional contribution of 10.7% (2013 Finance Act).
In reality, this rate of 38% will not apply to the Group because the impact of the reversal of deferred income taxes is insignificant in
the period and currently this measure is only temporary.
The reconciliation between the legal rate of taxation in France and the effective rate is as follows:
Unrecognised deferred tax assets in 2015 mainly relate to North America and Germany.
Deferred tax included within non-current assets and liabilities breaks down as follows:
(€ million) 31/12/2015 31/12/2014
Current tax expense (34.5) (35.3)
Tax payable for the period (34.2) (35.9)
Adjustments in respect of prior years (0.3) 0.6
Deferred tax income (0.3) 14.6
Deferred tax for the period (0.3) 17.7
Impairment loss on deferred tax asset - (3.1)
Tax expense for the year (34.8) (20.6)
31/12/2015 31/12/2014
In % In € million In % In € million
Profit for the year 4.4 14.8
Profit/(loss) from associates (22.4) (16.0)
Taxation 34.8 20.6
Profit before tax and before profit/loss from associates 16.8 19.4
Legal rate of taxation in France 34.43% (5.8) 34.43% (6.7)
French / foreign taxation rate differentials -13.08% 2.2 3.59% (0.7)
Effect of reduced rates and changes in tax rates 5.34% (0.9) -4.73% 1.0
Adjustment in respect of tax for prior years 1.60% (0.3) -3.18% 0.6
Other permanent differences 39.80% (6.7) 17.13% (3.3)
Crédit d’Impôt Compétitivité Emploi -98.54% 16.5 -85.27% 16.6
Effect of direct taxation (CVAE) 47.02% (7.9) 37.69% (7.3)
Unrecognised deferred tax assets 190.81% (31.9) 106.44% (20.7)
Effective rate of taxation 207.39% (34.8) 106.10% (20.6)
(€ million) 31/12/2015 31/12/2014
Deferred tax assets 75.4 77.0
Less than one year 14.7 9.2
More than one year 60.7 67.9
Deferred tax liabilities (68.2) (43.7)
Less than one year (15.2) (7.8)
More than one year (53.0) (35.9)
53
2. Consolidated financial statements
Unused losses amounted to €508 million at 31 December 2015
of which €367.7 million were not recognised, taking into account
assumptions on the usability of these losses within available time
limits, which would represent a deferred tax asset of €114.1
million.
At each financial year end, the Group assesses for each tax entity
the probability of its having taxable profits against which to offset
its deferred tax assets or to use available unrecognised tax cre-
dits. In making this assessment, the Group takes account of,
among other factors, past and present taxable profit, and the
companies’ prospects for making future taxable profits.
The change in the net deferred taxes recorded in the statement of financial position breaks down as follows:
(€ million) Net position
Opening balance on 1 January 2015 33.3
Recognised in equity -
Recognised in profit for the year (0.3)
Effect of consolidation scope changes (27.3)
Foreign exchange translation difference and other movements 1.4
Closing balance on 31 December 2015 7.2
(€ million) Net position
Opening balance on 1 January 2014 14.8
Recognised in equity 7.6
Recognised in profit for the year 14.6
Effect of consolidation scope changes (5.2)
Foreign exchange translation difference and other movements 1.5
Closing balance on 31 December 2014 33.3
Net deferred taxes by type are as follows:
(€ million) 31/12/2015 31/12/2014
Purchase accounting asset revaluations (52.2) (33.2)
Staff benefits 45.8 40.7
Tax losses 33.7 34.5
Other (20.1) (8.5)
Closing balance on 31 December 7.2 33.3
54
2. Consolidated financial statements
5 • Notes to the consolidated statement of financial position
5.1 Goodwill
Changes in carrying amount
(€ million) France
Continental
Europe
Australia UK
North
America
Total
At 1 January 2015 95.6 106.3 - - 31.8 233.6
Acquisitions (1)
0.4 0.1 38.8 - - 39.3
Disposals - - - - - -
Impairment loss for the period - - - - - -
Foreign exchange translation differences
and others (3.0) (2.2) (1.9) - 1.5 (5.6)
At 31 December 2015 92.9 104.2 36.9 - 33.3 267.3
Of which gross value 93.3 104.2 37.2 - 43.7 278.4
Of which accumulated amortisation and
impairment charges (0.4) - (0.2) - (10.4) (11.1)
(€ million) France
Continental
Europe
Australia UK
North
America
Total
At 1 January 2014 84.6 103.4 - - 34.0 222.1
Acquisitions 12.1 5.2 - - - 17.3
Disposals - - - - - -
Impairment loss for the period - - - - (5.3) (5.3)
Foreign exchange translation differences and
others (1.2) (2.3) - - 3.1 (0.4)
At 31 December 2014 95.6 106.3 - - 31.8 233.6
Of which gross value 96.0 106.3 - - 41.8 244.1
Of which accumulated amortisation and
impairment charges (0.4) - - - (10.0) (10.5)
Impairment testing
The main assumptions made for impairment tests are as follows:
Discount rate
The discount rate used is based on the average cost of capital
reflecting current market assessments of the time value of money
and the risks specific to the tested asset.
The average weighted cost of capital has been determined by a
combination of two methods: the “Capital Asset Pricing Model”
(CAPM) method and the average weighted cost of capital
method for comparable listed companies. Taking into account
these factors, the cost of capital used to discount future cash
flows was set at 4.8% in 2015 versus 5.6% in 2014.
These discount rates are rates after tax applied to cash flows
after tax. Use thereof results in recoverable amounts identical to
those obtained by using pre-tax rates applied to non-taxable
cash flows, in accordance with IAS 36.
Long-term growth rates
The growth rate applied to the main cash-generating units or
groups thereof was 2%.
Sensitivity of recoverable amounts
Sensitivity tests on groups of cash-generating units were carried
out by varying the long-term growth rates or the WACC (weighted
average cost of capital).
A 0.5 point decrease in the indefinite growth rate leaves a positive
margin between the value in use and the carrying amount of
cash-generating units.
A 0.5 point increase in the discount rate leaves a positive margin
between the value in use and the carrying amount of cash-
generating units.
(1) The additional goodwill recorded in 2015 arises principally from the acquisition of ATE on 1 May 2015. The assessment of assets and liabilities at the date of acquisition is
currently underway and will be completed within one year.
55
2. Consolidated financial statements
5.2 Other intangible assets
(€ million) Software Trademarks Contractual
rights Other Total
At 1 January 2015 34.3 4.1 36.6 74.6 149.7
Acquisitions 13.8 - - 35.9 49.7
Assets disposed of and scrapped (9.8) - - (1.4) (11.2)
Amortisation (17.1) (0.3) (7.7) (17.4) (42.6)
Changes in reporting scope (0.1) - 68.8 - 68.7
Foreign exchange translation
differences and other movements 11.7 0.5 (1.6) (21.0) (10.4)
At 31 December 2015 32.7 4.3 96.1 70.7 203.9
Of which gross value 107.0 5.9 124.2 166.9 404.0
Of which cumulative depreciation
and impairment losses (74.3) (1.6) (28.1) (96.2) (200.2)
(€ million) Software Trademarks Contractual
rights Other Total
At 1 January 2014 29.7 3.9 32.8 52.6 119.0
Acquisitions 14.7 - 0.2 25.7 40.5
Assets disposed of and scrapped - - - (0.1) (0.1)
Amortisation (16.0) (0.3) (3.7) (14.7) (34.7)
Changes in reporting scope - - 6.1 - 6.2
Foreign exchange translation
differences and other movements 5.9 0.5 1.2 11.2 18.8
At 31 December 2014 34.3 4.1 36.6 74.6 149.7
Of which gross value 102.8 5.4 56.9 153.5 318.6
Of which cumulative depreciation
and impairment losses (68.5) (1.3) (20.3) (78.9) (168.9)
56
2. Consolidated financial statements
5.3 Property, plant and equipment
(€ million)
Land
Developments
Buildings
Equipment
andtooling
Transport
equipment
PPEunder
construction
Other
Total
At 1 January 2015 25.5 47.0 29.2 426.4 24.9 67.5 620.5
Acquisitions 2.4 11.3 10.1 123.3 9.0 18.4 174.6
Assets disposed of and scrapped (1.8) (3.1) (1.4) (20.8) (0.7) (6.4) (34.1)
Depreciation (1.7) (9.2) (8.7) (92.6) 0.1 (16.7) (128.8)
Changes in reporting scope (1)
4.9 0.1 - 62.4 - 2.2 69.4
Foreign exchange translation
differences and other movements 8.5 32.0 4.8 (9.4) (17.9) (8.3) 9.7
At 31 December 2015 37.8 78.1 34.1 489.2 15.5 56.7 711.4
Of which gross value 45.2 152.5 95.7 1,133.4 15.5 156.2 1,598.5
Of which cumulative depreciation
and impairment losses (7.4) (74.4) (61.5) (644.2) - (99.5) (887.1)
(1) Mainly relates to contractual rights acquired in Australia (ATE).
(€ million)
Land
Developments
Buildings
Equipment
andtooling
Transport
equipment
PPEunder
construction
Other
Total
At 1 January 2014 25.6 42.6 30.2 379.1 20.4 60.2 558.1
Acquisitions 3.8 10.7 6.7 116.3 11.8 24.5 173.7
Assets disposed of and scrapped (3.0) (0.9) (0.3) (26.3) (0.4) (1.1) (31.8)
Depreciation (1.0) (6.9) (7.8) (84.6) - (16.6) (116.9)
Changes in reporting scope - 0.7 - 35.3 - 1.0 37.0
Foreign exchange translation
differences and other movements - 0.9 0.4 6.6 (7.0) (0.5) 0.5
At 31 December 2014 25.5 47.0 29.2 426.4 24.9 67.5 620.5
Of which gross value 30.8 110.6 85.9 1,048.3 25.0 154.2 1,454.8
Of which cumulative depreciation
and impairment losses (5.3) (63.6) (56.6) (621.9) (0.1) (86.7) (834.3)
Finance leases
At 31 December 2015, finance leased assets included within assets in the statement of financial position comprised:
Schedule of minimum finance lease payments
(€ million)
Transport
equipment
Land and
Buildings
Total
Gross value 276.1 7.0 283.1
Depreciation (143.3) (3.9) (147.2)
Total finance leased fixed assets 132.9 3.1 136.0
(€ million) 1 year 1 to 5 years  5 years Total
Principal 26.1 77.9 19.6 123.6
Interest 5.3 7.7 4.5 17.5
Finance lease payments 31.4 85.6 24.1 141.1
57
2. Consolidated financial statements
5.4 Investments under the equity method
The Group holds several investments in joint ventures and associates, notably in the United Kingdom, consolidated under the equity
method.
The changes in the value of these investments during the financial year can be explained by the items below:
The financial elements relating to significant joint ventures are presented below at 100% of their values:
(€ million)
Goviasubsidiaries
First/Keolis
Transpennine
Others
Totalassociates
Goviasubsidiaries
First/Keolis
Transpennine
Others
Totalassociates
Non-current assets 38.1 1.8 NA NA 47.9 2.8 NA NA
Net WCR 31.8 25.4 NA NA 7.5 29.2 NA NA
Equity 67.8 27.3 NA NA 55.4 32.0 NA NA
◗ Incl. Net profit 35.5 20.8 NA NA 16.4 22.5 NA NA
Non-current liabilities 2.0 (0.1) NA NA - - NA NA
Net assets 67.8 27.3 NA NA 55.4 32.0 NA NA
Percentage owned 35% 45% - - 35% 45% - -
Reconciliation of financial data with value of
investments under equity method: - - - - - - - -
Group share of net assets 23.7 12.3 3.4 39.4 19.4 14.4 2.4 36.2
Goodwill - - - - - - - -
Other - - - - - - - -
Net book value of investments 23.7 12.3 3.4 39.4 19.4 14.4 2.4 36.2
(€ million) 31/12/2015 31/12/2014
At 1 January 36.2 23.5
Net profit attributable to Group 22.4 16.0
Depreciation - -
Profit/(loss) from investments under equity method 22.4 16.0
Change in fair value affecting equity (1) 13.1 8.4
Foreign exchange translation differences (1.2) 1.0
Dividends paid (31.6) (12.9)
Changes in consolidation scope  other 0.6 0.2
At 31 December 39.4 36.2
(1) Changes in fair value affecting equity relate to actuarial gains and losses within the defined benefit pension schemes of the Railways Pension Scheme which are a function of
franchise length.
31/12/201431/12/2015
58
2. Consolidated financial statements
5.5 Current and non-current financial assets
The securities available for sale relate to investments in companies which are not consolidated.
The changes in concession financial assets in the period include new acquisitions for €22.3 million and reimbursements for
€8.1 million.
(€ million)
Loansand
receivables
Securitiesavailable
forsale
Depositsand
guarantees
Derivativeassets
Concessionfinancial
assets
Total
At 31 December 2015
Gross value 7.5 37.8 29.4 0.2 125.4 200.2
Impairment - (0.3) - - - (0.3)
Net value 7.5 37.5 29.4 0.2 125.4 199.9
◗ Less than one year 0.2 - 18.5 0.2 - 18.8
◗ More than one year 7.3 37.5 10.8 - 125.4 181.0
5.6 Inventories
(€ million) 31/12/2015 31/12/2014
Gross inventories 86.4 82.5
Provisions (4.4) (4.4)
Net inventories 82.0 78.0
(€ million)
Loansand
receivables
Securitiesavailable
forsale
Depositsand
guarantees
Derivativeassets
Concessionfinancial
assets
Total
At 31 December 2014
Gross value 8.4 23.3 32.4 0.1 106.1 170.1
Impairment - (0.3) - - - (0.3)
Net value 8.3 23.0 32.3 0.1 106.1 169.7
◗ Less than one year 0.1 - 19.7 0.1 - 19.8
◗ More than one year 8.2 23.0 12.6 - 106.1 149.8
59
2. Consolidated financial statements
5.7 Trade and other receivables
(€ million) 31/12/2015 31/12/2014
Trade receivables 400.4 367.6
Advances and down payments on orders 8.1 8.0
Amortisation of accounts receivable (10.3) (10.0)
Trade receivables 398.1 365.6
Receivables from staff and welfare agencies 4.2 6.9
Central government and local authorities 237.4 180.6
Prepayments 24.1 21.2
Other(1)
166.3 159.8
Depreciation of other debtors (1.3) (1.1)
Other receivables 430.7 367.5
(1) Other receivables for 2015 include €65 million representing the Australian Department for Transport’s guarantee on extra holiday rights; these rights appear under liabilities as
payables to staff.
5.8 Cash and cash equivalents
Analysis by type
(€ million) 31/12/2015 31/12/2014
Cash 285.2 218.7
Short term investments 25.4 66.0
Total recognised as assets 310.6 284.7
Bank overdrafts (266.4) (377.1)
Net cash and cash equivalents 44.2 (92.5)
Cash equivalents include highly liquid short term investments
that are easily convertible into a known amount of cash and
present no significant risk of loss of value.
The Group takes the view that its UCITS classified by the AMF
(French financial markets authority) as “euro money-market”
meet the criteria necessary to classify them as cash equivalents.
In 2015, the Group carried out several transactions to monetise
trade receivables. The amount of receivables thus monetised
was €27.4 million at 31 December 2015 versus €23.6 million at
31 December 2014.
The receivable arising in 2013, 2014 and 2015 from the CICE
implemented by the French government and recognised by
French consolidated tax groups was subject to a “Dailly” sale
made by GROUPE KEOLIS S.A.S.
60
2. Consolidated financial statements
5.9 Equity
Share capital and share premium
At 31 December 2015, the share capital was €46.9 million, comprising 3,904,273 ordinary shares with a nominal value of 12 euros
each. No diluting instrument was issued during the financial year ended 31 December 2015.
The Group’s borrowing contracts do not include any mandatory gearing ratio clauses.
Treasury shares
At 31 December 2015, Keolis S.A. held no treasury shares and was not a party to any purchase or sale option relating to Keolis
S.A. shares.
Distributable reserves and earnings
At 31 December 2015, Keolis S.A. held distributable reserves and earnings of €94.0 million and €37.6 million respectively.
Non-controlling interests
At 31 December 2015, non-controlling interests amounted to €51.5 million as against €21.7 million at 31 December 2014.
The main non-controlling interests are Keolis Commuter Services LLC, Keolis Downer and KDR Victoria Pty Ltd.
Foreign exchange translation reserve
During 2015, the foreign exchange translation reserves increased by €0.5 million.
The following were the main exchange rates against the euro used for the 2015 and 2014 financial years:
5.10 Financial debt and long term borrowings
In 2015, two credit facilities were set up by Keolis S.A.:
◗	A loan of €15 million taken out at Société Générale, set up and drawn on 15 October 2015 repayable in instalments over 8 years,
to finance rolling stock. This loan is fully hedged by a derivative financial instrument;
◗	A loan of €5 million taken out at the Banque Publique d’Investissement (BPI), set up in December 2014 and drawn in February
2015. This credit facility was amended on 7 December 2015 to increase its amount to €7 million repayable over 3 years.
(for 1 euro) 2015 2014
Average rate Closing rate Average rate Closing rate
Pound sterling 0.725978 0.733950 0.806100 0.778900
Australian dollar 1.476802 1.489700 1.471900 1.482900
Danish crown 7.458912 7.462600 7.454800 7.445300
Swedish crown 9.352400 9.189500 9.098500 9.393000
Norwegian crown 8.944238 9.603000 8.354400 9.042000
US dollar 1.109067 1.088700 1.328500 1.214100
Canadian dollar 1.417910 1.511600 1.466100 1.406300
Indian rupee 71.141807 72.021500 81.040600 76.719000
61
2. Consolidated financial statements
Financial debt breakdown by type
At 31 December 2015
(€ million)
Amounts in the
statement of financial
position
Term Rates
Finance leasing 2.8 2016 Variable rates
Finance leasing 23.4 2016 Fixed rates
Derivatives 0.3 2016 -
Loans 3.1 2016 Fixed rates
Loans 38.6 2016 Variable rates
Subtotal, less than 1 year 68.2
Owed to non-controlling shareholders (put option) 9.5 2017 -
Finance leasing 4.5 2017-2021 Variable rates
Finance leasing 93.0 2017-2021 Fixed rates
Employee profit-sharing 0.6 2017-2020 Fixed rates
Derivatives -
Loans 37.8 2017-2021 Fixed rates
Loans 425.9 2017-2021 Variable rates
Subtotal, more than 1 year 571.3
TOTAL 639.5
At 31 December 2014
(€ million)
Amounts in the
statement of financial
position
Term Rates
Finance leasing 10.1 2015 Variable rates
Finance leasing 15.8 2015 Fixed rates
Derivatives 1.6 - -
Loans 1.8 2015 Fixed rates
Loans 138.5 2015 Variable rates
Subtotal, less than 1 year 167.8
Owed to non-controlling shareholders (put option) 10.4 2016 -
Finance leasing 7.9 2015-2018 Variable rates
Finance leasing 82.1 2015-2018 Fixed rates
Employee profit-sharing 0.9 2015-2018 Fixed rates
Derivatives -
Loans 9.0 2015-2018 Fixed rates
Loans 28.6 2015-2018 Variable rates
Subtotal, more than 1 year 138.9
TOTAL 306.7
62
2. Consolidated financial statements
Financial debt breakdown by maturity
Financial debt breakdown by currency
Maturity
(€ million) 2016 2017 2018 2019 2020
After
2020
Total
Finance leasing 26.2 26.7 24.8 16.6 9.6 19.6 123.7
Other liabilities 42.0 26.6 30.8 7.4 386.0 23.1 515.9
Total 68.2 53.3 55.6 24.1 395.6 42.7 639.5
(€ million) At 31 December 2015 At 31 December 2014
Euro 334.6 97.2
Canadian dollar 51.3 53.9
Pound sterling 17.8 0.7
Swedish crown 33.1 34.1
US dollar 76.3 73.5
Australian dollar 78.9 9.9
Danish crown 47.5 37.4
Norwegian crown - -
TOTAL 639.5 306.7
63
2. Consolidated financial statements
Mandatory financial ratios
Contracts held by Keolis S.A. do not require compliance with any specific financial ratios.
The Group’s contracts, and those of its subsidiaries, include cross acceleration clauses. If the Group or, under certain conditions, its
largest subsidiaries do not comply with their commitments, lending institutions may claim default and early reimbursement of a major
portion of the Group’s debt.
TakingaccountofthespreadofthisfinancingamongvarioussubsidiariesandthequalityoftheGroup’sliquidityresources,theexistence
of these clauses does not create a material risk to the Group’s financial situation.
In 2014 the Group introduced monitoring of the financial ratios relating to the financing of the Group and its subsidiaries in order to
anticipate any adverse changes to these ratios.
Statement of changes in financial debts
(€ million)
31/12/2014
Increase
Decrease
Changesin
reportingscope
Impactofexchange
rate
Other
31/12/2015
Finance leasing 25.9 5.4 (16.8) 4.2 (0.4) 7.8 26.2
Owed to non-controlling shareholders (put option) - - - - - - -
Derivatives 1.6 - - - - (1.2) 0.3
Loans 140.3 6.6 (124.4) 0.8 1.8 16.6 41.7
Subtotal, less than 1 year 167.8 12.0 (141.2) 5.0 1.4 23.2 68.2
Owed to non-controlling shareholders (put option) 10.4 - - - - (0.8) 9.5
Finance leasing 90.0 27.2 (19.0) 6.5 (1.8) (5.5) 97.5
Employee profit-sharing 0.9 - - - - (0.4) 0.6
Derivatives - - - - - - -
Loans 37.6 437.9 (0.1) 3.9 - (15.5) 463.7
Subtotal, more than 1 year 138.9 465.1 (19.1) 10.4 (1.8) (22.2) 571.3
TOTAL 306.7 477.1 (160.3) 15.4 (0.4) 1.0 639.5
64
2. Consolidated financial statements
5.11 Financial assets and liabilities by category
At 31 December 2015
Book value by category of instruments
€ million
Fairvaluethrough
profitandloss
Fairvaluethrough
equity
FairvaluethroughPL
andequity(derivative
instruments)
Debtsatamortised
cost
Total
Investments available for resale - 37.5 - - 37.5
Other non-current financial assets - - - 143.5 143.5
Trade receivables - - - 398.1 398.1
Other receivables - - - 430.7 430.7
Current financial assets - - 0.2 18.7 18.8
Cash and cash equivalents 25.4 - - 285.2 310.6
ASSETS 25.4 37.5 0.2 1,276.3 1,339.3
Non-current financial debt - - - 571.3 571.3
Current financial debt - - 0.3 67.9 68.2
Bank borrowings - - - 266.4 266.4
Customer deposits and advances received - - - 34.5 34.5
Trade and other payables - - - 492.7 492.7
Other current operating liabilities - - 6.4 764.0 770.4
LIABILITIES - - 6.8 2,196.8 2,203.6
At 31 December 2015
Fair value by level
€ million
Level1:
Listedprice
Level2:
Modelbased
onobservable
parameters
Level3:
Modelbasedon
non-observable
parameters
Total
Investments available for resale - - 37.5 37.5
Other receivables - - - -
Current financial assets - 0.2 - 0.2
Cash and cash equivalents 25.4 - - 25.4
ASSETS 25.4 0.2 37.5 63.0
Current financial debt - 0.3 - 0.3
Other current operating liabilities - 6.4 - 6.4
LIABILITIES - 6.8 - 6.8
65
2. Consolidated financial statements
(€ million)
Other comprehensive income
account (OCI)
(reclassifiable as income)
Latent
financial
income/
(expense)
Underlying
asset Hedge accounting
Fair value at
31/12/2014 Change (1)
Reclassified (2)
Change (3)
Fair value at
31/12/2015
Interest rates CFH (0.2) - 0.2 - 0.1
Interest rates Trading - - - - -
Total Interest
rates (0.2) - 0.2 - 0.1
Currency NIH - - - - -
Currency Trading (1.3) - - 1.1 (0.2)
Total currency (1.3) - - 1.1 (0.2)
Commodities CFH (6.5) (4.2) 4.9 (0.5) (6.3)
Commodities Trading (0.2) - - - (0.2)
Total
Commodities (6.8) (4.2) 4.9 (0.4) (6.5)
Total (8.3) (4.2) 5.1 0.7 (6.6)
(1) Changes in market values, which have impacted the other comprehensive income account (reclassifiable reserves) for the financial year.
(2) Reclassifications from equity have had a negative impact of €4.9 million on EBITDA and a negative impact of €0.2 million on financial income / (expense)
(3) Changes in market values that have impacted financial income/ expense for the financial year.
The impact on 2015 profit for the year is presented in the table below:
(€ million) EBITDA Financial result obtained
Underlying Hedge accounting Change Change
Interest rates CFH - (0.2)
Interest rates Trading - (1.1)
Total Interest rates - (1.3)
Currency NIH - -
Currency Trading - (9.6)
Total currency - (9.6)
Commodities CFH (6.6) (0.3)
Commodities Trading - (0.3)
Total Commodities (6.6) (0.6)
Total (6.6) (11.5)
This table excludes accrued interest.
5.12 Risk management and financial derivatives
The Group uses derivative financial instruments to manage exposure to financial market risks resulting from its operational, financial
and investment activities:
◗ Interest rate risk;
◗ Foreign exchange risk;
◗ Commodities risk.
As at 31 December 2015, the Group held derivative instruments:
◗ eligible for hedge accounting and recognised as cash flow hedges (CFH), or as net investment hedges (NIH);
◗ or non-eligible for hedge accounting and recognised in trading.
Fair values are calculated by using standard valuation methods and on a basis of mid-market conditions commonly used in the finan-
cial markets. The market data used is level 2 under the terms of IFRS 13.
The impacts on performance and the financial position of derivatives are presented in the table below:
66
2. Consolidated financial statements
Derivative instruments are recognised in the statement of financial position at their fair value for the following amounts:
(€ million)
At 31 December 2015 At 31 December 2014
Assets Liabilities Assets Liabilities
Interest rate instruments 0.2 0.1 - 0.2
Currency instruments - 0.3 - 1.4
Commodities instruments - 6.5 - 6.8
Total 0.2 6.9 - 8.4
Management of interest rate risk
The exposure of the Group to interest rate risk stems from its net financial debt. The Group covers this risk by using derivative
financial instruments.
The hedging instruments linked to the debt agreement put in place by Keolis S.A. in 2010 (“private placement with Caisses
Régionales de Crédit Agricole” or CRPP) matured at the same time as the debt on 30 September 2015.
Derivative financial instruments eligible for hedge accounting are recognised under cash flow hedges. The derivative financial ins-
truments that are not eligible are recognised under trading.
The breakdown between the Group’s fixed and variable rate debt is as follows:
The Group is exposed to interest rate variability on the variable rate portion of its net financial debt.
At 31 December 2015, on the basis of a constant net financial debt, an increase of 50 basis points in market interest rates would have
increased the annual borrowing cost by €2.4 million (excluding accrued interest, derivatives and amounts owed to non-controlling
shareholders) and in parallel would have generated financial income on cash and cash equivalents by €0.2 million.
On the basis of the interest rate hedging portfolio, an instantaneous increase of 50 basis points in market interest rates would cut the
cost of annual debt by €0.2 million.
Hence, on the basis of constant net financial debt adjusted to reflect the impact of interest rate hedging derivative financial instruments,
an immediate increase of 50 basis points in market interest rates would have increased the annual cost of debt by €1.9 million.
Equally, on the basis of constant net financial debt adjusted to reflect the impact of interest rate hedging derivative financial instruments,
an immediate decrease of 50 basis points in market interest rates would have reduced the annual cost of debt by €1.9 million.
(€ million) At 31 December 2015 At 31 December 2014
Variable rate 471.3 186.7
Fixed rate 158.7 109.6
Financial debt and long term borrowings adjusted
for accrued interest 630.0 296.3
Variable rate cash and cash equivalents (44.2) 92.2
Fixed rate cash and cash equivalents - -
Cash and cash equivalents (44.2) 92.2
Accrued interest receivable (0.1) (0.1)
Loans and receivables (7.4) (8.3)
Deposits and guarantees (29.4) (32.3)
Derivative assets (0.2) (0.1)
Profit sharing (0.6) (0.9)
Net financial debt 548.2 346.8
67
2. Consolidated financial statements
(€ million)
At 31 December 2015 At 31 December 2014
Assets Liabilities Assets Liabilities
Interest rate instruments:
◗ Cash flow hedges 0.2 0.1 - 0.2
◗ Trading - - - -
Total 0.2 0.1 - 0.2
(€ million)
At 31 December 2015
Nominal Fair Value
Rate swaps 55.0 0.1
Purchases of options - -
Collars - -
Sales of options - -
TOTAL 55.0 0.1
(€ million)
At 31 December 2015
Market rate -0.5% Market rate +0.5%
Impact OCI (reserves reclassifiable as income) (2.3) 2.3
Impact financial income/(expense) - -
Valuation (2.3) 2.3
The sensitivity of the portfolio of derivative financial instruments to an impact of 0.50% on interest rate levels is presented below:
The derivative instruments are recognised in the statement of financial position at their fair value at the following amounts:
The nominal amounts and fair values of the derivative financial instruments are as follows:
All of the interest rate derivative financial instruments held at 31 December 2015 mature between 2016 and 2023.
68
2. Consolidated financial statements
Foreign exchange risk management
The Group has put in place intra-group loans denominated in foreign currency and recognised in current accounts. In order to cover
the resulting foreign exchange risk, the Group uses derivative financial instruments which allow it to fix the exchange rate of these
intra-group loans.
The derivative financial instruments held by the Group are considered trading instruments under IAS 39.
Derivative financial instruments are recognised in the statement of financial position at their fair value at the following amounts:
(€ million)
At 31 December 2015 At 31 December 2014
Assets Liabilities Assets Liabilities
Currency instruments:
◗ Net investment hedges - - - -
◗ Trading - 0.3 - 1.4
Total - 0.3 - 1.4
The derivative financial instruments hedge transactions in the following currencies in particular: AUD, CAD, DKK, SEK, NOK, AED,
USD and GBP.
All of the foreign exchange hedging derivatives held at 31 December 2015 mature in 2016.
The sensitivity of foreign exchange hedging contracts to a variation of plus or minus 10% in foreign exchange rates is detailed below:
(€ million)
At 31 December 2015
90% of the
exchange rate
110% of the
exchange rate
Impact OCI (reserves reclassifiable as income) - -
Impact financial income/(expense) 16.2 (16.6)
Fair Value 16.2 (16.6)
69
2. Consolidated financial statements
Management of risk of fluctuations in commodities prices
Within the scope of its activities, the Group is exposed to a risk of fluctuation in the price of certain commodities, in particular diesel.
The Group covers this risk by using derivative financial instruments.
Derivative financial instruments eligible for hedge accounting are recognised under cash flow hedges as described by IAS 39. The
derivative financial instruments that are not eligible are recognised under trading.
The derivative instruments are recognised in the statement of financial position at their fair value at the following amounts:
The sensitivity of commodity hedging contracts to a variation of plus or minus 10% in commodities’ prices is detailed below:
(€ million)
At 31 December 2015
90% of diesel
price
110% of diesel
price
Impact OCI (reserves reclassifiable as income) (7.8) (5.0)
Impact financial income/(expense) (0.2) -
Impact Fair Value (8.0) (4.9)
(€ million)
At 31 December 2015 At 31 December 2014
Assets Liabilities Assets Liabilities
Derivative financial instruments on
commodities
◗ Cash flow hedges - 6.3 - 6.5
◗ Trading - 0.2 - 0.2
Total - 6.5 - 6.8
Counterparty risk
The transactions generating a potential counterparty risk for the Group are as follows:
◗ cash deposits;
◗ derivative financial instruments;
◗ trade receivables.
All commodities’ hedging instruments held at 31 December 2015 mature between January 2016 and August 2017.
Nominal amounts for positions open at 31 December 2015 are as follows:
Type of hedge instrument
Volume in tonnes
yet to mature Maturing in 2016 Maturing in 2017
Swaps 32,632 28,932 3,700
Tunnels
◗ Cap purchases and floor sales 11,500 9,900 1,600
◗ Floor sales 1,950 1,950 -
Total 46,082 40,782 5,300
70
2. Consolidated financial statements
In 2013, the Group established and implemented a counterparty risk procedure for bank counterparties relating to its investments
and derivative financial instruments. This procedure is based on the principles set out below:
◗ Definition of three categories within which the Group’s bank counterparties are divided:
	 • Authorised Banks;
	 • Banks under supervision;
	 • Non-authorised Banks.
These categories are defined based on criteria specific to banks (rating) or Keolis (Group financing).
◗ Cash investments and derivative financial instruments are only undertaken with counterparties that belong to the “Authorised
Banks” category;
◗ The portfolio of cash investments complies with weighting restrictions;
◗ The “fair value at risk” (fair value in favour of the Group) of the portfolio of derivative financial instruments is monitored regularly so
as to spread the risk over various counterparties;
◗ The banks and categories are monitored regularly.
If a bank that is a Group counterparty is removed from the “Authorised Banks” category, the portfolio of derivative financial
instruments is restructured so as to comply once again with the category criteria.
At 31 December 2015:
◗ All the investments made and all the derivative financial instruments held by the Group were established with bank counterparties
in the “Authorised Banks” category;
◗ The analysis of fair values at risk indicates that there is no major counterparty risk to report.
Finally, the credit and debit valuation adjustment calculations for the counterparty risk, as required by IFRS 13, indicate that the
counterparty risk related to the valuation of the Group’s portfolios of derivative financial instruments is negligible.
Liquidity risk
In 2015, two credit facilities were set up by Keolis S.A.:
◗ A loan of €15 million taken out at Société Générale, set up and drawn on 15 October 2015 repayable in instalments over 8 years,
to finance rolling stock. This loan is fully hedged by a derivative financial instrument;
◗ A loan of €5 million taken out at the Banque Publique d’Investissement (BPI), set up in December 2014 and drawn in February
2015. This credit facility was amended on 7 December 2015 to increase its amount to €7 million repayable over 3 years.
(€ million)  = 1 year 2 years From 3 to 5
years  5 years
Financial debt (1.9) (1.9) (12.6) (5.5)
Debt expense (0.3) (0.2) (0.3) (0.1)
◗ of which interest rate hedges (0.1) (0.1) - 0.1
The forecasted interest charges on the debt are calculated on the gross debt on the basis of the forward Euribor 1 month/3 months
rate on the date of closing, to which is added the Group’s interest margin.
It takes into account the impact of the interest rate derivative financial instruments.
The forward Euribor 1 month/3 months interest rates at 31 December 2015 used to calculate interest charges are as follows:
At 31 December 2015 2016 2017 2018 2019 2020
Forward interest rates -0.27% -0.23% 0.01% 0.31% 0.64%
The Group ensures that it has sufficient resources to meet its financial obligations.
To ensure this, each year the Group prepares a table of projected cash flows several years into the future to identify financing requi-
rements and their seasonality.
71
2. Consolidated financial statements
5.13 Provisions
Analysis by type
(€ million)
At 31 December 2015 At 31 December 2014
More
than a
year
Less
than a
year
Total
More
than a
year
Less
than a
year
Total
Pensions 127.8 6.3 134.1 116.8 2.4 119.2
Other employee benefits 30.9 0.9 31.8 30.1 0.9 31.0
Employment and tax risks 11.9 16.1 28.0 13.3 16.5 29.8
Losses on contract termination and loss-making
contracts 2.6 2.4 5.0 4.0 2.6 6.6
Contract fines - 2.9 2.9 - 1.9 1.9
Major repairs and maintenance 8.6 24.9 33.5 6.2 26.2 32.4
Other 7.6 1.8 9.4 6.5 1.5 8.0
Total 189.4 55.3 244.7 176.9 52.0 228.9
Movements during the financial year
(€ million)
At1January
2015
Charges Reversals
Changes in
reporting
scope
Other
movements
At 31
December
2015
Pensions 119.2 23.0 (9.0) 0.4 0.4 134.1
Other employee benefits 31.1 2.3 (1.4) - (0.2) 31.8
Employment and tax
risks 29.7 6.4 (8.5) 0.1 0.3 28.0
Losses on contract
termination and loss-
making contracts
6.6 5.0 (6.6) - - 5.0
Contract fines 1.9 2.9 (1.9) - - 2.9
Major repairs and
maintenance 32.4 5.5 (4.3) - (0.2) 33.5
Other 8.0 6.3 (4.9) 0.1 (0.2) 9.4
Total 228.9 51.4 (36.6) 0.6 0.1 244.7
(€ million)
At1January
2014
Charges Reversals
Changes in
reporting
scope
Other
movements
At 31
December
2014
Pensions 103.3 8.8 (7.3) - 14.4 119.2
Other employee benefits 14.2 2.5 (0.7) - 15.1 31.1
Employment and tax
risks 22.7 14.7 (7.3) - (0.4) 29.7
Losses on contract
termination and loss-
making contracts
10.4 0.6 (5.2) 0.8 - 6.6
Contract fines 2.6 1.9 (2.6) - - 1.9
Major repairs and
maintenance 29.5 5.7 (2.9) - 0.1 32.4
Other 8.6 4.4 (4.9) - (0.1) 8.0
Total 191.3 38.6 (30.9) 0.8 29.1 228.9
72
2. Consolidated financial statements
Pensions and similar benefits
The amount of commitments recognised in the statement of financial position breaks down as follows:
(€ million) At 31 December 2015 At 31 December 2014
Commitments recorded in the statement of
financial position
Pensions and other post-employment benefits 134.1 119.1
Other employee benefits 31.8 31.0
Total 165.9 150.1
Of which:
◗ Non-current 158.7 142.9
◗ Current 7.2 7.5
Pensions and other post-employment benefits
Actuarial assumptions
The following are the main actuarial assumptions adopted in evaluating pension commitments under the defined benefit schemes:.
At 31 December 2015 At 31 December 2014
(per cent) France Canada France Canada
Discount rate 1.49 3.30 1.35 3.75
Rate of increase in salaries 2.00-6.20 N/A 2.00-5.80 N/A
Expected rate of return on assets 1.49 3.75 1.35 4.25
The plan assets break down as follows:
(€ million)
At 31 December 2015 At 31 December 2014
France Canada France Canada
Equities - 1.4 - 1.6
Bonds 0.1 5.3 0.2 5.9
Real estate - 0.3 - 0.3
Other 0.1 - - -
The sensitivity to discount rates, in relation to the assumptions adopted is as follows:
(€ million)
Commitment at
31/12/2015
Service cost 2016 Financial cost 2016
discount rate less 0.25% 137.3 8.3 1.9
discount rate (basic assumption) 134.1 8.1 2.2
discount rate plus 0.25% 130.5 7.9 2.4
73
2. Consolidated financial statements
Commitments recorded in the statement of financial position
The commitments recognised in the statement of financial position break down as follows:
Analysis of changes in liabilities and assets
The net present value of the liabilities comprises:
(€ million) At 31 December 2015 At 31 December 2014
Present value of non-financed liabilities 131.6 121.2
Present value of financed liabilities 9.7 6.2
Present value of total liabilities 141.3 127.4
Fair value of pension scheme assets (7.2) (8.1)
Present value of net liabilities
recognised 134.1 119.3
(€ million) 31/12/2015 31/12/2014
Net present value of liabilities at 1 January 127.5 110.8
Service cost 7.0 5.9
Financial cost (including Franchise Adjustment) 1.9 2.9
Benefits paid (9.3) (7.5)
Employee contributions - -
Changes in pension schemes 14.1 0.1
Actuarial gains/(losses) 0.7 14.6
Foreign exchange translation difference (0.6) 0.3
Effect of changes in consolidation scope (0.1) 0.3
Effect of reductions and pension scheme settlements - -
Net present value of liabilities at 31 December 141.3 127.4
The fair value of the assets comprises:
(€ million) 31/12/2015 31/12/2014
Fair value of pension plan assets at 1 January 8.1 7.5
Expected return on assets 0.3 0.3
Actuarial gains/(losses) on pension fund returns 0.1 0.7
Employer contributions 0.2 0.3
Employee contributions - -
Benefits paid (0.9) (0.9)
Foreign exchange translation differences (0.5) 0.3
Effect of changes in consolidation scope - -
Effect of reductions and pension scheme settlements - -
Fair value of pension plan assets at 31 December 7.2 8.1
74
2. Consolidated financial statements
The following are the actuarial gains and losses both in the light of experience and due to changes in actuarial assumptions:
The following is the geographical breakdown of the liabilities and assets:
(€ million) 31/12/2015 31/12/2014
Impact of changes in assumptions (1.5) 11.7
Losses/(gains) in the light of experience 2.2 2.2
Actuarial losses/(gains) for the year 0.7 13.9
(€ million)
At 31 December 2015
France Canada Total
Present value of the liabilities 133.7 7.6 141.3
Fair value of pension scheme assets (0.2) (7.0) (7.2)
Net Present Value of net obligations 133.5 0.6 134.1
Benefit cost for the financial year
The cost of benefits recognised in the income statement breaks down as follows:
(€ million) 31/12/2015 31/12/2014
Service cost 7.0 5.9
Interest cost 1.9 2.9
Expected return on assets (0.3) (0.3)
Depreciation of past service costs 14.1 0.1
Changes in pension schemes - -
Total expense recognised in the income statement 22.7 8.6
The service cost is recognised within staff expenses.
The interest cost on liabilities and the expected return on the pension scheme assets are recognised as financial expense and
financial income respectively.
Change in the net commitment recorded as a liability in the statement of financial position
(€ million) 31/12/2015 31/12/2014
Opening provision at 1 January 119.4 103,4
Newly consolidated companies - 0.3
Benefit cost for the financial year 22.7 8.6
Used (Benefits / Contributions paid) (8.6) (6.9)
Provision charged to/(reversed from) equity 0.7 13.9
Foreign exchange translation differences and other changes (0.1) -
Closing provision at 31 December 134.1 119.4
75
2. Consolidated financial statements
The cumulative movements in charges/(reversals) recognised directly in equity are as follows:
(€ million) 31/12/2015 31/12/2014
Cumulative opening balance of charges/(reversals) 38.3 24.3
Actuarial (gains) / losses for the year 0.7 13.9
Foreign exchange translation differences and other changes (0.2) -
Cumulative closing balance of charges/(reversals) 38.8 38.3
(€ million) 31/12/2015 31/12/2014 31/12/2013 31/12/2012
Present value of liabilities 141.3 127.5 111.6 113.9
Fair value of pension scheme assets (7.2) (8.1) (7.5) (8.7)
Surplus (deficit) of the pension scheme 134.1 119.4 104.1 105.2
Adjustments related to experience 2.2 2.3 (3.8) 1.1
(€ million) 01/01/2015 Charge Reversals Change in
scope
Foreign exch
transl. diff 
other
31/12/2015
France – long service awards 15.7 1.8 (0.9) - - 16.6
USA – healthcare expenses of early-retired
employees 15.4 0.6 (0.5) - (0.2) 15.3
Total 31.1 2.4 (1.4) - (0.2) 31.9
Variations for the current financial year and for the three previous ones:
Other employee benefits
Description of commitments and actuarial assumptions
Other employee benefits mainly consist of long-service awards to employees working in France and healthcare expenses of
employees in the USA who have taken early retirement. These schemes are not funded by external assets (e.g. insurance policies).
The obligations arising from these defined benefit schemes are measured using the same methods and assumptions as for the
pension schemes.
The actuarial gains and losses arising from both experience and due to changes in actuarial assumptions are immediately recognised
in the income statement for the financial year.
Analysis of movements in obligations
The change in the USA relates to the provision for healthcare expenses recorded as part of the Boston tender award, counter-
balanced by the recording of an intangible asset depreciated over the contract’s duration.
5.14 Operating liabilities and other debt
(€ million) At 31 December 2015 At 31 December 2014
Trade receivables: advances and deposits received 34.5 58.4
Trade payables 493.4 481.4
Payables to PPE suppliers 23.0 33.6
Payables to staff 459.8 440.0
Central government and local authorities 92.9 67.9
Deferred income 97.3 95.4
Other 96.7 87.3
Total 1,297.7 1,263.9
76
2. Consolidated financial statements
6 • Other commitments not recognised in the statement of
financial position and contractual commitments
The amount of railway path access entitlements within the “Guarantees given for operating commitments” is €72.0 million at 31
December 2015 compared to €73.8 million at 31 December 2014.
The future minimum payments on operating lease contracts break down as follows:
Future commitments linked to leases primarily relate to the rental of transport equipment and buildings. They comprise €436.1
million internationally and €262.4 million in France. IT equipment rental contracts are in place for immaterial values.
France
Rental contracts
Contracts entered into on vehicles (buses and coaches) relate to average durations of
◗7 to 8 years for buses and coaches,
◗3 or 4 years for minibuses.
The manufacturer’s buyback undertaking corresponds to the estimated market value of the vehicle at the end of the rental period.
Most of these contracts are entered into directly by the subsidiaries, with a guarantee signed by Keolis S.A. in favour of the financing
bodies. This guarantee takes the form of an undertaking to continue the rental and binds Keolis S.A. only in terms of the payment
of the rental amounts that remain due under the contract if the subsidiary defaults. In return, the financing body undertakes to keep
the related vehicles available to the Group. 
Outside France
We distinguish between railway contracts and bus contracts.
Railway contracts
Railway rental contracts are entered into for the term of the franchise.
Rentals under leases due in less than one year amount to €17.8 million.
Rentals under leases due in more than one year depend on the end date of each of the railway or similar franchises. They amount
to €98.9 million.
Bus and coach contracts
Rental instalments outstanding on these contracts amount to €202.5 million.
As in France, Keolis S.A. is required to provide guarantees of rental payments on behalf of its foreign subsidiaries.
(€ million) At 31 December 2015 At 31 December 2014
Unutilised credit lines 8.6 8.1
Guarantees given to secure debt 44.3 42.1
Guarantees given for operating commitments 666.4 640.6
Securities provided - -
Total commitments made and guarantees given,
excluding operating leases 710.7 682.7
(€ million) At 31 December 2015 At 31 December 2014
Less than one year 158.8 162.3
One to five years 408.6 449.2
More than five years 131.0 149.5
Total 698.5 761.0
77
2. Consolidated financial statements
7 • Disputes
The estimates and underlying assumptions relating to current
disputes are continuously re-examined. In particular, current
disputes and litigation, especially with tax administrations or
relating to appeals on tenders or on warranty claims, have been
examined by the management with its advisers and lawyers for
the purpose of assessing the risk they entail to the measurement
of assets or liabilities.
The impact of changes in accounting estimates is recognised
during the period of the change where they only affect that
period, or during the period of the change and subsequent
periods where the latter are also affected by the change.
Risks are measured at fair value and where appropriate a provi-
sion is made in the accounts (see note 5.13).
On 27 June 2014, the Group decided to terminate a subcontrac-
tor agreement. On 4 August 2014, the subcontractor filed a
claim against a subsidiary of the Group without producing any
evidence to support this action, which is thus entirely refuted by
the subsidiary concerned. At this stage in the procedure, no
provision has been made in the financial statements.
8 • Related party transactions
The revised IAS 24 norm, applicable from 1 January 2011, has
modified disclosure obligations for public entities regarding tran-
sactions with related parties.
Keolis S.A. is wholly owned by GROUPE KEOLIS S.A.S. 69.69%
of GROUPE KEOLIS S.A.S. is owned by SNCF Participations
and 30.00% by Caisse de Dépôt et Placement du Québec.
SNCF is a public company with an industrial and commercial
activity whose capital is entirely owned by the French State.
8.1 Transactions with GROUPE KEOLIS S.A.S. and
Groupe EFFIA
Transactions with GROUPE KEOLIS S.A.S. mainly correspond
to general management services.
Transactions with Groupe EFFIA correspond to sub-contracting
services.
8.2 Transactions with joint ventures and associates
Transactions with joint ventures and associates are performed
according to normal market conditions.
8.3 Remuneration of the Group’s key managers
The key managers in the Group are defined as being the com-
pany officers and directors of Keolis S.A. and the members of
the Executive Committee. Remuneration and other short-term
benefits paid to these directors amounted to €4.9 million for 9
people in 2015, compared to €3.0 million for 8 people in 2014.
No directors’ fees were allotted to members of the Group’s
management or executive committees.
There are no outstanding advances or credit facilities extended to
members of the Group’s management or executive committees.
9 • Post balance sheet events
Access to GROUPE KEOLIS S.A.S.’ syndicated loan
On 20 February 2016, Keolis S.A. became an additional bor-
rower on the €900 million syndicated loan contracted by
GROUPE KEOLIS S.A.S. on 12 July 2013. This modification
enables Keolis S.A. to reinforce its liquidity and its borrowing
capacity though direct access to an external source of finance
whilst benefitting from the guarantee of GROUPE KEOLIS S.A.S.
relating to the possible use of this line of credit.
The main characteristics of this syndicated loan, following
amendments made on 11 June 2015 are:
◗ a maximum amount of €900 million,
◗ a maturity on 11 June 2020,
◗ a provision under which Keolis may extend the maturity by an
additional year, in 2016 and 2017, subject to the approval of
the entire financing syndicate. Maturity could thereby be
extended until 11 June 2022.
At 31 December 2015 the undrawn amount on this syndicated
loan stood at €300 million.
Keolis S.A. capital increase
On 3 March 2016, Keolis S.A. launched a capital increase
amounting to €300 million.
Fully subscribed to by its shareholder GROUPE KEOLIS S.A.S.,
this operation aims to reinforce Keolis S.A.’s capital base in order
to support the future development of its public transport activities
in France and worldwide.
This operation, conducted in the form of a set-off of claims
between GROUPE KEOLIS S.A.S. and Keolis S.A., reduced
Keolis S.A.’s net debt by €300 million. As a consequence, Keolis
S.A.’s net financial debt at 31 December 2015, taking into
account this capital increase, would stand at €248.2 million
instead of €548.2 million, and equity attributable to the Group
would amount to €450.8 million instead of €150.8 million.
Keolis acquires Transports Daniel Meyer in Ile-de-France
In January 2016, the Keolis Group announced the acquisition of
a leading bus and coach service operator in Ile-de-France,
Transports Daniel Meyer. With this strategic external growth
transaction, Keolis reinforces its foothold in Ile-de-France and
consolidates its position for future projects relating to Grand
Paris Express. Keolis Ile-de-France, which generated 400 million
euros of turnover in 2014, operates a fleet of 1,900 vehicles
across 25 depots. Established in all of the departments compri-
sing the Paris region, its 19 subsidiaries employ 4,000 people
and carry 70 million passengers each year. The group Transports
Daniel Meyer has 440 employees and a fleet of 260 vehicles. It
generated a turnover of 40.4 million euros in 2014. Its main line
of business is in the operation of approximately 50 timetabled
bus lines, supplemented by school buses and school outings
and charter activity.
78
2. Consolidated financial statements
10 • Consolidation scope
10.1 Subsidiaries
Name Country Method of
consolidation
% of
shareholding
Aérobag France FC 100.00%
Aérolis France FC 50.10%
Aéroport de Troyes Barberey France FC 100.00%
Aérosat France FC 85.00%
Airelle France FC 100.00%
Athis Cars France FC 100.00%
Autocars Delion France FC 100.00%
Autocars Eschenlauer France FC 100.00%
Autocars Garrel et Navarre France FC 100.00%
Autocars Planche France FC 100.00%
Autocars Striebig France FC 100.00%
Caennaise de Services France FC 100.00%
Cariane Littoral France FC 100.00%
Caron Voyages France FC 100.00%
Cars de Bordeaux France FC 100.00%
Cars et Autobus de Cassis - SCAC France FC 100.00%
Cars Planche France FC 100.00%
Compagnie des Transports Méditerranéens France FC 100.00%
Compagnie du Blanc Argent France FC 99.43%
Devillairs France FC 100.00%
Fouache Evasion France FC 100.00%
Holding Striebig France FC 100.00%
Institut Keolis France FC 100.00%
Interhône-Alpes France FC 100.00%
Intrabus Orly France FC 100.00%
Keolis Abbeville France FC 99.02%
Keolis Agen France FC 100.00%
Keolis Aix-les-Bains France FC 100.00%
Keolis Alençon France FC 100.00%
Keolis Alès France FC 100.00%
Keolis Amiens France FC 100.00%
Keolis Angers France FC 100.00%
Keolis Arles France FC 100.00%
Keolis Armor France FC 100.00%
Keolis Artois Gohelle France FC 100.00%
Keolis Atlantique France FC 100.00%
Keolis Auch France FC 100.00%
Keolis Aude France FC 100.00%
Keolis Baie des Anges France FC 100.00%
Keolis Bassin D’Arcachon France FC 100.00%
Keolis Bassin de Pompey France FC 100.00%
79
2. Consolidated financial statements
Name Country Method of
consolidation
% of
shareholding
Keolis Beaune France FC 100.00%
Keolis Besançon France FC 99.96%
Keolis Blois France FC 100.00%
Keolis Bordeaux France FC 99.99%
Keolis Bordeaux Métropole France FC 100.00%
Keolis Boulogne sur Mer France FC 100.00%
Keolis Bourgogne France FC 99.50%
Keolis Brest France FC 100.00%
Keolis Bus Verts France FC 100.00%
Keolis Caen France FC 100.00%
Keolis Calvados France FC 100.00%
Keolis Camargue France FC 100.00%
Keolis Centre France FC 100.00%
Keolis Châlons-en-Champagne France FC 99.24%
Keolis Charente Maritime France FC 99.96%
Keolis Château Thierry France FC 100.00%
Keolis Châteauroux France FC 100.00%
Keolis Châtellerault France FC 100.00%
Keolis Chaumont France FC 100.00%
Keolis Chauny - Tergnier France FC 100.00%
Keolis Cherbourg France FC 100.00%
Keolis Concarneau* France FC 100.00%
Keolis Conseil et Projets France FC 100.00%
Keolis Dijon France FC 100.00%
Keolis Drôme France FC 100.00%
Keolis Drouais France FC 100.00%
Keolis Emeraude France FC 100.00%
Keolis en Cévennes France FC 99.19%
Keolis Epinal France FC 100.00%
Keolis Eure et Loir France FC 100.00%
Keolis Garonne France FC 100.00%
Keolis Gascogne France FC 100.00%
Keolis Gironde (ex SNCOA ) France FC 100.00%
Keolis Grand Tarbes France FC 100.00%
Keolis Ille et Vilaine France FC 100.00%
Keolis Languedoc France FC 100.00%
Keolis Laval France FC 100.00%
Keolis Lille (ex Transports en Commun de la Métropole
Lilloise (Transpole)) France FC 100.00%
Keolis Littoral France FC 100.00%
Keolis Lorient France FC 100.00%
Keolis Lyon France FC 99.99%
Keolis Manche France FC 100.00%
Keolis Maritime Brest France FC 100.00%
Keolis Maritime Lorient France FC 99.00%
80
2. Consolidated financial statements
Name Country Method of
consolidation
% of
shareholding
Keolis Marmande France FC 100.00%
Keolis Mobilité Hauts de Seine France FC 100.00%
Keolis Mobilité Roissy France FC 100.00%
Keolis Montargis France FC 100.00%
Keolis Montélimar France FC 100.00%
Keolis Montluçon France FC 100.00%
Keolis Morlaix France FC 100.00%
Keolis Narbonne France FC 100.00%
Keolis Nevers France FC 100.00%
Keolis Nord Allier France FC 100.00%
Keolis Normandie Seine France FC 100.00%
Keolis Obernai France FC 100.00%
Keolis Oise France FC 100.00%
Keolis Orléans France FC 100.00%
Keolis Orly Rungis France FC 100.00%
Keolis Oyonnax France FC 100.00%
Keolis Pays d'Aix France FC 100.00%
Keolis Pays de Montbéliard France FC 100.00%
Keolis Pays des Volcans France FC 100.00%
Keolis Pays Nancéien France FC 100.00%
Keolis Pays Normands France FC 100.00%
Keolis PMR Rhône France FC 100.00%
Keolis Porte de l’Isère France FC 100.00%
Keolis Provence France FC 100.00%
Keolis Pyrénées France FC 95.16%
Keolis Quimper France FC 100.00%
Keolis Rennes France FC 100.00%
Keolis Réseau Départemental Sud Oise France FC 100.00%
Keolis Roissy Services Aéroportuaires France FC 100.00%
Keolis Rouen Vallée de Seine France FC 100.00%
Keolis S.A. France FC 100.00%
Keolis Saint Malo France FC 100.00%
Keolis Saintes France FC 100.00%
Keolis Seine Maritime France FC 100.00%
Keolis Somme France FC 100.00%
Keolis Sud Allier France FC 100.00%
Keolis Sud Lorraine France FC 100.00%
Keolis Touraine France FC 100.00%
Keolis Tours France FC 100.00%
Keolis Travel Services France FC 100.00%
Keolis Trois Frontières France FC 100.00%
Keolis Urbest France FC 100.00%
Keolis Val d’Oise France FC 100.00%
Keolis Val de Maine France FC 100.00%
81
2. Consolidated financial statements
Name Country Method of
consolidation
% of
shareholding
Keolis Val de Saône France FC 100.00%
Keolis Val Hainaut France FC 96.32%
Keolis Vesoul France FC 100.00%
Keolis Vichy France FC 100.00%
Keolis Voyages France FC 100.00%
Keolis Yvelines France FC 100.00%
KTA France FC 100.00%
Les Autobus d'Arcachon France FC 100.00%
Les Cars du Bassin de Thau France FC 100.00%
Les Cars Roannais France FC 100.00%
Les Courriers Catalans France FC 99.99%
Les Courriers de l'Ile-de-France France FC 99.99%
Les Courriers du Midi France FC 100.00%
Les Transports Dunois France FC 100.00%
Loisirs et Voyages France FC 100.00%
Millau Cars France FC 100.00%
Monnet Tourisme France FC 100.00%
Monts Jura Autocars France FC 99.99%
Pacific Cars France FC 100.00%
Prioris France FC 100.00%
Réseau en Vosges France FC 70.00%
S.T.E.F.I.M. France FC 100.00%
SA Sap Drogoul France FC 100.00%
SAP Cariane Provence France FC 100.00%
SCAC Bagnis France FC 100.00%
Setver France FC 100.00%
SFD France FC 100.00%
Société d’Exploitation des Transports Urbains
d’Oyonnax France FC 100.00%
Société d'exploitation de l'Aéroport de Dole Jura France FC 51.00%
Société d'exploitation de l'Aéroport Albert Picardie France FC 51.00%
Société de Gestion de l'Aéroport d'Angers-Marcé France FC 100.00%
Société de Transports et de Services Aéroportuaires France FC 100.00%
Société Départementale des Transports du Var France FC 95.08%
Société des Transports Côte d’Azur Riviéra France FC 100.00%
Société des Transports de la Communauté Urbaine
d'Arras France FC 100.00%
Société des Transports en Commun Nîmois France FC 100.00%
Société des Transports Robert France FC 100.00%
Société pour la Mobilité à Paris – SOMAP France FC 100.00%
Société Rennaise de Transport et de Services
(Handistar) France FC 100.00%
STA France FC 100.00%
STAC France FC 100.00%
SVTU France FC 100.00%
TPR France FC 100.00%
82
2. Consolidated financial statements
Name Country Method of
consolidation
% of
shareholding
Train Bleu St Marcellin France FC 100.00%
Trans Val de Lys France FC 99.99%
Transkeo France FC 51.00%
Transports de la Brière France FC 60.10%
Transports et Services Aérolignes France FC 100.00%
Transports Evrard France FC 100.00%
Transports Gep Vidal France FC 100.00%
Transroissy France FC 100.00%
Var Tours France FC 99.45%
Voyages Autocars Services France FC 100.00%
Voyages Chargelègue France FC 100.00%
Voyages Dourlens France FC 100.00%
Voyages Fouache France FC 100.00%
Voyages Monnet France FC 100.00%
Voyages Striebig France FC 100.00%
VTS Roissy France FC 100.00%
Westeel Voyages France FC 100.00%
Keolis Deutschland GmbH  Co.KG Germany FC 100.00%
Keolis Deutschland Holding GmbH Germany FC 100.00%
Keolis Deutschland Verwaltung GmbH Germany FC 100.00%
Schloemer Verkehrsbetrieb GmbH Germany FC 100.00%
Striebig Deutschland Germany FC 100.00%
Striebig GmbH Germany FC 100.00%
Australian Transit Enterprises Pty Ltd Australia FC 51.00%
KDR Gold Coast Pty Ltd Australia FC 51.00%
KDR Victoria Pty Ltd Australia FC 51.00%
Keolis Australia Australia FC 100.00%
Keolis Downer Pty Ltd Australia FC 51.00%
Keolis Downer Bus and Coachlines Property Pty Ltd Australia FC 51.00%
Keolis Downer Bus and Coachlines Pty Ltd Australia FC 51.00%
Hornibrook Bus Lines Pty Ltd Australia FC 51.00%
Hornibrook Transit Management Pty Ltd Australia FC 51.00%
LinkSA Pty Ltd Australia FC 51.00%
Path Transit Pty Ltd Australia FC 51.00%
South West Transit Pty Ltd Australia FC 51.00%
Southlink Pty Ltd Australia FC 51.00%
Autobus De Genval Belgium FC 100.00%
Autobus Dony Belgium FC 100.00%
Autobus Dujardin Belgium FC 100.00%
Autobus Lienard Belgium FC 100.00%
Cardona-Deltenre Belgium FC 100.00%
Cintra Belgium FC 100.00%
Cintral Belgium FC 100.00%
De Turck Belgium FC 100.00%
Eltebe Belgium FC 100.00%
83
2. Consolidated financial statements
Name Country Method of
consolidation
% of
shareholding
Etablissements Picavet  Co Belgium FC 100.00%
Eurobus Holding Belgium FC 100.00%
Eurobussing Airport Belgium FC 100.00%
Eurobussing Brussels Belgium FC 100.00%
Eurobussing Wallonie Belgium FC 100.00%
Flanders Bus Belgium FC 100.00%
Garage Du Perron Belgium FC 100.00%
Gino Tours Belgium FC 100.00%
Heyerick Belgium FC 100.00%
Joye Belgium FC 100.00%
Keolis Vlaanderen Belgium FC 100.00%
Kibel (ex Belbus) Belgium FC 100.00%
Kortenbergse Busonderneming Belgium FC 100.00%
L.I.M. Collard-Lambert Belgium FC 100.00%
Le Cinacien Belgium FC 100.00%
N.V. Autobusbedrijf Bronckaers Hamont Belgium FC 100.00%
N.V. Autobussen De Reys Belgium FC 100.00%
N.V.Autocars Henri De Boeck En Reizen Andre Leloup Belgium FC 100.00%
Pirnay Belgium FC 100.00%
Ramoudt Tours Belgium FC 100.00%
Reniers  Co Belgium FC 50.02%
S.A.D.A.R. Belgium FC 100.00%
SA A.B.C. Cars Belgium FC 100.00%
Satracom Belgium FC 100.00%
Société de Transport Automobiles Cars Autobus SA* Belgium FC 100.00%
Sophibus Belgium FC 100.00%
Sprl Bertrand Belgium FC 100.00%
Sprl Taxis Melkior Belgium FC 100.00%
Sprl Voyages F. Lenoir Belgium FC 100.00%
Sprl Truck Bus Repair (Tbr) Belgium FC 100.00%
T.C.M. Cars Belgium FC 100.00%
Transport Penning Belgium FC 100.00%
Trimi Belgium FC 100.00%
Van Rompaye NV Belgium FC 100.00%
Voyages Doppagne Belgium FC 100.00%
Voyages Nicolay Belgium FC 100.00%
West Belgium Coach Company Belgium FC 100.00%
Keolis Canada Inc. Canada FC 100.00%
Keolis Grand River Sec Canada FC 100.00%
Keolis Bus Danmark (ex City Trafik) Denmark FC 75.00%
Keolis Espagne Spain FC 100.00%
Keolis America Inc. United States FC 100.00%
Keolis Commuter Services Llc United States FC 60.00%
Keolis Rail Services America United States FC 100.00%
N° Siren / PaysCountry
84
2. Consolidated financial statements
Name Country Method of
consolidation
% of
shareholding
Keolis Rail Services Virginia United States FC 100.00%
Keolis Transit America United States FC 100.00%
Keolis Hyderabad Mass Rapid Transit System Private
Limited India FC 100.00%
Kilux Luxembourg FC 100.00%
Luxbus* Luxembourg FC 100.00%
Keolis Nederland Netherlands FC 100.00%
Keolis Norge (ex Fjord1 Partner AS) Norway FC 100.00%
Syntus BV Netherlands FC 100.00%
Keolis Amey Docklands Ltd United Kingdom FC 70.00%
Keolis UK United Kingdom FC 100.00%
Nottingham Trams Ltd United Kingdom FC 80.00%
Citypendeln Sweden FC 100.00%
CSG Commuter Security Sweden FC 100.00%
Keolis Nordic Sweden FC 100.00%
Keolis Sverige AB Sweden FC 100.00%
* Companies removed from the consolidation scope on 31 December 2015
85
2. Consolidated financial statements
Name Country Method of
consolidation
% of
shareholding
Compagnie des Transports Collectifs de l’Ouest
Parisien France EM 50.00%
Orgebus France EM 50.00%
Passerelle CDG* France EM 34.00%
RDK France EM 50.00%
SCODEC France EM 35.00%
Société de Transport de l’Agglomération de Chauny France EM 50.00%
Trans Pistes France EM 40.00%
Transévry France EM 39.42%
Transports de l’Agglomération de Metz France EM 25.00%
Transports Intercommunaux Centre Essonne (TICE) France EM 19.00%
NETLOG Germany EM 33.00%
Shanghai Keolis Public Transport Operation
Management Co China EM 49.00%
Wuhan Tianhe Airport Transport Center Operation and
Management Co. Ltd China EM 40.00%
PROMETRO Portugal EM 20.00%
First Keolis Holding Limited United Kingdom EM 45.00%
First Keolis Transpennine Holding Limited United Kingdom EM 45.00%
First Keolis Transpennine Limited United Kingdom EM 45.00%
Govia United Kingdom EM 35.00%
Govia Thameslink Railway Limited United Kingdom EM 35.00%
London  Birmingham Railway Limited United Kingdom EM 35.00%
London  South Eastern Railway Limited United Kingdom EM 35.00%
New Southern Railway Limited United Kingdom EM 35.00%
Southern Railway Limited United Kingdom EM 35.00%
Thameslink Rail Limited United Kingdom EM 35.00%
* Companies removed from the consolidation scope on 31 December 2015
10.2 Joint ventures and associates
To the Shareholders,
In compliance with the assignment entrusted to us by your Annual
General Meeting, we hereby report to you, for the year ended
December 31, 2015, on:
◗ the audit of the accompanying consolidated financial statements
of Keolis;
◗ the justification of our assessments;
◗ the specific verification required by law.
These consolidated financial statements have been approved by
the Board of Directors. Our role is to express an opinion on these
consolidated financial statements based on our audit.
I. Opinion on the consolidated financial
statements
We conducted our audit in accordance with professional standards
applicableinFrance;thosestandardsrequirethatweplanandperform
the audit to obtain reasonable assurance about whether the consoli-
dated financial statements are free of material misstatement. An audit
involves performing procedures, using sampling techniques or other
methodsofselection,toobtainauditevidenceabouttheamountsand
disclosures in the consolidated financial statements. An audit also
includes evaluating the appropriateness of accounting policies used
andthereasonablenessofaccountingestimatesmade,aswellasthe
overall presentation of the consolidated financial statements. We
believe that the audit evidence we have obtained is sufficient and
appropriate to provide a basis for our audit opinion.
In our opinion, the consolidated financial statements give a true
and fair view of the assets and liabilities and of the financial posi-
tion of the Group at December 31, 2015 and of the results of its
operations for the year then ended in accordance with
International Financial Reporting Standards as adopted by the
European Union.
II. Justification of our assessments
In accordance with the requirements of article L.823-9 of the
French Commercial Code (Code du commerce) relating to the
justification of our assessments, we bring to your attention the
following matters:
◗ Keolis carries out impairment tests on goodwill and indefinite life
assets and also assesses whether there is any indication of
impairment on non-current assets, as described in note 2.4.9 to
the consolidated financial statements. We have examined the
methods used to carry out this impairment test as well as the
corresponding cash flow forecasts and assumptions, and have
verified that the notes to the consolidated financial statements
provide appropriate disclosures.
Statutoryauditors’reportontheconsolidated
financialstatements(FortheyearendedDecember31,2015)
This is a free translation into English of the statutory auditors’ report on the consolidated financial statements issued in the French
language and is provided solely for the convenience of English-speaking users. The statutory auditors’ report includes information
specifically required by French law in such reports, whether modified or not. This information is presented below the opinion on the
consolidated financial statements and includes explanatory paragraphs discussing the auditors’ assessments of certain significant
accounting and auditing matters. These assessments were made for the purpose of issuing an audit opinion on the consolidated
financial statements taken as a whole and not to provide separate assurance on individual account captions or on information taken
outside of the consolidated financial statements.
This report also includes information relating to the specific verification of information given in the Group’s management report.
This report should be read in conjunction with, and is construed in accordance with, French law and professional auditing standards
applicable in France.
86
2. Consolidated financial statements
Neuilly-sur-Seine, March 7, 2016
The Statutory Auditors
Bertrand BoisselierFrançoise Garnier-Bel
PricewaterhouseCoopers Audit				
French original signed by
		Deloitte  Associés
		 French original signed by
◗ Note 2.4.17 specifies the valuation methods for provisions for
pensions and other employee benefits. An evaluation of these
provisions was carried out by independent actuaries. Our work
consisted in examining the data and assumptions used and
verifying that note 5.13 to the consolidated financial statements
provides appropriate disclosures.
◗ Note 2.4.17 specifies the methods used to take into account the
risks relating to ongoing litigation and contracts. Our work
consisted in examining the procedures used by the Company to
identify and assess these risks and the accounting treatment
applied and in assessing the resulting estimates.
These assessments were made as part of our audit of the
consolidated financial statements taken as a whole, and therefore
contributed to the opinion we formed which is expressed in the
first part of this report.
III. Specific verification
As required by law, we have also verified in accordance with
professional standards applicable in France the information
presented in the Group’s management report.
We have no matters to report as to its fair presentation and its
consistency with the consolidated financial statements.
87
2. Consolidated financial statements
89
3. Unaudited financial statements
3. Unaudited management
financial statements
1 • Key figures. . . . . . . . . . . . . . . . . . . . . . . . . . . . . . . . . . . . . . . . . . . . . . . . . . . . . . . . . . . . . . . . . . . . . . . . . . . . . . . . . . . . . .  90
2 • Income statement. . . . . . . . . . . . . . . . . . . . . . . . . . . . . . . . . . . . . . . . . . . . . . . . . . . . . . . . . . . . . . . . . . . . . . . . . . . . . . .  91
3 • Statement of financial position . . . . . . . . . . . . . . . . . . . . . . . . . . . . . . . . . . . . . . . . . . . . . . . . . . . . . . . . . . . . . . .  92
4 • Statement of cash flows. . . . . . . . . . . . . . . . . . . . . . . . . . . . . . . . . . . . . . . . . . . . . . . . . . . . . . . . . . . . . . . . . . . . . . .  93
ContentS
The Group considers that the following financial statements, prepared without applying IFRS 10 and 11, are accurate indicators
of the operational and financial performances of the Group. They should be considered as an additional source of information
and are in no way a substitute for other strictly accounting-related forms of the measurement of operational and financial
performance as presented in the consolidated financial statements and the notes thereto, or referred to in the financial report.
The management accounts as at 31 December 2015 have not been audited.
90
3. Unaudited financial statements
1 • Key figures
(€ million) 31/12/2015 31/12/2014
Revenue 6,240.7 5,381.4
◗ Revenue France 2,634.4 2,614.5
◗ Revenue International 3,606.3 2,766.9
Revenue net of sub-contracting 6,057.9 5,204.4
Recurring EBITDA 286.8 259.5
EBITDA 259.8 228.5
Recurring operating profit 93.9 94.5
Operating profit before investments under equity method 68.2 56.9
Operating profit after investments under equity method 68.0 57.2
Profit after tax from continuing operations 4.4 14.8
Profit attributable to equity shareholders 12.0 13.6
Total equity 202.3 162.5
of which attributable to equity shareholders 150.8 141.8
Net cash flows from operating activities 208.2 239.3
Industrial investments 206.4 192.3
Net financial debt (cash surplus) 223.9 99.4
91
3. Unaudited financial statements
2 • Income statement
(€ million) 31/12/2015 31/12/2014
Revenue 6,240.7 5,381.4
Other income from operations 20.2 25.5
Income from continuing operations 6,260.9 5,406.9
Sub-contracting (182.8) (177.0)
Purchases consumed and external expenses (2,510.4) (2,157.9)
Taxes (15.6) (14.1)
Staff costs, incentive schemes. profit-sharing (3,183.5) (2,728.9)
Other operating income 48.8 48.5
Other operating expense (120.3) (102.7)
Net provisions on current assets (0.9) (4.6)
Net depreciation and other provisions charged (213.8) (185.5)
Profit/(loss) on recurring fixed asset disposals 1.9 1.4
Amortisation of grants received 9.8 8.5
Recurring operating profit 93.9 94.5
Other non-recurring income 7.3 4.4
Other non-recurring expense (31.4) (32.6)
Depreciation and provisions on contractual rights (1.6) (9.4)
Of which depreciation of other intangible assets and negative goodwill 5.7 (5.3)
Profit before investments under the equity method 68.2 57.0
Profit/(loss) from associates (0.3) 0.2
Profit after investments under the equity method 68.0 57.2
Net cost of financial borrowing (12.2) (8.6)
Other financial income 12.2 10.7
Other financial expense (20.1) (17.1)
Financial income (expense) (20.2) (14.9)
Net profit before taxation 47.8 42.3
Taxation (43.4) (27.5)
Net profit from continuing operations 4.4 14.8
Profit for the year 4.4 14.8
Profit attributable to non-controlling interests 7.6 (1.3)
Profit attributable to Group 12.0 13.6
92
3. Unaudited financial statements
Assets
(€ million)
31/12/2015 31/12/2014
Goodwill 271.4 237.5
Other intangible assets 204.7 150.8
Property, plant and equipment 722.6 636.5
Investments under equity method 2.1 2.0
Other non-current financial assets 181.0 149.9
Deferred tax asset 45.0 46.6
Non-current assets 1,426.9 1.223.3
Inventories and work in progress 89.0 85.1
Trade receivables 438.3 411.4
Other receivables 538.8 444.3
Other current financial assets 13.5 13.9
Cash and cash equivalents 653.5 553.7
Current assets 1,733.0 1,508.4
TOTAL ASSETS 3,159.9 2,731.6
Liabilities
(€ million)
31/12/2015 31/12/2014
Share capital 46.9 46.9
Reserves and premiums 91.9 81.4
Net profit/(loss) attributable to Group 12.0 13.6
Equity attributable to Group 150.8 141.8
Reserves attributable to non-controlling interests 59.1 19.5
Profit for the year attributable to non-controlling interests (7.6) 1.3
Equity 202.3 162.5
Non-current provisions 189.4 177.0
Non-current financial debt 571.3 139.4
Deferred tax liability 38.4 12.5
Non-current liabilities 799.1 329.0
Current provisions 55.3 52.0
Current financial debt 80.7 181.9
Bank borrowings 267.2 377.8
Trade payables and other liabilities 1,755.3 1,628.3
Current liabilities 2,158.5 2,240.1
TOTAL LIABILITIES 3,159.9 2,731.6
3 • Statement of financial position
(1) As published in the Keolis S.A. 2013 annual report.
93
3. Unaudited financial statements
(€ million) 31/12/2015 31/12/2014
Operating profit before investments under equity method 68.2 56.9
Non-cash items 191.7 171.6
EBITDA 259.8 228.5
Elimination of provisions in current assets 0.9 4.6
Changes in working capital (14.8) 31.9
Tax paid (37.8) (25.8)
A) Net cash from operating activities 208.2 239.3
Capital expenditure (206.4) (192.3)
Proceeds from sale of tangible and intangible assets 46.6 34.5
Investment grants received 7.7 7.3
Change in financial assets for concessions (IFRIC 12) (14.2) (19.1)
Financial investments (140.3) (86.1)
Gains/ (losses) from disposal of financial assets 5.6 34.9
Cash flows on changes in reporting scope 4.7 27.2
B) Net cash from investing activities (296.3) (193.6)
Free cash flow (88.1) 45.7
Net dividends paid (19.6) (19.7)
Net dividends received 0.4 0.3
Change in equity (other transactions with shareholders) 38.7 13.0
New borrowings 443.7 63.3
Borrowings repaid (163.1) (107.8)
Interest received 2.8 2.3
Interest paid (14.5) (10.8)
Change in other financial debts 0.1 0.1
Other (3.7) (6.1)
C) Net cash from financing activities 284.9 (65.4)
D) Foreign exchange translation differences 13.7 15.8
Change in cash and cash equivalents (A+B+C+D) 210.5 (3.9)
Cash and cash equivalents at beginning of period 175.8 179.8
Cash and cash equivalents at end of period 386.3 175.9
Change in cash and cash equivalents 210.5 (3.9)
4 • Statement of cash flows
4. Annual Financial
Statements
CONTENTS
95
4. Annual Financial Statements
A Financial statements at 31 December 2015. .  96
1 • BALANCE SHEET AT 31 dEcembER 2015. . . . 96
2 • INCOME STATEMENT
AT 31 DeCEMBer 2015 . . . . . . . . . . . . . . . . . . . . . 98
B Notes to Annual Financial Statements. . . .  100
1 • Significant events
of the financial year. . . . . . . . . . . . . . . . .  100
2 • Accounting principles, rules
and methods . . . . . . . . . . . . . . . . . . . . . . . . . .  100
2.1 Fixed assets. . . . . . . . . . . . . . . . . . . . . . . . . . . . . . . . . 100
2.2 Tangible assets. . . . . . . . . . . . . . . . . . . . . . . . . . . . . .  101
2.3 Financial assets . . . . . . . . . . . . . . . . . . . . . . . . . . . . .  101
2.4 Receivables and payables. . . . . . . . . . . . . . . . . . . .  101
2.5 Marketable securities. . . . . . . . . . . . . . . . . . . . . . . .  101
2.6 Cash. . . . . . . . . . . . . . . . . . . . . . . . . . . . . . . . . . . . . . . . 101
2.7 Provisions for contingencies and charges. . . . . .  101
2.8 Employee benefits. . . . . . . . . . . . . . . . . . . . . . . . . . .  101
2.9 Profit from joint ventures . . . . . . . . . . . . . . . . . . . . .  101
2.10 Tax status. . . . . . . . . . . . . . . . . . . . . . . . . . . . . . . . . . 101
2.11 Crédit d’Impôt pour la Compétitivité
et l’Emploi (CICE). . . . . . . . . . . . . . . . . . . . . . . . . . .  102
3 • Use of assessments in the preparation
of financial statements. . . . . . . . . . . . . . . . 102
4 • Financial instruments. . . . . . . . . . . . . . . . . 102
5 • Notes on the balance sheet . . . . . . . . . . 104
5.1 Fixed assets. . . . . . . . . . . . . . . . . . . . . . . . . . . . . . . . . 104
5.2 Receivables. . . . . . . . . . . . . . . . . . . . . . . . . . . . . . . . .  106
5.3 Details of prepayments and deferred income. . .  106
5.4 Equity. . . . . . . . . . . . . . . . . . . . . . . . . . . . . . . . . . . . . . . 106
5.5 Provisions. . . . . . . . . . . . . . . . . . . . . . . . . . . . . . . . . . . 107
5.6 Liabilities. . . . . . . . . . . . . . . . . . . . . . . . . . . . . . . . . . . . 108
6 • Notes on the income statement. . . . . . . . 108
6.1 Analysis of turnover. . . . . . . . . . . . . . . . . . . . . . . . . .  108
6.2 Details of other income and expenses . . . . . . . . .  108
6.3 Transfers of expenses. . . . . . . . . . . . . . . . . . . . . . . .  108
6.4 Financial income and expense . . . . . . . . . . . . . . . .  109
6.5 Exceptional gains and losses. . . . . . . . . . . . . . . . . . 109
6.6 Corporate income tax. . . . . . . . . . . . . . . . . . . . . . . .  109
7 • Other information. . . . . . . . . . . . . . . . . . . . . . .  110
7.1 Related party information. . . . . . . . . . . . . . . . . . . . .  110
7.2 Financial commitments. . . . . . . . . . . . . . . . . . . . . . .  110
7.3 Pension and long service award commitments. .  110
7.4 Leasing commitments. . . . . . . . . . . . . . . . . . . . . . . .  111
7.5 Contractual obligations. . . . . . . . . . . . . . . . . . . . . . .  111
7.6 Personal training account. . . . . . . . . . . . . . . . . . . . .  111
7.7 Number of employees. . . . . . . . . . . . . . . . . . . . . . . .  111
7.8 Remuneration of directors. . . . . . . . . . . . . . . . . . . .  111
7.9 Post-balance sheet events. . . . . . . . . . . . . . . . . . . .  112
7.10 Identity of the consolidating company . . . . . . . .  112
Information on subsidiaries
and non-consolidated investments . . . . . . . . . . . . . 113
Statutory auditors’ report
on the financial statements. . . . . . . . . . . . . . . . . . . . . 128
96
4. Annual Financial Statements
1 • BALANCE SHEET AT 31 dEcembER 2015
Gross Depreciation -
Provision 31/12/15 31/12/14
(in euros)
Uncalled subscribed capital
INTANGIBLE ASSETS
Preliminary expenses 35,273 35,273 - -
Development costs - - - -
Concessions, patents and related rights 68,018,583 47,238,723 20,779 859 17,832,120
Goodwill 24,871,229 17,015,018 7,856,211 7,856,211
Other intangible assets 13,308,518 - 13,308,518 17,422,127
Advances, down payments for intangible assets - - - -
PROPERTY, PLANT AND EQUIPMENT
Land 9,859,507 1,553,583 8,305,923 6,763,103
Buildings 31,116,990 7,835,872 23,281,118 11,745,637
Technical facilities, equipment, machinery 827,618 643,886 183,732 105,196
Other property, plant and equipment 13,813,407 9,737,874 4,075,533 3,057,075
PPE under construction 2,250,948 - 2,250,948 13,337,847
Advances and down payments - - - -
NON-CURRENT FINANCIAL ASSETS
Shareholdings under the equity method - - - -
Other shareholdings 853,074,008 77,656,048 775,417,960 636,607,568
Receivables from shareholdings 305,427,035 16,572,150 288,854,885 217,874,792
Other long-term investments 188,361 7,622 180,738 180,738
Loans 695,548 - 695,548 727,277
Other non-current financial assets 1,779,617 - 1,779,617 3,290,444
TOTAL FIXED ASSETS (I) 1,325,266,641 178,296,051 1,146,970,590 936,800,135
INVENTORIES AND WORK IN
PROGRESS
Raw materials, supplies - - - -
Production in progress (goods) - - - -
Production in progress (services) - - - -
Semi-finished and finished goods - - - -
Goods - - - -
Advances and down payments on orders 389,429 - 389,429 178,234
TRADE RECEIVABLES
Trade receivables and related accounts 45,049,187 439,404 44,609,783 51,054,985
Other receivables 194,441,644 29,115,902 165,325,742 180,700,311
Subscribed called non paid-up capital - - - -
MISCELLANEOUS
Marketable securities held for trading 18,800,902 - 18,800,902 63,317,410
Cash 112,793,706 - 112,793,706 40,732,148
ACCRUALS
Prepayments 1,339,394 - 1,339,394 1,014,794
TOTAL CURRENT ASSETS (II) 372,814,263 29,555,306 343,258,957 336,997,881
Unrealised losses on foreign exchange
transactions
(III) 3,763,079 - 3,763,079 2,400,374
TOTAL ASSETS (I to III) 1,701,843,984 207,851,357 1,493,992,627 1,276,198,390
Financial statements at 31 December 2015
A
97
4. Annual Financial Statements
31/12/2015 31/12/2014
(in euros)
LIABILITIES
EQUITY
Share capital or individual capital 46,851,276 46,851,276
Additional paid-in capital - -
Revaluation reserves(1)
1,845,363 1,845,363
Legal Reserve 4,685,128 4,685,128
Statutory or contractual reserves - -
Regulated reserves - -
Other reserves 94,002,297 87,982,086
Retained earnings brought forward - -
Net profit/(loss) for the year 37,599,518 25,151,149
Investment grants 502,000 502,000
Regulated provisions 1,420,265 1,406,150
TOTAL EQUITY (I) 186,905,847 168,423,151
CONTINGENCY AND LOSS PROVISIONS
Provisions for contingencies 4,571,006 3,406,066
Provisions for charges 4,382,727 4,640,296
TOTAL PROVISIONS (II) 8,953,733 8,046,362
DEBTS
Bank borrowings(2)
144,853,373 141,738,544
Loans and other financial debts 466,661,434 116,916,997
Customer advances and down payments 39,067 39,067
Trade payables and related accounts 35,264,145 37,826,797
Tax and social security liabilities 63,070,620 48,721,468
Liabilities on assets and related accounts 5,052,095 7,188,556
Other liabilities 571,475,109 742,004,671
accruals
Deferred income 845,214 1,707,341
TOTAL LIABILITIES AND ACCRUALS (III) 1,287,261,058 1,096,143,442
Unrealised gains on foreign exchange transactions (IV) 10,871,989 3,585,435
TOTAL LIABILITIES (I TO IV) 1,493,992,627 1,276,198,390
(1) Revaluation reserves incorporated in equity 1,845,363 1,845,363
(2) Including bank overdrafts  bank balances credit 144,853,373 141,738,544
Amounts payable after one year 29,929,892 10,570,000
Amounts payable within one year 114,923,481 131,168,544
98
4. Annual Financial Statements
2 • INCOME STATEMENT AT 31 DeCEMBer 2015
(in euros) France Export 31/12/2015 31/12/2014
OPERATING INCOME
Sales of goods 	 -	- - -
Services produced 	 188,775,853	8,011,920 196,787,773 186,836,372
NET REVENUE 	 188,775,853	8,011,920 196,787,773 186,836,372
Production held as inventory - -
Capitalised production 5,977,701 2,057,089
Operating grants 43,205 10,600
Reversal of depreciation, provision and expense transfers 5,885,584 4,915,127
Other income 9,457,457 11,453,079
TOTAL OPERATING revenue (I) 218,151,720 205,272,268
Purchases of goods 8 -
Change in inventory purchases (goods) - -
Purchases of raw materials and other supplies 267,995 -
Change in inventory purchases (materials and other supplies) - -
Other purchases and operating expenses 75,988,151 65,367,350
Taxes and similar payments 9,312,814 8,611,379
Wages and salaries 92,565,343 90,570,432
Social contributions 44,009,931 43,410,303
OPERATING ALLOWANCES
On capital/fixed assets: ◗ depreciation expense 13,501,011 10,714,491
	 ◗ charges - -
On current assets: charge to provisions - -
For contingency and loss provisions: charge to provisions 1,500,291 4,234,359
Other charges 10,485,665 6,403,405
TOTAL OPERATING EXPENSES (II) 247,631,210 229,311,718
1. OPERATING PROFIT/ (LOSS) (I - II) (29,479,490) (24,039,450)
99
4. Annual Financial Statements
(in euros) France Export 31/12/2015 31/12/2014
Joint ventures
Attributed profit or transferred loss (III) 17,302,982 15,101,308
Loss borne or transferred profit (IV) 5,580,697 6,830,367
FINANCIAL INCOME
Financial income from shareholdings 35,639,217 23,271,213
Income from non-current financial assets -
Other interest and similar income 7,780,204 2,523,468
Reversal of provisions charged and expense transfers 40,483,343 41,768,296
Foreign exchange gains 22,542,432 48,517,369
Net gains on sales of marketable securities 21,151 79,321
TOTAL FINANCIAL INCOME (V) 106,466,348 116,159,666
FINANCIAL EXPENSES
Financial charges to depreciation and provisions 22,852,543 36,976,223
Interest and similar expenses 8,753,887 9,364,077
Foreign exchange losses 34,001,732 52,638,381
Net expenses on sales of marketable securities - -
TOTAL FINANCIAL EXPENSES (VI) 65,608,163 98,978,681
2. FINANCIAL INCOME / EXPENSE (V - VI) 40,858,185 17,180,984
3. RECURRING PROFIT BEFORE TAX (I - II + III - IV + V - VI) 23,100,980 1,412,476
EXCEPTIONAL GAINS
Exceptional gains on operations - -
Exceptional gains on equity transactions 13,053,730 15,775,457
Reversal of provisions charged and expense transfers 2,235,324 2,542,576
TOTAL EXCEPTIONAL GAINS (VII) 15,289,054 18,318,033
EXCEPTIONAL LOSSES
Exceptional losses on operations 5,114,913 5,141,037
Exceptional losses on equity transactions 10,378,469 4,727,577
Exceptional charges to depreciation and provisions 685,323 555,765
TOTAL EXCEPTIONAL LOSSES (VIII) 16,178,705 10,424,379
4. EXCEPTIONAL INCOME/ (LOSS) (VII - VIII) (889,650) 7,893,654
Employee profit-sharing (IX) - -
Corporate income tax (X) (15,388,189) (15,845,019)
TOTAL INCOME (I + III + V + VII) 357,210,104 363,680,451
TOTAL CHARGES (II + IV + VI + VIII + IX + X) 319,610,586 338,529,302
5. NET PROFIT/ (LOSS) 37,599,518 25,151,149
100
4. Annual Financial Statements
1 • Significant events of the
financial year
Subscription to the capital increases of subsidiaries
Pursuant to regulations on the trade’s practices relating to the
financial capacity of public passenger transportation businesses,
in 2015, Keolis S.A. subscribed to capital increases in its subsi-
diaries for a total amount of €26,570,331.70.
The main subscriptions are as follows:
(in euros)
Subsidiary name Capital increase
Keolis Lille 18,000,003
Keolis Lyon 4,000,000
Keolis Brest 1,500,000
Keolis Centre 1,000,005
CICE
The Crédit d’impôt pour la Compétitivité et l’Emploi (tax credit
for competitiveness and employment), or CICE, whose objective
is to improve firms’ competitiveness, was allotted to the reple-
nishment of working capital (see note 6.6).
“Better fortunes” obtained
Following subsidies granted by Keolis S.A. in prior financial years
containing return to better fortune clauses, an entitlement
amounting to €2,648,524 was recognised under exceptional
income / loss at 31/12/2015.
(in euros)
Subsidiary name Better fortunes obtained
Keolis Touraine 700,000
Keolis PMR Rhône 468,880
CTM 425,000
Keolis Côte d'Azur 219,000
Keolis Sud Lorraine 194,276
Keolis en Cévennes 146,178
Transports Evrard 143,885
Keolis Pays Normands 122,788
Keolis Montluçon 88,000
Millau Cars 46,000
Keolis Pays Nancéien 37,279
Keolis Cherbourg 28,872
Keolis Saint-Malo 20,000
Keolis Obernai 8,366
TOTAL 2,648,524
2 • Accounting principles, rules
and methods
The financial statements are prepared in accordance with rules
laid down by the general chart of accounts in accordance with
regulation ANC N°2014-03 dated 5 June 2014 of the French
Accounting Standards Authority (Autorité des Normes
Comptables) and principles generally accepted in the profession.
General conventions were applied in compliance with the pru-
dence principle, in accordance with the basic assumptions of:
◗ continuity of operations;
◗ consistency of accounting methods from one year to another;
◗ independence of financial years.
The basic method used to value the items in the accounts is the
historical costs method.
There were no exceptions from standards nor changes in
method that affected the annual financial statements.
The main accounting policies used are described below.
Tangible and intangible assets are valued either at cost of acqui-
sition of, when produced, at their production cost or revalued
amount according to legal requirements.
2.1 Fixed assets
Goodwill
A technical loss on mergers is recognised further to a merger or
a complete transfer of assets and liabilities, and corresponds to
the negative difference between the net asset received and the
net carrying amount of the absorbed company’s securities
recorded on Keolis S.A.’s balance sheet under assets. When
applicable, it is adjusted to take into account the tax benefit
resulting from the allocation of unused losses transferred by the
absorbed company. This negative goodwill is not amortised.
At the year end, an impairment loss is recorded when the value
in use, determined using a discounted cash flow valuation
method, is less than the acquisition value of goodwill. The good-
will is grouped with other assets to determine its utility value as
part of impairment testing.
Other intangible assets
This item mainly concerns the cost of systems software acquired
which is amortized over 5 years for IT projects and 3 years for
desktop software.
Intangible assets in progress correspond to expenditure in
connection with the implementation of IT projects, and therefore
include all expenses that can be directly attributed to projects
and which are necessary in creating, producing and preparing
the asset in order to be able to function with the use intended by
management.
Notes to Annual Financial Statements
B
101
4. Annual Financial Statements
2.2 Tangible assets
Tangible assets are valued at their acquisition cost (purchase
price and incidental expenses) or their production cost.
Methods and depreciation periods are:
Duration Method
Buildings 15 to 20 years Linear
Equipment and tooling 5 to 10 years Linear
Office equipment and furniture 5 to 10 years Linear
Automotive equipment
◗ New Vehicles
• Commercial vehicles
(GVM under 3.5 t.)
5 years Linear
• Coaches and buses 10 to 15 years Linear
◗ Used Vehicles 2 to 14 years Linear
2.3 Financial assets
Equity and other investments
Equity investments are recorded at acquisition cost. If the acqui-
sition value is greater than the inventory or utility value, an impair-
ment is recognised for the difference. For each of the holdings,
the utility value is determined on the basis of a range of valuation
methods (discounted cash flow, revalued net position).
Other financial assets are stated at their acquisition cost. Where
applicable, an impairment is recorded if their utility value falls
below their acquisition cost.
Receivables related to equity and current accounts
Receivables related to equity and current accounts are recorded
at nominal value.
When equities are fully depreciated and the net assets of the
subsidiary is negative, an impairment of all receivables related to
equity and current accounts is recorded due to the risk of loss
of these receivables following the transfer or cessation of the
activities of the subsidiary.
2.4 Receivables and payables
Receivables are recorded at their nominal value.
Where applicable, a depreciation is recognised whenever there
is a risk of non-recovery.
Receivables and payables in foreign currencies are converted at
the year-end exchange rate of the functional currency. Foreign
exchange differences resulting from this adjustment with the
transaction date exchange rate appear under “foreign exchange
translation differences”. Unrealised foreign exchange losses are
subject to a provision for liabilities, unrealised foreign exchange
gains are not recorded in the income statement.
2.5 Marketable securities
These are recorded at their acquisition cost. Where applicable, an
impairment loss is recognised for each line of securities of a simi-
larnature,inordertobringtheirvaluetotheiraverageclosingprice,
or their probable trading value for unlisted securities.
2.6 Cash
Cash balances in foreign currencies are converted at the closing
exchange rate of the financial period. Foreign exchange diffe-
rences resulting from this adjustment with the transaction date
exchange rate appear under “foreign exchange translation dif-
ferences”.
2.7 Provisions for contingencies and charges
A provision for contingencies and charges is recorded when the
company has a legal or implicit obligation to a third party arising
from a past event, whose amount can be reliably estimated and
where it is probable that its settlement will cause an uncompen-
sated outflow of resources.
2.8 Employee benefits
Employee benefits include payments due on retirement and long
service awards.
Evaluations of these obligations are carried out annually using
the projected unit credit method.
The main actuarial assumptions used for the assessment of
employee benefits are as follows:
◗ Discount rate 	 1.49%
◗ Long-term expected inflation rate	 1.75%
◗ Rate of salary increases 	 4.50%
◗ Mobility rate	 6.40%
◗ Type of retirement	At the initiative of the employee
◗ Mortality table	INSEE TD/TV 2011 – 2013
These commitments appear under off-balance sheet commit-
ments.
2.9 Profit from joint ventures
The profit or loss from joint ventures in which Keolis S.A. holds
an interest are recorded under “Attributed profit or transferred
loss” and “Loss borne or transferred profit”.
2.10 Tax status
The results of the Company are integrated within the framework
of a tax group The Group’s tax parent company is the Company
GROUPE KEOLIS S.A.S. Procedures provide that tax is calcu-
lated as if the Company were taxed separately
Any savings achieved by the parent company from the tax losses
and long-term capital losses of the subsidiary are taken by the
102
4. Annual Financial Statements
former in its income statement. However, these are reallocated
to the subsidiary as and when it generates future profits.
2.11 Crédit d’Impôt pour la Compétitivité et l’Emploi
(CICE)
The CICE, which is a tax credit, is recognised as a deduction
from corporate income tax.
3 • Use of assessments in
the preparation of financial
statements
For the preparation of annual accounts, Keolis S.A. management
may be required to make estimates and assumptions that affect
the book value of assets and liabilities, revenues and expenses
as well as information on assets and liabilities. Actual results
could differ substantially from these estimates.
The estimates and underlying assumptions are made from past
experience and other factors considered reasonable in the cir-
cumstances. They serve as the basis for the exercise of judg-
ment required in determining the carrying amounts of assets and
liabilities that cannot be obtained directly from other sources.
Actual values may differ from these estimates.
The estimates and underlying assumptions are reviewed on an
ongoing basis. In particular, disputes and litigation in progress or
with employees, have been subject to review by the manage-
ment with their advisers or lawyers in order to reflect the risk on
the valuation of assets or liabilities.
The impact of changes in accounting estimates is recorded
during the period of change if it affects only that period or during
the period of change and future periods if they are also affected
by the change.
4 • Financial instruments
Keolis S.A. uses derivative financial instruments to manage its
exposuretofinancialrisksresultingfromitsoperation,financialand
investing activities:
◗ interest rate risk;
◗ foreign exchange risk;
◗ commodities risk.
At the year end, unrealized gains are not recognised. Unrealised
lossesarebookedexceptwhentheyrelatetoinstrumentsqualified
as hedges entered into in one of the following two cases:
◗ to hedge underlying items in the balance sheet which have not
been revalued;
◗ to hedge future cash flows expected in a future year, under the
principleofmatchingtheaccountingimpactinthesamefinancial
year.
The gains and losses realised are reported in the same income
statement as the income and expenses on the hedged item.
Interestrate,foreignexchangeandcommoditiesderivativefinancial
instruments are traded with first-class bank counterparties in
accordancewiththeGroup’scounterpartyriskmanagementpolicy.
Consequently,thecounterpartyriskcanberegardedasnegligible.
Interest rate risk relating to the variable rate portion of its
financial debt
On 30th September 2010, Keolis S.A. contracted a syndicated
bullet loan arranged by Crédit Agricole CIB (“Private placement
with Caisses Régionales de Crédit Agricole” or CRPP) for a value
of €100 million. This loan was fully hedged by derivative financial
instruments. The CRPP was repaid in full when it matured on 30
September 2015 and all the CRPP hedging instruments were
unwound.
In 2015, two credit facilities were set up by Keolis S.A.:
◗ A loan of €15 million taken out at Société Générale, set up and
drawn on 15 October 2015, repayable in instalments over 8
years, to finance rolling stock. This loan is fully hedged by a
derivative financial instrument;
◗ A loan of €5 million taken out at the Banque Publique d’Investis-
sement (BPI), set up in December 2014 and drawn in February
2015. This credit facility was amended on 7 December 2015 to
increase its amount to €7 million repayable over 3 years.
103
4. Annual Financial Statements
The distribution of debt between fixed and variable rates, exclu-
ding and including the derivatives portfolio is respectively:
(€ million)
Split excluding derivatives (€M) 31/12/2015 31/12/2014
Variable rates 22 100
Fixed rates - -
(€ million)
Split including derivatives (€M) 31/12/2015 31/12/2014
Variable rates 7 -
Fixed rates 15 100
For hedging purposes, the €7 million credit line obtained from
the BPI was incorporated into the calculation of total debt
contracted by GROUPE KEOLIS S.A.S.
Currency risk
The Group has put in place intra-group loans denominated in
foreign currency and recognised in current accounts. In order to
cover the resulting foreign exchange risk, the Group uses deri-
vative financial instruments which allow it to fix the exchange
rates of these intra-group loans.
The derivative financial instruments used by Keolis S.A. are stan-
dard, liquid and market-available:
◗ forward and futures sales and purchases;
◗ foreign exchange swaps.
Loans and borrowings are revalued on the closing date to the
closing price. The revaluation differences, positive or negative,
are recorded as financial income. Symmetrically, the variation in
value of these derivative financial instruments subscribed to
cover these intra-group loans is also recorded in financial
income.
Inter-company loan hedges that were still open at 31 December
2015 are as follows:
Hedging instruments Nominal Maturity
Forward sell AUD / EUR
swaps
AUD 5.7 M 2016
Forward sell CAD / EUR
swaps
CAD 32.0 M 2016
Forward sell DKK / EUR
swaps
DKK 334.6 M 2016
Forward sell GBP / EUR
swaps
GBP 15.0 M 2016
Forward sell USD / EUR
swaps
USD 80.3 M 2016
Commodity price risks
Within the scope of its activities, the Group is exposed to a risk
in the fluctuation of the price of certain commodities, in particu-
lar diesel.
The diesel cost price fluctuation risk is generally hedged using
price indexation included in the contracts signed by Keolis S.A.
and its subsidiaries with their clients. For its diesel purchases,
the Group nonetheless bears the price risk until it is passed on
to its customers. This time lag, when it exists, usually lasts only
a few months, and up to a maximum of twenty-four months. A
hedging policy has been set up to cover this partial exposure.
Management’s objective for commodity risk management is to
defend the prices indexed under the contracts.
Keolis S.A. covers this commodities risk using standard, liquid
and market-available derivative financial instruments, namely:
◗ swaps;
◗ cap calls;
◗ cap puts to unwind an existing cap or to realise a cap spread;
◗ floor puts if tied with cap calls to create symmetrical or asym-
metrical collars;
◗ floor calls, in particular to buy back floors that constitute asym-
metrical collars.
104
4. Annual Financial Statements
Hedges of diesel taken by Keolis S.A. as at 31st December 2015 are as follows:
Type of hedging instrument
Volume in tonnes
yet to mature Maturing in 2016 Maturing in 2017
Swaps 32,632 28,932 3,700
Collars (symmetrical parts) Cap purchase and floor sale 11,500 9,900 1,600
Collars (asymmetrical parts) Floor sales 1,950 1,950 -
TOTAL 46,082 40,782 5,300
5 • Notes on the balance sheet
5.1 Fixed assets
Gross values
* dont 2 478 K€ d’écart de conversion des créances rattachées à des titres de participation
** dont 6 208 K€ de cessions de titres liées aux transmissions universelles de patrimoine
(in € thousand) Gross value at
start of year
Increase Decrease
Transfers
between
items
Gross value at
end of year
Intangible assets
Concessions, patents, licences 56,104 5,985 (10,249) 16,214 68,054
Goodwill 24,871 - - - 24,871
Other intangible assets 17,422 12,100 - (16,214) 13,309
Tangible assets
Land and development 8,317 1,543 - - 9,860
Buildings
- on own land 14,330 1,722 - 11,209 27,262
- on other land 1,807 - (1,163) 1,163 1,808
- general facilities 2,047 - - - 2,047
Plant, equipment, tooling 717 111 - - 828
Office and computer equipment
and furniture 11,261 2,799 (147) - 13,813
Assets under construction 13,339 1,284 - (12,372) 2,251
Financial assets
Holdings 974,772 186,988 (3,258) - 1,158,501
Other fixed investments 188 - - - 188
Loans and other financial assets 4,060 334 (1,919) - 2,475
GRAND TOTAL 1,129,135 212,720 (16,736) - 1,325,267
105
4. Annual Financial Statements
Depreciation and amortisation
(€ thousand)
Depreciation at
start of year
Increase Decrease
Depreciation at
year end
Intangible assets
Intangible assets 38,281 10,415 (1,414) 47,283
Tangible assets
Land and development 1,500 - - 1,500
Buildings
- on own land 3,503 1,257 - 4,760
- on other land 933 101 - 1,034
- general facilities 2,004 38 - 2,042
Plant, equipment and tooling 618 26 - 644
Other tangible assets 8,097 1,664 (23) 9,738
TOTAL 54,936 13,502 (1,437) 67,001
Intangible assets
Intangible assets principally include goodwill for €24,871 thou-
sand (net value of €7,865 thousand) consisting of technical
deficits relating to equities of Keolis Sud Allier for €17,006 thou-
sand and companies of the group Ernest Planche for €7,807
thousand.
Assets under construction
Intangible assets in progress focus primarily on the design, deve-
lopment and deployment of new operations, pre-payroll and
maintenance software solutions. Implementation is carried out
by internal and external teams.
Tangible assets under construction are mainly related to real
estate.
Transport equipment
Investments in road passenger transport equipment are made
by the Group’s subsidiaries or funding bodies.
Investments
The major increases in the year arising from purchases, creation
of companies, exchanges and capital increases are:
◗ Keolis Australia: €22,616 thousand,
◗	Keolis America: €21,058 thousand,
◗	Syntus: €20,702 thousand,
◗	Keolis Lille: €18,000 thousand,
◗	Motion Lines: €7,225 thousand,
◗	Voyages Fouache: €4,288 thousand,
◗	Keolis Lyon: €4,000 thousand.
The major decreases in the year come from sales and liquida-
tions. They are as follows:
◗ Transétude: €393 thousand,
◗	Keolis Concarneau: €137 thousand,
◗	Passerelle CDG: €13 thousand.
Receivables related to investments
The major increases in the year are:
◗ Keolis Bus Danmark: €21,662 thousand,
◗	Keolis UK: €15,006 thousand,
◗	Keolis Lille: €10,700 thousand,
◗	Keolis Bordeaux Métropole: €10,392 thousand,
◗	Courriers d’Ile de France: €5,303 thousand.
The main decreases in the year:
◗ EFFIA Saint Etienne: €586 thousand,
◗	Syntus: €10,702 thousand.
106
4. Annual Financial Statements
5.4 Equity
5.3 Details of prepayments and deferred income
Details of prepaid expenditure at 31 December 2015
(in € thousand)	
Diesel swaps	 15
Rent and charges	 1,130
IT licences	 73
Abu Dhabi balance	 122
TOTAL	1,340
Details of deferred income at 31 December 2015
(in € thousand)	
Diesel swaps	 845
TOTAL	845
(1) Other receivables: these include in particular €121,230 thousand of current accounts and €17,322 thousand of share of profits from joint ventures.
5.2 Receivables
Details of accrued income at 31 December 2015
(in € thousand)	
Accrued interest on advances and current accounts	 3,352
Customer invoices outstanding	 23,770
Supplier credit notes outstanding	 4
Tax and social security receivables	 184
TOTAL	27,310
(in € thousand) Gross amount
Due in less
than one year
Due in more
than one year
Fixed assets
Receivables related to investments 305,427 2,953 302,474
Loans 696 - 696
Other financial assets 1,780 - 1,780
Current assets
Prepayments and deposits made 389 389 -
Trade receivables and related accounts 45,049 45,049 -
Other receivables (1) 194,442 194,442 -
Deferred charges 1,339 1,339 -
TOTAL 549,122 244,173 304,950
(in € thousand)
Amount at
31/12/2014
Distributions
2015
Profit
31/12/2015
Other
movements
Amount at
31/12/2015
Capital 46,851 - - - 46,851
Revaluation difference 1,845 - - - 1,845
Legal reserve 4,685 - - - 4,685
Other reserves 87,982 6,020 - - 94,002
Profit for the year 25,151 (25,151) 37,600 - 37,600
Regulated provisions 1,406 - - 14 1,420
Investment grants 502 - - - 502
TOTAL 168,423 (19,131) 37,600 14 186,906
107
4. Annual Financial Statements
The General Meeting of 11 May 2015 allocated the profit of the
2014 financial year, amounting to €25,151,148.94, as follows:
(in € thousand)	
Profit for the year 25,151
DISTRIBUTABLE PROFIT 25,151
TOTAL 25,151
Dividends paid 19,131
Other reserves 6,020
Share capital
At 31 December 2015, capital is fixed at the sum of 46,851,276
euros divided into 3,904,273 shares of nominal value of €12.
Regulated provisions
Regulated provisions include in particular €1,023 thousand for
depreciation, including €14 thousand charged in the year.
(in € thousand) At start of year Increase Decrease At year end
Regulated provisions 1,406 18 (4) 1,420
Provisions for contingencies and losses
Provisions for disputes 1,006 148 (346) 808
Provisions for exchange losses 2,400 3,763 (2,400) 3,763
Provisions for charges 4,089 1,555 (2,235) 3,409
Provisions for long service awards 552 469 (47) 974
Asset depreciation
Goodwill 17,006 - - 17,006
Land 54 - - 54
Depreciation of investments 99,027 6,370 (27,741) 77,656
Depreciation of other financial assets 21,313 - (4,733) 16,580
Depreciation of client accounts 439 - - 439
Other depreciation(1)
26,077 13,097 (10,058) 29,116
TOTAL 173,369 25,420 (47,564) 151,225
5.5. Provisions
Reversals of provisions used amount to €2,468 thousand, inclu-
ding €819 thousand related to provisions for disputes.
Depreciation of investments
The major increases in the year are:
(€ thousand)
◗ Keolis Nord Allier	 2,526
◗ Keolis Centre	 1,000
◗ SCAC	 949
◗ Aerolis	 777
◗ Keolis Sud Allier	 750
The major decreases in the year are:
(€ thousand)
◗ Keolis America 		 5,344
◗ STA			4,868
◗ Keolis Brest		 3,818
◗ Keolis Roissy Airport	 2,519
◗ Caron Voyages		 1,715
(1) composed primarily of write-downs of Group current accounts.
108
4. Annual Financial Statements
5.6 Liabilities
(in € thousand) Gross amount
Up to 1
year
Between 1 and 5
years
More than 5
years
Bank borrowings(1)
144,853 114,923 29,930 -
Loans and other financial debts 466,661 1,042 465,619 -
Trade payables and related accounts 35,264 35,264 - -
Tax and social security debts 63,071 63,071 - -
Debts on assets and related accounts 5,052 5,052 - -
Other liabilities(2)
571,514 571,514 - -
TOTAL 1,286,416 791,153 495,263 -
(1) Includes €113,522 thousand of creditor bank balances and €1,402 thousand of loan repayments and accrued interest.
(2) Other liabilities: include short-term current account deposits and cash pooling from subsidiaries of €562,073 thousand and deferred income of €845 thousand.
Details of accrued liabilities at 31/12/2015
(in € thousand)	
Accrued interest on advances and current accounts	 1,042
Supplier invoices not received	 30,652
Tax and social security liabilities	 32,701
Accrued cash interest	 1,402
Discounts and rebates	 1,177
TOTAL	66,974
Details of borrowing
Borrowings can be broken down as follows:
(in € thousand)
Other bond issues and borrowing
Loans from credit institutions	 29,930
Creditor bank balances	 113,522
Accrued interest from borrowings 	 1,402
TOTAL	144,853
Loans and other financial debts
Current account advances to subsidiaries	 466,376
Guarantee deposits received on rented property 	 283
Other financial liabilities	 3
TOTAL	466,661
6 • Notes on the income
statement
6.1 Analysis of turnover
The Company generates the vast majority of its revenue in
France. Revenue generated abroad amounts to 8,011,919.95
euros.
6.2 Details of other income and expenses
(in € thousand)
Other operating income	
Gains on diesel hedging 	 3,405
Supplier discounts	 6,054
Other	(2)
TOTAL	9,457
Other operating expenses	
Losses on diesel hedging	 8,576
Royalties	1,857
Other	57
TOTAL	10,486
6.3 Transfers of expenses
(in € thousand)
Staff related expenditure	 240
Government vocational training agency refunds	 119
Insurance	1,059
Construction work	 3
TOTAL 	 1,421
109
4. Annual Financial Statements
6.4 Financial income and expense
6.5 Exceptional gains and losses
6.6 Corporate income tax
The corporate income tax for the year consists of:
(in € thousand) Income Expense Balance
Income from investments 24,275 - 24,275
Depreciation and provisions, net of reversals 40,483 (22,853) 17,631
Interest on current accounts 11,365 (3,963) 7,402
Interest on loans - (2,614) (2,614)
Foreign exchange gains / losses 22,542 (34,002) (11,459)
Losses/receivables related to investments - - -
Income from sale of marketable securities 21 - 21
Technical gains/losses on mergers - (25) (25)
Other financial income and expense 7,780 (2,152) 5,628
TOTAL 106,466 (65,608) 40,858
(in € thousand) Gains Losses Balance
Staff related expenditure - (5,085) (5,085)
Income / (loss) from intangible asset disposals 8,787 (8,686) 100
Income / (loss) from tangible asset disposals 1,162 (1,285) (123)
Income / (loss) from financial asset disposals 370 (407) (37)
Tax penalties - (30) (30)
Other exceptional income (inc. better fortunes on 2011 subsidies(1)
) 2,735 - 2,735
Depreciation and provisions, net of reversals 2,235 (685) 1,550
Other exceptional items - - -
TOTAL 15,289 (16,179) (890)
(in € thousand) Profit before tax Tax due Net profit
Current 23,101 852 22,249
Exceptional (890) (306) (584)
CICE - (15,879) 15,879
Other tax credits - (55) 55
Total 22,211 (15,388) 37,600
(1) See details of return to better fortunes, note 1.
110
4. Annual Financial Statements
Increase and reduction in future tax liabilities
The deferred tax bases are as follows:
7 • Other information
7.1 Related party information
No disclosures are made with regard to transactions between
related parties, insofar as these transactions are completed at
normal market conditions.
(€ thousand)
At
31/12/2015
ASSETS
Investments 853,074
Receivables related to investments 305,427
Trade receivables and related accounts 39,034
Other operating receivables 191,576
LIABILITIES
Loans and other financial debts 466,376
Trade payables and related accounts 10,238
Debts on fixed assets 225,604
Other operating liabilities 576,881
FINANCIAL INCOME
Income from investments 24,275
Guarantees and others 7,780
Interest on current accounts 11,386
FINANCIAL EXPENSES
Interest on current accounts 3,963
7.2. Financial commitments
Other financial commitments
On 30th September 2010, Keolis S.A. contracted a syndicated
bullet loan arranged by Crédit Agricole CIB (“Private placement
with Caisses Régionales de Crédit Agricole” or CRPP) for a value
of €100 million. This loan was fully hedged by derivative financial
instruments. The CRPP was repaid in full when it matured on 30
September 2015 and all the CRPP hedging instruments were
unwound.
In 2015, two credit facilities were set up by Keolis S.A.:
◗ A loan of €15 million taken out at Société Générale, set up and
drawn on 15 October 2015, repayable in instalments over 8
years, to finance rolling stock. This loan is fully hedged by a
derivative financial instrument;
◗ A loan of €5 million taken out at the Banque Publique d’Investis-
sement (BPI), set up in December 2014 and drawn in February
2015. This credit facility was amended on 7 December 2015 to
increase its amount to €7 million repayable over 3 years.
At 31 December 2015, the portfolio of guarantees and securities
given by Keolis S.A. breaks down as follows.
Bank guarantees
(guarantees and endorsements):	 €356.5 million
Parent company guarantee:	 €793.7 million
7.3 Pension and long service award commitments
Retirement payments
The amount of pension liabilities at 31 December 2015 stood at
€23,195 thousand.
This sum is not provided for in the annual financial statements
and appears under financial commitments.
(€ thousand)
Deferred tax base
at 1 January 2015
Increase Decrease
Deferred tax base
at 31 December
2015
Provisions and deferred charges
Provisions for foreign exchange losses 2,400 3,763 (2,400) 3,763
Other provisions 686 - - 686
Other temporary differences
Contribution Sociale de Solidarité 912 617 (913) 616
Translation difference - liability 3,585 10,872 (3,585) 10,872
Translation difference - asset (1,015) 2,400 (3,763) (2,378)
Income subject to deferred taxation 1,690 - (845) 845
Other 54 - (3) 51
Total 8,312 17,652 (11,509) 14,455
111
4. Annual Financial Statements
ASSETS UNDER LEASE Depreciation charges
(€ thousand) Initial cost In year Accumulated Net value
Land 278 - - 278
Buildings 1,517 - 1,517 -
Transport equipment 912 38 815 97
TOTAL 2,707 38 2,332 375
LEASING
COMMITMENTS
Rentals paid Rentals yet to be paid
(in € thousand) In year Accumulated
Up to 1
year
Between
1 year
and 5
years
+ 5 years
Total to
be paid
Residual
purchasing
price
Land, buildings 1,239 - - - - -
Transport equipment 2,574 - - - - -
TOTAl 3,813 - - - - -
Commitments at 31 December 2015 are as follows:
7.5 Contractual obligations
The operating leases taken out mainly by Keolis S.A. subsidiaries
on vehicles (coaches and buses) are signed with financial insti-
tutions for periods not exceeding eight years; the residual value
is equal to the projected market value at the end of the rental
period. Rentals excluding VAT still outstanding at 31 December
2015 amounted to €254,588 thousand, split up as follows:
◗ less than one year: €65,610 thousand,
◗ from 1 to 5 years : €159,467 thousand,
◗ more than 5 years : €29,511 thousand.
Keolis provides an undertaking to continue the rental in terms of
the payment of the rental amounts that remain due under the
contract if the subsidiary defaults. In return, the financing body
undertakes to keep the related vehicles available to the Group.
7.6 Personal Training Account
The compte personnel de formation (CPF) replaced the droit
individuel de formation (DIF) on 1 January 2015, taking over the
training entitlements accrued at 31 December 2014. It is funded
by the single contribution to the state-approved collecting bodies
which have replaced the companies as responsible for its mana-
gement.
7.7 Number of employees
The average annual headcount can be broken down as follows:
31/12/2015 31/12/2014
Executives 1,203 1,153
Supervisors and
technicians
175 171
Employees 30 39
TOTAL 1,408 1,363
7.8 Remuneration of directors
No directors’ fees are allotted to members of the Group’s mana-
gement or executive committees.
Remuneration of members of management bodies
No remuneration was paid to members of the Group’s manage-
ment bodies during 2015.
Long service awards
The amount provisioned in the annual financial statements at 31 December 2015 related to long service awards stands at €974
thousand.
7.4 Leasing commitments
The booking as capital assets and depreciation of goods financed by leasing would have resulted in the following values at 31
December 2015:
112
4. Annual Financial Statements
7.9 Post-balance sheet events
Access to GROUPE KEOLIS S.A.S.’ syndicated loan
On 20 February 2016, Keolis S.A. became an additional bor-
rower on the €900 million syndicated loan contracted by
GROUPE KEOLIS S.A.S. on 12 July 2013. This modification
enables Keolis S.A. to reinforce its liquidity and its borrowing
capacity though direct access to an external source of finance
whilst benefitting from the guarantee of GROUPE KEOLIS S.A.S.
relating to the possible use of this line of credit.
The main characteristics of this syndicated loan, following
amendments made on 11 June 2015 are:
◗ a maximum amount of €900 million,
◗ a maturity on 11 June 2020,
◗ a provision under which Keolis may extend the maturity by an
additional year, in 2016 and 2017, subject to the approval of
the entire financing syndicate. Maturity could thereby be
extended until 11 June 2022.
At 31 December 2015 the undrawn amount on this syndicated
loan stood at €300 million.
Keolis S.A. capital increase
On 3 March 2016, Keolis S.A. launched a capital increase
amounting to €300 million.
Fully subscribed to by its shareholder GROUPE KEOLIS S.A.S.,
this operation aims to reinforce Keolis S.A.’s capital base in order
to support the future development of its public transport activities
in France and worldwide.
This operation, conducted in the form of a set-off of claims
between GROUPE KEOLIS S.A.S. and Keolis S.A., reduced
Keolis S.A.’s net debt by €300 million. As a consequence of this
capital increase, equity attributable to the Group would amount
to €486.9 million instead of €186.9 million.
Keolis acquires Transports Daniel Meyer in Ile-de-France
In January 2016, the Keolis Group announced the acquisition of
a leading bus and coach service operator in Ile-de-France,
Transports Daniel Meyer. With this strategic external growth
transaction, Keolis reinforces its foothold in Ile-de-France and
consolidates its position for future projects relating to Grand
Paris Express. Keolis Ile-de-France, which generated 400 million
euros of turnover in 2014, operates a fleet of 1,900 vehicles
across 25 depots. Established in all of the departments compri-
sing the Paris region, its 19 subsidiaries employ 4,000 people
and carry 70 million passengers each year. The group Transports
Daniel Meyer has 440 employees and a fleet of 260 vehicles. It
generated a turnover of 40.4 million euros in 2014. Its main line
of business is in the operation of approximately 50 timetabled
bus lines, supplemented by school buses and school outings
and charter activity.
7.10 Identity of the consolidating company
The Company belongs to a Group whose consolidating com-
pany is GROUPE KEOLIS S.A.S., incorporated and domiciled
in France, under SIRET number 49432127600037, headquar-
tered at 20/22 Rue Le Peletier, 75009 Paris.
The consolidated accounts of GROUPE KEOLIS S.A.S. are
established in accordance with articles L 233-16 to L 233-28 of
the French Commercial Code.
113
4. Annual Financial Statements
Informationonsubsidiariesandnon-consolidated
investments(positionat31December2015)
Detailed information on shareholdings whose carrying amounts exceed 1%
of the capital of the Company required to publish its financial statements
A - SUBSIDIARIES (AT LEAST 50% OF CAPITAL HELD BY THE COMPANY)
(€ thousand)
Equity at
31 December 2014
Percentage
ofcapitalheldat
31December2015
Grossvalueof
securitiesheldat
31December2015
Netcarryingvalue
ofsecuritiesheldat
31December2015
Loansandadvances
grantedbytheCompany
andnotrefunded
increditat
31December2015
Amountofdepositsand
guararanteessupplied
bytheCompanyat
31December2015
Revenueexcl.VATfor
financialyearended
31/12/2014
Netprofitorloss(-)
forfinancialyearended
31/12/2014
Dividendscollected
bytheCompanyduring
the2015financialyear
Share
capital
Other
equity
Companies or groups
of companies
1) FRENCH SUBSIDIARIES
Keolis Chalons en Champagne 148 483 99.24 861 861 -708 - 6,165 280 193
Chemin des Grèves - BP 68 -
51000 Chalons-en-Champagne
Keolis Touriscar Ain 1,746 -1,779 100.00 1,715 - - - -6 -
20 rue de la Villette - 69328 Lyon
Société d'Exploitation des
Transports Urbains d'Oyonnax
44 18 100.00 44 44 -26 - - - -
7 Place Vaillant Couturier -
01100 Oyonnax
Keolis Oyonnax 90 -3 99.98 90 90 93 - 1,993 -1 -
Rue de la Tuilerie - 01100 Arbent
Sté des Transports de
l'Agglomération de Chauny
8 27 50.00 4 - - - -13 -
150 Avenue Jean Jaurès -
02300 Chauny
Keolis Château-Thierry 25 21 100.00 25 25 155 - 2,017 10 15
5 rue Vallée - 02400 Château-Thierry
Keolis Chauny-Tergnier 45 31 100.00 45 45 -286 - 1,296 25 18
150 avenue Jean Jaurès -
02300 Chauny
Keolis Montluçon 197 115 100.00 197 197 -779 - 5,619 48 -
Rue des Canaris - 03100 Montluçon
Keolis Sud Allier 325 2,241 100.00 3,088 2,338 773 - 6,950 250 -
14 boulevard Alsace Lorraine -
03300 Cusset
Keolis Vichy 300 611 100.00 660 660 -525 - 3,772 110 -
Boulevard Alsace Lorraine -
03300 Cusset
Cie Transports Méditerranéens 160 943 100.00 9,279 9,279 -2,361 - 8,990 295 -
Allée des Cormorans - ZI la Frayère
Mandelieu - 06150 Cannes la Bocca
Société Automobile de Provence 220 232 99.79 1,982 1,982 1,375 - 2,842 112 -
840 Avenue Emile Hugues -
06140 Vence
Keolis Garonne 38 971 100.00 1,608 1,608 -295 - 4,078 121 28
ZI de Bonzom - 09270 Mazères
Société de gestion de l'Aéroport
de Troyes en Champagne
10 -26 100.00 10 - 93 - - -3 -
20-22 rue Le Peletier - 75009 Paris
114
4. Annual Financial Statements
(€ thousand)
Equity at
31 December 2014
Percentage
ofcapitalheldat
31December2015
Grossvalueof
securitiesheldat
31December2015
Netcarryingvalue
ofsecuritiesheldat
31December2015
Loansandadvances
grantedbytheCompany
andnotrefunded
increditat
31December2015
Amountofdepositsand
guararanteessupplied
bytheCompanyat
31December2015
Revenueexcl.VATfor
financialyearended
31/12/2014
Netprofitorloss(-)
forfinancialyearended
31/12/2014
Dividendscollected
bytheCompanyduring
the2015financialyear
Share
capital
Other
equity
Companies or groups
of companies
Keolis Aude 1,783 -913 100.00 2,857 2,857 -477 - 9,506 -23 -
Pech Loubat - 11000 Narbonne
Keolis Narbonne 504 -549 100.00 720 720 -1,041 - 8,647 -156 -
Avenue de Pech Loubat -
11000 Narbonne Cedex
Keolis Aveyron Millau Cars 126 156 100.00 624 624 -125 - 1,583 138 -
ZA Saint Martin - 8 Impasse de
l'Aigoutal - 12100 Creissels
Keolis Cote d'Azur 290 360 100.00 289 289 -633 - 3,292 235 -
59. rue de la Buffa - 06000 Nice
Keolis Baie des Anges 7,305 -6,827 100.00 10,790 10,790 -1,792 - 14,252 93 -
742 route de Grenoble - 06200 Nice
Keolis Camargue 58 73 99.97 2,889 76 -66 - -26 55 -
20. rue de la Villette - 69328 Lyon
Société Transports Robert 38 2,421 99.96 821 821 -2,169 - 7,855 552 -
31 avenue José Nobre - BP 57 -
13500 Martigues
Société Autocars de Provence 46 1,005 99.97 840 840 72 - 8,324 299 182
289 rue des Roseaux -
13320 Bouc Bel Air
Keolis Pays d'Aix 1,870 -1,614 100.00 2,510 2,510 3,948 - 36,082 -376 -
Rue des roseaux - Quartier du verger
- 13320 Bouc Bel Air
SCAC SA 2,711 -2,913 100.00 4,308 0 1,058 - 6,119 -876 -
398 Avenue du Mistral - ZI ATHELIA -
13600 - La Ciotat
Keolis Arles 135 -137 100.00 136 5 59 - - -1 -
20. rue de la Villette - 69328 Lyon
Caennaise de Services 11 39 100.00 11 11 -124 - 1,073 16 10
40. rue de Bengales - 14000 Caen
Keolis Calvados 1,100 3,067 100.00 1,152 1,152 -4,458 - 31,736 2,077 619
19. chemin de Courcelle - BP 127 -
14128 Mondeville
Keolis Bus Verts 100.00
19 chemin de Courcelles -
14120 Mondeville
Keolis Pays Normands 276 186 100.00 1,268 - -77 - 3,058 217 -
ZI la Madeleine. rue de l'Ile du Marais
Carentan - 50500 Carentan
Keolis Caen 1,065 1,931 100.00 2,251 2,251 -9,189 - 53,474 528 532
15 rue de la Geôle - 14000 Caen
Keolis Littoral 3,566 -3,460 100.00 4,258 4,258 -142 - 13,765 -669 -
2 avenue du Pont Neuf -
17300 Rochefort
Keolis Saintes 140 48 100.00 139 139 -608 - 2,836 35 17
Rue des Perches - ZI Charriers -
17100 Saintes
115
4. Annual Financial Statements
(€ thousand)
Equity at
31 December 2014
Percentage
ofcapitalheldat
31December2015
Grossvalueof
securitiesheldat
31December2015
Netcarryingvalue
ofsecuritiesheldat
31December2015
Loansandadvances
grantedbytheCompany
andnotrefunded
increditat
31December2015
Amountofdepositsand
guararanteessupplied
bytheCompanyat
31December2015
Revenueexcl.VATfor
financialyearended
31/12/2014
Netprofitorloss(-)
forfinancialyearended
31/12/2014
Dividendscollected
bytheCompanyduring
the2015financialyear
Share
capital
Other
equity
Companies or groups
of companies
Compagnie du Blanc Argent CBA 279 760 99.41 4,139 4,139 -1,398 - 5,961 397 295
Gare de Romorantin -
41200 Romorantin
Keolis Centre 4,061 -3,730 100.00 5,163 - -244 - 6,545 -336 -
86 rue du village d'En Haut -
18230 Saint Doulchard
Keolis Bourgogne 153 2,629 99.50 1,917 1,917 -4,446 - 13,107 973 434
17. rue du Bailly - ZI Dijon Saint
Apollinaire - 21000 Dijon
Keolis Beaune 100.00 60 60
17. rue du Bailly - ZI Dijon Saint
Apollinaire - 21000 Dijon
Keolis Dijon 1,206 528 100.00 1,414 1,414 -12,440 - 65,639 342 94
49. rue des ateliers - 21000 Dijon
Monts Jura Autocars 2,329 -576 100.00 10,196 10,196 462 - 23,726 -396 -
4. rue Berthelot - 25000 Besançon
Keolis Pays Montbéliard 546 233 100.00 542 542 -5,736 - 18,331 168 68
CD 126 La Chamotte -
25420 Voujeaucourt
Keolis Besançon 91 9 99.96 89 89 -95 - - - -
46 rue de Trey - BP 1123 -
25002 Besançon
Keolis Urbest 640 652 100.00 801 801 -859 - 1,421 140 440
4 rue Berthelot - 25000 Besançon
Keolis Drôme Ardèche 573 1,668 100.00 3,507 3,507 -2,478 - 13,277 535 164
26. rue Laurent de Lavoisier -
26800 Portes-lès-Valence
Keolis Montélimar 47 81 100.00 47 47 -642 - 3,010 35 -
8 avenue de la Feuillade - ZA du
Meyrol - 26200 Montélimar
Keolis Eure 467 2,620 100.00 1,555 1,555 -910 - 10,631 1,179 350
2 rue Lakanal - ZI n° 2 -
27031 Evreux
Keolis Eure et Loir 538 1,797 100.00 2,363 2,363 -1,209 - 8,319 682 296
Les Fenots - 28100 Dreux
Keolis Drouais 82 62 100.00 82 82 -671 - 3,179 20 -
Les Fenots - 28100 Dreux
Keolis Quimper 259 124 100.00 257 257 -2,353 - 11,975 68 -
1 Rond Point de Quistinidal -
29000 Quimper
Keolis Brest 3,826 -4,073 100.00 5,318 5,318 -900 - 37,974 -1,745 -
7 rue Ferdinand de Lesseps -
29806 Brest
Keolis Morlaix 59 65 100.00 57 57 -516 - 2,454 31 22
ZI de Kérivin -
29600 St Martin des Champs
116
4. Annual Financial Statements
(€ thousand)
Equity at
31 December 2014
Percentage
ofcapitalheldat
31December2015
Grossvalueof
securitiesheldat
31December2015
Netcarryingvalue
ofsecuritiesheldat
31December2015
Loansandadvances
grantedbytheCompany
andnotrefunded
increditat
31December2015
Amountofdepositsand
guararanteessupplied
bytheCompanyat
31December2015
Revenueexcl.VATfor
financialyearended
31/12/2014
Netprofitorloss(-)
forfinancialyearended
31/12/2014
Dividendscollected
bytheCompanyduring
the2015financialyear
Share
capital
Other
equity
Companies or groups
of companies
Keolis Maritime Brest 8 -668 100.00 8 - 540 - 7,674 -248 -
1 rue Eperon - Port de Commerce -
BP 80713 - 29200 Brest
Keolis en Cévennes 97 233 99.19 95 95 -1,457 - 6,738 34 -
389 chemin du Viguet - 30100 Alès
Keolis Alès 100.00 100 1,119
389 chemin du Viguet - 30100 Alès
Sté des Transports en Commun
Nimois
750 460 100.00 1,090 1,090 -10,749 - 48,913 244 141
388 rue Robert Bompard -
30000 Nîmes
Keolis Auch 78 47 100.00 81 - 386 - 1,545 10 -
7 Place de la Libération - 32000 Auch
Les Cars de Bordeaux 264 641 49.97 379 379 952 - 5,663 231 94
8. rue d'Artagnan - 33000 Bordeaux
Keolis Gironde 684 8,312 90.65 6,658 6,658 -6,799 - 17,545 1,042 713
ZA les Artigons Issac - 33160 Saint
Médard en Jalles
Autobus d'Arcachon 217 2,352 100.00 2,931 2,931 -1,910 - 3,084 60 431
1431 bd de l'Industrie -
33260 La Teste de Buch
Keolis Bordeaux Métropole 5,000 -3 100.00 5,000 5,000 -37,195 - -3 -
12 boulevard Antoine Gautier -
33000 Bordeaux
Keolis Bordeaux 18,058 -11,229 100.00 18,058 10,106 -6,348 - 201,131 3,149 -
12 Boulevard Antoine Gautier -
33000 Bordeaux
Keolis Bassin d'Arcachon 100.00 200 -200
1431 boulevard de l'industrie -
33260 La Teste Buch
Les Courriers du Midi 2,039 1,083 100.00 5,117 5,116 -2,428 - 18,250 474 -
9. rue de l'Abrivado - BP 85121 -
34073 Montpellier Cedex 3
Keolis Languedoc 90 984 99.98 899 899 -1,246 - 6,268 393 234
927. avenue Joliot Curie -
30000 Nîmes
Cars du Bassin de Thau 278 392 100.00 278 278 -301 - 4,212 315 185
21 av de la Méditerranée - Lieudit
Etang d'Ingril -
34110 Frontignan-La Peyrade
Keolis Emeraude 1,562 -703 100.00 1,878 1,878 -564 - 8,590 -201 -
Rue des Rougeries ZI Sud -
35400 Saint Malo
Keolis Armor 1,472 5,405 77.71 10,877 10,877 -2,686 - 36,143 986 -
26. rue du Bignon - CS 27403 -
35135 Chantepie
117
4. Annual Financial Statements
(€ thousand)
Equity at
31 December 2014
Percentage
ofcapitalheldat
31December2015
Grossvalueof
securitiesheldat
31December2015
Netcarryingvalue
ofsecuritiesheldat
31December2015
Loansandadvances
grantedbytheCompany
andnotrefunded
increditat
31December2015
Amountofdepositsand
guararanteessupplied
bytheCompanyat
31December2015
Revenueexcl.VATfor
financialyearended
31/12/2014
Netprofitorloss(-)
forfinancialyearended
31/12/2014
Dividendscollected
bytheCompanyduring
the2015financialyear
Share
capital
Other
equity
Companies or groups
of companies
Société Rennaise de Transports 
Services Handistar
43 54 100.00 44 44 -1,049 - 3,323 28 14
26 rue Bignon - 35135 Chantepie
Keolis Saint Malo 461 222 100.00 461 461 -1,343 - 8,609 12 -
rue des Rougeries BP 70548 -
35405 Saint Malo Cedex
Keolis Rennes 2,458 -1,174 100.00 3,096 3,096 -20,034 - 109,145 -1,024 -
Rue Jean Marie Huchet - CS94001 -
35040 Rennes
Keolis Châteauroux 170 54 100.00 169 169 -317 - 4,421 26 -
6 allée de la Garenne - ZI -
36000 Châteauroux
Keolis Touraine 6,087 -3,243 100.00 7,472 7,472 -1,331 - 15,033 19 -
Impasse de Florence -
37700 St Pierre des Corps
KeolisTours 1,910 -15 100.00 1,906 1,906 -10,248 - 57,559 151 -
Avenue de Florence -
37700 Saint Pierre des Corps
Train Bleu SARL 274 -25 99.97 594 510 12 - 1,518 -12 -
3 impasse Claude Charon -
38160 St Marcellin
Voyages Monnet 537 -1,134 100.00 2,505 - 937 - 844 -847 -
Route de Grenoble -
38590 St Etienne de St Geoirs
Keolis Porte d'Isère 100.00 300 300
Avenue du Lemand -
38090 Villefontaine
Sté d'exploitat de l'aéroport Dole
Jura
50 56 51.00 26 - 700 - 2,379 -28 -
33 place de la Comédie -
39000 Lons Le Saunier
Keolis Gascogne 135 655 52.89 594 594 625 - 7,398 210 19
215 Route de Benquet -
ZA de la Téoulière -
40280 Saint Pierre du Mont
Keolis Blois 308 -87 100.00 427 427 369 - 10,010 -126 -
9 rue Alexandre Vezin - 41000 Blois
Les Cars Roannais 156 1,977 100.00 374 374 -2,026 - 3,609 521 293
ZI les Guérins - 42120 Le Coteau
Cars Planche 94 920 100.00 874 874 52 - 3,906 94 82
10 boulevard Duguet -
42600 Savigneux
Keolis Atlantique 2,076 4,713 100.00 9,926 9,926 -1,974 - 36,749 2,543 778
3 rue de la Garde - ZI Bois Briand -
44300 Nantes
Transports de la Brière 92 926 59.80 1,221 - -189 - 3,317 -199 -
7 rue Pierre Vergniaud - Penhoet -
44600 Saint-Nazaire
118
4. Annual Financial Statements
(€ thousand)
Equity at
31 December 2014
Percentage
ofcapitalheldat
31December2015
Grossvalueof
securitiesheldat
31December2015
Netcarryingvalue
ofsecuritiesheldat
31December2015
Loansandadvances
grantedbytheCompany
andnotrefunded
increditat
31December2015
Amountofdepositsand
guararanteessupplied
bytheCompanyat
31December2015
Revenueexcl.VATfor
financialyearended
31/12/2014
Netprofitorloss(-)
forfinancialyearended
31/12/2014
Dividendscollected
bytheCompanyduring
the2015financialyear
Share
capital
Other
equity
Companies or groups
of companies
Keolis Voyages 8 92 100.00 7 7 -75 - 4,116 7 -
3 rue de la Garde-Zone de Bois
Briand - 44300 Nantes
Keolis Montargis 163 56 100.00 163 163 -630 - 3,948 34 20
16 rue de la Baraudière -
45700 Villemandeur
Keolis Orléans Val de Loire 802 707 100.00 802 802 913 - 67,241 400 80
64 rue Pierre Louget-
45800 Saint Jean de Braye
Keolis Cahors - - - 5 1 -
127 boulevard Léon Gambetta -
46000 Cahors
Keolis Agen 224 34 100.00 224 224 -1,145 - 7,158 26 -
Rue Georges Clemenceau -
47240 Bon Encontre
Keolis Marmande 110 -54 100.00 135 135 -173 - 2,184 -45 -
Impasse Doumayne - ZA de Girauflat
- 47200 Marmande
Keolis Val de Maine 35 2 100.00 35 35 -113 - 1,137 5 -
Rue du Bois Rinier -
ZI Saint Barthélémy -
49124 Saint Barthélémy d'Anjou
Société de Gestion de l'Aéroport
d'Angers Marcé
8 -281 100.00 8 - 1,003 - 1,732 -174 -
Aéroport d'Angers-Marcé -
49140 Marcé
Keolis Angers 922 550 100.00 921 921 -10,432 - 56,883 314 116
Rue du Bois Rinier -
49124 Saint Barthélémy d'Anjou
Keolis Manche 497 528 100.00 3,102 3,102 -903 - 6,010 143 93
La Fosse Yvon -
50440 Beaumont Hague
Keolis Cherbourg 299 14 100.00 382 382 -1,166 - 8,904 58 -
491 rue de la Chasse aux Loups -
50110 Tourlaville
Keolis Chaumont 149 36 100.00 149 149 -589 - 3,123 34 -
Rue du Vieux Moulin -
52000 Chaumont
Keolis Laval 369 29 100.00 368 368 -2,545 - 13,264 38 -
Centre JM Moron - rue Henri Batard -
BP 0909 - 53009 Laval Cedex
Keolis Sud Lorraine 2,575 -844 100.00 2,576 2,576 -718 - 25,622 - -
1 rue de la Sablière -
54136 Bouxières Aux Dames
Keolis Bassin de Pompey 95 44 100.00 95 95 -515 - 1,540 44 29
3 rue de la Sablière -
54136 Bouxières Aux Dames
119
4. Annual Financial Statements
(€ thousand)
Equity at
31 December 2014
Percentage
ofcapitalheldat
31December2015
Grossvalueof
securitiesheldat
31December2015
Netcarryingvalue
ofsecuritiesheldat
31December2015
Loansandadvances
grantedbytheCompany
andnotrefunded
increditat
31December2015
Amountofdepositsand
guararanteessupplied
bytheCompanyat
31December2015
Revenueexcl.VATfor
financialyearended
31/12/2014
Netprofitorloss(-)
forfinancialyearended
31/12/2014
Dividendscollected
bytheCompanyduring
the2015financialyear
Share
capital
Other
equity
Companies or groups
of companies
Keolis Lorient 489 92 100.00 563 563 -5,682 - 29,724 26 -
Boulevard Yves Demaine -
56323 Lorient Cedex
Keolis Maritime Lorient 10 644 99.00 10 10 -760 - 2,284 168 158
1 rue Yves Montand -
56260 Larmor-Plage
Keolis 3 Frontières 1,976 3,365 100.00 5,869 5,869 -3,824 - 35,154 2,122 986
5 rue de l'Abbé Grégoire -
57050 Metz
Keolis Nevers 324 6 100.00 324 324 -1,456 - 6,768 6 -
120 route de Marzy - 58000 Nevers
Trans Val-de-Lys 1,101 3,205 100.00 2,027 2,027 -6,182 - 23,135 1,019 1,057
ZA de la nouvelle énergie - Rue de
l'énergie prolongée - 59560 Comines
Keolis Val Hainaut 165 2,107 96.32 3,222 3,222 -2,845 - 7,053 793 366
36 rue Ernest Macarez -
59300 Valenciennes
Keolis Lille 23,544 -30,379 100.00 42,041 42,041 44,849 - 308,330 -12,905 -
Château Rouge - 276 avenue de la
Marne - 59700 Marcq en Baroeuil
Transports Evrard 1,320 -1 100.00 8,450 - 2,812 - 9,098 - -
304 avenue du Tremblay - ZI de Vaux
- 60100 Creil
Keolis Oise 183 6,715 100.00 4,027 4,027 4,683 - 22,075 343 -
21 avenue Felix Louat - 60300 Senlis
Keolis Alençon 38 969 100.00 38 38 -181 - 2,565 -8 -
20 rue Ampère - 61000 Alençon
Keolis Arras 581 -80 100.00 669 669 - 10,675 52 -
Rue Mongolfier ZI Est - 62000 Arras
Keolis Artois Gohelle 908 885 99.99 677 677 - 55,662 499 363
59 avenue Van Pelt - 62300 Lens
Caron Voyages 1,410 -1,259 100.00 2,365 2,365 660 - 5,062 -434 -
Resurgat 1 - 64 Boulevard industriel -
62230 Outreau
Voyages Dourlens 331 -326 100.00 841 841 -765 - 2,732 -176 -
ZAL n°3 - rue de Belle Vue -
62700 Bruay La Buissiere
Voyages Fouache 100.00 4,288 - -610 - - -
1321 route Nationale -
62117 Brebières
Keolis Boulogne sur Mer 359 218 100.00 559 559 -638 - - 33 -
46/48 Rue des Canonniers -
59000 Lille
Westeel Voyages 3,325 -116 100.00 5,520 5,520 -1,795 - 20,115 706 -
2. rue F. Jiolat - 62430 Sallaumines
120
4. Annual Financial Statements
(€ thousand)
Equity at
31 December 2014
Percentage
ofcapitalheldat
31December2015
Grossvalueof
securitiesheldat
31December2015
Netcarryingvalue
ofsecuritiesheldat
31December2015
Loansandadvances
grantedbytheCompany
andnotrefunded
increditat
31December2015
Amountofdepositsand
guararanteessupplied
bytheCompanyat
31December2015
Revenueexcl.VATfor
financialyearended
31/12/2014
Netprofitorloss(-)
forfinancialyearended
31/12/2014
Dividendscollected
bytheCompanyduring
the2015financialyear
Share
capital
Other
equity
Companies or groups
of companies
Fouache Evasion 100.00 53 -33
1321 route Nationale -
62117 Brebières
Loisirs et Voyages 914 1,969 100.00 4,254 4,254 -2,004 - 11,688 605 352
ZI de l'Industrie - 63600 Ambert
KEOLIS NORD ALLIER 1,943 -1,751 94.41 2,526 - 1,084 5,211 -516 -
140 route de Lyon - 03400 Yzeure
TPR SARL 341 -9 100.00 2,250 2,250 296 - 3,589 -106 -
Chemin de la Saligue - 64140 Lons
Keolis Pyrénées 1,367 711 95.16 2,626 2,626 -143 - 10,524 393 234
Quartier Lasbats - Route de Pau -
65420 Ibos
Keolis Grand Tarbes 179 16 100.00 747 747 -916 - 4,694 24 -
Centre Kennedy - Rue Jean Loup
Chrétien - 65000 Tarbes
Les Courriers Catalans 2,160 -1,530 100.00 3,401 618 -446 - - -31 -
7 rue Jean Perrin - 66000 Perpignan
Transports GEP Vidal 1,073 -628 100.00 2,087 2,087 373 - 4,008 -27 -
7 rue Jean Perrin - 66000 Perpignan
Compagnie des Transports de
Perpignan
78 78 -84 -
20-22 rue Le Peletier - 75009 Paris
Holding Striebig 335 - 100.00 11,159 11,159 1 - - -
198 avenue de Strasbourg -
67170 Brumath
Keolis Obernai 31 21 100.00 31 31 - - 655 7 12
7 rue de la Gare -
67210 Obernai Cedex
Autocars Striebig 100.00 900 900 1,193
198 avenue de Strasbourg -
67170 Brumath
Autocars Eschenlauer - - 79.30 735 735 131 - - -
Route de Dresenheim -
67620 Soufflenheim
Autocars Planche 5,000 12,781 100.00 6,567 6,567 -11,901 - 33,623 2,311 1,500
69 rue du Champ du Garet -
69400 Arnas
Keolis PMR Rhône 1,639 -644 100.00 1,639 735 -1,107 - 3,600 72 -
ZI La Bandonnière - 4 rue Maurice
Audibert - 69800 Saint-Priest
Interhône Alpes 40 2,014 100.00 38 38 -1,982 - 699 -39 -
69 rue du Champ du Garet -
BP 80157 - Arnas -
69655 Villefranche sur Saône
Keolis Lyon 45,946 -44,070 100.00 49,998 49,998 -53,694 - 371,095 -5,598 -
19 boulevard Vivier Merle -
69212 Lyon Cedex 03
121
4. Annual Financial Statements
(€ thousand)
Equity at
31 December 2014
Percentage
ofcapitalheldat
31December2015
Grossvalueof
securitiesheldat
31December2015
Netcarryingvalue
ofsecuritiesheldat
31December2015
Loansandadvances
grantedbytheCompany
andnotrefunded
increditat
31December2015
Amountofdepositsand
guararanteessupplied
bytheCompanyat
31December2015
Revenueexcl.VATfor
financialyearended
31/12/2014
Netprofitorloss(-)
forfinancialyearended
31/12/2014
Dividendscollected
bytheCompanyduring
the2015financialyear
Share
capital
Other
equity
Companies or groups
of companies
Keolis Val de Saône 953 271 99.27 1,006 1,006 -1,318 - 10,829 74 -
30 rue de Guerlande - Zone Verte -
71880 Chatenay le Royal
Keolis Aix Les Bains 540 -310 100.00 540 - -313 - 4,499 36 -
1700 boulevard Lepic - 73100 Aix
Les Bains
Société pour la Mobilité à Paris 162 905 100.00 162 162 1,065 - 13,765 127 -
58 averue des Terroirs de France -
75012 Paris
Institut Keolis 37 1,679 100.00 37 37 -2,100 - - 1,672 1,672
20-22 rue Le Peletier - 75009 Paris
Keolis Seine Maritime 185 4,166 100.00 5,631 5,631 -4,773 - 16,259 717 295
55/57 le Nid de Verdier - 76400
Fécamp
Keolis Rouen Vallée de Seine 63 406 100.00 63 63 -894 - 4,161 153 125
3 Bis rue Nicephore Niepce - Zone
Industrielle - 76300 Sotteville les Rouen
Les Courriers de l'Ile-de-France 344 24,112 99.99 560 560 20,382 - 105,362 4,359 2,233
34 rue de Guivry -
77980 Le Mesnil-Amelot
Val Trans Services Roissy 37 2,207 100.00 660 660 -2,302 - 5,084 872 420
Rue des Acacias -
77990 Le Mesnil Amelot
Airelle 6,108 -11,178 100.00 6,104 - 4,346 - 6 -79 -
1 à 9 avenue Francois Mitterand -
Immeuble Le Jade -
93200 Saint Denis
Transroissy SNC 2,519 -3,190 100.00 3,419 3,419 -13 - 11,177 -948 -
Rue de Paris Lieu-dit La Maladrerie -
77990 Mesnil Amelot
Aerosat 50 2,220 85.00 43 43 -478 - 13,503 1,217 880
Rue des Acacias -
77990 Le Mesnil Amelot
Keolis Mobilité Roissy 104 -192 100.00 324 324 -3,026 - 8,484 -147 -
34 rue de Guivry -
77990 Le Mesnil Amelot
Keolis Roissy Services
Aeroportuaires
100.00 180 180 - -
Rue de Paris - Lieu-dit La Maladrerie -
77990 Le Mesnil Amelot
Cie des Transports Collectifs de
l'Ouest Parisien
40 1,437 50.00 20 20 -300 - 8,280 171 85
18 rue de la Senette -
78755 Carrières sous Poissy
SVTU SA 680 8,591 99.90 2,960 2,960 -1,285 - 29,277 1,311 440
12 avenue du Général de Gaulle -
Les Manèges - 78000 Versailles
Keolis Yvelines 358 -102 99.68 959 959 2,758 - 4,467 33 -
12 avenue du Général de Gaulle -
Les Manèges - 78000 Versailles
122
4. Annual Financial Statements
(€ thousand)
Equity at
31 December 2014
Percentage
ofcapitalheldat
31December2015
Grossvalueof
securitiesheldat
31December2015
Netcarryingvalue
ofsecuritiesheldat
31December2015
Loansandadvances
grantedbytheCompany
andnotrefunded
increditat
31December2015
Amountofdepositsand
guararanteessupplied
bytheCompanyat
31December2015
Revenueexcl.VATfor
financialyearended
31/12/2014
Netprofitorloss(-)
forfinancialyearended
31/12/2014
Dividendscollected
bytheCompanyduring
the2015financialyear
Share
capital
Other
equity
Companies or groups
of companies
Keolis Somme 219 96 99.99 219 219 -354 - 1,855 - 15
ZI du Frier - 80290 Poix de Picardie
Société d'Exploitation de
l'Aéroport Albert Picardie
50 -118 50.96 26 - 191 - 404 -145 -
Rue Henri Potez - 80300 Meaulte
Keolis Abbeville 162 107 99.02 186 186 33 - 2,414 33 49
Place de la Gare - 80100 Abbeville
Cariane Littoral 2,762 -2,345 100.00 2,824 2,824 -457 - 5,086 -125 -
Place de la Gare - 59820 Gravelines
Société Départementale des
Transports du Var
1,344 2,419 95.08 5,303 5,303 170 - 17,104 55 -
175 Chemin du Palyvestre - 83400
Hyères 
Keolis Châtellerault 113 55 100.00 111 111 -751 - 3,687 39 28
6 rue Le Prince Ringuet - 86100
Châtellerault
Keolis Epinal 141 506 100.00 141 141 396 - 4,918 235 296
ZAC de la Magdeleine - 88000 Epinal
Autocars Garrel et Navarre 47 6,394 100.00 5,783 5,783 -4,310 - 11,491 844 848
19 rue Charles Mory - 91210 Draveil
Société d'Exploitation Transport
de Voyageurs Evry-Ris
50 51 100.00 1,982 - -114 - 229 128 -
172 Avenue François Mitterrand -
91200 Athis Mons
Athis Cars SA 230 5,882 100.00 5,594 5,594 3,580 - 31,669 1,220 438
172 avenue François Mitterrand -
91200 Athis Mons
STA SARL 3,004 -2,148 100.00 5,705 5,705 3,443 - 9,529 -656 -
110 route Nationale 191 -
La belle Etoile - 91540 Mennecy
Intrabus EURL 282 1,350 100.00 759 759 -710 - 12,078 414 211
1 à 3 avenue François. Mitterand -
93200 Saint Denis
Société  Exp. Francilienne Inter
Modalité (STEFIM)
40 -490 100.00 40 - 1,873 - 723 -497 -
1 à 3 avenue Francois Mitterand -
Immeuble Le Jade -
93200 Saint Denis
Autocars Delion 482 572 100.00 2,557 2,557 158 - 7,281 270 190
12 rue Jean Perrin - 92000 Nanterre
Keolis Mobilité Hauts de Seine 10 -1,388 100.00 10 - 1,387 - 15 -79 -
1-3 av Francois Mitterrand - Batiment
le Jade - 93200 La Plaine St Denis
S.F.D 40 527 100.00 1,184 566 -562 - - -1 -
20-22 rue Le Peletier - 75009 Paris
Keolis Travel Services 397 -482 100.00 517 - 465 - 1,686 -253 -
12 rue Jean Perrin - 92000 Nanterre
123
4. Annual Financial Statements
(€ thousand)
Equity at
31 December 2014
Percentage
ofcapitalheldat
31December2015
Grossvalueof
securitiesheldat
31December2015
Netcarryingvalue
ofsecuritiesheldat
31December2015
Loansandadvances
grantedbytheCompany
andnotrefunded
increditat
31December2015
Amountofdepositsand
guararanteessupplied
bytheCompanyat
31December2015
Revenueexcl.VATfor
financialyearended
31/12/2014
Netprofitorloss(-)
forfinancialyearended
31/12/2014
Dividendscollected
bytheCompanyduring
the2015financialyear
Share
capital
Other
equity
Companies or groups
of companies
Voyages Autocars Services 2,064 -1,413 100.00 4,020 4,020 6,859 - 8,595 308 -
52 rue Jean Lemoine -
93230 Romainville
Pacific Cars 1,300 -2,895 100.00 4,581 - 2,086 - 98 -133 -
20 rue du Bailly -
93210 La Plaine Saint-Denis
Prioris 38 3 100.00 38 38 -37 - - -34 -
1 à 3 avenue François Mitterand -
93200 La Plaine Saint Denis
Société des Transports et de
Serv. Aéroportuaires
150 26 100.00 98 98 -174 - - -14 -
1 à 3 avenue Francois Mitterand -
Bâtiment Le Jade -
93200 Saint Denis
Transports Services Aérolignes 8 - 100.00 8 8 -27 - 16 -1 -
34 rue de Guivry -
77990 Le Mesnil Amelot
Keolis Val d'Oise 128 1,668 99.99 130 130 3,261 - 5,596 269 85
1 chemin Pavé -
95340 Bernes sur Oise
Aérobag 8 -2,813 100.00 8 - 2,763 - 5,301 -221 -
Rue de Paris - lieu-dit La Maladrerie -
77990 Le Mesnil Amelot
Aerolis 259 879 50.10 777 - 4,981 - 27,732 360 -
Lieu-dit La Maladrerie - Rue de Paris
77990 Le Mesnil Amelot
Keolis Conseil  Projets 8 236 100.00 8 8 1,039 - 2,975 235 235
20 rue de la Villette - Immeuble le
Bonnel - 69003 Lyon
Motion Lines 10 8 100.00 7,235 7,235 -32 - - - -
20 rue Hector Malot - 75012 Paris
SCI St Nicolas 196 196 -
55/57 le Nid de Verdier -
76400 Fécamp
SCI Héron Verdier 228 228 -
55/57 Le Nid de Verdier -
76400 Fécamp
REV (Réseau en Vosges) 10 7 70.00 7 7 -180 - 2,481 3 -
3 place Gambetta -
88300 Neufchâteau
Keolis Amiens 654 390 100.00 654 654 -8,206 - 32,145 217 65
45 rue Dejean - 80000 Amiens
Les Transports Dunois 629 -461 100.00 651 165 -160 154 -7 -
Route de la souterraine -
23800 Dun le Palestel
STA Creilloise 250 218 83.97 210 210 -977 7,214 108 -
ZI du Marais sec - rue du pont de la
brèche sud - 60780 Villers Saint-Paul
124
4. Annual Financial Statements
(€ thousand)
Equity at
31 December 2014
Percentage
ofcapitalheldat
31December2015
Grossvalueof
securitiesheldat
31December2015
Netcarryingvalue
ofsecuritiesheldat
31December2015
Loansandadvances
grantedbytheCompany
andnotrefunded
increditat
31December2015
Amountofdepositsand
guararanteessupplied
bytheCompanyat
31December2015
Revenueexcl.VATfor
financialyearended
31/12/2014
Netprofitorloss(-)
forfinancialyearended
31/12/2014
Dividendscollected
bytheCompanyduring
the2015financialyear
Share
capital
Other
equity
Companies or groups
of companies
Voyages Chargélègue 1,291 -1,731 100.00 1,772 - 191 297 1 -
20 rue Grand rue Vasles -
79340 Menigoute
TRANSKEO 51.00 51 51 - - -
266 avenue du Président Wilson -
Immeuble Le Stadium -
93200 Saint Denis
KLP02 100.00 10 -
20 rue Le Peletier - 75009 Paris
KLP03 100.00 10 -
20 rue Le Peletier - 75009 Paris
125
4. Annual Financial Statements
(€ thousand)
Equity at
31 December 2014
Percentage
ofcapitalheldat
31December2015
Grossvalueof
securitiesheldat
31December2015
Netcarryingvalue
ofsecuritiesheldat
31December2015
Loansandadvances
grantedbytheCompany
andnotrefunded
increditat
31December2015
Amountofdepositsand
guararanteessupplied
bytheCompanyat
31December2015
Revenueexcl.VATfor
financialyearended
31/12/2014
Netprofitorloss(-)
forfinancialyearended
31/12/2014
Dividendscollected
bytheCompanyduring
the2015financialyear
Share
capital
Other
equity
Companies or groups
of companies
2) FOREIGN SUBSIDIARIES
Keolis Nordic * 100 -86,032 100.00 8,355 8,355 15,790 - -15,886 -
c/o Advokatfirman Vinge KB - Box
1703 - 111 87 Stockholm - Sweda
SEK SEK SEK SEK
Keolis Espagne 4,508 -527 100.00 20,445 3,997 -3,925 - 130 -
Via Augusta, 291 - 08017 Barcelona
- Spain
Keolis Canada Inc * 29,569 -23,274 100.00 20,892 20,892 21,207 81,834 -9,703 -
1 place Ville Marie - H3B 4M7
Montréal - Canada
CAD CAD CAD CAD
Keolis UK * 2,000 1,899 100.00 3,059 3,059 20,437 - 2,789 -
Evergreen Buiding North -
160 Euston Road - NW1 2DX London -
United Kiingdom
GBP GBP GBP GBP
Keolis Bus Danmark * 24,857 110,326 75.00 11,275 11,275 44,835 600,951 -13,932 -
2/4, Thorvald Borgs Gade -
2300 Copenhagen - Danmark
DKK DKK DKK DKK
KeolisDeutschalndGmbhCo.KG 51 -13,571 100.00 736 - -39,900 126,664 -2,647 -
Rheinstrasse 4E - 55116 Mainz -
Germany
Keolis Deutschland
Verwaltungsgesellschaft GmbH
26 -15 100.00 26 14 - - -
KG Postfach-103255 -
40023 Düsseldorf - Germany
Keolis Vlaanderen 7,348 8,905 100.00 22,708 22,708 - 2,732 -
Oosterring 17 - 3600 Genk - Belgium
Keolis America * 46,565 -17,796 100.00 56,181 56,181 74,129 - -6,902 -
c/o National Corporate Research,
615 South Dupont Highway
USD USD USD USD
Dover, Kent County 19901 Delaware
- USA
Keolis Australie * - 16,841 100.00 22,616 22,616 3,826 - -831 -
140 William Street -
VIC 3000 Melbourne - Australia
AUD AUD AUD
Keolis Tramway d'Alger * 100.00 198 -
2 impasse Bossuet - Alger - Algeria DZD DZD
Eurobus Holding SA 25,000 36,461 100.00 131,453 131,453 - 156 -
62 av. de Navagne - 4600 Visé -
Belgium
Keolis Hyderabad Mass Rapid
Transit System Private Limited *
3,500 121,641 100.00 50 50 327,905 83,040 1,439
Cyber Tower - Q3 L4 - 500081
Hyderabad - India
INR INR INR INR
Kilux 13 20 100.00 20 20 468 9 -
Weiswampach - Grand Duché -
Luxembourg
Striebig Deutschland GmbH 100.00 1,000 1,000 - - -
Lundelbrunnstrasse 6 - 76887 Bad
Bergzabern - Germany
KIBEL 37,671 30,433 100.00 81,708 81,708 -155,559 - 1,302 -
62 av. de Navagne - 4600 Visé -
Belgium
126
4. Annual Financial Statements
B - NON CONSOLIDATED INVESTMENTS (BETWEEN 10% AND 50% HELD BY COMPANY)
(€ thousand)
Equity at
31 December 2014
Percentage
ofcapitalheldat
31December2015
Grossvalueof
securitiesheldat
31December2015
Netcarryingvalue
ofsecuritiesheldat
31December2015
Loansandadvances
grantedbytheCompany
andnotrefunded
increditat
31December2015
Amountofdepositsand
guararanteessupplied
bytheCompanyat
31December2015
Revenueexcl.VATfor
financialyearended
31/12/2014
Netprofitorloss(-)
forfinancialyearended
31/12/2014
Dividendscollected
bytheCompanyduring
the2015financialyear
Share
capital
Other
equity
Companies or groups
of companies
1) French subsidiaries
T.I.C.E 182 1,153 19.00 35 35 - - -
352 rue des Champs Elysées -
91026 Evry
Scodec Voyages SCOP 338 617 35.00 111 111 92 - - -
La Tuilerie du Vignault - 79140
Cerisay
Canal TP 763 2,340 34.02 1,687 1,687 3,717 9,431 903 99
20 bd Poniatowski - 75012 Paris
Trans Pistes 80 50 40.00 32 - 932 -108 -
37-39 rue d'Athènes - 13127 Vitrolles
Transports de l'Agglomération de
Metz Metropole
2,000 -90 25.00 500 500 43,649 -19 -
10 rue des intendants Joseph et
Ernest Joba - 57000 Metz
Société Transports Voyageurs
Devillairs
359 2,516 40.36 310 310 6,083 13,878 28 -
12 avenue du Général De Gaulle -
78000 Versailles
Keolis Pays des Volcans 904 153 45.97 416 416 287 5,546 216 -
14, avenue de la Gare - 63260
Aigueperse
ONE PARK 35 20.25 1,750 1,750
Essec - Avenue Bernard Hirsch
BP 50105 - 95021 Cergy Pontoise
Cedex
Les Cars de Bordeaux 264 734 49.97 379 379 - - 5,390 223 94
8, rue d’Artagnan -
33000 Bordeaux
(€ thousand)
Equity at
31 December 2014
Percentage
ofcapitalheldat
31December2015
Grossvalueof
securitiesheldat
31December2015
Netcarryingvalue
ofsecuritiesheldat
31December2015
Loansandadvances
grantedbytheCompany
andnotrefunded
increditat
31December2015
Amountofdepositsand
guararanteessupplied
bytheCompanyat
31December2015
Revenueexcl.VATfor
financialyearended
31/12/2014
Netprofitorloss(-)
forfinancialyearended
31/12/2014
Dividendscollected
bytheCompanyduring
the2015financialyear
Share
capital
Other
equity
Companies or groups
of companies
SYNTUS 272 -7,843 100.00 22,248 22,248 - 122,633 -7,858 -
5 Visbystraat - 7418 BE Deventer -
Netherlands
-
Keolis Nederland 18 -1,667 100.00 68 68 -7,290 - -1,362 -
5 Visbystraat - 7418 BE Deventer -
Netherlands
RDK 50.00 - -
54 quai de la Rapée - 75012 Paris
127
4. Annual Financial Statements
(€ thousand)
Equity at
31 December 2014
Percentage
ofcapitalheldat
31December2015
Grossvalueof
securitiesheldat
31December2015
Netcarryingvalue
ofsecuritiesheldat
31December2015
Loansandadvances
grantedbytheCompany
andnotrefunded
increditat
31December2015
Amountofdepositsand
guararanteessupplied
bytheCompanyat
31December2015
Revenueexcl.VATfor
financialyearended
31/12/2014
Netprofitorloss(-)
forfinancialyearended
31/12/2014
Dividendscollected
bytheCompanyduring
the2015financialyear
Share
capital
Other
equity
Companies or groups
of companies
2) Foreign subsidiaries
Prometro 500 466 20.00 100 100 579 46,812 -127 -
Rua de Campo Alegre 17,
2 - 4150-177 Porto - Portugal
Goldlinq Holdings Pty Ltd 4,287 4,287
Level 2, 7 Bay Street -Southport QLD
4215 - Australia
Wuhan Tianhe Airport Transport
Center Operation and
Management Co., Ltd
47 HuangXiaoHe Road- District of
Jiang An- Wuhan - China
1,739
CNY
- 100.00 85 85 - - -
Shanghai KEOLIS Public
Transport
Operation Management Co.
5F Building N°1- 909 Guilin Road -
201 103 Shanghai - China
1,503
CNY
-438
CNY
100.00 724 724 - -438 -
STAR
Abidjan plateau - Avenue Nogue
Immeuble Brodway - 011450 Abidjan
- Ivory Coast
25.00 1 1
* Subsidiaries presented in local currency for Equity, Revenue and Net profit.
128
4. Annual Financial Statements
To the Shareholders,
In compliance with the assignment entrusted to us by your
Annual General Meeting, we hereby report to you, for the year
ended December 31, 2015, on:  
◗ the audit of the accompanying financial statements
of Keolis;
◗ the justification of our assessments;
◗ the specific verifications and information required by law.
These financial statements have been approved by the Board of
Directors. Our role is to express an opinion on these financial
statements based on our audit.
I. Opinion on the financial statements
We conducted our audit in accordance with professional
standards applicable in France; those standards require that we
plan and perform the audit to obtain reasonable assurance about
whether the financial statements are free of material misstate-
ment. An audit involves performing procedures, using sampling
techniques or other methods of selection, to obtain audit
evidence about the amounts and disclosures in the financial
statements. An audit also includes evaluating the appropriate-
ness of accounting policies used and the reasonableness of
accounting estimates made, as well as the overall presentation
of the financial statements. We believe that the audit evidence
we have obtained is sufficient and appropriate to provide a basis
for our audit opinion.
In our opinion, the financial statements give a true and fair view
of the assets and liabilities and of the financial position of the
company at December 31, 2015 and of the results of its opera-
tions for the year then ended in accordance with French accoun-
ting principles.
Neuilly-sur-Seine, March 7, 2016
The Statutory Auditors
II - Justification of our assessments
In accordance with the requirements of article L.823-9 of the
French Commercial Code (Code de commerce) relating to
the justification of our assessments, we inform you that the
assessments made by us focused on the appropriateness of
the accounting principles used and the reasonableness of the
significant estimates made by the management relating
particularly to the following matters :
◗ measure the value in use of financial investments and the
recoverable value of current accounts and receivables from
investments (§2.3 of the notes);
◗ measure the recoverable amount of goodwill resulting from
technical losses on mergers (§2.1 of the notes);
◗ risks related to current litigations (§2.7 of the notes).
These assessments were made as part of our audit of the
financial statements taken as a whole, and therefore contributed
to the opinion we formed which is expressed in the first part of
this report.
III. Specific verifications and information
We have also performed, in accordance with professional
standards applicable in France, the specific verifications required
by French law.
We have no matters to report as to the fair presentation and the
consistency with the financial statements of the information
given in the management report of the Board of Directors and
in the documents addressed to shareholders with respect to the
financial position and the financial statements.
According to the law, we have ensured that the information
related with acquisitions of subsidiaries or increases in their
share capital were communicated to you in the management
report.
Statutoryauditors’reportonthefinancialstatements
(FortheyearendedDecember31,2015)
PricewaterhouseCoopers Audit
French original signed by				
		Deloitte  Associés
French original signed by
Bertrand BoisselierFrançoise Garnier-Bel
This is a free translation into English of the statutory auditors’ report issued in French and is provided solely for the convenience of English
speaking users. The statutory auditors’ report includes information specifically required by French law in such reports, whether modified or
not. This information is presented below the opinion on the financial statements and includes explanatory paragraphs discussing the audi-
tors’ assessments of certain significant accounting and auditing matters. These assessments were considered for the purpose of issuing
an audit opinion on the financial statements taken as a whole and not to provide separate assurance on individual account captions or on
information taken outside of the financial statements.
This report also includes information relating to the specific verification of information given in the management report and in the docu-
ment addressed to shareholders.
This report should be read in conjunction with, and is construed in accordance with, French law and professional auditing standards appli-
cable in France.
129
4. Annual Financial Statements
Keolis SA 2015 Financial Report

Keolis SA 2015 Financial Report

  • 1.
  • 2.
    CONTENTS 1. Management Report..................................... 3 Management Report of the Board of Directors at the Annual General Meeting on 12 April 2016....................................................................4 Appendix 1.............................................................................9 Appendix 2.......................................................................... 26 Appendix 3.......................................................................... 27 Appendix 4.......................................................................... 27 2. consolidATED FINANCIAL STATEMENTS ................................ 29 Key figures for the Group................................................ 30 Consolidated financial statements............................... 31 Notes to the consolidated financial statements........................................................................... 36 Statutory auditors’ report on the consolidated financial statements ............................... 86 3. Unaudited management financial statements ................................ 89 Key figures........................................................................... 90 Income statement............................................................. 91 Statement of financial position...................................... 92 Statement of cash flows.................................................. 93 4. Annual Financial Statements ......... 95 Financial statements at 31 December 2015 ............. 96 Notes to the Annual Financial Statements ............. 100 Information on subsidiaries and non-consolidated investments ........................... 113 Statutory auditors’ report on the financial statements.......................................... 128
  • 3.
    33 1. Management Report AManagement Report of the Board of Directors. . . . . . . . . . . . . . . . . . . . . . . . . . . . . . . . . . . . . . . . . . . . . 4 B Appendices. . . . . . . . . . . . . . . . . . . . . . . . . . . . . . . . . . . . . . . . . . . . . . . . . . . . . . . . . . . . . . . . . . . . . . . . . . . . . . . . . . 9 Appendix 1 Non-financial data. . . . . . . . . . . . . . . . . . . . . . . . . . . . . . . . . . . . . . . . . . . . . . . . . . . . . . . . . . . . . . . . . . . . . . . . . . . . . . . . . 9 Appendix 2 List of terms of office or functions performed in 2015 in other companies by the executive officers of Keolis. . . . . . . . . . . . . . . . . . . . . . . . . . . . . . . . . . . . . . . . . . . . . . . . . . . . . . . . . . . . . . . . . . . 26 Appendix 3 Summary of delegations of powers and authorities granted by the General Assembly of the Board with regard to capital increases. . . . . . . . . . . . . . . . . . . . . . . . . . . . . . . . . . . . . . . . . . . . . . . . . . . . . . . . . . . 27 Appendix 4 Table of earnings for the past five financial years. . . . . . . . . . . . . . . . . . . . . . . . . . . . . . . . . . . . . . . . . . . . . . . . . . . . . . . 27 CONTENTS
  • 4.
    Management Report ofthe Board of Directors at the Annual General Meeting on 12 April 2016 A 4 1. Management Report Ladies and Gentlemen, We have convened this Ordinary Annual General Meeting, in accordance with legal, regulatory and statutory requirements to report to you on the activities of our Company during the year ended 31st December 2015 and submit for your approval the annual and consolidated accounts of that year. In addition, your Auditors will also read their reports to you. For our part, we are at your disposal to provide any clarification and further information that you might find desirable. We will review below, successively, the various items of informa- tion as required by applicable regulations. • HIGHLIGHTS OF THE FINANCIAL YEAR Business activity and development Notable 2015 events in Keolis in France were the renewal of its contracts in Le Mans, Châteauroux, Vesoul, on the Blanc Argent line (railway operating licence), and contract extensions in Lorient and Arras. In Continental Europe, Keolis renewed the Hellweg-Netz contract in Germany, won the Odense bus contract and Aarhus tram contract in Denmark, won the Zwenzwoka railway tender and Utrecht bus tender in the Netherlands and won the Dalarna bus contract in Sweden. In the United Kingdom, Keolis opened two new tram lines in Nottingham, almost doubling the size of the network. In North America, Keolis renewed the urban contract for MRC Les Moulins in Canada and the railway operating contract VRE in the USA. In the field of new connected mobility solutions, Keolis esta- blished the subsidiary Kisio, bringing together the Group’s skills in Solutions and Services around five expertise hubs (analytics with Kisio Analysis, forecasting with Kisio Consulting, operations with Kisio Services, scientific and industrial with Kisio Solutions and digital with Kisio Digital) and continues to develop new ser- vices projects for all public transport authorities. Reimbursement of CRPP In September 2015, Keolis paid back the €100 million five year credit facility arranged in September 2010 with the Caisses Régionales du Crédit Agricole. Acquisition of ATE in Australia On 1 May 2015, Keolis Downer (51%-owned by Keolis and 49% by Downer EDI), Australia’s largest light rail operator, acquired Australian Transit Enterprises (ATE), one of the country’s biggest bus operators. As a result of this acquisition, Keolis Downer has become the leading privately-owned multi-modal public transport operator in Australia. Established in 1974 as a family business, ATE has since conti- nued to grow, generating revenue of approximately AUD 190 million (€136 million) in 2014. Headquartered in Brisbane, ATE operates a fleet of nearly 1,000 buses and runs urban, inter-city and school services in three states: South Australia (Adelaide), Western Australia (Perth) and Queensland (Brisbane). The com- pany currently employs 1,600 people. As the 5th largest private bus operator in Australia, ATE consists of 4 business divisions: ◗ Path Transit, providing timetabled route and school bus ser- vices in the suburbs of Perth (Western Australia); ◗ Southlink, providing timetabled route and school bus services in metropolitan Adelaide (South Australia). ◗ LinkSA, providing timetabled route, school, special bus and dial-a-ride services within 100km of Adelaide (South Australia); ◗ Hornibrook, providing timetabled route and school bus ser- vices in the suburbs of Brisbane (Queensland). Lille ticketing system In Lille, malfunctions of the ticketing system delivered by Parkeon resulted in its late implementation compared to the initial contrac- tual schedule. Lille Métropole (LMCU renamed MEL) decided to introduce it into service in June 2013 against the advice of Keolis who had refused acceptance. This resulted in a shortfall in Keolis Lille’s revenue. In these circumstances the courts appointed an expert in December 2014 to determine the origin of the flaws and appraise their financial impact. The expertise is currently ongoing and will continue during 2016. The Group’s financial results for 2015 The Group’s turnover for 2015 amounted to €4,817 million, an increase of €542 million, or 12.7%, on 2014. The currency impact is positive at +€73.8 million in particular due to the depreciation of the euro against sterling and the US dollar. The consolidation scope effect is +153.0 million, due to the acquisition of Striebig and the disposal of Transévry in France, the acquisition of ATE in Australia and various acquisitions by EBH in Belgium (Doppagne/Sanglier, Schloemer, Dislaire/ Ourthe, Van Rompaye) and the tie-up with Nettbuss in Denmark. The portfolio impact of contracts won and lost stands at +€172.1 million, comprising -€13.0 million in France and +€185.1 million abroad. In France we can note the loss of the public service delegation contracts in Aix-les-Bains, CDG-Val and Concarneau. Outside France, it is worth noting the effect of a full year of ope- rations on the Boston contract (+€118 million), the DLR contract
  • 5.
    5 1. Management Report inLondon (+€95 million) and the loss of E23 in Sweden (-€27 million). Excluding foreign exchange impact and change in reporting scope, revenue is up +€315 million / +7.4%. Organic growth within existing contracts stands at +€145.7 million +3.4%, comprising -€20.2 million for France (large networks +€11.9 million, major urban +€5.5 million, Territories -€2.3 million, Ile-de-France +€5.0 million), and +€126.5 million for international activities (+€4.8 million in the UK, +€33.7 million in Continental Europe, +€15.7 million in North America and +€72.6 million in Australia). Recurrent consolidated EBITDA stands at €227.2 million, up +€13.3 million, or +6.2%, on the previous year. The currency impact accounts for -€5.2 million. The consolidation scope effect improves recurring EBITDA by +€19.0 million, comprising +€3.7 million in France (including +€3.4 million for the acquisition of Striebig) and +€15.3 million outside France (+€4.2 million for the Belgian acquisitions, +€2.8 million for the Nettbuss tie-up in Denmark and +€8.3 million for ATE in Australia). The organic variation of EBITDA including portfolio growth stands at -€5.1M€ / -2.3%, with +€10,9 million coming from France and -€3.2 million from international activities (the growth of the UK and Continental Europe zones have not fully counter- balanced the poor results of North America, Australia and New Territories). An action plan has been established and is currently being deployed to boost North America and in particular re- establish profitability on the Boston contract. Operational costs of the holding company are -€9.2 million higher than in 2014, of which 4.3 million relates to the unwinding of diesel hedges. Recurrent operating profit stands at €56.2 million, down -€17.0 million compared to 2014. One of the reasons for this is the entry into force of a new agreement relating to payments due on reti- rement. Net income (Group share) for 2015 amounts to €12.0 million as against €13.5 million in 2014. Cash flow generation is -€183.8 million in 2015 (including -€119.9 million due to acquisitions) compared to -€74.3 million in 2014. The net debt of Keolis S.A. amounts to €223.9 million at the end of 2015 compared to €99.4 million at the end of 2014. The increase is essentially a consequence of the Group’s active external growth policy. • CONSOLIDATED FINANCIAL STATEMENTS The consolidated financial statements are prepared in accor- dance with IFRS as adopted by the European Union. Revenues from ordinary activities amount to €4,836 million. After taking into account all operating costs, operating profit after investments under the equity method amounts to €59 million. Consolidated net profit (group share) amounts to €12 million. • ANNUAL FINANCIAL STATEMENTS The financial statements of the Company are prepared in accor- dance with French GAAP. Operating profit/(loss), including share of joint ventures, was (€17,757) thousand compared with (€15,769) thousand in 2014. Financial income amounted to €40,858 thousand as against €17,181 thousand in 2014. After the posting of an exceptional loss of €890 thousand and a corporate income tax credit of €15,388 thousand, Keolis’ finan- cial statements show a net profit of €37,600 thousand. • SUBSIDIARIES AND HOLDINGS Thetableattachedtoourbalancesheetprovidesallthenecessary information concerning our company’s subsidiaries and holdings. • NOTIFICATION OF MAJOR HOLDINGS AND ACQUISITIONS OF CONTROL During the financial year 2015, Keolis S.A. acquired or took control of the following companies: Acquisition of companies in France Name Date Percentage Voyages A. Fouache 15/10/2015 100% Keolis Fouache Evasion 15/10/2015 100% Keolis Prioris 30/10/2015 34% of shares held by SIA Forcity 18/03/2015 Acquisition of a 5% share OnePark 14/10/2015 Acquisition of a 20.25% share
  • 6.
    6 1. Management Report •RESEARCH AND DEVELOPMENT ACTIVITY The company did not incur any research-related expenditure during the year. Many development activities for new products and services are, however, carried out closer to the operational managers to ensure their ability to meet market requirements. The corresponding expenses are not isolated in profit or loss and have not been specifically monitored. • FORESEEABLE TRENDS AND FUTURE OUTLOOK In France, the Group intends to consolidate its current positions and will remain attentive to any opportunities. Keolis has entered into exclusive negotiations with the Lyon public transport autho- rity for the renewal of its operating contract. The Group is also responding to invitations to tender to renew its operating contracts for networks in Dijon, Artois-Gohelle and Laval. Keolis wishes to develop its international footprint and will exa- mine all the opportunities related to the chain of mobility in the territories where it is already established and also in new countries. • SIGNIFICANT EVENTS SINCE THE END OF THE YEAR • Acquisition of Transports Daniel Meyer In January 2016, the Keolis Group announced the acquisition of a leading bus and coach service operator in Ile-de-France, Transports Daniel Meyer. With this strategic external growth transaction, Keolis reinforces its foothold in Ile-de-France and consolidates its position for future projects relating to Grand Paris Express. Keolis Ile-de-France, which generated 400 million euros of turnover in 2014, operates a fleet of 1,900 vehicles across 25 depots. Established in all of the departments comprising the Acquisition of companies abroad Name Date Percentage HORNIBROOK TRANSIT MANAGEMENT PTY LTD 27/05/2015 KEOLIS DOWNER BUS AND COACHLINES PTY LTD: 100% SOUTH WEST TRANSIT PTY LTD 27/05/2015 HORNIBROOK TRANSIT MANAGEMENT PTY LTD: 100% AUSTRALIAN TRANSIT ENTERPRISES PTY LTD 27/05/2015 HORNIBROOK TRANSIT MANAGEMENT PTY LTD: 100% HORNIBROOK BUS LINES PTY LTD 27/05/2015 KEOLIS DOWNER BUS AND COACHLINES PTY LTD: 83.33% HORNIBROOK TRANSIT MANAGEMENT PTY LTD: 16.67% PATH TRANSIT PTY LTD 27/05/2015 AUSTRALIAN TRANSIT ENTERPRISES: 100% SOUTHLINK PTY LTD 27/05/2015 AUSTRALIAN TRANSIT ENTERPRISES: 100% LINKSA PTY LTD 27/05/2015 AUSTRALIAN TRANSIT ENTERPRISES: 100% MASABI 23/10/2015 Acquisition of a 5.13% share Establishment of companies in France Name Date Percentage KEOLIS BASSIN D’ARCACHON 26/02/2015 100% Keolis S.A. KEOLIS ORLY RUNGIS 03/03/2015 100% Keolis Seine Val de Marne KEOLIS ALES 11/08/2015 100% Keolis S.A. TRANSKEO 07/10/2015 51% Keolis S.A. 49 % SNCF Participations KEOLIS BEAUNE 23/11/2015 100% Keolis S.A. KEOLIS ROISSY SERVICES AEROPORTUAIRES 01/12/2015 100% Keolis S.A. KEOLIS PORTE DE L’ISERE 02/12/2015 100% Keolis S.A. KLP02 14/12/2015 100% Keolis S.A. KLP03 14/12/2015 100% Keolis S.A. Establishment of companies abroad Name Date Percentage KEOLIS DOWNER BUS AND COACHLINES PTY LTD 10/03/2015 KEOLIS DOWNER PTY LTD: 100% KEOLIS DOWNER BUS AND COACHLINES PROPERTY PTY LTD 10/03/2015 KEOLIS DOWNER BUS AND COACHLINES PTY LTD: 100% KEOLIS AMEY METROLINK LIMITED 13/11/2015 KEOLIS (UK) LIMITED: 60% AMEY RAIL LIMITED: 40%
  • 7.
    7 1. Management Report Parisregion, its 19 subsidiaries employ 4,000 people and carry 70 million passengers each year. The group Transports Daniel Meyer has 440 employees and a fleet of 260 vehicles. It gene- rated a turnover of 40.4 million euros in 2014. Its main line of business is in the operation of approximately 50 timetabled bus lines, supplemented by school buses and school outings and charter activity. • NON-FINANCIAL INFORMATION In application of article of the Act of Parliament of 12 July 2010 on the national commitment to the environment, the so-called “Grenelle” II, Keolis S.A., as a non-listed company whose balance sheet or net revenue exceeds 100 million euros and whose average number of permanent employees during the financial year exceeds 500, is obliged to publish its non-financial data in its management report. For the benefit of readers, we publish all of this information in the chapter “Non-financial data” appended to this document. (Appendix 1) It should be noted that the consolidation scope applicable to this information has the same basis as that used for financial conso- lidation. Furthermore, four Keolis subsidiaries will publish their own non- financial data insofar as they attain the thresholds for the appli- cation of the abovementioned article 225. These subsidiaries are Keolis Bordeaux, Keolis Lille, Keolis Lyon and Keolis Rennes. € thousand FY 2015 FY 2014 Breakdown by invoice due date - Invoices due: (173) (396) ◗ from 0 to 30 days 30 203 ◗ from 31 to 60 days 186 (143) ◗ over 60 days (389) (456) Invoices not yet due 7,656 13,605 Trade payables 7,483 9,011 Amounts owing by suppliers 2,180 2,682 Supplier invoices not yet received 30,653 29,124 TOTAL 40,316 45,016 Trade payables and related accounts 35,264 37,827 Liabilities on assets and related accounts 5,052 7,189 TOTAL 40,316 45,016 • ALLOCATION OF PROFIT We propose to allocate the profit for the year, amounting to €37,599,518.44, in the following manner: Profit for the year €37,599,518.44 DISTRIBUTABLE PROFIT €37,599,518.44 Allocation: Miscellaneous reserves €37,599,518.44 Total €37,599,518.44 • INFORMATION ON SUPPLIER PAYMENT SETTLEMENT In accordance with articles L 441-6-1 and D 441-4 of the Commercial Code, we breakdown, as at the end of the last financial year, the balance of amounts owing to our suppliers by due date:
  • 8.
    8 1. Management Report Nontax deductible expenses We inform you that in the course of the past financial year, non- tax deductible expenses, within the meaning of Articles 223 quater and 223 quinquies of the General Tax Code, totalled 233K€. • SHAREHOLDINGS On 31st December 2015, GROUPE KEOLIS S.A.S. owned 100% of the capital. • EMPLOYEE SHARES IN THE CAPITAL On 31st December 2015, there were no employee shares in the Company’s capital. • AGREEMENTS COVERED BY ARTICLES L225-38 AND L225-102-1 OF THE COMMERCIAL CODE 1. Agreements covered by article L.225-38 of the Commercial Code You will be read the Statutory Auditors’ report on agreements made during the fiscal year and authorised by your Board pursuant to Article L225-38 of the Commercial Code. 2. Agreements covered by article L.225-102-1, last paragraph Pursuant to the provisions of the last paragraph of article L.225- 102-1 of the Commercial Code, we specify that during the finan- cial year no agreements were entered into other than ordinary transactions concluded at normal terms and conditions, between: ◗ a director, the Chairman CEO or the Company GROUPE KEOLIS S.A.S., a company holding more than 10% of the voting rights in Keolis S.A., And ◗ a subsidiary in which Keolis S.A. directly or indirectly holds a share in excess of 50%. • DIRECTORS AND CONTROL OF THE COMPANY 1. Mode of exercise of the General Management We report, in accordance with Article 148 of the Decree of 23rd March 1967, that your Board of Directors has opted to combine the functions of Chairman of the Board and CEO. Mr. Jean-Pierre Farandou was re-appointed Chairman and CEO during the Board of Directors’ deliberations of 3 March 2016. 2. Terms of office and functions exercised by each of the executive officers A list of the terms of office and functions exercised by each of the executive officers in 2015 is appended to this report. We hope that you will approve the above proposals and vote the resolutions to be submitted to you. THE BOARD OF DIRECTORS Financialyear Dividend Distributedincome eligibleforthe allowance Distributedincome noteligibleforthe allowance 2014 €19,130,937.70 €4.90 per share - €19,130,937.70 2013 €19,130,937.70 €4.90 per share - €19,130,937.70 2012 €19,130,937.70 €4.90 per share - €19,130,937.70 In accordance with legal requirements, you are requested to note that the amount of the dividend distributed and that of the cor- responding dividend tax credit for the three previous financial years were as follows:
  • 9.
    Appendix 1 Non-financial dataB 1• methodology 1.1 Background Keolis S.A. has voluntarily published non-financial data in the Keolis Group annual report for more than ten years. 2015 is the second financial year in which non-financial data is published in the Keolis S.A. financial report, in application of Article 225 of the Act of 12 July 2010 on the national commit- ment to the environment. The entity concerned is Keolis S.A., a non-listed company for which the balance sheet total or net revenue is in excess of 100 million euros and for which the ave- rage number of permanent employees throughout the financial year exceeds 500. In 2014, the set of indicators was revised and the reliability of the scope improved. 2014 can therefore be considered as the year of reference (year 0). This publication thus includes data for the past two years: 2014 and 2015. The references indicated at the beginning of each paragraph refer to the articles of the Implementation Decree followed for the purposes of this publication. 1.2 Scope Non-financial data is consolidated on the same scope as finan- cial data (excluding EFFIA S.A., Technical Assistance and sub- sidiaries for which Keolis is not the majority shareholder). The scope of consolidation for employee data is the calendar year, from 1 January to 31 December. Generally, social data relates to all Group staff. This scope varies by indicator, and depends on the availability of data at the time of this report being approved for print. The scope for company data also covers 100% of Group staff. The reference period for environmental data is the calendar year, from 1 January to 31 December. If this is not the case, rules for estimation or consolidation on a deferred timescale are pro- posed to subsidiaries in the set of indicators. Environmental data has been calculated from data covering 82% of Group staff (represented by 48 subsidiaries and 42 lower-tier subsidiaries). This scope may also vary depending on the availability of data at the time of this report being approved for print. 1.3 Quantitative information We have added new qualitative data indicated in italics in the list below. The data for some of these items is only available for 2015. Some items of data published last year have been adjusted to account for corrections/additions supplied after the publication of last year’s report. These are indicated by an asterisk appended to the updated figure. In view of the current collection process, data that is not available for this publication will be communicated next year. Social responsibility / human resources Workforce: workforce registered as at 31 December in all Group subsidiaries and Keolis S.A. Breakdownofworkforcebygeographicalzone:breakdown by country of workforce registered as at 31 December. Breakdown of workforce by age bracket: breakdown of total Group and Keolis S.A. workforces by age bracket. The comprehensive 2014 data supplied refers to the total Group workforce, including Keolis S.A. and excluding Docklands Light Railway (UK), and Keolis Deutschland (36 employees in Germany). 9 1. Management Report Keolis, a leading public transport operator, plays its part in sustainable development through a wide range of cor- porate initiatives. The different aspects of this Social Responsibility are shared between the relevant departments- Health Safety Environment, Legal, Human Resources, Purchasing and Communications. The Health, Safety and Environment department is responsible for coordinating Social Responsibility. Social Responsibility is an item on the agenda of Keolis’ Executive Committee at least once a month in order to review work undertaken, approve new initiatives and select the topics to be highlighted. In addition to this, Keolis draws on discussions with its internal and external stakeholders to define the strategy and recommendations for the entire Group.
  • 10.
    Percentage of womenin the total workforce: percentage of women in the total workforce of the Group and Keolis S.A. The comprehensive 2014 data supplied refers to the total Group workforce, including Keolis S.A. and excluding Docklands Light Railway (UK), China (2 employees) and the United Arab Emirates (7 employees). Total number of new employees: the cumulative number of new employees in France for the year, (including the integration of new subsidiaries), regardless of type of employment contract. Total number of departures: the cumulative number of depar- tures in France for the year, regardless of the reason for leaving (excluding expired fixed-term contracts but including the loss of subsidiaries during the year). Total number of dismissals: refers to cumulative number of departures in France during the year relating to dismissals. Payroll: Group personnel expenditure, including wages and social charges, duties and taxes on remuneration and other personnel expenses (ancillary costs, directors’ fees, employee profit sharing, temporary staff and staff on secondment). Change in payroll: change in payroll between years N and N-1 in gross value and expressed as a percentage. Percentage of part-time employees: percentage of employees with a part-time contract in the total workforce in France as at 31 December. Percentage of drivers: percentage of driver employees in the total Group workforce as at 31 December. Rate of absence for sick leave: measures the rate of sick leave, in France. Workplace accident frequency rate: measures the frequency of workplace accidents declared per quarter leading to at least one day of leave. This rate represents the average number of workplace accidents leading to leave by a group of employees having worked one million hours over the period considered. Data available for this publication for France. NB: This rate includes violent behaviour. It does not take into account all ongoing dispute procedures. Severity rate of workplace accidents: measures the severity of accidents by assessing the total number of leave days due to workplace accidents, excluding the day of the accident itself. This represents the number of days compensated for 1,000 hours worked, in other words the number of days lost due to temporary invalidity for 1,000 hours worked. Data available for France. Total number of training hours: the 2015 data relates to all of the employees in the Group. Complete data for 2014 is only available for France. Number of employees having received training: 2015 data relates to all of the employees in the Group. Complete data for 2014 is only available for France. Total number of workers with a disability (number of units): relates to the number of entitlement units calculated as part of the mandatory annual declaration of the employment of workers with a disability submitted to the Agefiph (DOETH) in France. This entitlement unit is the full-time equivalent of a wor- ker with a disability. Environment Environmental data concerns consolidated operational subsi- diaries and not the entity Keolis S.A., which has an administrative function and does not operate passenger transport. Number of employees covered by an ISO 14001 certifica- tion: relates to employees registered in the workforce at 31 December exercising an ISO 14001 certified activity. Percentage of employees covered by an ISO 14001 certi- fication: relates to the number of employees exercising an ISO 14001 certified activity as a proportion of the total Group work- force. Total quantity of hazardous waste: this measures the total weight of hazardous waste produced over the year in question, regardless of the type of processing. Hazardous waste is waste defined as such in the regulations applicable to the production site. Total quantity of non-hazardous waste: this measures the total weight of non-hazardous waste produced over the year in question, regardless of the type of processing. Non-hazardous waste is waste defined as such in the regulations applicable to the production site. Percentage of recovered hazardous waste: this measures the percentage of non-hazardous waste recovered over the year in question, regardless of the type of processing, in 24 subsidia- ries (accounting for 44% of total Group workforce). Recovery is a type of waste processing operation defined as such in the regulations applicable to the production site. Percentage of recovered non-hazardous waste: this mea- sures the percentage of non-hazardous waste recovered over the year in question, regardless of the type of processing, in 32 subsidiaries (accounting for 60% of total Group workforce). Recovery is a type of waste processing activity defined as such in the regulations applicable to the production site. 10 1. Management Report
  • 11.
    Total water consumptionof the sites: this corresponds to the volume of drinking water purchased by the subsidiary over the period in question, charged to buildings and processes, excluding watering of planted areas. Share of water consumption in water-shortage areas (per country): this corresponds to the consumption of drinking water in Keolis countries where water stress is very high (between 40 and 80%) or extremely high (over 80%). In 2015, these countries were Australia and Belgium (according to the World Resources Institute). Traction energy consumption for commercial vehicle fleets (in TOE, excluding rail): traction energy consumption for commercial vehicle fleets corresponds to the quantity of energy purchased within the framework of commercial services (dead mileage included). The vehicles concerned are those operated/owned by the company used for commercial services, on behalf of others (passengers, Public Transport Authorities, other transport providers, corporate customers). The indicator incorporates all means of transport (bus, coach, metro, tram, trolleybus). Traction energy consumption for commercial railway use (in TOE): traction energy consumption for commercial railway use corresponds to the quantity of energy purchased within the framework of commercial services provided by rail (electrical or thermal traction), dead mileage included. Energy consumption of company facilities (in TOE): energy consumption of the sites corresponds to the quantity of energy consumed or purchased on the sites, excluding traction energy. CO2 emissions from commercial transport and company facilities (in TCO2 e): Greenhouse Gases emitted by the cor- responding use of energy. 1.4 Qualitative information Qualitative information does not require any particular explana- tions. 11 1. Management Report
  • 12.
    2 • Socialdata 2.1 Employment Article code Subject of decree 2015 data 2014 data Indicator I-1-a-1 – total workforce and breakdown of employees by gender, age and geographical location 54,749 including 1,468 Keolis S.A. 53,434* including 1,414 Keolis S.A. Number of employees registered as at 31 December 32,630 incl. 1,468 6,107 4,038 3,879 2,468 1,482 1,250 1,133 819 432 391 108 8 4 France Keolis S.A. Sweden Australia United States Belgium Denmark Netherlands UK Canada Germany India Norway China United Arab Emirates 32,759* including 1,414 6,802 3,721* 2,395 2,309 1,440 1,292 1,035* 843 403 326 100 7 2 France Keolis S.A. Sweden United States Belgium Australia Denmark Netherlands UK Canada Germany India Norway China United Arab Emirates Total number of employees per country Group 1,701 (3%) 3,930 (7%) 5,367 (10%) 6,013 (11%) 7,512 (14%) 8,395 (15%) 9,075 (17%) 7,941 (15%) 3,294 (6%) 1,485 (3%) Keolis S.A. 79 (5%) 202 (14%) 239 (16%) 211 (14%) 249 (17%) 185 (13%) 151 (10%) 116 (8%) 32 (2%) 4 (0%) or = 25 years 26 to 30 years 31 to 35 years 36 to 40 years 41 to 45 years 46 to 50 years 51 to 55 years 56 to 60 years 61 to 65 years Over 65 years Group 1,701 (3%) 3,930 (7%) 5,367 (10%) 6,013 (11%) 7,512 (14%) 8,395 (15%) 9,075 (17%) 7,941 (15%) 3,294 (6%) 1,485 (3%) Keolis S.A. 79 (5%) 202 (14%) 239 (16%) 211 (14%) 249 (17%) 185 (13%) 151 (10%) 116 (8%) 32 (2%) 4 (0%) or = 25 years 26 to 30 years 31 to 35 years 36 to 40 years 41 to 45 years 46 to 50 years 51 to 55 years 56 to 60 years 61 to 65 years Over 65 years Number of employees per age bracket 20.1% Keolis S.A.: 40% 20.4%* Keolis S.A.: 40.2% % of women in the total workforce I-1-a-2 – new hires and dismissals 6,318 of which Keolis S.A.: 269 5,552* of which Keolis S.A.: 303 Total number of new employees 2,910 of which Keolis S.A.: 172 2,490* of which Keolis S.A.: 147* Total number of departures, excluding expiring fixed-term contracts 756 of which Keolis S.A.: 38 661* of which Keolis S.A.: 47* Total number of dismissals I-1-a-3 – remuneration and its variation 2,820.6 2,458.8* Payroll in € million +14.7% +9.8%* % of change in payroll 361.8 219.5* Change in payroll in € million 12 1. Management Report
  • 13.
    2.2 Organisation ofwork Absenteeism is an issue monitored locally by each Keolis Group subsidiary. In addition to local action plans, Keolis Group has defined, via its corporate project, joint areas for progress in order to permanently control the rate of absence and ensure the well- being of employees. Time has been spent better defining the roles and responsibilities of local managers and developing their skills. The regular monitoring of absence has also become one of their tasks. 2.3 Social relations - Organisation of social dialogue, particularly staff information, consultation procedures and negotiations (article I-1- c-1) Each Group subsidiary, regardless of the country where it is active, has employee representative bodies in accordance with local legislation. However, the structure, prerogatives and obligations of these bodies vary greatly from one country to the next, depending on locally applicable legislation. In France, the management of each subsidiary chairs these representative bodies and can negotiate company-wide agreements with the subsidiary’s trade union delegates. All subsidiaries in France with over 50 employees have a works council and committees for health, safety and working conditions (CHSCT). The employee relations department of Keolis Group ensures that all subsidiaries have the necessary tools for their representative bodies to operate in optimal conditions. It regularly contributes to subjects that may have an impact on the road transport sector and provides updates on the legal situation via a two-monthly employee newsletter. In 2015, the following were supplied to Group subsidiaries: ◗ Legal memos relating firstly to the transfer of staff following the win or loss of an interurban transport contract, and secondly to industrial action in urban transport, ◗ A “career interview” kit to facilitate the introduction of this new interview in subsidiaries, ◗ Employment contract templates. In addition to this legal information, a new vocational training management solution, Sage Formation, is currently being deployed in subsidiaries. This new tool will enable better monitoring of training followed by Group employees and career interviews conduc- ted. Finally, a Group procedure memo relating to checking driving licences was sent out to all subsidiaries to ensure that all Group employees tasked with driving have a valid driving licence. • Review of collective agreements (article I-1-c-2) The Keolis Group has an agreement concerning how the European Works Council should function. Keolis Group subsidiaries have come to their own agreements at local level. In addition to these agreements, Keolis has implemented numerous unilateral decisions to ensure that a minimum set of measures applies to certain fundamental issues. Article code Subject of decree 2015 data 2014 data Indicator I-1-b-1 – organisation of working time 16.65% Keolis S.A.: 3.15% 16.73%* Keolis S.A.: 3.09%* Percentage of part-time employees 67.5% Keolis S.A.:0% 68.5%* Keolis S.A.: 0% Percentage of driver employees II-1-b-1 – rate of absence 5.86% Keolis S.A.: 1.39% 5.63% Keolis S.A.: 1.23%* Rate of absence for sick leave 13 1. Management Report
  • 14.
    2.4 Health andsafety - Health and safety at work (article I-1-d-1) Following the 2014 launch of the Group’s safety approach as an essential workstream in the corporate programme, all specialist job areas and in particular those of operations and maintenance are clearly concerned. The vast majority of subsidiaries in France and abroad have reached level 2, qualified as ‘common practice’ on the Group’s scale of maturity. This level guarantees basic compliance of safety management relating to employees and stakeholders, in particular our partners and subcontractors. Training in roles and duties was extended to more than 400 managers, notably working in the operation and maintenance fields. A safety and environment prevention guide was also distributed to more than 20,000 employees. This will be extended to interna- tional activities in 2016. The use of the Knowledge Management tool Keoshare by the safety and environment community enabled the exchange of best practices and the passing down of recommendations. Internal audits have revealed that continuous improvement is ongoing. - Reviewofagreementsconcludedwithtradeunionorganisationsorstaffrepresentativeorganisationsintermsofhealth and safety at work (article I-1-d-2) As previously stated concerning collective agreements, the Keolis Group has an agreement as to how the European Works Council should function. Keolis Group subsidiaries have come to their own agreements at a local level. In addition to these agreements, Keolis made a number of unilateral decisions to ensure that a minimum set of measures in relation to fundamental issues. 2.5 Training - Policies implemented in terms of training (article I-1-e-1) Keolis Group considers training as a tool to benefit its employees’ development at every stage of their career path. Keolis commits to developing the skills of each employee according to their area of expertise in order to foster their career deve- lopment, facilitate internal mobility and master key skills for the Group’s growth. Training has therefore been designed according to a logical career path. To this effect Keolis developed the training path ‘D’FI’ in 2015 aimed at subsidiary directors who have just arrived in their position. This programme is spread over a year and alternates between sessions focusing on developing leadership skills and sessions to improve specialist knowledge. The programme is designed and delivered by in-house specialists and external trainers and coaches, with, as a common thread, the creation of a project presented to the France Division at the end of the programme. Keolis also devised a programme tailored for the Tram Maintenance community comprising initial training but also ongoing courses in the areas of rolling stock and infrastructure. In 2015, approximately fifty people followed the course, which will be further deployed in 2016. Keolis continued to develop its courses for young managers in 2015. These courses include practical training on transport and time spent in the subsidiaries to give them the opportunity to become familiar with the professions and activities covered by the company. In 2015, 26 people took this course in the areas of operations, marketing and maintenance, up 36% on the previous year. Since 2015, these incubators are open to in-house applicants from our operational work areas, which facilitates the career mobility of our supervisors. With the launch of the Group Training Department in 2015, Keolis intends to accelerate the reinforcement of the company culture, the development of a common base of expertise in all Group countries and the support provided to the Group in setting up in new Article code Subject of decree 2015 data 2014 data Indicator II-1-d-1 – workplace accidents, notably their frequency and severity, and occupational illness 46.09 including Keolis S.A.: 2.16 52.69* including Keolis S.A.: 0.90* Workplace accident frequency rate 3.92 including Keolis S.A.: 0.03 3.86* including Keolis S.A.: 0.01* Severity rate of workplace accidents 14 1. Management Report
  • 15.
    markets. In 2015,Keolis redesigned the employee induction programme, ‘Welkome’, to better respond to the expectations of all new Group managers. Finally, the Keolis Group actively supports basic training in the transport field. In acknowledgement of its long-standing commitment, Olga Damiron, the Group’s former HR Director, was selected to be the sponsor of the 2015 class graduating in the Master’s Degree of Regional and Urban Passenger Transport (TURP) at Lyon 2 Lumière University. The aim of this degree is to train managers in managing the various facets of local mobility. This course is jointly certified by the National Public Works School, ENTPE. Keolis furthermore became a member in 2015 of the ‘Club des Partenaires’, created under the Chairmanship of Olivier Marembaud (SNCF). This club brings together companies that wish to support the education of urban transport managers and specialists in Africa through the provision of grants and the accommodation of interns. Keolis consequently provided financial assistance to students taking the Master’s course in ‘Transport and mobility in African cities’ and will shortly be accommodating a student from Togo within its Lyon subsidiary for a 6-month work placement. 2.6 Equality - Measures implemented in favour of gender equality (article I-1-f-1) For several years, the Keolis Group has led an ambitious professional gender equality strategy, the objective being to increase mix and ensure equality between employees. This strategy is supported by Keolis’ general management team and is at the centre of the company’s human resources policy, in the form of three main projects: First, Keolis makes sure that professional equality is included in organisational and human resource processes. In 2015, the Group received four gender equality certificates for its French subsidiaries Keolis Oise, Keolis Artois Gohelle, Keolis Rennes and Keolis Mobilité. It also launched an international workplace gender equality project with the participation of subsidiaries in the USA, Australia, the UK and northern Europe. The primary aim of this initiative is to promote the sharing of best practice between subsidiaries, such as the “Driven Women” campaign by the Australian subsidiary KDR Victoria. This communication campaign aimed at women led the organisation to record a 38% increase in female employees, resulting in an award from the Melbourne city council. The second aim of Keolis’ general equality policy is to pool the efforts of several subsidiaries to carry out far-reaching actions. For example, fifteen Keolis subsidiaries in France came together in 2015 to organise the Girls’ day, a day spent informing young female students about career opportunities in our Group before they made their higher education applications. KCS Boston also committed to run a similar initiative and consequently identified and trained women ambassadors from each department in the firm. Secondly, Keolis set up an internal network, Keolis Pluriel, which allows male and female employees, regardless of their professio- nal sector, to take part in promoting workplace equality. In 2015 Keolis Pluriel worked on the following topic: ‘Winning over and retaining female passengers’. The aim of the working group was to understand the expectations and needs of female passengers so as to design services for all. A trend book collating all the group’s recommendations and suggestions for services was presented to Keolis’ top management team. In parallel, Keolis became involved for the fourth year running, alongside the Alliance for Gender Mix in the Firm (AME), in the organisation of the Gender Mix in the Firm network summit, held in Lyon in October. Keolis Pluriel also took part in sporting events such as the ‘La Parisienne’ run, and organised workshops and talks aimed at employees on subjects relating to gender equality (including work-life balance, stereotyping and female leadership). Keolis Pluriel increased its membership by 40 in 2015, including 20 men. Thirdly, Keolis is committed to spreading its equality approach throughout the Group, operational departments and beyond. Keolis ensures that its subsidiaries share Group values and accompanies them to guarantee equality between all employees, wherever they are. The company also promotes equality and diversity among its external stakeholders through transport-specific media. For example, Autocars Planche publicised the success factors of its equality action plan as part of the Lyon TV channel TLM’s series of reports entitled ‘Embarquez’. An article on Keolis’ female outreach programme was published in the International Association of Public Transport’s (UITP) magazine. Finally, Keolis also discussed its approach at an international conference on gender equality and safety, organised by the European Bank for Reconstruction and Development in Almaty, Kazakhstan. Article code Subject of decree 2015 data 2014 data Indicator I-1-e-2 – total number of training hours 1,239,811 of which Keolis S.A.: 40,513 681,775* of which Keolis S.A.: 37,769 Total number of hours of training 40,461 of which Keolis S.A.: 992 26,043 of which Keolis S.A.: 1,002 Number of employees having received training 15 1. Management Report
  • 16.
    - Measures implemented infavour of employing people with a disability (article I-1-f-2) Keolis ensures that all of its operational subsidiaries fulfil their legal obligations in relation to disability as required by local legislation, and undertake proactive awareness-raising and social inclusion actions to fight against all forms of discrimination and exclusion. In 2015, KDR Gold Coast signed a partnership with the ‘Special Olympics’ to introduce a programme to welcome people with Down syndrome or with intellectual or developmental problems. The first participant in this programme was welcomed by the subsidiary in November 2015 for one day per week for ten weeks. He was tasked with assisting administrative employees. This programme has the dual goal of raising awareness among the workforce about mental illness and enabling the “Special Olympics” participants to take their first steps into the professional work environment. In parallel, Keolis S.A. and EFFIA Synergies started developing their disability policy, basing it on an audit which took place in the second half of the year. The two entities also raised employee awareness about the issue of purchasing from the sheltered work sector through a day jointly coordinated with the charity Handeco. The French Paralysis Association, SNCF and Keolis Mobility were also in attendance to promote the benefits of using this type of organisation. This initiative took place alongside a photo exhi- bition about disability at work, produced by IMS Entreprendre pour la Cité. Finally, through its ‘Actions for Solidarity’ programme (Coups de Coeur Solidaires) the Group rewards its employees’ involvement in charitable work. In 2015 several prizes were awarded to charities working to promote awareness of disability and accessibility issues. One key example is the charity Handi Cheval which offers people with disability or adjustment problems the chance to take part in equestrian activities. As a transport operator, Keolis also plays a major role in terms of mobility solutions for those with disabilities. The Keolis Group is the leading carrier of passengers with reduced mobility (PRM) in France. - Anti-discrimination policy (article I-1-f-3) Keolis has been a signatory of the Diversity Charter since 2006 and has been a partner of AFMD (Association Française des Managers de la Diversité) since 2014. By signing this charter the Group has committed to promoting the employment of young people, seniors with experience or those changing career path, job-seekers, disabled workers and people of different nationalities and cultural backgrounds. For several years, Keolis has developed essential partnerships with organisations such as Cap Emploi, Pôle Emploi and local missions to help people who face difficulties when entering the workforce. With the aim of offering new opportunities to people over the age of 50 and to people in career transition, Keolis works with regional units specialised in career transition services, the ministry of Defence or the French national police. In 2015, the Keolis Group launched a general anti-discrimination policy based on a collaborative network and entitled ‘Diversity Inclusion’. Keolis has established a diversity programme for all of its subsidiaries. This programme is part of the career path for each employee as soon as they join the Group – via an awareness-building module during the induction course – then at each succes- sive stage of their career. Finally, Keolis builds strong partnerships with specialist researchers in the field of diversity to enhance its underlying thinking and establish its diversity and inclusion strategy. For example Keolis partnered with Bordeaux University to work on a project entitled ‘Young people, employment and discrimination’. Keolis also plays a part in several conferences relating to diversity management. 2.7 Promotion of and adherence to clauses in key agreements of the International Labour Organisation - Eliminate discrimination in terms of employment and profession (article II-1-g-2) In 2015 Keolis brought together a large number of people from France and abroad to write a charter setting out its commitments to Diversity and Inclusion. These commitments relate to the following: ◗ Compliance with the employment law of the countries in which Keolis is established and with international standards in relation to Human Rights and fundamental liberties, anti-discrimination, anti-harassment and the promotion of career equality. ◗ The creation of an equitable and inclusive work environment where each person feels recognised for their skills, commitment and level of performance. Article code Subject of decree 2015 data 2014 data Indicator I-1-f-2 – measures implemented in favour of employing disabled people 1,341.07 including Keolis S.A.: 3.77 1,451.5* including Keolis S.A.:3.17*. Total number of workers with a disability (in units) 16 1. Management Report
  • 17.
    ◗ Respect for eachindividual, their identity and culture within the limitations imposed by health and safety requirements and internal regulations. ◗ The adoption of an open and empathetic approach to each person to understand their individual needs and expectations. ◗ The promotion of diversity and job equality with our stakeholders. Keolis Group works actively against all forms of discrimination in employment based on the following principles: ◗ Priority is given to dialogue. ◗ The Group aims to train managers and all HR staff in legal matters relating to discrimination depending on local situations. ◗ Keolis Group commits to raising the awareness of managers and employees about diversity issues. ◗ Keolis encourages its managers to remain objective when faced with problems in the organisation related to diversity issues. ◗ Any problems are settled on a case-by-case basis and may lead to disciplinary action if behaviour does not comply with the values and integration policies supported by the Group. - Eliminate forced or compulsory labour (article II-1-g-3) - Abolish child labour (article II-1-g-4) Since 2004, Keolis Group has been a signatory of the United Nations’ Global Compact to promote and adhere to 10 principles grouped into four categories, including Human Rights, international employment standards and anti-corruption. 3 • Information relating to corporate commitments in favour of sustainable development 3.1 Territorial, economic and social impact of the company’s activities - in terms of employment and regional development (article I-3-a-1) - concerning neighbouring or local populations (article I-3-a-2) Keolis has integrated an ‘Actor within the community’ project into its corporate programme. Its aim is to standardise practices by allowing each subsidiary to build its own binding and reasoned partnership strategy. The main guidelines of these strategies are shared by the Group and its subsidiaries: be consistent with the ‘Konformité’ programme, allow each subsidiary to build its own approach and allow the Group to promote (internally and externally) the subsidiaries’ partnership actions. 3.2 Relations with people or organisations with an interest in the company’s activities, in particular associations which promote inclusion, teaching establishments, environmental protection associations, consumer associations and neighbouring populations - Conditions of dialogue with these people or organisations (article I-3-b-1) In October 2015, for the fifth successive year, Keolis brought together its external stakeholders, consisting of representatives of associations, the French government and specialist companies. The aim was to obtain feedback from these stakeholders about our activities, our position and our corporate programme. Members of the Executive Committee were also involved. Dialogue was very productive, particularly in relation to the provision of transport services to rural areas and responsible purchasing policies. Within the framework of this ‘Dialogue with external stakeholders’, Keolis also provides its subsidiaries with tools and methods to allow them to enter into and/or organise dialogue with their own stakeholders. They are thus provided with a mapping model and prioritisation criteria to be used depending on the challenges and the goal of the dialogue entered into. The subsidiaries also have a model of the rules to be applied. - Sponsorship or charitable actions (article I-3-b-2) Sponsorship and corporate giving fall under the guidelines of two specific projects in the Group corporate programme: ‘Fairness of practices’ and ‘Actor within the community’. Since 2010, Keolis has been attributing annual awards as part of ‘Actions for solidarity’ ‘(Coups de coeur solidaires). The aim of this activity is to encourage personal and voluntary commitment from Group employees to an association which acts in favour of soli- 17 1. Management Report
  • 18.
    darity between neighbourhoodsto encourage diversity, or which helps promote the inclusion of vulnerable people or those in diffi- culty. Applications are assessed by a panel made up of representatives of Keolis’ top management in France and employee representa- tives. The relevance and eligibility of submissions are assessed according to the following criteria: the target audience, social and partnership dimensions, viability and originality, creation of social ties. Three winners are awarded a grant, which is directly paid to the associations they represent. The judging panel distinguished three charities for its 2015 edition. The first prize was awarded to the association Les Chérubinots which works to raise funds for a joëlette: a special chair which enables people with disabilities to take part in hiking activities. This charity was nominated by an employee from Keolis Bordeaux. The second prize went to the association Benecontre Phalempins, nominated by our Lille subsidiary. This charity promotes social cohesion between people living in the same neighbourhood, parti- cularly people living on their own and the elderly. The third prize went to the charity HANDI Cheval Mayenne which works in aid of children with physical or motor disabilities. This charity was nominated by an employee from Keolis Laval. 3.3 Sub-contractors and suppliers - Consideration of social and environmental issues in procurement policy (article I-3-c-1) The Purchasing Charter, approved by the Group Executive Committee, defines the general principles of purchasing within the Group and sets out rules regarding ethics and behaviour applicable to all internal and external actors involved in the purchasing process. All employees acting on behalf of the Group or one of its subsidiaries must be familiar with, comply with and promote its principles in the interests of fairness and transparency. In compliance with the Group’s CSR commitments, all employees involved in purchasing must promote sustainable development with their business partners. All employees involved in a purchasing process must therefore pass on these concerns to their own suppliers and sub-contractors, encourage suppliers to develop a social and environmental progress plan, and ensure compliance with national laws, regulations and international agreements concerning the protection of individuals (employees, sub-contractors, product or service users) and the environment. In 2015, the Purchasing Department enhanced its Purchasing Policy with three new workstreams to strengthen the Sustainable and Supportive Purchasing approach: ◗ The first workstream relates to the supportive economy and local patronage, promoting supportive purchasing approach by increasing the use of sheltered work organisations as suppliers, contributing to the local economic community and reaffirming a local presence. ◗ The second workstream deals with environmental and safety issues by factoring into the procurement process (in particular through supplier selection questionnaires, performance requirements, selection criteria and contracts) Keolis’ environmental policy, risks relating to the safety of people and goods, and the protection of our data and know-how. ◗ The third and final workstream relates to supplier relations by generalising the total cost approach, ensuring transparency and equality of treatment of suppliers by reducing the risk of reciprocal dependence and of monopoly. Over the past few years, Keolis has developed a range of initiatives to this effect: ◗ The Group framework agreement for electricity supply includes an option allowing each subsidiary to subscribe on demand to power from renewable energy sources. ◗ The framework agreement for waste electrical and electronic equipment (WEEE) combines environmental concerns and suppor- tive action as it is concluded with a sheltered work organisation. ◗ The listing of a ‘green’ range of cleaning products, an organic part degreasing washer, printers with Imprim’Vert certification or from the sheltered work sector. ◗ Various clauses specific to waste processing and environmental protection are written into framework agreements about sensitive products (notably batteries, tyres and lubricants). Product selection takes into account any awards or certification gained. Some types of Purchasing are currently carried out at a local level following the recommendations of the Group Purchasing Department. These purchasing items are of significant importance in the expenditure of subsidiaries and require local contact with suppliers. The main categories of local purchases are: ◗ Vehicle and premises cleaning ◗ Security ◗ Vehicle charter services (subcontracting) 18 1. Management Report
  • 19.
    ◗ Gardening services ◗Maintenance of some facilities and infrastructure. Two purchasing guides, KeoClean and Keo’Guard, have thus been created to assist subsidiaries with their procurement of cleaning and security services. These two guides include recommendations relating to social responsibility. - Importance of sub-contracting and consideration of social and environmental responsibility in relation to suppliers and sub-contractors (article II-3-c-1) Keolis also includes in its supplier selection questionnaire or in its performance requirements a certain number of questions related to Environment and Safety. These questions are tailored to the purchasing segment concerned. Proposals are analysed by assessing total cost. Depending on the purchasing category and the issues at stake, some assessment grids include evaluation criteria relating to environmental and/or social aspects. This is the case for example in the procurement of rolling stock, printers, work clothing and batteries. 3.4 Fairness of practices - Actions undertaken to prevent corruption (article II-3-d-1) The Group’s growth ambitions in France increase commercial competition and therefore the exposure of managers and Keolis entities to the risks of competition, fraud and corruption. To minimise the risk of manager implication, and prevent financial and legal risks while continuing to develop in accordance with business ethics, Keolis integrated the Konformité programme into its corporate programme in the form of the ‘Fairness of practices’ project. This covers three areas relating to all subsidiaries: strict compliance with free and fair competition, prevention of corruption and fraud, and the protection of personal data. In 2015 the Group decided to focus on the area of anti-corruption. The Group President addressed a message to all of the Group’s managers reminding them of the principles of the Konformité programme which should be exemplary in nature and act as a means to reduce corruption-related risks: legal, financial and repu- tational risks. This approach also provides a response to increasingly-expressed demands from clients but also from all our stake- holders and our employees. All of the managers in the Group are invited to help to promote the programme, support its implementation, monitor it regularly and raise their teams’ awareness of it. The main manuals provided to Group managerial staff are: ◗ The Guide for Ethical Business Conduct ◗ The brochure ‘Konformité at a Glance’, ◗ The practical guide ‘The Right Attitudes to prevent corruption’. In addition, three areas have specific Group procedures applied to them which managers are responsible for following, with the possibility of adjustments outside France where necessary, to comply with local law if it is stricter. These directives cover the three following subjects: ◗ Gifts and hospitality, ◗ Sponsorship and corporate giving, ◗ Donations and relations with business partners. As part of this approach, the guide ‘Relations with Business Partners’ was widely distributed during summer 2015. It reminds readers that the ethical standards of business conduct must be adhered to by all of the Group’s entities and their employees, but also shared with the business partners they work with. The Group expects these partners, be they consultants, providers of intel- lectual services or partners in joint ventures or consortia, to work with integrity and abide by all laws and regulations in force. Employees that incur the Group’s liability through working relationships with business partners must observe the principles laid down by this guide and communicate them to their partners. Vigilance must be exercised in three key phases of relations with partners: the selection phase, the contract conclusion phase and the contract implementation and monitoring phase. The guide is supplemented by a procedure for use only by Group employees. 19 1. Management Report
  • 20.
    Awareness and traininginitiatives continued in 2015. ◗ A module on ‘Governance and Business Ethics’ was introduced into the new employee induction course. A more developed version of the module was inserted into the new training programme for subsidiary directors and will be delivered face-to-face from February 2016. ◗ In the area of awareness development, a ‘Konformité’ breakfast was held during the June 2015 Keolife Week and was reported on by a series of Group communications tools. ◗ A talk was given at head office by the Chairman of Ethic Intelligence in October 2015 on the theme of conducting preliminary specific anti-corruption audits before mergers and acquisitions. Finally, initiatives were conducted to reinforce management commitment to the deployment and effective application of Group procedures. The International zones each appointed correspondents and formulated their road map for 2016. - Measures taken in favour of consumers’ health and safety (article II-3-d-2) Within the framework of Keolis Group’s activities, consumer safety means the safe operation of passenger transport services. The security of services means prevention and measures taken with regard to external attacks and violent behaviour. In passenger rail and metro activities, there were no passenger victims to report (excluding suicides). In the field of buses, coaches and trams, pedestrians and passengers are more affected and continue to be more exposed. Our actions remain focused on improving risk prevention concerning both our passengers (risks that we can manage) and our employees. In 2015, various Group subsidiaries developed actions to improve the safety of operations. Several subsidiaries organised safety events aimed at passengers and the general public (Rennes, Lyon, Courriers d’Ile-de-France). The corporate project focus week entitled “KeoLife Week” was an opportunity to raise passenger awareness of the risks prevalent in public transport. A campaign entitled ‘Rhino’ was deployed in a number of cities (in particular Brest and Caen) with the goal of passing on safety messages to public transport customers and the broader public. In partnership with the French Road Safety Association, a survey was conducted in the second half of 2015 relating to the wearing of seatbelts in coaches. This coincided with the implementation on 1 September 2015 of a new law mandating the wearing of seatbelts in coaches, and also offered insight into passenger behaviour. The findings of the survey will be published in the first half of 2016. Another initiative was to test an assistance mechanism aimed at coach and bus drivers called ‘Bird View’, giving them an overhead view of their vehicle and enabling them to identify any type of risk to pedestrians or passengers. This test provided insight into driver behaviour when at a stop or when moving away from one. Keolis’ contribution to ensuring the security of its networks came in the form of tackling fare evasion and antisocial behaviour through the following actions: reinforced patrols by inspection teams, the increase in video surveillance (90% of vehicles in France are now fitted with surveillance equipment), internal communication campaigns, the intervention of liaison officers to resolve any conflicts, the increase of its participation in community outreach offices (PIMM’S) and the maintenance of close relations with law enforcement bodies and the public prosecutor. In 2015, several networks equipped their inspectors with personal safety cameras in the stated aim of protecting them from anti- social and violent behaviour. This deployment will continue throughout 2016. 20 1. Management Report
  • 21.
    4 • Environmentalinformation 4.1 General policy on environmental matters Keolis offers solutions to build sustainable mobility such as promoting the growth of new forms of mobility, making our expertise available to Public Transport Authorities or improving the environmental performance of public transport. The Group’s Environment approach is mainly based on feedback from its subsidiaries and on an environment management system. The Group Environment policy mentions the commitments and targets all of its activities (operations, maintenance, business, administration). This policy applies to all Group subsidiaries and is part of its corporate project. The Group Environment approach has been certified ISO 14001 since 2014. Initially, this certification applied to ten subsidiaries. In 2015, four new subsidiaries were added to the certification including Keolis Commuter Services in Boston. This joint certification has prompted proactive commitment to three issues: ◗ continuing to optimise our energy consumption, ◗ improving waste management, ◗ minimising drinking water consumption for industrial activities. Article code Subject of decree 2015 data 2014 data Indicator I-2-a-1 – organisation of the company to take environmental issues into account and, where applicable, assessment or certification programmes in terms of the environment 14,551 9,431* Number of employees covered by ISO 14001 certification 26.6% 17.6%* Percentage of employees covered by ISO 14001 certification The sum of provisions and guarantees for risks to the environment is not relevant data in view of the Group’s activities, as they do not pose a major environmental threat. - Actions taken to train and inform employees in terms of environmental protection (article I-2-a-2) Training is developed in partnership with the Keolis Training Institute. Various training modules have been added to the Keolis training catalogue to meet Group subsidiaries’ specific needs in terms of the environment. Environmental issues are also incorporated into the compulsory training course for Group drivers and the induction course for all new Keolis S.A. recruits. Different internal communication channels exist to promote environmental approaches: France and International newsletters, KeoAwards. In 2014, the first prize in the CSR category was awarded to Keolis Lille for substituting products used for maintenance with products that are less harmful to the environment and health at work. 21 1. Management Report
  • 22.
    - Consideration of noisepollution and any other form of pollution specific to an activity (article I-2-b-3) In light of the three specific objectives of the Group environment policy, noise pollution is not a significant environmental issue for the Group. In accordance with our general commitments, this subject is handled locally depending on any complaints received and/or the regulations that apply on the sites concerned. 4.3 Sustainable use of resources - Water consumption and water supply depending on local factors (article I-2-c-1) Water consumption is an important environmental issue for the Keolis Group. Because of this, minimising consumption of drinking water for our industrial activities is one of the three specific objectives of our Environment policy. Locally, Group subsidiaries use drinking water as well as recycled and/or rain water to wash vehicles. As at end 2015, 58 facilities were equipped with a vehicle washing water recycling system and 14 with a rainwater collection system. In Bordeaux for example, the improvement of vehicle washing infrastructure saved 32% in water consumption. 4.2 Pollution and waste management - Measures to prevent, reduce or remedy emissions in the air, water and soil seriously affecting the environment - Measures to prevent, recycle and eliminate waste (article I-2-b-2 The Group’s Environment policy has three specific goals, one of which is to improve waste management. This issue is an important environmental challenge for the Group. To this end, the HSE Department provides Group subsidiaries with specific tools, such as a booklet, which can be customised, to raise employees’ awareness to sorting waste, a waste management procedure, a template register to monitor waste production and treatment on each site. The subsidiary Keolis Bordeaux Métropole, which has held ISO 14001 certification since 2012, came under the Group certification in 2015. The subsidiary conducts a truly proactive environmental protection policy, working closely with its public transport autho- rity Bordeaux Métropole. The ISO 14001 certification thus helped to accelerate the improvement of waste sorting and recovery. The company’s canteen started to compost its food waste, resulting in 8 tonnes being composted which otherwise would have been discarded with other household waste. Among other initiatives, the introduction of new instructions for the use of aerosols and thinners led to reduction in waste by 30% and 50% respectively. Article code Subject of decree 2015 data 2014 data Indicator I-2-b-2 – measures to prevent, recycle and eliminate waste 4,283 3,289* Tonnes of hazardous waste produced 6,976 Tonnes of non-hazardous waste produced 73% Percentage of hazardous waste recovered 46% Percentage of non-hazardous waste recovered The reduction in the quantity of hazardous waste produced is due to the improvement in monitoring occasional cleaning operations. 22 1. Management Report
  • 23.
    In 2015, severalKeolis Group subsidiaries are located in countries facing water shortages, i.e. Australia and Belgium (according to the World Resources Institute). Article code Subject of decree 2015 data 2014 data Indicator I-2-c-1 – water consumption and water supply depending on local factors 744,622 641,492* Volume of water purchased in m3 8% 7% Share of water consumption in areas faced with water shortages - Consumption of raw materials and measures taken to improve their efficient use (article I-2-c-2) The Group’s service activity does not entail the substantial consumption of raw materials. This subject is therefore not a major environmental issue for the Group. - Energy consumption, measures taken to improve energy efficiency and use of renewable energies (article I-2-c-3) Energy consumption is the main environmental impact of our activities. Optimising our consumption is one of the objectives of Keolis Group’s environment policy. Keolis also made a commitment to reducing its energy consumption by 10% between 2014 and 2020. This commitment will be illustrated by a performance indicator to take into account the change in our level of business: energy consumption per kilometre travelled (tonnes of oil equivalent / km). To reach this objective and support the energy transition, Keolis works in three main areas: • Improvement of behaviour Eco-driving to reduce fuel consumption of vehicles. Simulator training raises bus, coach and tram drivers’ awareness of the bene- fits of eco-driving. Smooth driving improves customer comfort and saves fuel, without having any impact on commercial speed. Keolis has also listed a range of products suitable for buses and coaches called ‘Konfort’, to view how driving affects consumption by measuring acce- leration and braking. Today no fewer than 3,613 vehicles are equipped with an eco-driving assistant (Konfort or similar). • Measuring and controlling the energy efficiency of entrusted assets A matrix of the main energy uses has been developed to help subsidiaries identify their areas for improvement. • Supporting Public Transport Authorities in their approaches to improve the environmental performance of their fleet and/or building renovations. For several years, Keolis has invested in a range of solutions to reduce the environmental impacts of its activities, often being a forerunner in the field. The solutions implemented are tailored to the local context and the fleet: alternative energies, particle filters, recovery systems or energy savings systems. Keolis is particularly active in this field, calling on the entire range of alternative energies, such as bio-fuels, ethanol, products from the gas sector and electrical energy. When purchasing vehicles, the Group always advises Public Transport Authorities to select models which run on alternative fuels, notably biogas. In 2015, Keolis operated more than 3,800 vehicles throughout the world running on fuels other than diesel, representing 15% of its total fleet. (By fuel type: Biodiesel (820), Bioethanol (400), Biogas (470), Diester (500) NGV (1,090), electric (220) and hybrid (375).) Keolis is continuing its actions in this field through active technological intelligence with manufacturers and equipment suppliers to identify and possibly develop solutions to optimise the environmental performance of the vehicle fleet. For example in Sweden, Keolis has been operating new hybrid buses since March 2015. These pollute 90% less than traditional diesel buses and are exceptionally fast to recharge: in the space of a mere 6 minutes, the buses recharge their batteries to 100% at their line terminuses and are ready to run another 8 km, at which point the biodiesel engine takes over. An added advantage is that these buses are quieter and therefore more comfortable for passengers. 23 1. Management Report
  • 24.
    With regard tobuildings, while their energy consumption is far lower than that needed to power vehicle fleets, Keolis nonetheless conducts activities to optimise certain types of energy consumption: heating, air conditioning, hot water, lighting and related systems (ventilation, pumps), machine tools and compressed air machines. Excluding heating, lighting can account for up to 50% of an electricity bill of Keolis’ infrastructure and buildings. Keolis Rennes cut its office lighting electricity consumption by 40% by fixing rules for using lighting according to needs, regularly measuring electricity consumption and using low energy lighting systems. - Land use (article II-2-c-1) The Group’s activity does not have any significant impact on land use. Concerning already urbanised areas, the use of public transport contributes to relieving traffic congestion from towns and cities. For an identical number of passengers, the road footprint of the private car is nearly 20 times more than that of the tram and 5 times more than that of the bus (source UITP). 4.4 Climate change - Greenhouse gas emissions (article I-2-d-1) Carbon dioxide emissions produced by Group activities are directly related to the energy consumption of commercial vehicles, the Group’s leading source of emissions, and to energy use by buildings (heating, lighting). In addition to the Greenhouse Gas (GHG) Emissions Statement issued by Keolis in 2012 and repeated in 2015 relating to article 75 of the French ‘Grenelle II’ Environment Act, methods to assess and reduce CO2 emissions have been put in place at subsidiary level, voluntarily or in compliance with regulations. Action plans to reduce these emissions must be established and assessed locally, particularly due to the number of contracts and the types of networks operated. In all events, actions to reduce emissions are estimated and assessed by way of an indicator which includes the notion of trip or traveller (CO2 emissions/trip/passenger.km). The Greenhouse Gas Emissions Statement for public transport must apply to a given geographical zone. Modal shift from private car to public transport can thus be measured. This helps to show that public transport is a solution to reduce global GHG emissions. In Sweden, Keolis has three wind turbines located in three different locations. Generating 9.56 GWh per year, this new source of renewable energy produces the equivalent of 33% of its annual electricity consumption. Keolis Sverige therefore plays its part in improving the local energy mix. Article code Subject of decree 2015 data 2014 data Indicator I-2-c-3 – energy consumption, measures taken to improve energy efficiency and use of renewable energies 229,266 215,932 Traction energy consumption for commercial vehicle fleets (excluding rail) in TOE 41,635 10,129 Traction energy consumption for commercial railway use in TOE 21,842 15,097* Energy consumption of company facilities in TOE 292,743 241,158 Total energy consumption in TOE The substantial increase in the consumption of energy for traction and that of company facilities relates to the inclusion within the consolidation scope of a new rail subsidiary, Keolis Commuter Service in Boston. 24 1. Management Report
  • 25.
    The overall increasein the Group’s carbon dioxide emissions for 2015 can be explained by the integration of Keolis Commuter Services in Boston and Docklands Light Railway in London. The American subsidiary operates locomotives running on diesel which account for 30% of all rail kilometres travelled by the Group. The British subsidiary operates electrically-powered light rail services. In this country, the electricity emission factor is high; on ave- rage ten times higher than in France. - Adjusting to the consequences of climate change (article II-2-d-1) Adjusting to climate change is not an immediate or major issue for the Keolis Group. As a public transport player, the Group may offer recommendations for policy making, but is not a direct decision-maker in investments and other choices made by Public Transport Authorities. 4.5 Protection of biodiversity - Measures to preserve or develop biodiversity (article I-2-e-1) The predominantly urban activity of the Group does not cause a significant impact on biodiversity. However, the experience and know-how we have gathered throughout the world puts Keolis into a position where it can respond to biodiversity issues wherever necessary. Article code Subject of decree 2015 data 2014 data Indicator I-2-d-1 – greenhouse gas emissions; 5,751,885 671,688* CO2 emissions from commercial traction (excluding rail) in TCO2 e 165,817 49,644 CO2 emissions from commercial rail traction in TCO2 e 59,049 28,184* CO2 emissions of company facilities in TCO2 e 976,751 769,516 Total CO2 emissions 25 1. Management Report
  • 26.
    Appendix 2 List ofterms of office or functions performed in 2015 in other companies by the executive officers of KeolisB 26 1. Management Report Jean-Pierre FARANDOU President / Sole Member of the Executive Board GROUPE KEOLIS S.A.S. Chairman CEO and Director KEOLIS Chairman of Board of Directors Union des Transports Publics et Ferroviaires (since 18/06/2015) Chairman of Board of Directors Orchestre National d’Ile-de-France Michel LAMBOLEY Director KEOLIS LYON Director KEOLIS S.A. Director KEOLIS BORDEAUX Director KEOLIS BORDEAUX METROPOLE Director KEOLIS LILLE Member of Supervisory Board LION / SENECA FRANCE 1 Director EUROBUS HOLDING (Belgium) Director KEOLIS ESPANA Arnaud VAN TROEYEN Director KEOLIS Director STE. D’EXPLOITATION AEROPORT ALBERT PICARDIE Member of Supervisory Board AEROLIS Member of the Management Board STÉ D’EXPLOITATION AEROPORT DOLE JURA Managing Director STÉ D’EXPLOITATION AEROPORT DOLE JURA Permanent Representative of Keolis KEOLIS LILLE Director EFFIA (until 30/09/2015) Director ONE PARK (since 14/10/2015) Director KEOLIS TRANSIT AMERICA, INC (until 01/07/2015) Director 3695158 CANADA INC. (until 01/02/2015) Director AUTOCARS ORLEANS EXPRESS INC. (Canada) (until 14/04/2015) Member of the Supervisory Board KEOLIS NEDERLAND B.V. Director KEOLIS DOWNER PTY LTD Director KDR VICTORIA PTY LTD Director KDR GOLD COAST PTY LTD Director KEOLIS DOWNER BUS AND COACHLINES PTY LTD (Australie) (since 10/03/2015) Director KEOLIS DOWNER BUS AND COACHLINES PROPERTY PTY LTD (since 10/03/2015) Xavier HUBERT Director KEOLIS Director KEOLIS ORLEANS VAL DE LOIRE Director KEOLIS RENNES Director KEOLIS LILLE (until 18/11/2015) Olga Damiron Director KEOLIS President / Director INSTITUT KEOLIS Director KEOLIS RENNES (since 10/11/2015) Isabelle BALESTRA Director Keolis S.A. Director KEOLIS LILLE (since 18/11/2015) Patricia MEUNIER Employee Director KEOLIS CEO / Director CIE TRANSPORTS DE PERPIGNAN Director SOCIÉTÉ AUTOMOBILES DE PROVENCE Director CIE DES TRANSPORTS MEDITERRANEENS Director KEOLIS BAIE DES ANGES Director STE DES TRANSPORTS COTE D’AZUR RIVERA Director KEOLIS COTE D’AZUR Éric PATOUX Employee Director KEOLIS Director KEOLIS CHALONS EN CHAMPAGNE Director STE DES TRANSPORTS DE L’AGGLOMERATION DE CHAUNY Director KEOLIS CHATEAU THIERRY (until 26/06/2015) Chief Executive KEOLIS CHÂTEAU THIERRY (since 26/06/2015) Chief Executive KEOLIS CHAUMONT Chief Executive KEOLIS CHAUNY TERGNIER (since 26/06/2015) Director KEOLIS CHAUNY TERGNIER (until 26/06/2015) Marc VILLENEUVE Employee Director KEOLIS
  • 27.
    Appendix 3 Summary ofdelegations of powers and authorities granted by the general assembly of the board with regard to capital increasesB Appendix 4 Table of earnings for the past five financial years (in euros) B 27 1. Management Report 2015 2014 2013 2012 2011 2010 1 - Capital at end of period a) Share capital 46,851,276 46,851,276 46,851,276 46,851,276 46,851,276 46,851,276 b) number of ordinary shares outstanding 3,904,273 3,904,273 3,904,273 3,904,273 3,904,273 3,904,273 c) Number of future shares to be created - by conversion of bonds - through the exercise of subscription rights 2 - Transactions and earnings for the period a) Share capital 196 787 773 186,836,372 175,946,238 166,466,450 156,170,734 155,223,584 b) Earnings before tax, profit sharing, depreciation and provisions 13,568,616 14,909,693 48,656,168 33,829,455 33,497,304 63,711,712 c) Tax (tax credit) on profits (15,388,189 ) (15,845,019) (10,378,714) 8,104,182 1,197,877 -327,452 d) Employee profit sharing for the year - - - 1,916,846 - - e) Earnings after tax, profit sharing, depreciation and provisions 37,599,518 25,151,149 38,731,482 59,750,217 45,477,141 20,490,765 f) Distributed earnings - 19,130,938 19,130,938 19,130,938 19,130,938 19,130,938 3 - Earnings per share a) Earnings after tax, but before allocations to depreciation and provisions 7.42 7.88 15.12 6.10 8.27 16.40 b) Earnings after tax and allocations to depreciation and provisions 9.63 6.44 9.92 15.30 11.65 5.25 c) Dividend paid on each share (Net dividend) 4.90 4.90 4.90 4.90 4.90 4 - Staff a) Average numbers employed 1,408 1,363 1,262 1,228 1,215 1,186 b) Payroll 92,565,343 90,570,432 83,312,146 78,350,555 72,169,782 74,251,465 c) Amounts paid in welfare benefits (Social Security, company benefits, etc.) 43,295,106 42,962,595 38,219,435 36,186,552 32,579,774 33,356,699 (Arts. 133, 135 and 148 of the Commercial Companies Decree) Nil..
  • 29.
    29 2. consolidATED FINANCIAL STATEMENTS AKey figures for the Group. . . . . . . . . . . . . . . 30 B Consolidated financial statements. . . . . 31 1 • Income statement. . . . . . . . . . . . . . . . . . . . . . . . . 31 2 • Statement of comprehensive income. . . . 32 3 • Statement of financial position . . . . . . . . . 33 4 • Statement of changes in equity. . . . . . . . . . 34 5 • Statement of cash flows. . . . . . . . . . . . . . . . . 35 C Notes to the consolidated financial statements. . . . . . . . . . . . . . . . . . . . . . . . . . . . . . 36 1 • General information . . . . . . . . . . . . . . . . . . . . . 36 2 • Summary of significant accounting policies. . . . . . . . . . . . . . . . . . . . . . . . . . . . . . . . . . . . 36 2.1 Basis of preparation. . . . . . . . . . . . . . . . . . . . . . . . . . . 36 2.2 Changes in accounting principles. . . . . . . . . . . . . . . . 38 2.3 Use of Management estimates in the application of the Group’s accounting standards. . . . . . . . . . . . . . . . . . . . . . . . . . . . . . . . . . . . 38 2.4 Accounting principles. . . . . . . . . . . . . . . . . . . . . . . . . 38 3 • Highlights of financial year 2015. . . . . . . . 49 4 • Notes to the consolidated income statement. . . . . . . . . . . . . . . . . . . . . . . . . . . . . . . . . . 50 4.1 Staff costs . . . . . . . . . . . . . . . . . . . . . . . . . . . . . . . . . . . 50 4.2 Other operating income. . . . . . . . . . . . . . . . . . . . . . . 50 4.3 Operating profit. . . . . . . . . . . . . . . . . . . . . . . . . . . . . . . 50 4.4 EBITDA calculation . . . . . . . . . . . . . . . . . . . . . . . . . . . 51 4.5 Financial income / (expense). . . . . . . . . . . . . . . . . . . 51 4.6 Share in net profit for the year from investments under the equity method. . . . . . . . . . . . . . . . . . . . . . . 51 4.7 Taxation. . . . . . . . . . . . . . . . . . . . . . . . . . . . . . . . . . . . . . 52 5 • Notes to the consolidated statement of financial position. . . . . . . . . . . . . . . . . . . . . . 54 5.1 Goodwill. . . . . . . . . . . . . . . . . . . . . . . . . . . . . . . . . . . . . 54 5.2. Other intangible assets . . . . . . . . . . . . . . . . . . . . . . . 55 5.3 Property, plant and equipment . . . . . . . . . . . . . . . . . 56 5.4 Investments under the equity method. . . . . . . . . . . 57 5.5 Current and non-current financial assets. . . . . . . . 58 5.6 Inventories. . . . . . . . . . . . . . . . . . . . . . . . . . . . . . . . . . . 58 5.7 Trade and other receivables. . . . . . . . . . . . . . . . . . . . 59 5.8 Cash and cash equivalents. . . . . . . . . . . . . . . . . . . . 59 5.9 Equity. . . . . . . . . . . . . . . . . . . . . . . . . . . . . . . . . . . . . . . 60 5.10 Financial debt and long term borrowings. . . . . . . 60 5.11 Financial assets and liabilities by category . . . . . 64 5.12 Risk management and financial derivatives . . . . 65 5.13 Provisions. . . . . . . . . . . . . . . . . . . . . . . . . . . . . . . . . . . 71 5.14 Operating liabilities and other debt . . . . . . . . . . . . 75 6 • Other commitments not recognised in the statement of financial position and contractual commitments. . . . . . . . . . 76 7 • Disputes . . . . . . . . . . . . . . . . . . . . . . . . . . . . . . . . . . . 77 8 • Related party transactions. . . . . . . . . . . . . 77 8.1 Transactions with GROUPE KEOLIS S.A.S. and Groupe EFFIA . . . . . . . . . . . . . . . . . . . . . . . . . . . . . . . . 77 8.2 Transactions with joint ventures and associates. 77 8.3 Remuneration of the Group’s key managers. . . . . . . 77 9 • Post balance sheet events. . . . . . . . . . . . . . . 77 10 • Consolidation scope. . . . . . . . . . . . . . . . . . . . 78 10.1 Subsidiaries. . . . . . . . . . . . . . . . . . . . . . . . . . . . . . . . . 78 10.2 Joint ventures and associates. . . . . . . . . . . . . . . . . 85 Statutory auditors’ report on the consolidated financial statements. . . . . . . . . . . 86 CONTENTS
  • 30.
    30 2. Consolidated financialstatements (€ million) Note 31/12/2015 31/12/2014 Revenue 4,817.4 4,275.6 ◗ Revenue France 2,625.3 2,602.2 ◗ Revenue International 2,192.1 1,673.4 Revenue net of sub-contracting 4,637.2 4,101.3 Recurring EBITDA 4.4 227.2 213.9 EBITDA 4.4 206.7 187.4 Recurring operating profit 4.3 56.2 67.7 Operating profit before investments under equity method 37.0 34.5 Operating profit after investments under equity method 59.4 50.5 Profit after tax from continuing operations 4.4 14.8 Profit attributable to equity shareholders 12.0 13.6 Total equity 202.3 162.5 of which attributable to equity shareholders 150.8 141.7 Net cash flows from operating activities 108.2 141.9 Industrial investments 201.4 181.5 Net financial debt (cash surplus)1 548.2 346.9 (1) Surplus cash positions are presented in brackets Key figures for the Group A
  • 31.
    31 2. Consolidated financialstatements 1 • Income statement (€ million) Note 31/12/2015 31/12/2014 Revenue 4,817.4 4,275.6 Other income from operations 18.7 25.5 Income from continuing operations 4,836.2 4,301.1 Sub-contracting (180.2) (174.3) Purchases consumed and external expenses (1,596.8) (1,451.8) Taxes (15.0) (13.6) Staff costs, incentive schemes, profit-sharing 4.1 (2,820.6) (2,458.8) Other operating income 4.2 48.5 48.3 Other operating expense (35.6) (21.9) Net provisions on current assets (0.1) (4.6) Net depreciation and other provisions charged (187.9) (163.5) Profit/(loss) on recurring fixed asset disposals 1.3 1.4 Amortisation of grants received 6.3 5.4 Recurring operating profit 56.2 67.7 Other non-recurring income 4.3 7.3 6.6 Other non-recurring expense 4.3 (24.9) (30.4) Depreciation and provisions on contractual rights 4.3 (1.6) (9.4) Of which depreciation of other intangible assets and negative goodwill 5.7 (5.3) Operating profit/loss before investments under equity method 37.0 34.5 Profit/(loss) from associates 22.4 16.0 Operating profit/(loss) after investments under equity method 59.4 50.5 Net cost of financial borrowing 4.5 (12.3) (8.7) Other financial income 4.5 7.1 7.1 Other financial expense 4.5 (15.0) (13.5) Financial income (expense) (20.2) (15.1) Profit before tax 39.2 35.4 Taxation 4.7 (34.8) (20.6) Profit after tax from continuing operations 4.4 14.8 Profit for the year 4.4 14.8 Profit/(loss) attributable to non-controlling interests 7.6 (1.3) Profit attributable to Group 12.0 13.6 Consolidated financial statements B
  • 32.
    32 2. Consolidated financialstatements (€ million) 31/12/2015 31/12/2014 Profit for the year 4.4 14.8 Actuarial gains and losses on defined benefit pension schemes (0.3) (14.0) Tax on actuarial gains and losses on defined benefit pension schemes - 4.8 Share of other items in comprehensive income of investments under equity method 13.0 8.4 Items that will not be reclassified to profit or loss 12.7 (0.8) Translation differences and others 0.5 6.7 Unrealised gains and losses on financial hedging instruments 0.1 (7.8) Tax on items that may be reclassified to profit or loss (0.1) 2.7 Items that may be reclassified to profit or loss 0.6 1.6 Total gains and losses recognised directly in equity 13.2 0.8 Total comprehensive income for the year 17.7 15.6 of which attributable to: - Equity shareholders 25.2 13.7 - Non-controlling interests (7.6) 1.9 2 • Statement of comprehensive income
  • 33.
    33 2. Consolidated financialstatements Assets (€ million) Note 31/12/2015 31/12/2014 Goodwill 5.1 267.3 233.6 Other intangible assets 5.2 203.9 149.7 Property, plant and equipment 5.3 711.3 620.5 Investments under the equity method 5.4 39.4 36.2 Non-current financial assets 5.5 181.0 149.8 Deferred tax asset 4.7 75.4 77.0 Non-current assets 1,478.4 1,266.9 Inventories and work in progress 5.6 82.0 78.0 Trade receivables 5.7 398.1 365.6 Other receivables 5.7 430.7 367.5 Current financial assets 5.5 18.8 19.8 Cash and cash equivalents 5.8 310.6 284.7 Current assets 1,240.3 1,115.7 TOTAL ASSETS 2,718.7 2,382.5 Liabilities (€ million) Note 31/12/2015 31/12/2014 Share capital 5.9 46.9 46.9 Reserves and premiums 5.9 91.9 81.3 Net profit/(loss) attributable to Group 5.9 12.0 13.6 Equity attributable to Group 150.8 141.7 Reserves attributable to non-controlling interests 59.1 19.5 Profit for the year attributable to non-controlling interests (7.6) 1.3 Equity 202.3 162.5 Non-current provisions 5.13 189.3 176.9 Non-current financial debt 5.10 571.3 138.9 Deferred tax liability 4.7 68.2 43.7 Non-current liabilities 828.8 359.5 Current provisions 5.13 55.3 52.0 Current financial debt 5.10 68.2 167.7 Bank borrowings 5.8 266.4 376.9 Trade payables and other liabilities 5.14 1,297.6 1,263.9 Current liabilities 1,687.5 1,860.5 TOTAL LIABILITIES 2,718.7 2,382.5 3 • Statement of financial position
  • 34.
    34 2. Consolidated financialstatements (€ million) Sharecapital Reserves Translationdifferences Otherunrecognised gains/(losses), latents,nets Otherunrealisedgains/ (losses),net,not re-classifiabletoprofitorloss Sub-total Totalequity AT 31 DECEMBER 2013 46.9 140.0 (11.4) 0.3 (12.2) 116.7 163.5 Attributable to Keolis S.A. shareholders 46.9 126.7 (11.6) 0.3 (12.2) 103.2 150.0 Attributable to minority shareholders in subsidiaries - 13.3 0.2 - - 13.5 13.5 Dividends paid to Keolis S.A. shareholders - (19.1) - - - (19.1) (19.1) Change in Keolis S.A. shareholdings in its subsidiaries without losing control - (2.8) - - - (2.8) (2.8) OPERATIONS ATTRIBUTABLE TO KEOLIS S.A. SHAREHOLDERS (A) - (22.0) - - - (22.0) (22.0) Dividends paid to minority shareholders in subsidiaries - (0.3) - - - (0.3) (0.3) Change in shareholdings in subsidiaries related to gaining / losing control - - - - - - - Change in shareholdings in subsidiaries without gaining/losing control - 5.8 - - - 5.8 5.8 OPERATIONS ATTRIBUTABLE TO MINORITY SHAREHOLDERS IN SUBSIDIARIES (B) - 5.4 - - - 5.4 5.4 Profit for the year - 14.8 - - - 14.8 14.8 Requalification of non-classifiable reserves related to mergers - (2.8) - - 2.8 - - Gains / (losses) recognised directly in equity - - 6.7 (5.1) (0.8) 0.8 0.8 COMPREHENSIVE INCOME (C) - 12.0 6.7 (5.1) 2.0 15.6 15.6 CHANGE IN THE YEAR (A+B+C) - (4.6) 6.7 (5.1) 2.0 (1.0) (1.0) Attributable to Keolis S.A. shareholders - (8.4) 6.1 (5.1) 2.0 (5.5) (5.5) Attributable to minority shareholders in subsidiaries - 6.7 0.7 - - 7.3 7.3 AT 31 DECEMBER 2014 46.9 135.0 (4.3) (4.9) (10.2) 115.7 162.5 Attributable to Keolis S.A. shareholders 46.9 115.5 (5.6) (4.9) (10.2) 94.9 141.7 Attributable to minority shareholders in subsidiaries - 19.5 1.3 - (0.1) 20.8 20.8 Dividends paid to Keolis S.A. shareholders - (19.1) - - - (19.1) (19.1) Other changes (including effects of application of IFRIC 21) - 3.0 - - - 3.0 3.0 OPERATIONS ATTRIBUTABLE TO KEOLIS S.A. SHAREHOLDERS (A) - (16.2) - - - (16.2) (16.2) Dividends paid to minority shareholders in subsidiaries - (0.5) - - - (0.5) (0.5) Change in shareholdings in subsidiaries related to gaining / losing control - - - - - - - Change in shareholdings in subsidiaries without gaining/losing control - 38.9 - - - 38.9 38.9 OPERATIONS ATTRIBUTABLE TO MINORITY SHAREHOLDERS IN SUBSIDIARIES (B) - 38.4 - - - 38.4 38.4 Profit for the year - 4.4 - - - 4.4 4.4 Gains / (losses) recognised directly in equity - - 0.5 0.1 12.7 13.2 13.2 COMPREHENSIVE INCOME (C) - 4.4 0.5 0.1 12.7 17.6 17.6 CHANGE IN THE YEAR (A+B+C) - 26.6 0.5 0.1 12.7 39.8 39.8 Attributable to Keolis S.A. shareholders - (4.2) 0.4 0.1 12.7 9.0 9.0 Attributable to minority shareholders in subsidiaries - 30.8 - - - 30.8 30.8 AT 31 DECEMBER 2015 46.9 161.6 (3.8) (4.8) 2.4 155.5 202.3 Attributable to Keolis S.A. shareholders 46.9 111.3 (5.1) (4.8) 2.5 103.9 150.8 Attributable to minority shareholders in subsidiaries - 50.3 1.3 - - 51.5 51.5 4 • Statement of changes in equity RESERVES AND OTHER Items that may be reclassified to profit or loss
  • 35.
    35 2. Consolidated financialstatements (€ million) Note 31/12/2015 31/12/2014 Operating profit before investments under equity method 4.3 37.0 34.5 Non-cash items 4.4 169.8 152.9 EBITDA 4.4 206.7 187.4 Elimination of provisions on current assets - 4.6 Changes in working capital (70.6) (32.3) Tax paid (28.0) (17.8) A) Net cash from operating activities 108.2 141.9 Capital expenditure (201.4) (181.5) Proceeds from the sale of tangible and intangible assets 44.5 33.9 Investment grants received 8.1 2.5 Change in financial assets for concessions (IFRIC 12) (14.2) (19.1) Financial investments (140.1) (90.0) Proceeds from disposal of financial assets 6.5 10.9 Cash flows on changes in reporting scope 4.7 27.2 B) Net cash from investing activities (292.0) (216.1) Free cash flow (183.8) (74.3) Net dividends paid (19.6) (19.7) Net dividends received 31.8 13.3 Change in equity (other transactions with shareholders) 38.7 13.0 New borrowings 443.7 59.3 Borrowings repaid (160.2) (120.2) Interest received 1.3 1.1 Interest paid (13.0) (9.8) Change in other financial debts 0.1 0.1 Other (3.7) (6.2) C) Net cash from financing activities 319.1 (69.2) D) Foreign exchange translation differences 1.5 3.0 Change in cash and cash equivalents (A+B+C+D) 136.7 (140.4) Cash and cash equivalents at beginning of period 5.8 (92.5) 47.9 Cash and cash equivalents at end of period 5.8 44.2 (92.5) Change in cash and cash equivalents 136.7 (140.4) 5 • Statement of cash flows
  • 36.
    36 2. Consolidated financialstatements 1 • General information The activity of Keolis S.A. and its subsidiaries (“the Group”) is multimodal passenger transport. The Group operates in 9 European countries, in Canada, Australia, the United States (Washington, California, Florida and Virginia) and India as a licen- sed public service operator within public-private contracts. The company Keolis S.A., the Group’s holding company, is a société anonyme (public limited company) registered and domi- ciled in France, with its registered office located at 20/22, rue Le Peletier, 75320 Paris Cedex 09. The consolidated financial statements of the Group for the finan- cial year ended 31 December 2015 were approved by the Board of Directors on 3 March 2016. The financial statements of the Group are fully consolidated into those of GROUPE KEOLIS S.A.S. which SNCF fully consoli- dates. 2 • Summary of significant accounting policies 2.1 Basis of preparation The Group's consolidated financial statements for the reporting period ending 31 December 2015 have been prepared in accor- dance with IFRS (standards and interpretations) published by IASB as adopted by the European Union and rendered manda- tory from 1st January 2015. They are available at this site: http://ec.europa.eu/internal_market/accounting/ias/index_fr.htm The consolidated financial statements are presented in millions of euros unless otherwise indicated. In the absence of borrowing or equity instruments traded on a regulated market, the Group chose not to publish information on earnings per share (IAS 33), or information about operating seg- ments (IFRS 8). The assets and liabilities in the Group’s consolidated financial sta- tements are measured and recognised according to various mea- surement bases authorised by IFRS, primarily at the historical cost basisofaccounting,withtheexceptionofderivativefinancialinstru- ments and financial assets held for trading purposes or classified as AFS (available for sale), which are measured at fair value. 2.2 Changes in accounting principles Application of standards, amended standards and interpretations that are mandatory as of 1st January 2015 • Standards relative to the scope and method of consolidation (IFRS 10, 11, 12, IAS 27 version IFRIC Interpretation 21 Levies) IFRIC Interpretation 21 Levies identifies the obligating event, on the liability side of the balance sheet, which triggers taxes that fall within the scope of application of IAS 37 Provisions, Contingent Liabilities and Contingent Assets. Taxes are outflows of resources that represent economic benefits imposed by public authorities by virtue of the laws or regulations. However, the scope of application of this interpretation excludes outflows of resources referred to in IAS 12 Income Taxes: fines and penalties imposed for non-compliance with the laws and regulations in effect, and payments made by the entity in the framework of a contractual agreement with a public authority on the acquisition of an asset or the performance of a service. IFRIC Interpretation 21 requires the recognition of the liability according to the due dates of the taxes and not their related commitments. The application of this interpretation within the Group has led solely to changes in the timing of recognition and to the annual period used to calculate the tax related to the corporate social solidarity contribution (C3S) in effect in France, which had in the past been recognized on a proportional basis in each interim period in accordance with turnover for the current period. Henceforth, it is posted on the date of the event that triggers the tax payment obligation, i.e. 1 January, in accordance with the turnover of the prior calendar year. The impact of the application of the interpretation results in improved shareholders' equity as at 1 January 2014 in the amount of €2.3 million. But, the impact on the 2014 profit and loss statement is not significant. As the impact is not material, this improvement in shareholders' equity was recognized at the start of the 2015 financial year. The application of IFRIC 21 at the end of December 2015 led to a restatement of the CS3 expense posted at the end of 2014 in the amount of €3.5 million, with a tax due date on 1 January 2015. The expense related to this tax without applying IFRIC 21 would have been €1.8 million taking account of the tax authori- ties' changes to the valuation methods for the 2016 fiscal year. • Annual Improvements to IFRSs 2011-2013 Cycle The annual Improvements to the IFRSs 2011-2013 Cycle apply to financial years beginning on or after 1 July 2014 and mainly relate to IFRS 3 Business Combinations and IFRS 13 Fair Value Measurement. IFRS 3 has been amended so as to exclude the creation of all types of joint arrangements, as defined in IFRS 11 Joint Arrangements, i.e. joint ventures and joint operations, from its scope of application. With regard to IFRS 13, it now exceptio- nally allows for fair value to be measured not only for a series of Notes to the consolidated financial statements C
  • 37.
    37 2. Consolidated financialstatements financial assets and liabilities on a net basis, but also for the mea- surement of the fair value of all contracts that fall under IAS 39 Financial Instruments: Recognition and Measurement, even if they do not comply with the definition of financial assets and lia- bilities under IAS 32 Financial Instruments: Presentation. These improvements have no impact on the presentation of the last financial year. Standards, amendments to standards and interpretations not subject to early application In general, the Group does not apply in advance the standards and interpretations adopted by the European Union that apply to annual periods that start before 1 January 2015. The Group has not applied the standards, annual improvements, amendments to standards and interpretations that have not been adopted by the European Union. • Annual Improvements to IFRSs 2010-2012 Cycle The amendments applicable to the annual periods starting on or after 1 February 2015 relate to IFRS 2 Share-Based Payment, which defines a performance condition and a service condition; IFRS 3 Business Combinations, which provides details on the recognition of potential consideration; IFRS 8 Operating Segments (not published by the Group); IFRS 13 Fair Value Measurement, which explains the reasons for the elimination of the paragraphs related to the valuation of short- term receivables and payables, with no stated interest rate on the invoice amounts; IAS 16 Property, Plant and Equipment and IAS 38 Intangible Assets, which indicate that accumulated depreciation is calculated on the difference between the gross amount and the net amount accounted for; and IAS 24 Related Party Disclosures, which stipulates that the reporting entity is exempted from the obligation to report the amount of the remu- neration paid to top executives, but it must indicate the amount of fees paid to service provider entities. • Annual Improvements to IFRSs 2012-2014 Cycle Amendments that apply to the annual periods starting on or after 1January2016relatetoIFRS5Non-CurrentAssetsHeldforSale and Discontinued Operations with a view to include therein the assets held for distribution to the owners; IFRS 7 Financial Instruments: Disclosures, with regard to the continuing involve- ment in a transferred asset via a service agreement and the lack of information on the offsetting of financial assets and financial liabilities in condensed interim financial statements; IAS 19 Employee Benefits clarifying that the discount rate should be applied no longer at country level but according to the currency; andIAS34InterimFinancialReporting,whichprovidesanexpla- nationfortheexpressionelsewhereintheinterimfinancialreport. • Amendments to IAS 1: Presentation of Financial Statements The amendments applicable to the annual periods starting on or after 1 January 2016 stipulate that the application of the mate- riality concept applies to financial statements, including the appended notes to improve their understandability, and that professional judgement is to be used more broadly in the infor- mation on accounting methods included in the notes. • Amendments to IAS 16: Property, Plant and Equipment and IAS 38 Intangible Assets The amendments applicable to the annual periods starting on or after 1 January 2016 indicate that the use of the revenue based depreciation methods are not appropriate. • Limited amendments to IAS 19 Employee Benefits The amendments applicable to the annual periods starting on or after 1 February 2015 clarify and simplify the recognition of contributions, which do not depend on the employee's number of years of service to the employer, as a reduction in the service cost in the period in which the service is rendered instead of being allocated across the period of service. • Amendments to IAS 27 Equity Method in Separate Financial Statements The amendments applicable to the annual periods starting on or after 1 January 2016 allow for the use of the equity method as described in IAS 28 Investments in Associates and Joint Ventures and no longer according to IFRS 9 Financial Instruments to measure investments in subsidiaries, associates and joint ventures in the separate financial statements. • Amendments to IFRS 11 Joint Arrangements The amendments applicable to the annual periods starting on or after 1 January 2016 describe the method to recognize acqui- sitions of interests in a joint operation whose operations consti- tute a business within the meaning of IFRS 3 Business Combinations. Standards applicable after 2015 and not yet approved by the EU The Group does not apply the following texts that did not apply in 2015 but should become mandatory in the future: ◗ IFRS 15 – Revenues from Contracts with Customers (published inMay2014).ThisstandardwillreplaceIAS18RevenueandIAS 11 Construction Contracts. The application of this standard should become mandatory for the 2018 and ensuing annual periods, subject to being adopted by the European Union; ◗ IFRS 9 – Financial Instruments (published in July 2014). This text relates to the classification and valuation of financial instru- ments, the deprecation of financial assets and hedge accoun- ting. This standard will replace IAS 39 Financial Instruments; it should become mandatory for the 2018 and ensuing annual periods, subject to being adopted by the European Union.
  • 38.
    38 2. Consolidated financialstatements The Group is examining these standards in order to determine their impact on the consolidated financial statements, as well as their practical consequences. 2.3 Use of Management estimates in the application of the Group’s accounting standards In order to draw up the Group’s accounts in accordance with IAS 8 - Accounting Policies, Changes in Accounting Estimates and Errors, management must make estimates and assump- tions affecting the amounts stated in the financial statements. Management has to revise such estimates in the light of changes in the circumstances on which they are based or further to new information. Management also has to exercise judgement in how accounting methods are applied. As a result, future estimates may be different from those adopted as of 31 December 2015. The estimates and assumptions primarily concern the lengths of contractual relations, asset impairment tests, deferred tax assets and financial instruments, as well as provisions, in particular provisions for pensions, litigation and losses on contracts and recognition of amounts to be received and penalties to be paid arising from contractual relationships. Finally, in the absence of standards or interpretations applicable to a specific transaction, Group management must use its best judgement to define and implement accounting methods that provide the most relevant and reliable information, to ensure that the financial statements: ◗ present a true and fair view of the Group’s financial position and cash flows; ◗ reflect the economic reality of the accounts. 2.4 Accounting principles 2.4.1 Methods of consolidation Subsidiaries are recognised in the consolidated statements from the date on which control thereof reverted to the Group. They are derecognised from the date on which the Group ceased to control them. The income and expenses of the companies are included in the Group's income statement from the date that control was taken, and up to the date on which the Group lost control.   Fully consolidated subsidiaries All the Group’s subsidiaries are companies it exclusively controls directly or indirectly. The Group’s consolidated financial state- ments include the assets, liabilities, income and expenses of these companies. Exclusive control exists when Keolis S.A. has power over the entity, is exposed or has rights to variable returns, and has the ability to affect those returns. In ascertaining whether there is control, account is taken of the established rules of governance and the rights held by the other shareholders in order to ensure that they are merely protective in nature. Potential voting rights, whether immediately exercisable or convertible, including those held by another entity, are also analysed to determine those conferring substantive rights in the assessment of power, in accordance with IFRS 10 “Consolidated Financial Statements”. Structured entities substantially controlled by the Group are fully consolidated. Associates and joint ventures consolidated under the equity method Entities in which the Group exerts significant influence without exercising control are associates. Significant influence is presu- med when the Group holds upwards of 20% of the voting rights. Under the equity method, investments in associates or joint ventures are capitalised in the consolidated balance sheet at their cost of acquisition. The Group's share of income (loss) of associates or joint ventures is recognised in profit or loss, whe- reas its share of post-acquisition movements in reserves is reco- gnised in reserves. Post-acquisition movements are posted in adjustment to the value of the investment. The Group's share of an associate’s or a joint venture’s losses is recognised up to the limit of the carrying amount of the investment as well as any possible long-term share. Additional losses are not booked as provisions, unless the Group is legally or implicitly required to support the said associate or joint venture. Non-controlling investments A non-controlling investment is the share of interest in a subsi- diary which is not directly attributable to the parent company. Non-controlling investments are recognised at fair value on the takeover date. Year-end closing timing differences For companies whose financial year does not end on 31st December, interim financial statements as at 31st December are established. Transactions eliminated in the consolidated financial statements Transactions between consolidated companies which have an impact on their balance sheet or income statement are elimina- ted. Losses on transactions between consolidated companies that are indicative of value impairment are not eliminated. IAS 12 “Income Taxes” applies to temporary differences resulting from the elimination of profits and losses on intra-group transactions. 2.4.2 Translation of transactions and financial statements of foreign companies The Group’s consolidated financial statements are prepared in
  • 39.
    39 2. Consolidated financialstatements euros, which is the functional and reporting currency of the parent. Translation of the financial statements of foreign companies The financial statements of consolidated foreign subsidiaries, whose functional currency is different from the euro which is the reporting currency, are translated on the following bases: ◗ assets and liabilities are translated at the official exchange rates prevailing at the year-end date; ◗ income and expenses are translated at the average rate for the period, unless exchange rates fluctuate significantly; ◗ goodwill and fair value adjustments recognised on the acqui- sition of companies whose functional currency is not the euro are considered to be the assets and liabilities of such compa- nies: they are thus stated in the functional currency of the said companies and converted at the closing rate of each period; ◗ the resulting foreign exchange translation differences are reco- gnised in consolidated equity under the item “foreign exchange translation reserves”. Translation of foreign currency transactions The functional currency of Group companies is their local cur- rency. Transactions denominated in foreign currency are trans- lated by the subsidiaries into their functional currency at the rate of exchange prevailing at the transaction date. Monetary assets and liabilities denominated in foreign currency are translated into euros at the last official year-end exchange rate. The corresponding exchange differences are recorded in financial income (expense). 2.4.3 Business combinations The Group has applied IFRS 3 (Revised) since 1st January 2010. A business combination is understood to involve the obtaining of control. Upon acquisition of a controlling interest, the acquirer recognises the fair value of the acquired assets and liabilities of the acquired entity and also assesses the goodwill or profit from them. Non-controlling interests are recognised according to the fol- lowing options for each combination: ◗ either based on their share in the fair value of the assets and liabilities acquired (the so-called partial goodwill method); ◗ or at fair value of the shareholding (the so-called complete goodwill method). Acquisition costs are expensed in the year. For a takeover in several stages, the investment held prior to the establishment of control is revalued at its fair value on the date of takeover and any profit or loss arising therefrom is recognised in the income statement. Commitments linked to earn-out clauses are measured at their fair value on the acquisition date. Adjustments to the cash consideration during the twelve months afterthedateofacquisitionmustbeanalysedinordertodetermine: ◗ if the adjustment is linked to new factors occurring since the acquisition of control: counterpart in profit for the year; ◗ if the adjustment is the result of new information collected enabling fine-tuning of the valuation on the takeover date: counterparty in goodwill. The subsequent change of debt corresponding to additional consideration beyond the twelve month period is booked in profit for the year. After the acquisition of control, purchases/disposals without loss of control are treated as transactions between shareholders and therefore directly through equity. 2.4.4 Goodwill Goodwill on acquisition represents the excess of the cost of an acquisition over the share acquired by the Group of the fair value of the acquired assets and liabilities of the acquired entity on the date of acquisition. The goodwill recognised for an associate is included in the value of the investment in it under “Investments under the equity method”, in the statement of financial position. Corrections or adjustments may be made to the fair value of assets, liabilities and contingent liabilities acquired in the twelve months following the acquisition, when new information arises affecting facts and circumstances which were in evidence at this date of acquisition. Goodwill is then corrected with retroactive effect. Beyond that date, any change in assets acquired and liabilities assumed is recognised in the income statement. If the information is a result of events occurring after the date of acqui- sition, they are recognised in profit for the year. As goodwill cannot be amortized, it undergoes impairment tests every year or at more frequent intervals when events or changes in circumstances indicate possible loss in value (see 2.4.9). Goodwill is allocated to cash generating units or groups thereof which are likely to benefit from synergies resulting from aggre- gation as described in note 2.4.9. Negative goodwill is recognised in the income statement on the date of acquisition. 2.4.5 Commitments to repurchase the non-controlling interests in a subsidiary The Group has given promises to non-controlling shareholders of certain fully consolidated subsidiaries to repurchase their shares.
  • 40.
    40 2. Consolidated financialstatements Thesepurchasecommitments(firm orconditional)of non-control- ling interests do not transfer risks and benefits. They are reco- gnised in financial debts against a reduction of these earnings attributable to non-controlling interests. Where the value of the commitment exceeds the amount of ear- nings attributable to non-controlling interests the balance is reco- gnised in equity attributable to Group shareholders. The fair value of non-controlling interest buyout commitments is reviewed at each financial accounting period end. The change in the corresponding financial liability is booked against equity. This provision applies to commitments to purchase non-control- ling interests issued after the application date of revised IFRS 3, i.e. 1st January 2010. For those issued before that date, the change in valuation will be booked against the associated goodwill. 2.4.6 Service concession arrangements Presentation of the IFRIC 12 interpretation An arrangement is included in the scope of interpretation of IFRIC 12, where the assets used to carry out the public service are controlled by the grantor. Control is presumed when the two conditions below are met: ◗ the grantor controls or regulates the public service, i.e. it controls or regulates the services that must be rendered, through the infrastructure covered by the concession and determines to whom and at what price the service shall be rendered; and ◗ the grantor controls the infrastructure on termination of the contract, i.e. the right to regain possession of the infrastructure at the end of the contract. In its public transport activities, the Group is in particular the holder of outsourced public service contracts. In France, the Group operates outsourced public service contracts, mainly in the form of operate and maintain (OM) contracts whereby the operator is responsible for operating and maintaining facilities owned and funded by local and regional authorities – Public Transport Authorities (PTAs). Pursuant to the interpretation of IFRIC 12, in this case, the ope- rator cannot include the infrastructure controlled by the grantor in its balance sheet as tangible assets, but either as an intangible asset (“intangible asset model”) and/ or as a financial asset (“financial asset model”): ◗ the “intangible asset model” applies where the operator receives a right to charge users for the public service and thus bears a financial risk; ◗ the “financial asset model” applies where the operator obtains an unconditional right to receive cash or other financial asset, either directly or indirectly through guarantees given by the grantor on the amount of cash payments from the public ser- vice. The remuneration is independent of the extent to which the public uses the infrastructure. Where the service is provided using infrastructure rented from a third party and controlled by the grantor, the Group has reco- gnised payments of fixed and variable fees in the IFRIC 12 asset valuation. Financial asset model In service concessions, the operator receives an unconditional right if the grantor gives it a contractual guarantee to pay: ◗ amounts specified or determined in the contract; or ◗ the shortfall, if any – between the amount received from users of the public service and specified or determinable amounts in the contract. Financial assets stemming from the application of the IFRIC 12 interpretation are recorded in the statement of financial position under “Non-current financial assets” detailed in Note 5.5. They are recognised at amortised cost and repaid according to the rents collected. The financial income, calculated on the basis of the effective rate of interest, the equivalent of the project's internal rate of return, is recognised as revenue. Intangible asset model The intangible asset model applies where the operator is paid by users or does not receive any contractual guarantee from the grantor on the amount to be collected. The intangible asset corresponds to the right granted by the grantor to the operator to charge users for the public service. Intangible assets resulting from the application of the IFRIC 12 interpretation are booked in the statement of financial position under the heading “Other intangible fixed assets” detailed in Note 5.2. These assets are amortised straight-line over the term of the contract. Within the framework of the intangible asset model, revenues include: ◗ Turnover as and when assets or infrastructures under construc- tion are completed; ◗ Remuneration relating to the provision of services. Mixed or bifurcation model Application of the financial asset model or the intangible asset model is based on the existence of guarantees of payment given by the grantor. However, certain contracts may include a payment commitment from the grantor which partially covers the investment, with the
  • 41.
    41 2. Consolidated financialstatements balance covered through fees charged to users. In this case, the amount guaranteed by the grantor is recognised as a financial asset and the balance as an intangible asset. 2.4.7 Intangible assets excluding goodwill Intangible assets are shown in the statement of financial position at their acquisition cost less the accumulated amortisation and impairments. Intangible assets mainly consist of patents, licences, trademarks, rights under contracts, pension plan assets, software and ser- vice concession intangible assets as defined by IFRIC 12. When contracts are awarded, the Group capitalises the costs that match the identification criteria, and that are incurred between the date when the contract is awarded and the date when the operation actually starts up. When the Group completes an acquisition, the contractual rela- tionship between the acquired company and its client (the public transport authority) is assessed at fair value and recognised separately from the goodwill as a contractual right satisfying the qualifying criteria of IAS 38 and IFRS 3. Where their useful life is defined, intangible assets are amortised on a straight-line basis over periods corresponding to their expected useful life. The amortisation method and useful lives are revised at least each financial year or when necessary. The estimated useful lives are as follows: ◗ trademarks: between five and fifteen years; ◗ contractual rights: two to twenty years, corresponding to their estimated useful life, allowing for a contract renewal rate when the Group has a high renewal rate in the Cash Generating Unit (CGU) concerned; ◗ software: one to five years; ◗ service concession assets: amortised over the term of the contract (see 2.4.6). 2.4.8 Property, plant and equipment Expenditure on property, plant and equipment by the Group is recognised as an asset at its acquisition cost where it satisfies the following criteria: ◗ it is likely that the future economic benefits relating to the asset will fall to the Group; ◗ the cost of the asset can be reliably measured. Property, plant and equipment are shown in the statement of financial position at their acquisition cost less the accumulated depreciation and impairments. The cost includes the asset’s purchase or production cost and all the costs directly incurred in making them usable. Items of property, plant and equipment cease to be recognised as assets when they are derecognised (through disposal or retirement), or when no future economic benefit is expected from their use or disposal. Any gain or loss arising from the dereco- gnition of an asset from the statement of financial position (the difference between the net income from disposal and the asset’s carrying amount) is recognised in the income statement in the period of its retirement. Given the nature of the Group’s business, the activities of the different subsidiaries do not include holding investment property assets. Subsequent expenditure Subsequent expenditure incurred in replacing property, plant or equipment is recognised under PPE only if it satisfies the fore- going general criteria and qualify as components. Otherwise, this expenditure is recognised in the income state- ment as incurred. Through its public passenger transport activity, the Group incurs multiyear expenditure on heavy maintenance and major servicing operations on its light rail (underground railway, tramway) and passenger rail rolling stock. These are capitalised as assets as a component overhaul, which is subsequently depreciated. Furthermore, expenditure which relates to refurbishments or leads to an increase in productive capacity and modifications bringing new functionality or that extend lifespans are contribu- tions that can be qualified as operator assets. Depreciation The residual values and useful lives of the assets are reviewed and, where applicable, adjusted, annually or whenever lasting changes arise in operating conditions. To date, the residual values at the end of the useful life are regarded as immaterial. Land is not depreciated. Other property, plant and equipment items are depreciated using the straight line method. The esti- mated useful lives are as follows: Buildings 15 - 20 years Equipment and tooling 5 - 10 years Office equipment and furniture 5 - 10 years Vehicles: Cars 5 years Coaches and buses 10 - 15 years Rolling stock 15 - 30 years
  • 42.
    42 2. Consolidated financialstatements Lease agreements As part of its various operations, the Group uses assets made available through lease agreements. These lease agreements are the subject of an analysis based on the situations described and indicators provided in IAS 17 in order to determine whether they are operating lease agreements or finance leases. Finance leases are agreements that transfer almost all of the risks and benefits of the relevant asset to the lessee. All the lease agreements that do not comply with the definition of a finance lease are classified as operating lease agreements. The main indicators examined by the Group to assess whether a lease agreement transfers almost all of the risks and benefits are as follows: the existence of an automatic ownership transfer clause or a transfer option; the conditions under which this clause may be exercised; a comparison between the length of the lease and the estimated life of the asset; the uniqueness of the asset used, and a comparison of the present value of the minimum payments under the agreement with the fair value of the asset. Recognition of finance leases At the point of initial recognition the assets treated as finance leases are posted as tangible assets, with a corresponding finan- cial debt. The asset is recognized at the fair value of the asset at the start of the lease or, if it is lower, the present value of the minimum payments under the lease. Recognition of operating leases Payments made under operating lease agreements are reco- gnised as expenses in the income statement. Government investment grants Government grants wholly or partly covering the cost of investing in an asset are recognised as “Trade payables and other liabili- ties” and systematically written down in the income statement over the useful lives of the assets concerned.   2.4.9 Impairment of capitalised assets and non-financial assets The Group performs systematic impairment tests annually (or more frequently where value impairment is indicated) of goodwill and other intangible assets that have indefinite useful lives, and therefore cannot be depreciated. For property, plant and equipment, and intangible assets with finite useful lives, which are therefore depreciated or amortised, an impairment test is only conducted where impairment is indi- cated. Cash Generating Units (CGUs) are the smallest group of assets generating cash flows largely independently of other asset groups. Such units or groups of units correspond to activities in France, and internationally are mainly classed by country. For testing purposes, the assets are aggregated within CGUs in accordance with IAS 36 “Impairment of Assets”. These tests compare the net carrying amount of assets with their recoverable amount, which is the higher of the fair value less the potential sales costs or the value in use of the asset. In the absence of any fair value observable on an organised market, the recoverable value of the CGUs is determined on the basis of their value in use. The carrying amount of each asset group tested was compared with its value in use defined as the sum of the net cash flows arising from the latest forecasts for each of the CGUs, drawn up using the main assumptions and procedures set out below: ◗ medium-term plan and budgets over a 5-year timeframe, drawn up by Management on the basis of growth and profita- bility assumptions taking account of past performance, fore- seeable developments in the economic environment and the expected development of markets; ◗ extrapolation of the net cash flow of the last year or the average of cash flows over the five previous years by applying the growth assumptions stated in note 5.1; ◗ discounted future value of the cash flows arising from these plans at a rate determined using the weighted average cost of capital (WACC) of the Group. Value impairment is recognised in the income statement, under other non-recurring expense, if the carrying amount of a cash- generating unit or group of such units is greater than its recove- rable amount. The value impairment is allocated first to the goodwill apportioned to the CGU or CGU group tested, then to the other assets of the CGU or CGU group in proportion to their carrying amount. This allocation must not result in the carrying amount of an indi- vidual asset being lower than its fair value, value in use or zero. Impairment losses allocated to acquisition goodwill cannot be reversed, unlike the impairment losses of other property, plant and equipment and intangible assets. In the event of an impairment loss being reversed, the asset’s carrying amount is capped at the carrying amount, net of any depreciation or amortisation without taking into account any value impairment recognised in prior periods. When an impair- ment loss or a reversal of an impairment loss has been reco- gnised, the depreciation charge is adjusted for future periods so that the adjusted carrying amount of the asset, less its residual value, if any, is spread systematically over the remaining useful life.
  • 43.
    43 2. Consolidated financialstatements 2.4.10 Financial assets Purchases and sales of financial assets are accounted for at their transaction date, the date on which the Group is committed to the purchase or sale of the asset. On initial recognition, financial assets are recognised in the statement of financial position at fair value plus the transaction costs directly attributable to the acquisition or issue of the asset (except for the category of finan- cial assets measured at fair value, for which transaction costs are recognised directly in the income statement). Financial assets are derecognised from the statement of financial position to the extent that entitlements to future cash flows have expired or have been transferred to a third party, and the Group has transferred virtually all the risks and benefits or the control of such assets. Financial assets, the maturity (or intended holding period) of which exceeds one year, are recognised under “Non- current financial assets”. On the date of initial recognition, according to the purpose for which the asset is acquired, the Group classifies the financial asset in one of the accounting categories specified by IAS 39, “Financial Instruments: Recognition and Measurement”. The Group does not use the “Held-to maturity investments” category. Financial assets at fair value, recognised in profit or loss These are financial assets acquired by the Group with the intention of selling them in the short term. Derivative financial instruments are also classified as held for trading unless they are designated effective hedging instru- ments. They are measured at fair value and their subsequent fair value changes are recognised in the income statement. Loans and receivables Loans and receivables are non-derivative financial assets, the payment of which is fixed or determinable and is not listed on a regulated market. These assets are recognised at their fair value plus the directly attributable costs of transaction and are then measured at depreciated cost by the effective interest rate method. An impairment loss is recognised whenever the esti- mated recoverable amount is below the carrying amount. This category includes operating receivables, deposits and guarantees, loans and concession financial assets. Available for sale (AFS) financial assets These are non-derivative financial assets designated as being available for sale, or not belonging to the other categories. They are measured at their fair value in the statement of financial posi- tion; changes in value are recognised in equity. When available for sale financial assets are sold, or if there is an objective indi- cation of impairment of these assets, any changes in fair value that have been recognised directly in equity are transferred to the income statement. For listed securities, fair value is equal to market price; for unlisted securities, reference is made to recent arm’s-length transactions made between informed and willing parties, or to a technical measurement based on reliable, objective information consistent with the other estimates used by other market operators or using discounted cash flow analysis. However, when the fair value of a security cannot reasonably be estimated, in the last resort it is carried at historical cost. This category consists mainly of non-consolidated shareholdings. Impairment of financial assets Impairment is recognised on a financial asset or group of financial assets where there is an objective indication of impairment arising from one or more events that have occurred since the initial recognition of the asset, and such impairing event has an impact on the estimated future cash flows from the financial asset or group of financial assets, and if its carrying value is higher than its estimated recoverable value. 2.4.11 Inventories Inventories consist mainly of consumables and miscellaneous goods or supplies used for the maintenance and upkeep of vehicles or intended for resale. These inventories are valued at purchase cost. Impairment is recognised to reduce the purchase cost (determined using the weighted average cost (WAC) method or the First-in, First-out (FIFO) method) to the net realisable value if lower. Pursuant to IAS 2, the net realisable value is the estimated sale price in the normal course of business, less the estimated cost for completion and realisation of the sale. 2.4.12 Trade receivables and other debtors Trade receivables and receivables from other debtors are initially recognised at their fair value which, in most cases is their nomi- nal value, given the generally short payment times. The carrying amount is subsequently measured where required at an amor- tised cost using the effective interest rate method, less any impairment losses. If there is an objective indication of impairment or a risk that the Group may be unable to collect all the contractual amounts (principal plus interest) on the date set in the contractual payment schedule, an impairment loss is recognised in the income statement. This allowance is equal to the difference between the carrying amount and the estimated recoverable future cash flows, discounted at the original effective rate of interest. 2.4.13 Cash and cash equivalents This item includes cash, sight deposits and other short-term
  • 44.
    44 2. Consolidated financialstatements deposits as well as other easily convertible liquid instruments with negligible risk of a change in value, maturing less than three months from the date of acquisition. 2.4.14 Corporate income tax Keolis S.A. and its French subsidiaries are part of the tax peri- meter of its parent company GROUPE KEOLIS S.A.S. Other tax consolidation regimes also exist in Europe and in the USA. The effect of these regimes is recognised in the income statement. The income tax expense or income includes the current tax expense or income and the deferred tax expense or income. Tax is recognised in profit for the year unless it relates to items that are directly recognised under equity, in which case, the tax is recognised under equity. Current tax is the estimated amount of tax due on the taxable profit for the period. It also includes adjustments to the amount of tax payable in respect of previous periods. Deferred tax is calculated for each individual entity according to the balance sheet approach, on the temporary differences between the carrying amount of the assets and liabilities and their taxation base, including assets of which the Group has possession under finance lease agreements. Measurement of deferred tax assets and liabilities depends on whether the Group expects to recover or to pay the carrying amount of the assets and liabilities, under the variable carry- forward method, using the rates of taxation that were adopted or virtually adopted at the reporting date. A deferred tax asset is only recognised or maintained as an asset to the extent that the Group is likely to benefit from future taxable profits to which the related deductible temporary difference may be imputed. Deferred tax assets and liabilities are not discounted. Deferred tax assets and liabilities are offset in each taxable entity when it recovers the asset and settles the liability on the same due date, subject to the following conditions being met: ◗ legally enforceable right to offset, ◗ intention to settle, ◗ schedule of payments. Deferred tax liabilities are recognised for all taxable temporary differences, with the exception of certain differences between the values of the Group's proportionate interests in the net assets of subsidiaries, joint ventures and associates and their tax values. This exception applies in particular to the income of subsidiaries yet to be distributed, should distribution thereof to shareholders generate taxation; if the Group has decided not to distribute profits retained by the subsidiary in the foreseeable future, no deferred tax liabilities are recognised. 2.4.15 Financial debt and long term borrowings All borrowings are initially recognised at fair value, less the related borrowing costs. Thereafter, they are recognised at amortised cost, using the effective interest rate method, with the difference between the cost and the redemption value recognised in the income statement over the term of the borrowings. The effective interest rate is the rate used to obtain the original carrying amount of a loan by discounting the future cash inflows or outflows over the loan’s term. The original carrying amount of the loan includes the transaction costs of the operation and any issuance premiums. When a debt is reimbursed early, any non-amortised costs are recognised as expenses. 2.4.16 Derivative financial instruments The Group uses derivative financial instruments to manage exposure to financial market risks resulting from its operational, financial and investment activities: ◗ Interest rate risk; ◗ Foreign exchange risk; ◗ Commodities risk. The derivative financial instruments are measured and reco- gnised at fair value in the statement of financial position on the date they are established, then on each financial year end date. Fair value is measured by using standard valuation methods and is based on the mid-market conditions commonly used in the markets. The market data used is Level 2 data, as described in IFRS 13. The treatment of the gains and losses under the fair value revalua- tion depends on whether or not the derivative instrument is consi- dered a hedging instrument and the nature of the hedged item. The changes in fair value of derivative financial instruments that are not eligible for hedge accounting are recognised under finan- cial income/(expense). Certain derivative financial instruments are eligible for one of the three hedge accounting categories defined in IAS 39: ◗ Fair value hedge; ◗ Cash flow hedge; ◗ Net investment hedge. They are recognised in accordance with hedge accounting rules. The criteria to apply hedge accounting are mainly: ◗ general hedging documentation that describes the Group's exposure to the various financial risks and its hedging strategy, ◗ a hedging relationship clearly established on the date on which each derivative financial instrument is established,
  • 45.
    45 2. Consolidated financialstatements ◗ the use of effectiveness testing to demonstrate the effectiveness of the hedging relationship prospective to the date of establish- ment, and retrospective to each financial close. This effective- ness must be reliably measured and fall within 80% and 125%. Interest rate, foreign exchange and commodity derivative finan- cial instruments are entered into with first-class bank counter- parties in accordance with the Group's counterparty risk management policy. Consequently, the counterparty risk can be regarded as negligible. Interest rate risks relating to the variable rate portion of its financial debt The Group's interest rate risk exposure results from its financial debt. The Group covers this risk by using derivative financial instruments. The objective of the risk management is to protect the Group's financial income/(expense) from an increase in interest rates, while taking advantage of a decrease in rates to the greatest extent possible. The interest rate hedging policy implemented consists in favou- ring fixed rate derivative financial instruments. The management horizon adopted is usually a rolling five years, but this can be greater dependent upon the hedging requirement. The derivative financial instruments which the Group uses are standard, liquid and available on the market, namely: ◗ swaps; ◗ cap calls; ◗ sales of caps to unwind an existing cap or to realise a cap spread; ◗ floor puts if tied with cap calls to create a symmetrical or asym- metrical collar; ◗ floor calls, in particular to buy back floors that constitute asym- metrical collars; ◗ swaption calls; ◗ swaption puts if tied with calls to constitute swaption collars. Derivative financial instruments eligible for hedge accounting are recognised under cash flow hedges. The derivative financial instruments that are not eligible are recognised under trading. Changes in the intrinsic value of derivative financial instruments recognised under cash flow hedges are entirely recognised within equity (OCI - other comprehensive income). The other items are recognised as financial income/(expense): ◗ changes in fair value of derivative financial instruments not eli- gible for hedge accounting (for example, the asymmetrical portion of collars); ◗ changes in the time value of all derivative financial instruments; ◗ option premiums. Foreign exchange risk The Group has put in place intra-group loans denominated in foreign currency and recognised in current accounts. In order to cover the resulting foreign exchange risk, the Group uses deri- vative financial instruments which allow it to fix the exchange rate of these intra-group loans. The Group also makes net investments in the capital of its foreign subsidiaries in local currency. To cover the foreign exchange risks engendered by these investments, the Group uses derivative financial instruments in controlled amounts. Management’s objective is to protect the balance sheet values of these invest- ments in local currency. The foreign exchange hedging policy implemented to achieve this objective consists of maintaining a reference exchange rate defined for the year. The derivative financial instruments used by the Group are stan- dard, liquid and market-available: ◗ forward and futures sales and purchases; ◗ foreign exchange swaps; ◗ call options; ◗ put options in combination with call options to provide sym- metric or asymmetric collars. Most of the derivative financial instruments held by the Group are eligible for net investment hedge accounting as described in IAS 39. The derivative financial instruments that are not eligible are recognised under trading. Changes in the intrinsic value of derivative financial instruments recognised under net investment hedges are entirely recognised within equity (OCI). The other items are recognised as financial income/(expense): ◗ changes in fair value of derivative financial instruments not eli- gible for hedge accounting (for example, the asymmetrical portion of collars); ◗ changes in the time value of all derivative financial instruments; ◗ option premiums. Commodities price risks Within the scope of its activities, the Group is exposed to a risk in the fluctuation of the price of certain commodities, in particu- lar diesel. The diesel price fluctuation risk is generally hedged using price indexation included in the contracts signed by Keolis S.A. and its subsidiaries with their clients. For its diesel purchases, the Group nonetheless bears the price risk until it is passed on to its customers. This time lag, when it exists, usually lasts only a few months, and up to a maximum of twenty-four months. A hedging policy has been set up to cover this partial exposure.
  • 46.
    46 2. Consolidated financialstatements Management’s objective for commodity risk management is to defend the prices indexed under the contracts. The Group covers this commodities risk using standard, liquid and market-available derivative financial instruments, namely: ◗ swaps; ◗ cap calls; ◗ cap puts to unwind an existing cap or to realise a cap spread; ◗ floor puts if tied with cap calls to create symmetrical or asym- metrical collars; ◗ floor calls, in particular to buy back floors that constitute asym- metrical collars. Derivative financial instruments eligible for hedge accounting are recognised under cash flow hedges. The derivative financial instruments that are not eligible are recognised under trading. Changes in the intrinsic value of derivative financial instruments recognised under cash flow hedges are entirely recognised within equity (OCI). The other items are recognised as financial income/(expense): ◗ changes in fair value of derivative financial instruments not eli- gible for hedge accounting (for example, the asymmetrical portion of collars); ◗ changes in the time value of all derivative financial instruments; ◗ the contango/backwardation component, corresponding to the price difference between the forward price for swaps (or exercise price for options) and the spot price; ◗ option premiums. 2.4.17 Provisions Provisions for pension and post-employment commitments (IAS19 revised) The Group offers its employees various fringe benefits while they are in employment or after employment. These benefits arise under the legislation applicable in certain countries and under contractual arrangements concluded by the Group with its employees, and are either defined contribution plans or defined benefit plans. (a) Defined contribution plans Defined contribution plans are characterised by payments to organisations that discharge the employer from any subsequent obligation, with the organisations taking responsibility for paying employees their entitlements. Hence, once the contributions are paid, no liability is reported in the Group’s financial statements. (b) Defined benefit plans Defined benefit plans refer to plans providing post-employment benefits other than defined contribution plans. The Group has a duty to accrue provisions for the benefits to be paid to serving members of its staff, and to pay the benefits of former members of its staff. In substance, the actuarial and investment risks lie with the Group. These plans mainly concern the following: ◗ pension commitments: pension annuity plans, retirement gra- tuities, other retirement commitments and additional pension benefits; ◗ other long term benefits: long service awards. Description of commitments under defined benefit plans Apart from ordinary, statutory schemes, the Group provides, according to country and local legislation, retirement gratuity schemes (France), defined benefit pension schemes (United Kingdom and Canada) and pensioners’ health benefit schemes (Canada and USA). In France, retirement gratuities paid to the employee on leaving employment are determined according to the national collective labour agreement or the company agreement applying in the business. The following are the two main collective labour agree- ments applied within the Group: ◗ “Convention collective des transports publics urbains” (CCN_3099) – the national collective labour agreement for urban public transport; ◗ “Convention collective des transports routiers” (CCN_3085) – the national road-haulage collective labour agreement. These schemes are partly financed by insurance policies. Their value is measured over the average term of the policies (20 years) except in the case of Keolis S.A., which is measured on a per- petuity basis. Annual actuarial evaluations of the commitments of the defined benefit schemes are carried out each year end primarily by inde- pendent actuaries. Commitments for pensions, additional pension benefits and retirement gratuities are measured using a method that takes account of the projected final end-of-career salaries (termed the Projected Unit Credit Method) on an individual basis, which is based on assumptions of discount rates and expected long- term yields from the funds invested for each country, and on assumptions regarding life expectancy, staff turnover, trends in pay, annuity revaluations and the discounted value of payable sums. The specific assumptions for each plan take local econo- mic and demographic factors into account. The value entered in the statement of financial position under pro- visions“pensionsandotheremploymentbenefits”isthedifference between the discounted value of the future obligations and the fair value of the pension plan assets intended to cover them. Where the result of this calculation is a net commitment, an obligation is recognised as a liability in the statement of financial position.
  • 47.
    47 2. Consolidated financialstatements When bids are won in France or abroad, the asset representing pension rights and all other employee benefits recognised at the start of the franchise is determined on the basis of the amount of pension liabilities and other employee benefits over the esti- mated life of the contract. Actuarial gains/losses relating to post-employment benefits resulting from experience and changes in actuarial assumptions are recognised directly in equity in the year in which they are incurred and are offset against the increase or decrease of the obligation. They are set out in the statement of comprehensive income. In the income statement, the cost of service earned during the financial year is included in the operating profit. The interest cost in respect of the discounting of pensions and similar obligations, and the income relating to the expected yields from the pension plan assets, are recognised under financial income and expense. The actuarial calculations for pension and similar commitments are mainly performed by independent actuaries. Long service medals are valued on the same basis as pension commitments, with the exception of the recognition of actuarial gains and losses. Actuarial gains and losses are recognised in the income statement. Furthermore, the Group has implemented a long-term employee retention scheme. Other types of provisions Provisions are accrued where at the end of the reporting period there is a present legal or implicit obligation towards third parties arising from a past event and there is a probability that an outflow of resources embodying economic benefits will be required to settle this obligation and a reliable estimate can be made of the amount. In the context of its activity, the Group is generally subject to a contractual obligation to carry out multiyear heavy maintenance and major servicing operations on facilities managed under a public service agreement. The resulting maintenance and repair costs are analysed in accordance with IAS 37 on provisions and, where applicable, provisions are accrued for heavy maintenance and major servicing and also for lossmaking contracts in the event that the unavoidable costs incurred to meet the contrac- tual obligation are greater than the economic benefits of the contract. In cases of restructuring, an obligation is accrued in so far as the restructuring has been announced and is the object of a detailed formalised plan or has been started prior to the reporting date. Provisions due in more than one year are discounted whenever the impact is material. 2.4.18 Payments in shares and similar payments The Group has no share option plans or share purchase war- rants for the benefit of its members of staff. 2.4.19 Trade payables and other accounts payable Trade payables and other accounts payable are measured at their fair value at initial recognition, which in most cases is their nominal value, and otherwise at the amortised cost. Short-term payables are recognised at their nominal amount unless dis- counting at the market rate would have a material impact. In the event of long payment delays, the suppliers’ debt is dis- counted. Other payables include deferred revenues, corresponding to income received for services not yet provided, and investment grants not yet credited in the income statement. 2.4.20 Revenue and other business income Revenue and other business-related income are measured at the fair value of the consideration received or accrued. They are measured net of discounts and commercial benefits given, where the service has been provided. No income is reco- gnised where there exists significant uncertainty as to the reco- verability of the consideration receivable or the costs incurred or to be incurred in relation to the service, and where the Group remains involved in managing the income. The revenue from urban passenger transport companies is recognised according to the terms of the contract signed with the public transport authority, taking account of all additional clauses and any vested rights (indexation clauses, etc). The same applies for revenue from intercity passenger transport companies, and other activities not under contract, recognised according to the services provided. Revenues include fees from value added services arising from the Group’s knowhow. These activities (excluding transportation) mainly relate to the management of airports and bike rental. Other business-related income covers fees for services consis- ting mainly of revenues classified by the Group as incidental, as well as the remuneration of concession financial assets. 2.4.21 Other operating expenses Since they are a recurrent feature of the activity, losses or gains on sales of transport equipment are recognised on a separate line, and included in profit from continuing operations.
  • 48.
    48 2. Consolidated financialstatements 2.4.22 Other operating income Other operating income mainly comprises the CICE (tax credit for competitiveness and employment), which was created to help companies finance their competitiveness, in particular through investment, research, innovation, recruitment, prospec- tion of new markets, environmental transition and replenishment of their working capital. It applies to remuneration not exceeding two and a half times the minimum wage that the companies pay their employees in the course of the calendar year. In 2015, the tax credit rate remained unchanged at 6%. The CICE is deducted from corporate income tax due for the year during which the remuneration used for the calculation of the tax credit was paid. Any non-deducted credit is treated as a receivable from the State and can be used to pay tax due in the three years following that in which the credit was earned. At the end of this period, any remaining non-deducted amount is reim- bursed to the company. The Group holds the view that the CICE is a type of public sub- sidy within the application of IAS 20, insofar as it is used for financing working capital related expenditure. The CICE is reco- gnised under operating subsidies in the line “Other operating income” of the consolidated income statement. 2.4.23 Recurring operating profit Recurring operating profit corresponds to the whole of the expenses and income arising from the Group’s recurring opera- ting activity before financing activities, the earnings of associates, activities discontinued or being sold and taxation. 2.4.24 Operating profit or loss Operating profit includes recurring operating profit and all tran- sactions not directly related to the normal conduct of business, but that cannot be directly attached to any other item in the income statement. Income and expenses, charges to depreciation and provisions on non-recurring items include all non-recurring operations where costs are significant: this applies in particular to offensive bids, restructuring costs, disposal gains or losses on assets other than transport equipment, the amortisation of contractual rights and startup costs in a new country or zone, and to other items that are by their nature non-recurring. Effects of changes in scope recognised directly in income include: ◗ direct acquisition costs in the case of a takeover; ◗ effects of revaluations, at fair value on the acquisition date, of non-controlling interests previously acquired in the case of an acquisition in stages; ◗ subsequent earn-outs; ◗ profit or loss from divestments of holdings which lead to a change in the method of consolidation as well as, where appli- cable, the revaluation effects of retained non-controlling inte- rests. 2.4.25 EBITDA calculation EBITDA is calculated based on operating profit/(loss), plus or minus the profit or loss on asset disposals, the amounts repre- senting depreciation and amortisation, increases and reversals of provisions and the share of grant income released. Recurring EBITDA corresponds to EBITDA less material non- recurring items. 2.4.26 Financial income / (expense) Financial expenses include interest on borrowings and financial debt calculated using the effective interest rate method, the cost of early loan repayments or of cancelling credit lines, the financial interest not directly attributable to the operating margin and the financial cost of discounting non-current liabilities. Financial income includes income from deposits of cash or cash equivalents and dividends received from non-consolidated com- panies. Other financial income and expense include net foreign exchange gains and losses, bank commissions on credit transactions booked as an expense and their rebilling as income, changes in the fair value of derivative financial instruments when they are to be recognised in the income statement and are recognised respectively as financial income or expenses on transactions, with the exception of changes in the fair value of hedging deri- vatives which are recorded on the same line as the transaction hedged within operating profit. Therefore, any change in the fair value of derivatives, when they are not eligible for hedge accoun- ting, and the change in value of the ineffective portion for cash flow hedging are recognised in the financial result. All interest on borrowings is recognised as a financial expense as and when incurred. 2.4.27 Changes made to comparative periods The only change in accounting principles to be noted is that presented under paragraph 2.2 relating to the application of the IFRIC 21 Interpretation “Levies” as of 1 January 2015.
  • 49.
    49 2. Consolidated financialstatements 3 • Highlights of financial year 2015 Acquisition of ATE in Australia On 1 May 2015, Keolis Downer (51%-owned by Keolis and 49% by Downer EDI), Australia’s largest light rail operator, acquired Australian Transit Enterprises (ATE), one of the country’s biggest bus operators. Through this acquisition, Keolis Downer has become the leading privately-owned multi-modal public transport operator in Australia. Established in 1974 as a family business, ATE has since conti- nued to grow, generating revenue of approximately AUD 190 million (€136 million) in 2014. Headquartered in Brisbane, ATE operates a fleet of nearly 1,000 buses and runs urban, inter-city and school services in three states: South Australia (Adelaide), Western Australia (Perth) and Queensland (Brisbane). The com- pany currently employs 1,600 people. As the 5th largest private bus operator in Australia, ATE consists of 4 business divisions: Path Transit, providing timetabled route and school bus services in the suburbs of Perth (Western Australia); Southlink, providing timetabled route and school bus services in metropolitan Adelaide (South Australia). LinkSA, providing timetabled route, school, special bus and dial- a-ride services within 100 km of Adelaide (South Australia); Hornibrook, providing timetabled route and school bus services in the suburbs of Brisbane (Queensland).
  • 50.
    50 2. Consolidated financialstatements 4 • Notes to the consolidated income statement 4.1 Staff costs Staff costs 4.3 Operating profit Average number of employees (€ million) 31/12/2015 31/12/2014 Wages and social charges (2,367.8) (2,173.6) Taxes on remuneration (61.4) (61.1) Other staff expenses(1) (391.4) (224.1) Total (2,820.6) (2,458.8) 31/12/2015 31/12/2014 Managers 2,012 1,769 Supervisory and technical staff 6,165 5,919 Clerical and manual employees, drivers 45,089 42,143 Total 53,266 49,831 The average number of staff in the companies acquired during the period is averaged over the period. (1) Other staff expenses include incentive schemes and profit sharing. (1) This item includes negative goodwill in Belgium amounting to €5.7 million in 2015 and €5.3 million of depreciation of goodwill in the USA in 2014. (€ million) 31/12/2015 31/12/2014 Recurring operating profit 56.2 67.7 Non-recurring costs of offensive bids (12.4) (15.6) Profit/(loss) on non-recurring fixed asset disposals 0.5 1.0 Amortisation of contractual rights and trademarks(1) (1.6) (9.4) Other non-recurring items (5.7) (9.3) ◗ Net reorganisation expenses (8.5) (6.0) ◗Change in provisions for contract losses 1.4 3.3 ◗ Other 0.2 (6.6) Total non-recurring items (19.2) (33.2) Operating profit before investments under equity method 37.0 34.5 4.2 Other operating income Under the CICE, the Group received €48.0 million in 2015, compared to € 48.1 million in 2014.
  • 51.
    51 2. Consolidated financialstatements 4.4 EBITDA calculation 4.5 Financial income / (expense) (€ million) 31/12/2015 31/12/2014 Operating profit 37.0 34.5 Net depreciation and other provisions charged 187.9 163.5 Depreciation and provisions on non-recurring items 1.6 11.8 ◗ Including amortisation of contractual rights and trademarks 7.3 4.1 ◗ Including Belgium negative goodwill and KTA goodwill depreciation (5.7) 5.3 Amortisation of grants received (6.3) (5.4) Reversals of operating provisions utilised on recurring items (9.2) (10.3) Reversals of provisions utilised on non-recurring items (2.3) (4.2) Profit/(loss) on non-recurring fixed asset disposals (0.5) (1.0) Profit/(loss) on fixed asset disposals (1.3) (1.4) EBITDA 206.8 187.4 Non-recurring income and expense (1) 20.5 26.6 Recurring EBITDA 227.2 213.9 (1) Non-recurring income and expense include significant offensive bid costs, major restructuring expenses and other significant exceptional items. (€ million) 31/12/2015 31/12/2014 Net cost of financial debt (12.3) (8.7) ◗ of which Cost of gross financial debt (13.6) (9.9) ◗ of which Income from cash and cash equivalents 1.3 1.2 Other financial income and charges 7.1 7.1 Other financial charges (15.0) (13.5) ◗ of which foreign exchange impact (5.5) (1.0) Financial income / (expense) (20.2) (15.1) (€ million) 31/12/2015 31/12/2014 Govia (UK) 12.4 5.7 First / Keolis Transpennine (UK) 9.4 10.1 Other associates (France) 0.8 0.1 Other associates (international, excluding UK) (0.1) - Total joint ventures and associates 22.4 16.0 4.6 Share in net profit for the year from investments under the equity method
  • 52.
    52 2. Consolidated financialstatements 4.7 Taxation The Group has opted to present a reconciliation of its effective rate at 34.43%, rather than 38%, which is the 2015 rate including the additional contribution of 10.7% (2013 Finance Act). In reality, this rate of 38% will not apply to the Group because the impact of the reversal of deferred income taxes is insignificant in the period and currently this measure is only temporary. The reconciliation between the legal rate of taxation in France and the effective rate is as follows: Unrecognised deferred tax assets in 2015 mainly relate to North America and Germany. Deferred tax included within non-current assets and liabilities breaks down as follows: (€ million) 31/12/2015 31/12/2014 Current tax expense (34.5) (35.3) Tax payable for the period (34.2) (35.9) Adjustments in respect of prior years (0.3) 0.6 Deferred tax income (0.3) 14.6 Deferred tax for the period (0.3) 17.7 Impairment loss on deferred tax asset - (3.1) Tax expense for the year (34.8) (20.6) 31/12/2015 31/12/2014 In % In € million In % In € million Profit for the year 4.4 14.8 Profit/(loss) from associates (22.4) (16.0) Taxation 34.8 20.6 Profit before tax and before profit/loss from associates 16.8 19.4 Legal rate of taxation in France 34.43% (5.8) 34.43% (6.7) French / foreign taxation rate differentials -13.08% 2.2 3.59% (0.7) Effect of reduced rates and changes in tax rates 5.34% (0.9) -4.73% 1.0 Adjustment in respect of tax for prior years 1.60% (0.3) -3.18% 0.6 Other permanent differences 39.80% (6.7) 17.13% (3.3) Crédit d’Impôt Compétitivité Emploi -98.54% 16.5 -85.27% 16.6 Effect of direct taxation (CVAE) 47.02% (7.9) 37.69% (7.3) Unrecognised deferred tax assets 190.81% (31.9) 106.44% (20.7) Effective rate of taxation 207.39% (34.8) 106.10% (20.6) (€ million) 31/12/2015 31/12/2014 Deferred tax assets 75.4 77.0 Less than one year 14.7 9.2 More than one year 60.7 67.9 Deferred tax liabilities (68.2) (43.7) Less than one year (15.2) (7.8) More than one year (53.0) (35.9)
  • 53.
    53 2. Consolidated financialstatements Unused losses amounted to €508 million at 31 December 2015 of which €367.7 million were not recognised, taking into account assumptions on the usability of these losses within available time limits, which would represent a deferred tax asset of €114.1 million. At each financial year end, the Group assesses for each tax entity the probability of its having taxable profits against which to offset its deferred tax assets or to use available unrecognised tax cre- dits. In making this assessment, the Group takes account of, among other factors, past and present taxable profit, and the companies’ prospects for making future taxable profits. The change in the net deferred taxes recorded in the statement of financial position breaks down as follows: (€ million) Net position Opening balance on 1 January 2015 33.3 Recognised in equity - Recognised in profit for the year (0.3) Effect of consolidation scope changes (27.3) Foreign exchange translation difference and other movements 1.4 Closing balance on 31 December 2015 7.2 (€ million) Net position Opening balance on 1 January 2014 14.8 Recognised in equity 7.6 Recognised in profit for the year 14.6 Effect of consolidation scope changes (5.2) Foreign exchange translation difference and other movements 1.5 Closing balance on 31 December 2014 33.3 Net deferred taxes by type are as follows: (€ million) 31/12/2015 31/12/2014 Purchase accounting asset revaluations (52.2) (33.2) Staff benefits 45.8 40.7 Tax losses 33.7 34.5 Other (20.1) (8.5) Closing balance on 31 December 7.2 33.3
  • 54.
    54 2. Consolidated financialstatements 5 • Notes to the consolidated statement of financial position 5.1 Goodwill Changes in carrying amount (€ million) France Continental Europe Australia UK North America Total At 1 January 2015 95.6 106.3 - - 31.8 233.6 Acquisitions (1) 0.4 0.1 38.8 - - 39.3 Disposals - - - - - - Impairment loss for the period - - - - - - Foreign exchange translation differences and others (3.0) (2.2) (1.9) - 1.5 (5.6) At 31 December 2015 92.9 104.2 36.9 - 33.3 267.3 Of which gross value 93.3 104.2 37.2 - 43.7 278.4 Of which accumulated amortisation and impairment charges (0.4) - (0.2) - (10.4) (11.1) (€ million) France Continental Europe Australia UK North America Total At 1 January 2014 84.6 103.4 - - 34.0 222.1 Acquisitions 12.1 5.2 - - - 17.3 Disposals - - - - - - Impairment loss for the period - - - - (5.3) (5.3) Foreign exchange translation differences and others (1.2) (2.3) - - 3.1 (0.4) At 31 December 2014 95.6 106.3 - - 31.8 233.6 Of which gross value 96.0 106.3 - - 41.8 244.1 Of which accumulated amortisation and impairment charges (0.4) - - - (10.0) (10.5) Impairment testing The main assumptions made for impairment tests are as follows: Discount rate The discount rate used is based on the average cost of capital reflecting current market assessments of the time value of money and the risks specific to the tested asset. The average weighted cost of capital has been determined by a combination of two methods: the “Capital Asset Pricing Model” (CAPM) method and the average weighted cost of capital method for comparable listed companies. Taking into account these factors, the cost of capital used to discount future cash flows was set at 4.8% in 2015 versus 5.6% in 2014. These discount rates are rates after tax applied to cash flows after tax. Use thereof results in recoverable amounts identical to those obtained by using pre-tax rates applied to non-taxable cash flows, in accordance with IAS 36. Long-term growth rates The growth rate applied to the main cash-generating units or groups thereof was 2%. Sensitivity of recoverable amounts Sensitivity tests on groups of cash-generating units were carried out by varying the long-term growth rates or the WACC (weighted average cost of capital). A 0.5 point decrease in the indefinite growth rate leaves a positive margin between the value in use and the carrying amount of cash-generating units. A 0.5 point increase in the discount rate leaves a positive margin between the value in use and the carrying amount of cash- generating units. (1) The additional goodwill recorded in 2015 arises principally from the acquisition of ATE on 1 May 2015. The assessment of assets and liabilities at the date of acquisition is currently underway and will be completed within one year.
  • 55.
    55 2. Consolidated financialstatements 5.2 Other intangible assets (€ million) Software Trademarks Contractual rights Other Total At 1 January 2015 34.3 4.1 36.6 74.6 149.7 Acquisitions 13.8 - - 35.9 49.7 Assets disposed of and scrapped (9.8) - - (1.4) (11.2) Amortisation (17.1) (0.3) (7.7) (17.4) (42.6) Changes in reporting scope (0.1) - 68.8 - 68.7 Foreign exchange translation differences and other movements 11.7 0.5 (1.6) (21.0) (10.4) At 31 December 2015 32.7 4.3 96.1 70.7 203.9 Of which gross value 107.0 5.9 124.2 166.9 404.0 Of which cumulative depreciation and impairment losses (74.3) (1.6) (28.1) (96.2) (200.2) (€ million) Software Trademarks Contractual rights Other Total At 1 January 2014 29.7 3.9 32.8 52.6 119.0 Acquisitions 14.7 - 0.2 25.7 40.5 Assets disposed of and scrapped - - - (0.1) (0.1) Amortisation (16.0) (0.3) (3.7) (14.7) (34.7) Changes in reporting scope - - 6.1 - 6.2 Foreign exchange translation differences and other movements 5.9 0.5 1.2 11.2 18.8 At 31 December 2014 34.3 4.1 36.6 74.6 149.7 Of which gross value 102.8 5.4 56.9 153.5 318.6 Of which cumulative depreciation and impairment losses (68.5) (1.3) (20.3) (78.9) (168.9)
  • 56.
    56 2. Consolidated financialstatements 5.3 Property, plant and equipment (€ million) Land Developments Buildings Equipment andtooling Transport equipment PPEunder construction Other Total At 1 January 2015 25.5 47.0 29.2 426.4 24.9 67.5 620.5 Acquisitions 2.4 11.3 10.1 123.3 9.0 18.4 174.6 Assets disposed of and scrapped (1.8) (3.1) (1.4) (20.8) (0.7) (6.4) (34.1) Depreciation (1.7) (9.2) (8.7) (92.6) 0.1 (16.7) (128.8) Changes in reporting scope (1) 4.9 0.1 - 62.4 - 2.2 69.4 Foreign exchange translation differences and other movements 8.5 32.0 4.8 (9.4) (17.9) (8.3) 9.7 At 31 December 2015 37.8 78.1 34.1 489.2 15.5 56.7 711.4 Of which gross value 45.2 152.5 95.7 1,133.4 15.5 156.2 1,598.5 Of which cumulative depreciation and impairment losses (7.4) (74.4) (61.5) (644.2) - (99.5) (887.1) (1) Mainly relates to contractual rights acquired in Australia (ATE). (€ million) Land Developments Buildings Equipment andtooling Transport equipment PPEunder construction Other Total At 1 January 2014 25.6 42.6 30.2 379.1 20.4 60.2 558.1 Acquisitions 3.8 10.7 6.7 116.3 11.8 24.5 173.7 Assets disposed of and scrapped (3.0) (0.9) (0.3) (26.3) (0.4) (1.1) (31.8) Depreciation (1.0) (6.9) (7.8) (84.6) - (16.6) (116.9) Changes in reporting scope - 0.7 - 35.3 - 1.0 37.0 Foreign exchange translation differences and other movements - 0.9 0.4 6.6 (7.0) (0.5) 0.5 At 31 December 2014 25.5 47.0 29.2 426.4 24.9 67.5 620.5 Of which gross value 30.8 110.6 85.9 1,048.3 25.0 154.2 1,454.8 Of which cumulative depreciation and impairment losses (5.3) (63.6) (56.6) (621.9) (0.1) (86.7) (834.3) Finance leases At 31 December 2015, finance leased assets included within assets in the statement of financial position comprised: Schedule of minimum finance lease payments (€ million) Transport equipment Land and Buildings Total Gross value 276.1 7.0 283.1 Depreciation (143.3) (3.9) (147.2) Total finance leased fixed assets 132.9 3.1 136.0 (€ million) 1 year 1 to 5 years 5 years Total Principal 26.1 77.9 19.6 123.6 Interest 5.3 7.7 4.5 17.5 Finance lease payments 31.4 85.6 24.1 141.1
  • 57.
    57 2. Consolidated financialstatements 5.4 Investments under the equity method The Group holds several investments in joint ventures and associates, notably in the United Kingdom, consolidated under the equity method. The changes in the value of these investments during the financial year can be explained by the items below: The financial elements relating to significant joint ventures are presented below at 100% of their values: (€ million) Goviasubsidiaries First/Keolis Transpennine Others Totalassociates Goviasubsidiaries First/Keolis Transpennine Others Totalassociates Non-current assets 38.1 1.8 NA NA 47.9 2.8 NA NA Net WCR 31.8 25.4 NA NA 7.5 29.2 NA NA Equity 67.8 27.3 NA NA 55.4 32.0 NA NA ◗ Incl. Net profit 35.5 20.8 NA NA 16.4 22.5 NA NA Non-current liabilities 2.0 (0.1) NA NA - - NA NA Net assets 67.8 27.3 NA NA 55.4 32.0 NA NA Percentage owned 35% 45% - - 35% 45% - - Reconciliation of financial data with value of investments under equity method: - - - - - - - - Group share of net assets 23.7 12.3 3.4 39.4 19.4 14.4 2.4 36.2 Goodwill - - - - - - - - Other - - - - - - - - Net book value of investments 23.7 12.3 3.4 39.4 19.4 14.4 2.4 36.2 (€ million) 31/12/2015 31/12/2014 At 1 January 36.2 23.5 Net profit attributable to Group 22.4 16.0 Depreciation - - Profit/(loss) from investments under equity method 22.4 16.0 Change in fair value affecting equity (1) 13.1 8.4 Foreign exchange translation differences (1.2) 1.0 Dividends paid (31.6) (12.9) Changes in consolidation scope other 0.6 0.2 At 31 December 39.4 36.2 (1) Changes in fair value affecting equity relate to actuarial gains and losses within the defined benefit pension schemes of the Railways Pension Scheme which are a function of franchise length. 31/12/201431/12/2015
  • 58.
    58 2. Consolidated financialstatements 5.5 Current and non-current financial assets The securities available for sale relate to investments in companies which are not consolidated. The changes in concession financial assets in the period include new acquisitions for €22.3 million and reimbursements for €8.1 million. (€ million) Loansand receivables Securitiesavailable forsale Depositsand guarantees Derivativeassets Concessionfinancial assets Total At 31 December 2015 Gross value 7.5 37.8 29.4 0.2 125.4 200.2 Impairment - (0.3) - - - (0.3) Net value 7.5 37.5 29.4 0.2 125.4 199.9 ◗ Less than one year 0.2 - 18.5 0.2 - 18.8 ◗ More than one year 7.3 37.5 10.8 - 125.4 181.0 5.6 Inventories (€ million) 31/12/2015 31/12/2014 Gross inventories 86.4 82.5 Provisions (4.4) (4.4) Net inventories 82.0 78.0 (€ million) Loansand receivables Securitiesavailable forsale Depositsand guarantees Derivativeassets Concessionfinancial assets Total At 31 December 2014 Gross value 8.4 23.3 32.4 0.1 106.1 170.1 Impairment - (0.3) - - - (0.3) Net value 8.3 23.0 32.3 0.1 106.1 169.7 ◗ Less than one year 0.1 - 19.7 0.1 - 19.8 ◗ More than one year 8.2 23.0 12.6 - 106.1 149.8
  • 59.
    59 2. Consolidated financialstatements 5.7 Trade and other receivables (€ million) 31/12/2015 31/12/2014 Trade receivables 400.4 367.6 Advances and down payments on orders 8.1 8.0 Amortisation of accounts receivable (10.3) (10.0) Trade receivables 398.1 365.6 Receivables from staff and welfare agencies 4.2 6.9 Central government and local authorities 237.4 180.6 Prepayments 24.1 21.2 Other(1) 166.3 159.8 Depreciation of other debtors (1.3) (1.1) Other receivables 430.7 367.5 (1) Other receivables for 2015 include €65 million representing the Australian Department for Transport’s guarantee on extra holiday rights; these rights appear under liabilities as payables to staff. 5.8 Cash and cash equivalents Analysis by type (€ million) 31/12/2015 31/12/2014 Cash 285.2 218.7 Short term investments 25.4 66.0 Total recognised as assets 310.6 284.7 Bank overdrafts (266.4) (377.1) Net cash and cash equivalents 44.2 (92.5) Cash equivalents include highly liquid short term investments that are easily convertible into a known amount of cash and present no significant risk of loss of value. The Group takes the view that its UCITS classified by the AMF (French financial markets authority) as “euro money-market” meet the criteria necessary to classify them as cash equivalents. In 2015, the Group carried out several transactions to monetise trade receivables. The amount of receivables thus monetised was €27.4 million at 31 December 2015 versus €23.6 million at 31 December 2014. The receivable arising in 2013, 2014 and 2015 from the CICE implemented by the French government and recognised by French consolidated tax groups was subject to a “Dailly” sale made by GROUPE KEOLIS S.A.S.
  • 60.
    60 2. Consolidated financialstatements 5.9 Equity Share capital and share premium At 31 December 2015, the share capital was €46.9 million, comprising 3,904,273 ordinary shares with a nominal value of 12 euros each. No diluting instrument was issued during the financial year ended 31 December 2015. The Group’s borrowing contracts do not include any mandatory gearing ratio clauses. Treasury shares At 31 December 2015, Keolis S.A. held no treasury shares and was not a party to any purchase or sale option relating to Keolis S.A. shares. Distributable reserves and earnings At 31 December 2015, Keolis S.A. held distributable reserves and earnings of €94.0 million and €37.6 million respectively. Non-controlling interests At 31 December 2015, non-controlling interests amounted to €51.5 million as against €21.7 million at 31 December 2014. The main non-controlling interests are Keolis Commuter Services LLC, Keolis Downer and KDR Victoria Pty Ltd. Foreign exchange translation reserve During 2015, the foreign exchange translation reserves increased by €0.5 million. The following were the main exchange rates against the euro used for the 2015 and 2014 financial years: 5.10 Financial debt and long term borrowings In 2015, two credit facilities were set up by Keolis S.A.: ◗ A loan of €15 million taken out at Société Générale, set up and drawn on 15 October 2015 repayable in instalments over 8 years, to finance rolling stock. This loan is fully hedged by a derivative financial instrument; ◗ A loan of €5 million taken out at the Banque Publique d’Investissement (BPI), set up in December 2014 and drawn in February 2015. This credit facility was amended on 7 December 2015 to increase its amount to €7 million repayable over 3 years. (for 1 euro) 2015 2014 Average rate Closing rate Average rate Closing rate Pound sterling 0.725978 0.733950 0.806100 0.778900 Australian dollar 1.476802 1.489700 1.471900 1.482900 Danish crown 7.458912 7.462600 7.454800 7.445300 Swedish crown 9.352400 9.189500 9.098500 9.393000 Norwegian crown 8.944238 9.603000 8.354400 9.042000 US dollar 1.109067 1.088700 1.328500 1.214100 Canadian dollar 1.417910 1.511600 1.466100 1.406300 Indian rupee 71.141807 72.021500 81.040600 76.719000
  • 61.
    61 2. Consolidated financialstatements Financial debt breakdown by type At 31 December 2015 (€ million) Amounts in the statement of financial position Term Rates Finance leasing 2.8 2016 Variable rates Finance leasing 23.4 2016 Fixed rates Derivatives 0.3 2016 - Loans 3.1 2016 Fixed rates Loans 38.6 2016 Variable rates Subtotal, less than 1 year 68.2 Owed to non-controlling shareholders (put option) 9.5 2017 - Finance leasing 4.5 2017-2021 Variable rates Finance leasing 93.0 2017-2021 Fixed rates Employee profit-sharing 0.6 2017-2020 Fixed rates Derivatives - Loans 37.8 2017-2021 Fixed rates Loans 425.9 2017-2021 Variable rates Subtotal, more than 1 year 571.3 TOTAL 639.5 At 31 December 2014 (€ million) Amounts in the statement of financial position Term Rates Finance leasing 10.1 2015 Variable rates Finance leasing 15.8 2015 Fixed rates Derivatives 1.6 - - Loans 1.8 2015 Fixed rates Loans 138.5 2015 Variable rates Subtotal, less than 1 year 167.8 Owed to non-controlling shareholders (put option) 10.4 2016 - Finance leasing 7.9 2015-2018 Variable rates Finance leasing 82.1 2015-2018 Fixed rates Employee profit-sharing 0.9 2015-2018 Fixed rates Derivatives - Loans 9.0 2015-2018 Fixed rates Loans 28.6 2015-2018 Variable rates Subtotal, more than 1 year 138.9 TOTAL 306.7
  • 62.
    62 2. Consolidated financialstatements Financial debt breakdown by maturity Financial debt breakdown by currency Maturity (€ million) 2016 2017 2018 2019 2020 After 2020 Total Finance leasing 26.2 26.7 24.8 16.6 9.6 19.6 123.7 Other liabilities 42.0 26.6 30.8 7.4 386.0 23.1 515.9 Total 68.2 53.3 55.6 24.1 395.6 42.7 639.5 (€ million) At 31 December 2015 At 31 December 2014 Euro 334.6 97.2 Canadian dollar 51.3 53.9 Pound sterling 17.8 0.7 Swedish crown 33.1 34.1 US dollar 76.3 73.5 Australian dollar 78.9 9.9 Danish crown 47.5 37.4 Norwegian crown - - TOTAL 639.5 306.7
  • 63.
    63 2. Consolidated financialstatements Mandatory financial ratios Contracts held by Keolis S.A. do not require compliance with any specific financial ratios. The Group’s contracts, and those of its subsidiaries, include cross acceleration clauses. If the Group or, under certain conditions, its largest subsidiaries do not comply with their commitments, lending institutions may claim default and early reimbursement of a major portion of the Group’s debt. TakingaccountofthespreadofthisfinancingamongvarioussubsidiariesandthequalityoftheGroup’sliquidityresources,theexistence of these clauses does not create a material risk to the Group’s financial situation. In 2014 the Group introduced monitoring of the financial ratios relating to the financing of the Group and its subsidiaries in order to anticipate any adverse changes to these ratios. Statement of changes in financial debts (€ million) 31/12/2014 Increase Decrease Changesin reportingscope Impactofexchange rate Other 31/12/2015 Finance leasing 25.9 5.4 (16.8) 4.2 (0.4) 7.8 26.2 Owed to non-controlling shareholders (put option) - - - - - - - Derivatives 1.6 - - - - (1.2) 0.3 Loans 140.3 6.6 (124.4) 0.8 1.8 16.6 41.7 Subtotal, less than 1 year 167.8 12.0 (141.2) 5.0 1.4 23.2 68.2 Owed to non-controlling shareholders (put option) 10.4 - - - - (0.8) 9.5 Finance leasing 90.0 27.2 (19.0) 6.5 (1.8) (5.5) 97.5 Employee profit-sharing 0.9 - - - - (0.4) 0.6 Derivatives - - - - - - - Loans 37.6 437.9 (0.1) 3.9 - (15.5) 463.7 Subtotal, more than 1 year 138.9 465.1 (19.1) 10.4 (1.8) (22.2) 571.3 TOTAL 306.7 477.1 (160.3) 15.4 (0.4) 1.0 639.5
  • 64.
    64 2. Consolidated financialstatements 5.11 Financial assets and liabilities by category At 31 December 2015 Book value by category of instruments € million Fairvaluethrough profitandloss Fairvaluethrough equity FairvaluethroughPL andequity(derivative instruments) Debtsatamortised cost Total Investments available for resale - 37.5 - - 37.5 Other non-current financial assets - - - 143.5 143.5 Trade receivables - - - 398.1 398.1 Other receivables - - - 430.7 430.7 Current financial assets - - 0.2 18.7 18.8 Cash and cash equivalents 25.4 - - 285.2 310.6 ASSETS 25.4 37.5 0.2 1,276.3 1,339.3 Non-current financial debt - - - 571.3 571.3 Current financial debt - - 0.3 67.9 68.2 Bank borrowings - - - 266.4 266.4 Customer deposits and advances received - - - 34.5 34.5 Trade and other payables - - - 492.7 492.7 Other current operating liabilities - - 6.4 764.0 770.4 LIABILITIES - - 6.8 2,196.8 2,203.6 At 31 December 2015 Fair value by level € million Level1: Listedprice Level2: Modelbased onobservable parameters Level3: Modelbasedon non-observable parameters Total Investments available for resale - - 37.5 37.5 Other receivables - - - - Current financial assets - 0.2 - 0.2 Cash and cash equivalents 25.4 - - 25.4 ASSETS 25.4 0.2 37.5 63.0 Current financial debt - 0.3 - 0.3 Other current operating liabilities - 6.4 - 6.4 LIABILITIES - 6.8 - 6.8
  • 65.
    65 2. Consolidated financialstatements (€ million) Other comprehensive income account (OCI) (reclassifiable as income) Latent financial income/ (expense) Underlying asset Hedge accounting Fair value at 31/12/2014 Change (1) Reclassified (2) Change (3) Fair value at 31/12/2015 Interest rates CFH (0.2) - 0.2 - 0.1 Interest rates Trading - - - - - Total Interest rates (0.2) - 0.2 - 0.1 Currency NIH - - - - - Currency Trading (1.3) - - 1.1 (0.2) Total currency (1.3) - - 1.1 (0.2) Commodities CFH (6.5) (4.2) 4.9 (0.5) (6.3) Commodities Trading (0.2) - - - (0.2) Total Commodities (6.8) (4.2) 4.9 (0.4) (6.5) Total (8.3) (4.2) 5.1 0.7 (6.6) (1) Changes in market values, which have impacted the other comprehensive income account (reclassifiable reserves) for the financial year. (2) Reclassifications from equity have had a negative impact of €4.9 million on EBITDA and a negative impact of €0.2 million on financial income / (expense) (3) Changes in market values that have impacted financial income/ expense for the financial year. The impact on 2015 profit for the year is presented in the table below: (€ million) EBITDA Financial result obtained Underlying Hedge accounting Change Change Interest rates CFH - (0.2) Interest rates Trading - (1.1) Total Interest rates - (1.3) Currency NIH - - Currency Trading - (9.6) Total currency - (9.6) Commodities CFH (6.6) (0.3) Commodities Trading - (0.3) Total Commodities (6.6) (0.6) Total (6.6) (11.5) This table excludes accrued interest. 5.12 Risk management and financial derivatives The Group uses derivative financial instruments to manage exposure to financial market risks resulting from its operational, financial and investment activities: ◗ Interest rate risk; ◗ Foreign exchange risk; ◗ Commodities risk. As at 31 December 2015, the Group held derivative instruments: ◗ eligible for hedge accounting and recognised as cash flow hedges (CFH), or as net investment hedges (NIH); ◗ or non-eligible for hedge accounting and recognised in trading. Fair values are calculated by using standard valuation methods and on a basis of mid-market conditions commonly used in the finan- cial markets. The market data used is level 2 under the terms of IFRS 13. The impacts on performance and the financial position of derivatives are presented in the table below:
  • 66.
    66 2. Consolidated financialstatements Derivative instruments are recognised in the statement of financial position at their fair value for the following amounts: (€ million) At 31 December 2015 At 31 December 2014 Assets Liabilities Assets Liabilities Interest rate instruments 0.2 0.1 - 0.2 Currency instruments - 0.3 - 1.4 Commodities instruments - 6.5 - 6.8 Total 0.2 6.9 - 8.4 Management of interest rate risk The exposure of the Group to interest rate risk stems from its net financial debt. The Group covers this risk by using derivative financial instruments. The hedging instruments linked to the debt agreement put in place by Keolis S.A. in 2010 (“private placement with Caisses Régionales de Crédit Agricole” or CRPP) matured at the same time as the debt on 30 September 2015. Derivative financial instruments eligible for hedge accounting are recognised under cash flow hedges. The derivative financial ins- truments that are not eligible are recognised under trading. The breakdown between the Group’s fixed and variable rate debt is as follows: The Group is exposed to interest rate variability on the variable rate portion of its net financial debt. At 31 December 2015, on the basis of a constant net financial debt, an increase of 50 basis points in market interest rates would have increased the annual borrowing cost by €2.4 million (excluding accrued interest, derivatives and amounts owed to non-controlling shareholders) and in parallel would have generated financial income on cash and cash equivalents by €0.2 million. On the basis of the interest rate hedging portfolio, an instantaneous increase of 50 basis points in market interest rates would cut the cost of annual debt by €0.2 million. Hence, on the basis of constant net financial debt adjusted to reflect the impact of interest rate hedging derivative financial instruments, an immediate increase of 50 basis points in market interest rates would have increased the annual cost of debt by €1.9 million. Equally, on the basis of constant net financial debt adjusted to reflect the impact of interest rate hedging derivative financial instruments, an immediate decrease of 50 basis points in market interest rates would have reduced the annual cost of debt by €1.9 million. (€ million) At 31 December 2015 At 31 December 2014 Variable rate 471.3 186.7 Fixed rate 158.7 109.6 Financial debt and long term borrowings adjusted for accrued interest 630.0 296.3 Variable rate cash and cash equivalents (44.2) 92.2 Fixed rate cash and cash equivalents - - Cash and cash equivalents (44.2) 92.2 Accrued interest receivable (0.1) (0.1) Loans and receivables (7.4) (8.3) Deposits and guarantees (29.4) (32.3) Derivative assets (0.2) (0.1) Profit sharing (0.6) (0.9) Net financial debt 548.2 346.8
  • 67.
    67 2. Consolidated financialstatements (€ million) At 31 December 2015 At 31 December 2014 Assets Liabilities Assets Liabilities Interest rate instruments: ◗ Cash flow hedges 0.2 0.1 - 0.2 ◗ Trading - - - - Total 0.2 0.1 - 0.2 (€ million) At 31 December 2015 Nominal Fair Value Rate swaps 55.0 0.1 Purchases of options - - Collars - - Sales of options - - TOTAL 55.0 0.1 (€ million) At 31 December 2015 Market rate -0.5% Market rate +0.5% Impact OCI (reserves reclassifiable as income) (2.3) 2.3 Impact financial income/(expense) - - Valuation (2.3) 2.3 The sensitivity of the portfolio of derivative financial instruments to an impact of 0.50% on interest rate levels is presented below: The derivative instruments are recognised in the statement of financial position at their fair value at the following amounts: The nominal amounts and fair values of the derivative financial instruments are as follows: All of the interest rate derivative financial instruments held at 31 December 2015 mature between 2016 and 2023.
  • 68.
    68 2. Consolidated financialstatements Foreign exchange risk management The Group has put in place intra-group loans denominated in foreign currency and recognised in current accounts. In order to cover the resulting foreign exchange risk, the Group uses derivative financial instruments which allow it to fix the exchange rate of these intra-group loans. The derivative financial instruments held by the Group are considered trading instruments under IAS 39. Derivative financial instruments are recognised in the statement of financial position at their fair value at the following amounts: (€ million) At 31 December 2015 At 31 December 2014 Assets Liabilities Assets Liabilities Currency instruments: ◗ Net investment hedges - - - - ◗ Trading - 0.3 - 1.4 Total - 0.3 - 1.4 The derivative financial instruments hedge transactions in the following currencies in particular: AUD, CAD, DKK, SEK, NOK, AED, USD and GBP. All of the foreign exchange hedging derivatives held at 31 December 2015 mature in 2016. The sensitivity of foreign exchange hedging contracts to a variation of plus or minus 10% in foreign exchange rates is detailed below: (€ million) At 31 December 2015 90% of the exchange rate 110% of the exchange rate Impact OCI (reserves reclassifiable as income) - - Impact financial income/(expense) 16.2 (16.6) Fair Value 16.2 (16.6)
  • 69.
    69 2. Consolidated financialstatements Management of risk of fluctuations in commodities prices Within the scope of its activities, the Group is exposed to a risk of fluctuation in the price of certain commodities, in particular diesel. The Group covers this risk by using derivative financial instruments. Derivative financial instruments eligible for hedge accounting are recognised under cash flow hedges as described by IAS 39. The derivative financial instruments that are not eligible are recognised under trading. The derivative instruments are recognised in the statement of financial position at their fair value at the following amounts: The sensitivity of commodity hedging contracts to a variation of plus or minus 10% in commodities’ prices is detailed below: (€ million) At 31 December 2015 90% of diesel price 110% of diesel price Impact OCI (reserves reclassifiable as income) (7.8) (5.0) Impact financial income/(expense) (0.2) - Impact Fair Value (8.0) (4.9) (€ million) At 31 December 2015 At 31 December 2014 Assets Liabilities Assets Liabilities Derivative financial instruments on commodities ◗ Cash flow hedges - 6.3 - 6.5 ◗ Trading - 0.2 - 0.2 Total - 6.5 - 6.8 Counterparty risk The transactions generating a potential counterparty risk for the Group are as follows: ◗ cash deposits; ◗ derivative financial instruments; ◗ trade receivables. All commodities’ hedging instruments held at 31 December 2015 mature between January 2016 and August 2017. Nominal amounts for positions open at 31 December 2015 are as follows: Type of hedge instrument Volume in tonnes yet to mature Maturing in 2016 Maturing in 2017 Swaps 32,632 28,932 3,700 Tunnels ◗ Cap purchases and floor sales 11,500 9,900 1,600 ◗ Floor sales 1,950 1,950 - Total 46,082 40,782 5,300
  • 70.
    70 2. Consolidated financialstatements In 2013, the Group established and implemented a counterparty risk procedure for bank counterparties relating to its investments and derivative financial instruments. This procedure is based on the principles set out below: ◗ Definition of three categories within which the Group’s bank counterparties are divided: • Authorised Banks; • Banks under supervision; • Non-authorised Banks. These categories are defined based on criteria specific to banks (rating) or Keolis (Group financing). ◗ Cash investments and derivative financial instruments are only undertaken with counterparties that belong to the “Authorised Banks” category; ◗ The portfolio of cash investments complies with weighting restrictions; ◗ The “fair value at risk” (fair value in favour of the Group) of the portfolio of derivative financial instruments is monitored regularly so as to spread the risk over various counterparties; ◗ The banks and categories are monitored regularly. If a bank that is a Group counterparty is removed from the “Authorised Banks” category, the portfolio of derivative financial instruments is restructured so as to comply once again with the category criteria. At 31 December 2015: ◗ All the investments made and all the derivative financial instruments held by the Group were established with bank counterparties in the “Authorised Banks” category; ◗ The analysis of fair values at risk indicates that there is no major counterparty risk to report. Finally, the credit and debit valuation adjustment calculations for the counterparty risk, as required by IFRS 13, indicate that the counterparty risk related to the valuation of the Group’s portfolios of derivative financial instruments is negligible. Liquidity risk In 2015, two credit facilities were set up by Keolis S.A.: ◗ A loan of €15 million taken out at Société Générale, set up and drawn on 15 October 2015 repayable in instalments over 8 years, to finance rolling stock. This loan is fully hedged by a derivative financial instrument; ◗ A loan of €5 million taken out at the Banque Publique d’Investissement (BPI), set up in December 2014 and drawn in February 2015. This credit facility was amended on 7 December 2015 to increase its amount to €7 million repayable over 3 years. (€ million) = 1 year 2 years From 3 to 5 years 5 years Financial debt (1.9) (1.9) (12.6) (5.5) Debt expense (0.3) (0.2) (0.3) (0.1) ◗ of which interest rate hedges (0.1) (0.1) - 0.1 The forecasted interest charges on the debt are calculated on the gross debt on the basis of the forward Euribor 1 month/3 months rate on the date of closing, to which is added the Group’s interest margin. It takes into account the impact of the interest rate derivative financial instruments. The forward Euribor 1 month/3 months interest rates at 31 December 2015 used to calculate interest charges are as follows: At 31 December 2015 2016 2017 2018 2019 2020 Forward interest rates -0.27% -0.23% 0.01% 0.31% 0.64% The Group ensures that it has sufficient resources to meet its financial obligations. To ensure this, each year the Group prepares a table of projected cash flows several years into the future to identify financing requi- rements and their seasonality.
  • 71.
    71 2. Consolidated financialstatements 5.13 Provisions Analysis by type (€ million) At 31 December 2015 At 31 December 2014 More than a year Less than a year Total More than a year Less than a year Total Pensions 127.8 6.3 134.1 116.8 2.4 119.2 Other employee benefits 30.9 0.9 31.8 30.1 0.9 31.0 Employment and tax risks 11.9 16.1 28.0 13.3 16.5 29.8 Losses on contract termination and loss-making contracts 2.6 2.4 5.0 4.0 2.6 6.6 Contract fines - 2.9 2.9 - 1.9 1.9 Major repairs and maintenance 8.6 24.9 33.5 6.2 26.2 32.4 Other 7.6 1.8 9.4 6.5 1.5 8.0 Total 189.4 55.3 244.7 176.9 52.0 228.9 Movements during the financial year (€ million) At1January 2015 Charges Reversals Changes in reporting scope Other movements At 31 December 2015 Pensions 119.2 23.0 (9.0) 0.4 0.4 134.1 Other employee benefits 31.1 2.3 (1.4) - (0.2) 31.8 Employment and tax risks 29.7 6.4 (8.5) 0.1 0.3 28.0 Losses on contract termination and loss- making contracts 6.6 5.0 (6.6) - - 5.0 Contract fines 1.9 2.9 (1.9) - - 2.9 Major repairs and maintenance 32.4 5.5 (4.3) - (0.2) 33.5 Other 8.0 6.3 (4.9) 0.1 (0.2) 9.4 Total 228.9 51.4 (36.6) 0.6 0.1 244.7 (€ million) At1January 2014 Charges Reversals Changes in reporting scope Other movements At 31 December 2014 Pensions 103.3 8.8 (7.3) - 14.4 119.2 Other employee benefits 14.2 2.5 (0.7) - 15.1 31.1 Employment and tax risks 22.7 14.7 (7.3) - (0.4) 29.7 Losses on contract termination and loss- making contracts 10.4 0.6 (5.2) 0.8 - 6.6 Contract fines 2.6 1.9 (2.6) - - 1.9 Major repairs and maintenance 29.5 5.7 (2.9) - 0.1 32.4 Other 8.6 4.4 (4.9) - (0.1) 8.0 Total 191.3 38.6 (30.9) 0.8 29.1 228.9
  • 72.
    72 2. Consolidated financialstatements Pensions and similar benefits The amount of commitments recognised in the statement of financial position breaks down as follows: (€ million) At 31 December 2015 At 31 December 2014 Commitments recorded in the statement of financial position Pensions and other post-employment benefits 134.1 119.1 Other employee benefits 31.8 31.0 Total 165.9 150.1 Of which: ◗ Non-current 158.7 142.9 ◗ Current 7.2 7.5 Pensions and other post-employment benefits Actuarial assumptions The following are the main actuarial assumptions adopted in evaluating pension commitments under the defined benefit schemes:. At 31 December 2015 At 31 December 2014 (per cent) France Canada France Canada Discount rate 1.49 3.30 1.35 3.75 Rate of increase in salaries 2.00-6.20 N/A 2.00-5.80 N/A Expected rate of return on assets 1.49 3.75 1.35 4.25 The plan assets break down as follows: (€ million) At 31 December 2015 At 31 December 2014 France Canada France Canada Equities - 1.4 - 1.6 Bonds 0.1 5.3 0.2 5.9 Real estate - 0.3 - 0.3 Other 0.1 - - - The sensitivity to discount rates, in relation to the assumptions adopted is as follows: (€ million) Commitment at 31/12/2015 Service cost 2016 Financial cost 2016 discount rate less 0.25% 137.3 8.3 1.9 discount rate (basic assumption) 134.1 8.1 2.2 discount rate plus 0.25% 130.5 7.9 2.4
  • 73.
    73 2. Consolidated financialstatements Commitments recorded in the statement of financial position The commitments recognised in the statement of financial position break down as follows: Analysis of changes in liabilities and assets The net present value of the liabilities comprises: (€ million) At 31 December 2015 At 31 December 2014 Present value of non-financed liabilities 131.6 121.2 Present value of financed liabilities 9.7 6.2 Present value of total liabilities 141.3 127.4 Fair value of pension scheme assets (7.2) (8.1) Present value of net liabilities recognised 134.1 119.3 (€ million) 31/12/2015 31/12/2014 Net present value of liabilities at 1 January 127.5 110.8 Service cost 7.0 5.9 Financial cost (including Franchise Adjustment) 1.9 2.9 Benefits paid (9.3) (7.5) Employee contributions - - Changes in pension schemes 14.1 0.1 Actuarial gains/(losses) 0.7 14.6 Foreign exchange translation difference (0.6) 0.3 Effect of changes in consolidation scope (0.1) 0.3 Effect of reductions and pension scheme settlements - - Net present value of liabilities at 31 December 141.3 127.4 The fair value of the assets comprises: (€ million) 31/12/2015 31/12/2014 Fair value of pension plan assets at 1 January 8.1 7.5 Expected return on assets 0.3 0.3 Actuarial gains/(losses) on pension fund returns 0.1 0.7 Employer contributions 0.2 0.3 Employee contributions - - Benefits paid (0.9) (0.9) Foreign exchange translation differences (0.5) 0.3 Effect of changes in consolidation scope - - Effect of reductions and pension scheme settlements - - Fair value of pension plan assets at 31 December 7.2 8.1
  • 74.
    74 2. Consolidated financialstatements The following are the actuarial gains and losses both in the light of experience and due to changes in actuarial assumptions: The following is the geographical breakdown of the liabilities and assets: (€ million) 31/12/2015 31/12/2014 Impact of changes in assumptions (1.5) 11.7 Losses/(gains) in the light of experience 2.2 2.2 Actuarial losses/(gains) for the year 0.7 13.9 (€ million) At 31 December 2015 France Canada Total Present value of the liabilities 133.7 7.6 141.3 Fair value of pension scheme assets (0.2) (7.0) (7.2) Net Present Value of net obligations 133.5 0.6 134.1 Benefit cost for the financial year The cost of benefits recognised in the income statement breaks down as follows: (€ million) 31/12/2015 31/12/2014 Service cost 7.0 5.9 Interest cost 1.9 2.9 Expected return on assets (0.3) (0.3) Depreciation of past service costs 14.1 0.1 Changes in pension schemes - - Total expense recognised in the income statement 22.7 8.6 The service cost is recognised within staff expenses. The interest cost on liabilities and the expected return on the pension scheme assets are recognised as financial expense and financial income respectively. Change in the net commitment recorded as a liability in the statement of financial position (€ million) 31/12/2015 31/12/2014 Opening provision at 1 January 119.4 103,4 Newly consolidated companies - 0.3 Benefit cost for the financial year 22.7 8.6 Used (Benefits / Contributions paid) (8.6) (6.9) Provision charged to/(reversed from) equity 0.7 13.9 Foreign exchange translation differences and other changes (0.1) - Closing provision at 31 December 134.1 119.4
  • 75.
    75 2. Consolidated financialstatements The cumulative movements in charges/(reversals) recognised directly in equity are as follows: (€ million) 31/12/2015 31/12/2014 Cumulative opening balance of charges/(reversals) 38.3 24.3 Actuarial (gains) / losses for the year 0.7 13.9 Foreign exchange translation differences and other changes (0.2) - Cumulative closing balance of charges/(reversals) 38.8 38.3 (€ million) 31/12/2015 31/12/2014 31/12/2013 31/12/2012 Present value of liabilities 141.3 127.5 111.6 113.9 Fair value of pension scheme assets (7.2) (8.1) (7.5) (8.7) Surplus (deficit) of the pension scheme 134.1 119.4 104.1 105.2 Adjustments related to experience 2.2 2.3 (3.8) 1.1 (€ million) 01/01/2015 Charge Reversals Change in scope Foreign exch transl. diff other 31/12/2015 France – long service awards 15.7 1.8 (0.9) - - 16.6 USA – healthcare expenses of early-retired employees 15.4 0.6 (0.5) - (0.2) 15.3 Total 31.1 2.4 (1.4) - (0.2) 31.9 Variations for the current financial year and for the three previous ones: Other employee benefits Description of commitments and actuarial assumptions Other employee benefits mainly consist of long-service awards to employees working in France and healthcare expenses of employees in the USA who have taken early retirement. These schemes are not funded by external assets (e.g. insurance policies). The obligations arising from these defined benefit schemes are measured using the same methods and assumptions as for the pension schemes. The actuarial gains and losses arising from both experience and due to changes in actuarial assumptions are immediately recognised in the income statement for the financial year. Analysis of movements in obligations The change in the USA relates to the provision for healthcare expenses recorded as part of the Boston tender award, counter- balanced by the recording of an intangible asset depreciated over the contract’s duration. 5.14 Operating liabilities and other debt (€ million) At 31 December 2015 At 31 December 2014 Trade receivables: advances and deposits received 34.5 58.4 Trade payables 493.4 481.4 Payables to PPE suppliers 23.0 33.6 Payables to staff 459.8 440.0 Central government and local authorities 92.9 67.9 Deferred income 97.3 95.4 Other 96.7 87.3 Total 1,297.7 1,263.9
  • 76.
    76 2. Consolidated financialstatements 6 • Other commitments not recognised in the statement of financial position and contractual commitments The amount of railway path access entitlements within the “Guarantees given for operating commitments” is €72.0 million at 31 December 2015 compared to €73.8 million at 31 December 2014. The future minimum payments on operating lease contracts break down as follows: Future commitments linked to leases primarily relate to the rental of transport equipment and buildings. They comprise €436.1 million internationally and €262.4 million in France. IT equipment rental contracts are in place for immaterial values. France Rental contracts Contracts entered into on vehicles (buses and coaches) relate to average durations of ◗7 to 8 years for buses and coaches, ◗3 or 4 years for minibuses. The manufacturer’s buyback undertaking corresponds to the estimated market value of the vehicle at the end of the rental period. Most of these contracts are entered into directly by the subsidiaries, with a guarantee signed by Keolis S.A. in favour of the financing bodies. This guarantee takes the form of an undertaking to continue the rental and binds Keolis S.A. only in terms of the payment of the rental amounts that remain due under the contract if the subsidiary defaults. In return, the financing body undertakes to keep the related vehicles available to the Group.  Outside France We distinguish between railway contracts and bus contracts. Railway contracts Railway rental contracts are entered into for the term of the franchise. Rentals under leases due in less than one year amount to €17.8 million. Rentals under leases due in more than one year depend on the end date of each of the railway or similar franchises. They amount to €98.9 million. Bus and coach contracts Rental instalments outstanding on these contracts amount to €202.5 million. As in France, Keolis S.A. is required to provide guarantees of rental payments on behalf of its foreign subsidiaries. (€ million) At 31 December 2015 At 31 December 2014 Unutilised credit lines 8.6 8.1 Guarantees given to secure debt 44.3 42.1 Guarantees given for operating commitments 666.4 640.6 Securities provided - - Total commitments made and guarantees given, excluding operating leases 710.7 682.7 (€ million) At 31 December 2015 At 31 December 2014 Less than one year 158.8 162.3 One to five years 408.6 449.2 More than five years 131.0 149.5 Total 698.5 761.0
  • 77.
    77 2. Consolidated financialstatements 7 • Disputes The estimates and underlying assumptions relating to current disputes are continuously re-examined. In particular, current disputes and litigation, especially with tax administrations or relating to appeals on tenders or on warranty claims, have been examined by the management with its advisers and lawyers for the purpose of assessing the risk they entail to the measurement of assets or liabilities. The impact of changes in accounting estimates is recognised during the period of the change where they only affect that period, or during the period of the change and subsequent periods where the latter are also affected by the change. Risks are measured at fair value and where appropriate a provi- sion is made in the accounts (see note 5.13). On 27 June 2014, the Group decided to terminate a subcontrac- tor agreement. On 4 August 2014, the subcontractor filed a claim against a subsidiary of the Group without producing any evidence to support this action, which is thus entirely refuted by the subsidiary concerned. At this stage in the procedure, no provision has been made in the financial statements. 8 • Related party transactions The revised IAS 24 norm, applicable from 1 January 2011, has modified disclosure obligations for public entities regarding tran- sactions with related parties. Keolis S.A. is wholly owned by GROUPE KEOLIS S.A.S. 69.69% of GROUPE KEOLIS S.A.S. is owned by SNCF Participations and 30.00% by Caisse de Dépôt et Placement du Québec. SNCF is a public company with an industrial and commercial activity whose capital is entirely owned by the French State. 8.1 Transactions with GROUPE KEOLIS S.A.S. and Groupe EFFIA Transactions with GROUPE KEOLIS S.A.S. mainly correspond to general management services. Transactions with Groupe EFFIA correspond to sub-contracting services. 8.2 Transactions with joint ventures and associates Transactions with joint ventures and associates are performed according to normal market conditions. 8.3 Remuneration of the Group’s key managers The key managers in the Group are defined as being the com- pany officers and directors of Keolis S.A. and the members of the Executive Committee. Remuneration and other short-term benefits paid to these directors amounted to €4.9 million for 9 people in 2015, compared to €3.0 million for 8 people in 2014. No directors’ fees were allotted to members of the Group’s management or executive committees. There are no outstanding advances or credit facilities extended to members of the Group’s management or executive committees. 9 • Post balance sheet events Access to GROUPE KEOLIS S.A.S.’ syndicated loan On 20 February 2016, Keolis S.A. became an additional bor- rower on the €900 million syndicated loan contracted by GROUPE KEOLIS S.A.S. on 12 July 2013. This modification enables Keolis S.A. to reinforce its liquidity and its borrowing capacity though direct access to an external source of finance whilst benefitting from the guarantee of GROUPE KEOLIS S.A.S. relating to the possible use of this line of credit. The main characteristics of this syndicated loan, following amendments made on 11 June 2015 are: ◗ a maximum amount of €900 million, ◗ a maturity on 11 June 2020, ◗ a provision under which Keolis may extend the maturity by an additional year, in 2016 and 2017, subject to the approval of the entire financing syndicate. Maturity could thereby be extended until 11 June 2022. At 31 December 2015 the undrawn amount on this syndicated loan stood at €300 million. Keolis S.A. capital increase On 3 March 2016, Keolis S.A. launched a capital increase amounting to €300 million. Fully subscribed to by its shareholder GROUPE KEOLIS S.A.S., this operation aims to reinforce Keolis S.A.’s capital base in order to support the future development of its public transport activities in France and worldwide. This operation, conducted in the form of a set-off of claims between GROUPE KEOLIS S.A.S. and Keolis S.A., reduced Keolis S.A.’s net debt by €300 million. As a consequence, Keolis S.A.’s net financial debt at 31 December 2015, taking into account this capital increase, would stand at €248.2 million instead of €548.2 million, and equity attributable to the Group would amount to €450.8 million instead of €150.8 million. Keolis acquires Transports Daniel Meyer in Ile-de-France In January 2016, the Keolis Group announced the acquisition of a leading bus and coach service operator in Ile-de-France, Transports Daniel Meyer. With this strategic external growth transaction, Keolis reinforces its foothold in Ile-de-France and consolidates its position for future projects relating to Grand Paris Express. Keolis Ile-de-France, which generated 400 million euros of turnover in 2014, operates a fleet of 1,900 vehicles across 25 depots. Established in all of the departments compri- sing the Paris region, its 19 subsidiaries employ 4,000 people and carry 70 million passengers each year. The group Transports Daniel Meyer has 440 employees and a fleet of 260 vehicles. It generated a turnover of 40.4 million euros in 2014. Its main line of business is in the operation of approximately 50 timetabled bus lines, supplemented by school buses and school outings and charter activity.
  • 78.
    78 2. Consolidated financialstatements 10 • Consolidation scope 10.1 Subsidiaries Name Country Method of consolidation % of shareholding Aérobag France FC 100.00% Aérolis France FC 50.10% Aéroport de Troyes Barberey France FC 100.00% Aérosat France FC 85.00% Airelle France FC 100.00% Athis Cars France FC 100.00% Autocars Delion France FC 100.00% Autocars Eschenlauer France FC 100.00% Autocars Garrel et Navarre France FC 100.00% Autocars Planche France FC 100.00% Autocars Striebig France FC 100.00% Caennaise de Services France FC 100.00% Cariane Littoral France FC 100.00% Caron Voyages France FC 100.00% Cars de Bordeaux France FC 100.00% Cars et Autobus de Cassis - SCAC France FC 100.00% Cars Planche France FC 100.00% Compagnie des Transports Méditerranéens France FC 100.00% Compagnie du Blanc Argent France FC 99.43% Devillairs France FC 100.00% Fouache Evasion France FC 100.00% Holding Striebig France FC 100.00% Institut Keolis France FC 100.00% Interhône-Alpes France FC 100.00% Intrabus Orly France FC 100.00% Keolis Abbeville France FC 99.02% Keolis Agen France FC 100.00% Keolis Aix-les-Bains France FC 100.00% Keolis Alençon France FC 100.00% Keolis Alès France FC 100.00% Keolis Amiens France FC 100.00% Keolis Angers France FC 100.00% Keolis Arles France FC 100.00% Keolis Armor France FC 100.00% Keolis Artois Gohelle France FC 100.00% Keolis Atlantique France FC 100.00% Keolis Auch France FC 100.00% Keolis Aude France FC 100.00% Keolis Baie des Anges France FC 100.00% Keolis Bassin D’Arcachon France FC 100.00% Keolis Bassin de Pompey France FC 100.00%
  • 79.
    79 2. Consolidated financialstatements Name Country Method of consolidation % of shareholding Keolis Beaune France FC 100.00% Keolis Besançon France FC 99.96% Keolis Blois France FC 100.00% Keolis Bordeaux France FC 99.99% Keolis Bordeaux Métropole France FC 100.00% Keolis Boulogne sur Mer France FC 100.00% Keolis Bourgogne France FC 99.50% Keolis Brest France FC 100.00% Keolis Bus Verts France FC 100.00% Keolis Caen France FC 100.00% Keolis Calvados France FC 100.00% Keolis Camargue France FC 100.00% Keolis Centre France FC 100.00% Keolis Châlons-en-Champagne France FC 99.24% Keolis Charente Maritime France FC 99.96% Keolis Château Thierry France FC 100.00% Keolis Châteauroux France FC 100.00% Keolis Châtellerault France FC 100.00% Keolis Chaumont France FC 100.00% Keolis Chauny - Tergnier France FC 100.00% Keolis Cherbourg France FC 100.00% Keolis Concarneau* France FC 100.00% Keolis Conseil et Projets France FC 100.00% Keolis Dijon France FC 100.00% Keolis Drôme France FC 100.00% Keolis Drouais France FC 100.00% Keolis Emeraude France FC 100.00% Keolis en Cévennes France FC 99.19% Keolis Epinal France FC 100.00% Keolis Eure et Loir France FC 100.00% Keolis Garonne France FC 100.00% Keolis Gascogne France FC 100.00% Keolis Gironde (ex SNCOA ) France FC 100.00% Keolis Grand Tarbes France FC 100.00% Keolis Ille et Vilaine France FC 100.00% Keolis Languedoc France FC 100.00% Keolis Laval France FC 100.00% Keolis Lille (ex Transports en Commun de la Métropole Lilloise (Transpole)) France FC 100.00% Keolis Littoral France FC 100.00% Keolis Lorient France FC 100.00% Keolis Lyon France FC 99.99% Keolis Manche France FC 100.00% Keolis Maritime Brest France FC 100.00% Keolis Maritime Lorient France FC 99.00%
  • 80.
    80 2. Consolidated financialstatements Name Country Method of consolidation % of shareholding Keolis Marmande France FC 100.00% Keolis Mobilité Hauts de Seine France FC 100.00% Keolis Mobilité Roissy France FC 100.00% Keolis Montargis France FC 100.00% Keolis Montélimar France FC 100.00% Keolis Montluçon France FC 100.00% Keolis Morlaix France FC 100.00% Keolis Narbonne France FC 100.00% Keolis Nevers France FC 100.00% Keolis Nord Allier France FC 100.00% Keolis Normandie Seine France FC 100.00% Keolis Obernai France FC 100.00% Keolis Oise France FC 100.00% Keolis Orléans France FC 100.00% Keolis Orly Rungis France FC 100.00% Keolis Oyonnax France FC 100.00% Keolis Pays d'Aix France FC 100.00% Keolis Pays de Montbéliard France FC 100.00% Keolis Pays des Volcans France FC 100.00% Keolis Pays Nancéien France FC 100.00% Keolis Pays Normands France FC 100.00% Keolis PMR Rhône France FC 100.00% Keolis Porte de l’Isère France FC 100.00% Keolis Provence France FC 100.00% Keolis Pyrénées France FC 95.16% Keolis Quimper France FC 100.00% Keolis Rennes France FC 100.00% Keolis Réseau Départemental Sud Oise France FC 100.00% Keolis Roissy Services Aéroportuaires France FC 100.00% Keolis Rouen Vallée de Seine France FC 100.00% Keolis S.A. France FC 100.00% Keolis Saint Malo France FC 100.00% Keolis Saintes France FC 100.00% Keolis Seine Maritime France FC 100.00% Keolis Somme France FC 100.00% Keolis Sud Allier France FC 100.00% Keolis Sud Lorraine France FC 100.00% Keolis Touraine France FC 100.00% Keolis Tours France FC 100.00% Keolis Travel Services France FC 100.00% Keolis Trois Frontières France FC 100.00% Keolis Urbest France FC 100.00% Keolis Val d’Oise France FC 100.00% Keolis Val de Maine France FC 100.00%
  • 81.
    81 2. Consolidated financialstatements Name Country Method of consolidation % of shareholding Keolis Val de Saône France FC 100.00% Keolis Val Hainaut France FC 96.32% Keolis Vesoul France FC 100.00% Keolis Vichy France FC 100.00% Keolis Voyages France FC 100.00% Keolis Yvelines France FC 100.00% KTA France FC 100.00% Les Autobus d'Arcachon France FC 100.00% Les Cars du Bassin de Thau France FC 100.00% Les Cars Roannais France FC 100.00% Les Courriers Catalans France FC 99.99% Les Courriers de l'Ile-de-France France FC 99.99% Les Courriers du Midi France FC 100.00% Les Transports Dunois France FC 100.00% Loisirs et Voyages France FC 100.00% Millau Cars France FC 100.00% Monnet Tourisme France FC 100.00% Monts Jura Autocars France FC 99.99% Pacific Cars France FC 100.00% Prioris France FC 100.00% Réseau en Vosges France FC 70.00% S.T.E.F.I.M. France FC 100.00% SA Sap Drogoul France FC 100.00% SAP Cariane Provence France FC 100.00% SCAC Bagnis France FC 100.00% Setver France FC 100.00% SFD France FC 100.00% Société d’Exploitation des Transports Urbains d’Oyonnax France FC 100.00% Société d'exploitation de l'Aéroport de Dole Jura France FC 51.00% Société d'exploitation de l'Aéroport Albert Picardie France FC 51.00% Société de Gestion de l'Aéroport d'Angers-Marcé France FC 100.00% Société de Transports et de Services Aéroportuaires France FC 100.00% Société Départementale des Transports du Var France FC 95.08% Société des Transports Côte d’Azur Riviéra France FC 100.00% Société des Transports de la Communauté Urbaine d'Arras France FC 100.00% Société des Transports en Commun Nîmois France FC 100.00% Société des Transports Robert France FC 100.00% Société pour la Mobilité à Paris – SOMAP France FC 100.00% Société Rennaise de Transport et de Services (Handistar) France FC 100.00% STA France FC 100.00% STAC France FC 100.00% SVTU France FC 100.00% TPR France FC 100.00%
  • 82.
    82 2. Consolidated financialstatements Name Country Method of consolidation % of shareholding Train Bleu St Marcellin France FC 100.00% Trans Val de Lys France FC 99.99% Transkeo France FC 51.00% Transports de la Brière France FC 60.10% Transports et Services Aérolignes France FC 100.00% Transports Evrard France FC 100.00% Transports Gep Vidal France FC 100.00% Transroissy France FC 100.00% Var Tours France FC 99.45% Voyages Autocars Services France FC 100.00% Voyages Chargelègue France FC 100.00% Voyages Dourlens France FC 100.00% Voyages Fouache France FC 100.00% Voyages Monnet France FC 100.00% Voyages Striebig France FC 100.00% VTS Roissy France FC 100.00% Westeel Voyages France FC 100.00% Keolis Deutschland GmbH Co.KG Germany FC 100.00% Keolis Deutschland Holding GmbH Germany FC 100.00% Keolis Deutschland Verwaltung GmbH Germany FC 100.00% Schloemer Verkehrsbetrieb GmbH Germany FC 100.00% Striebig Deutschland Germany FC 100.00% Striebig GmbH Germany FC 100.00% Australian Transit Enterprises Pty Ltd Australia FC 51.00% KDR Gold Coast Pty Ltd Australia FC 51.00% KDR Victoria Pty Ltd Australia FC 51.00% Keolis Australia Australia FC 100.00% Keolis Downer Pty Ltd Australia FC 51.00% Keolis Downer Bus and Coachlines Property Pty Ltd Australia FC 51.00% Keolis Downer Bus and Coachlines Pty Ltd Australia FC 51.00% Hornibrook Bus Lines Pty Ltd Australia FC 51.00% Hornibrook Transit Management Pty Ltd Australia FC 51.00% LinkSA Pty Ltd Australia FC 51.00% Path Transit Pty Ltd Australia FC 51.00% South West Transit Pty Ltd Australia FC 51.00% Southlink Pty Ltd Australia FC 51.00% Autobus De Genval Belgium FC 100.00% Autobus Dony Belgium FC 100.00% Autobus Dujardin Belgium FC 100.00% Autobus Lienard Belgium FC 100.00% Cardona-Deltenre Belgium FC 100.00% Cintra Belgium FC 100.00% Cintral Belgium FC 100.00% De Turck Belgium FC 100.00% Eltebe Belgium FC 100.00%
  • 83.
    83 2. Consolidated financialstatements Name Country Method of consolidation % of shareholding Etablissements Picavet Co Belgium FC 100.00% Eurobus Holding Belgium FC 100.00% Eurobussing Airport Belgium FC 100.00% Eurobussing Brussels Belgium FC 100.00% Eurobussing Wallonie Belgium FC 100.00% Flanders Bus Belgium FC 100.00% Garage Du Perron Belgium FC 100.00% Gino Tours Belgium FC 100.00% Heyerick Belgium FC 100.00% Joye Belgium FC 100.00% Keolis Vlaanderen Belgium FC 100.00% Kibel (ex Belbus) Belgium FC 100.00% Kortenbergse Busonderneming Belgium FC 100.00% L.I.M. Collard-Lambert Belgium FC 100.00% Le Cinacien Belgium FC 100.00% N.V. Autobusbedrijf Bronckaers Hamont Belgium FC 100.00% N.V. Autobussen De Reys Belgium FC 100.00% N.V.Autocars Henri De Boeck En Reizen Andre Leloup Belgium FC 100.00% Pirnay Belgium FC 100.00% Ramoudt Tours Belgium FC 100.00% Reniers Co Belgium FC 50.02% S.A.D.A.R. Belgium FC 100.00% SA A.B.C. Cars Belgium FC 100.00% Satracom Belgium FC 100.00% Société de Transport Automobiles Cars Autobus SA* Belgium FC 100.00% Sophibus Belgium FC 100.00% Sprl Bertrand Belgium FC 100.00% Sprl Taxis Melkior Belgium FC 100.00% Sprl Voyages F. Lenoir Belgium FC 100.00% Sprl Truck Bus Repair (Tbr) Belgium FC 100.00% T.C.M. Cars Belgium FC 100.00% Transport Penning Belgium FC 100.00% Trimi Belgium FC 100.00% Van Rompaye NV Belgium FC 100.00% Voyages Doppagne Belgium FC 100.00% Voyages Nicolay Belgium FC 100.00% West Belgium Coach Company Belgium FC 100.00% Keolis Canada Inc. Canada FC 100.00% Keolis Grand River Sec Canada FC 100.00% Keolis Bus Danmark (ex City Trafik) Denmark FC 75.00% Keolis Espagne Spain FC 100.00% Keolis America Inc. United States FC 100.00% Keolis Commuter Services Llc United States FC 60.00% Keolis Rail Services America United States FC 100.00% N° Siren / PaysCountry
  • 84.
    84 2. Consolidated financialstatements Name Country Method of consolidation % of shareholding Keolis Rail Services Virginia United States FC 100.00% Keolis Transit America United States FC 100.00% Keolis Hyderabad Mass Rapid Transit System Private Limited India FC 100.00% Kilux Luxembourg FC 100.00% Luxbus* Luxembourg FC 100.00% Keolis Nederland Netherlands FC 100.00% Keolis Norge (ex Fjord1 Partner AS) Norway FC 100.00% Syntus BV Netherlands FC 100.00% Keolis Amey Docklands Ltd United Kingdom FC 70.00% Keolis UK United Kingdom FC 100.00% Nottingham Trams Ltd United Kingdom FC 80.00% Citypendeln Sweden FC 100.00% CSG Commuter Security Sweden FC 100.00% Keolis Nordic Sweden FC 100.00% Keolis Sverige AB Sweden FC 100.00% * Companies removed from the consolidation scope on 31 December 2015
  • 85.
    85 2. Consolidated financialstatements Name Country Method of consolidation % of shareholding Compagnie des Transports Collectifs de l’Ouest Parisien France EM 50.00% Orgebus France EM 50.00% Passerelle CDG* France EM 34.00% RDK France EM 50.00% SCODEC France EM 35.00% Société de Transport de l’Agglomération de Chauny France EM 50.00% Trans Pistes France EM 40.00% Transévry France EM 39.42% Transports de l’Agglomération de Metz France EM 25.00% Transports Intercommunaux Centre Essonne (TICE) France EM 19.00% NETLOG Germany EM 33.00% Shanghai Keolis Public Transport Operation Management Co China EM 49.00% Wuhan Tianhe Airport Transport Center Operation and Management Co. Ltd China EM 40.00% PROMETRO Portugal EM 20.00% First Keolis Holding Limited United Kingdom EM 45.00% First Keolis Transpennine Holding Limited United Kingdom EM 45.00% First Keolis Transpennine Limited United Kingdom EM 45.00% Govia United Kingdom EM 35.00% Govia Thameslink Railway Limited United Kingdom EM 35.00% London Birmingham Railway Limited United Kingdom EM 35.00% London South Eastern Railway Limited United Kingdom EM 35.00% New Southern Railway Limited United Kingdom EM 35.00% Southern Railway Limited United Kingdom EM 35.00% Thameslink Rail Limited United Kingdom EM 35.00% * Companies removed from the consolidation scope on 31 December 2015 10.2 Joint ventures and associates
  • 86.
    To the Shareholders, Incompliance with the assignment entrusted to us by your Annual General Meeting, we hereby report to you, for the year ended December 31, 2015, on: ◗ the audit of the accompanying consolidated financial statements of Keolis; ◗ the justification of our assessments; ◗ the specific verification required by law. These consolidated financial statements have been approved by the Board of Directors. Our role is to express an opinion on these consolidated financial statements based on our audit. I. Opinion on the consolidated financial statements We conducted our audit in accordance with professional standards applicableinFrance;thosestandardsrequirethatweplanandperform the audit to obtain reasonable assurance about whether the consoli- dated financial statements are free of material misstatement. An audit involves performing procedures, using sampling techniques or other methodsofselection,toobtainauditevidenceabouttheamountsand disclosures in the consolidated financial statements. An audit also includes evaluating the appropriateness of accounting policies used andthereasonablenessofaccountingestimatesmade,aswellasthe overall presentation of the consolidated financial statements. We believe that the audit evidence we have obtained is sufficient and appropriate to provide a basis for our audit opinion. In our opinion, the consolidated financial statements give a true and fair view of the assets and liabilities and of the financial posi- tion of the Group at December 31, 2015 and of the results of its operations for the year then ended in accordance with International Financial Reporting Standards as adopted by the European Union. II. Justification of our assessments In accordance with the requirements of article L.823-9 of the French Commercial Code (Code du commerce) relating to the justification of our assessments, we bring to your attention the following matters: ◗ Keolis carries out impairment tests on goodwill and indefinite life assets and also assesses whether there is any indication of impairment on non-current assets, as described in note 2.4.9 to the consolidated financial statements. We have examined the methods used to carry out this impairment test as well as the corresponding cash flow forecasts and assumptions, and have verified that the notes to the consolidated financial statements provide appropriate disclosures. Statutoryauditors’reportontheconsolidated financialstatements(FortheyearendedDecember31,2015) This is a free translation into English of the statutory auditors’ report on the consolidated financial statements issued in the French language and is provided solely for the convenience of English-speaking users. The statutory auditors’ report includes information specifically required by French law in such reports, whether modified or not. This information is presented below the opinion on the consolidated financial statements and includes explanatory paragraphs discussing the auditors’ assessments of certain significant accounting and auditing matters. These assessments were made for the purpose of issuing an audit opinion on the consolidated financial statements taken as a whole and not to provide separate assurance on individual account captions or on information taken outside of the consolidated financial statements. This report also includes information relating to the specific verification of information given in the Group’s management report. This report should be read in conjunction with, and is construed in accordance with, French law and professional auditing standards applicable in France. 86 2. Consolidated financial statements
  • 87.
    Neuilly-sur-Seine, March 7,2016 The Statutory Auditors Bertrand BoisselierFrançoise Garnier-Bel PricewaterhouseCoopers Audit French original signed by Deloitte Associés French original signed by ◗ Note 2.4.17 specifies the valuation methods for provisions for pensions and other employee benefits. An evaluation of these provisions was carried out by independent actuaries. Our work consisted in examining the data and assumptions used and verifying that note 5.13 to the consolidated financial statements provides appropriate disclosures. ◗ Note 2.4.17 specifies the methods used to take into account the risks relating to ongoing litigation and contracts. Our work consisted in examining the procedures used by the Company to identify and assess these risks and the accounting treatment applied and in assessing the resulting estimates. These assessments were made as part of our audit of the consolidated financial statements taken as a whole, and therefore contributed to the opinion we formed which is expressed in the first part of this report. III. Specific verification As required by law, we have also verified in accordance with professional standards applicable in France the information presented in the Group’s management report. We have no matters to report as to its fair presentation and its consistency with the consolidated financial statements. 87 2. Consolidated financial statements
  • 89.
    89 3. Unaudited financialstatements 3. Unaudited management financial statements 1 • Key figures. . . . . . . . . . . . . . . . . . . . . . . . . . . . . . . . . . . . . . . . . . . . . . . . . . . . . . . . . . . . . . . . . . . . . . . . . . . . . . . . . . . . . . 90 2 • Income statement. . . . . . . . . . . . . . . . . . . . . . . . . . . . . . . . . . . . . . . . . . . . . . . . . . . . . . . . . . . . . . . . . . . . . . . . . . . . . . . 91 3 • Statement of financial position . . . . . . . . . . . . . . . . . . . . . . . . . . . . . . . . . . . . . . . . . . . . . . . . . . . . . . . . . . . . . . . 92 4 • Statement of cash flows. . . . . . . . . . . . . . . . . . . . . . . . . . . . . . . . . . . . . . . . . . . . . . . . . . . . . . . . . . . . . . . . . . . . . . . 93 ContentS The Group considers that the following financial statements, prepared without applying IFRS 10 and 11, are accurate indicators of the operational and financial performances of the Group. They should be considered as an additional source of information and are in no way a substitute for other strictly accounting-related forms of the measurement of operational and financial performance as presented in the consolidated financial statements and the notes thereto, or referred to in the financial report. The management accounts as at 31 December 2015 have not been audited.
  • 90.
    90 3. Unaudited financialstatements 1 • Key figures (€ million) 31/12/2015 31/12/2014 Revenue 6,240.7 5,381.4 ◗ Revenue France 2,634.4 2,614.5 ◗ Revenue International 3,606.3 2,766.9 Revenue net of sub-contracting 6,057.9 5,204.4 Recurring EBITDA 286.8 259.5 EBITDA 259.8 228.5 Recurring operating profit 93.9 94.5 Operating profit before investments under equity method 68.2 56.9 Operating profit after investments under equity method 68.0 57.2 Profit after tax from continuing operations 4.4 14.8 Profit attributable to equity shareholders 12.0 13.6 Total equity 202.3 162.5 of which attributable to equity shareholders 150.8 141.8 Net cash flows from operating activities 208.2 239.3 Industrial investments 206.4 192.3 Net financial debt (cash surplus) 223.9 99.4
  • 91.
    91 3. Unaudited financialstatements 2 • Income statement (€ million) 31/12/2015 31/12/2014 Revenue 6,240.7 5,381.4 Other income from operations 20.2 25.5 Income from continuing operations 6,260.9 5,406.9 Sub-contracting (182.8) (177.0) Purchases consumed and external expenses (2,510.4) (2,157.9) Taxes (15.6) (14.1) Staff costs, incentive schemes. profit-sharing (3,183.5) (2,728.9) Other operating income 48.8 48.5 Other operating expense (120.3) (102.7) Net provisions on current assets (0.9) (4.6) Net depreciation and other provisions charged (213.8) (185.5) Profit/(loss) on recurring fixed asset disposals 1.9 1.4 Amortisation of grants received 9.8 8.5 Recurring operating profit 93.9 94.5 Other non-recurring income 7.3 4.4 Other non-recurring expense (31.4) (32.6) Depreciation and provisions on contractual rights (1.6) (9.4) Of which depreciation of other intangible assets and negative goodwill 5.7 (5.3) Profit before investments under the equity method 68.2 57.0 Profit/(loss) from associates (0.3) 0.2 Profit after investments under the equity method 68.0 57.2 Net cost of financial borrowing (12.2) (8.6) Other financial income 12.2 10.7 Other financial expense (20.1) (17.1) Financial income (expense) (20.2) (14.9) Net profit before taxation 47.8 42.3 Taxation (43.4) (27.5) Net profit from continuing operations 4.4 14.8 Profit for the year 4.4 14.8 Profit attributable to non-controlling interests 7.6 (1.3) Profit attributable to Group 12.0 13.6
  • 92.
    92 3. Unaudited financialstatements Assets (€ million) 31/12/2015 31/12/2014 Goodwill 271.4 237.5 Other intangible assets 204.7 150.8 Property, plant and equipment 722.6 636.5 Investments under equity method 2.1 2.0 Other non-current financial assets 181.0 149.9 Deferred tax asset 45.0 46.6 Non-current assets 1,426.9 1.223.3 Inventories and work in progress 89.0 85.1 Trade receivables 438.3 411.4 Other receivables 538.8 444.3 Other current financial assets 13.5 13.9 Cash and cash equivalents 653.5 553.7 Current assets 1,733.0 1,508.4 TOTAL ASSETS 3,159.9 2,731.6 Liabilities (€ million) 31/12/2015 31/12/2014 Share capital 46.9 46.9 Reserves and premiums 91.9 81.4 Net profit/(loss) attributable to Group 12.0 13.6 Equity attributable to Group 150.8 141.8 Reserves attributable to non-controlling interests 59.1 19.5 Profit for the year attributable to non-controlling interests (7.6) 1.3 Equity 202.3 162.5 Non-current provisions 189.4 177.0 Non-current financial debt 571.3 139.4 Deferred tax liability 38.4 12.5 Non-current liabilities 799.1 329.0 Current provisions 55.3 52.0 Current financial debt 80.7 181.9 Bank borrowings 267.2 377.8 Trade payables and other liabilities 1,755.3 1,628.3 Current liabilities 2,158.5 2,240.1 TOTAL LIABILITIES 3,159.9 2,731.6 3 • Statement of financial position (1) As published in the Keolis S.A. 2013 annual report.
  • 93.
    93 3. Unaudited financialstatements (€ million) 31/12/2015 31/12/2014 Operating profit before investments under equity method 68.2 56.9 Non-cash items 191.7 171.6 EBITDA 259.8 228.5 Elimination of provisions in current assets 0.9 4.6 Changes in working capital (14.8) 31.9 Tax paid (37.8) (25.8) A) Net cash from operating activities 208.2 239.3 Capital expenditure (206.4) (192.3) Proceeds from sale of tangible and intangible assets 46.6 34.5 Investment grants received 7.7 7.3 Change in financial assets for concessions (IFRIC 12) (14.2) (19.1) Financial investments (140.3) (86.1) Gains/ (losses) from disposal of financial assets 5.6 34.9 Cash flows on changes in reporting scope 4.7 27.2 B) Net cash from investing activities (296.3) (193.6) Free cash flow (88.1) 45.7 Net dividends paid (19.6) (19.7) Net dividends received 0.4 0.3 Change in equity (other transactions with shareholders) 38.7 13.0 New borrowings 443.7 63.3 Borrowings repaid (163.1) (107.8) Interest received 2.8 2.3 Interest paid (14.5) (10.8) Change in other financial debts 0.1 0.1 Other (3.7) (6.1) C) Net cash from financing activities 284.9 (65.4) D) Foreign exchange translation differences 13.7 15.8 Change in cash and cash equivalents (A+B+C+D) 210.5 (3.9) Cash and cash equivalents at beginning of period 175.8 179.8 Cash and cash equivalents at end of period 386.3 175.9 Change in cash and cash equivalents 210.5 (3.9) 4 • Statement of cash flows
  • 95.
    4. Annual Financial Statements CONTENTS 95 4.Annual Financial Statements A Financial statements at 31 December 2015. . 96 1 • BALANCE SHEET AT 31 dEcembER 2015. . . . 96 2 • INCOME STATEMENT AT 31 DeCEMBer 2015 . . . . . . . . . . . . . . . . . . . . . 98 B Notes to Annual Financial Statements. . . . 100 1 • Significant events of the financial year. . . . . . . . . . . . . . . . . 100 2 • Accounting principles, rules and methods . . . . . . . . . . . . . . . . . . . . . . . . . . 100 2.1 Fixed assets. . . . . . . . . . . . . . . . . . . . . . . . . . . . . . . . . 100 2.2 Tangible assets. . . . . . . . . . . . . . . . . . . . . . . . . . . . . . 101 2.3 Financial assets . . . . . . . . . . . . . . . . . . . . . . . . . . . . . 101 2.4 Receivables and payables. . . . . . . . . . . . . . . . . . . . 101 2.5 Marketable securities. . . . . . . . . . . . . . . . . . . . . . . . 101 2.6 Cash. . . . . . . . . . . . . . . . . . . . . . . . . . . . . . . . . . . . . . . . 101 2.7 Provisions for contingencies and charges. . . . . . 101 2.8 Employee benefits. . . . . . . . . . . . . . . . . . . . . . . . . . . 101 2.9 Profit from joint ventures . . . . . . . . . . . . . . . . . . . . . 101 2.10 Tax status. . . . . . . . . . . . . . . . . . . . . . . . . . . . . . . . . . 101 2.11 Crédit d’Impôt pour la Compétitivité et l’Emploi (CICE). . . . . . . . . . . . . . . . . . . . . . . . . . . 102 3 • Use of assessments in the preparation of financial statements. . . . . . . . . . . . . . . . 102 4 • Financial instruments. . . . . . . . . . . . . . . . . 102 5 • Notes on the balance sheet . . . . . . . . . . 104 5.1 Fixed assets. . . . . . . . . . . . . . . . . . . . . . . . . . . . . . . . . 104 5.2 Receivables. . . . . . . . . . . . . . . . . . . . . . . . . . . . . . . . . 106 5.3 Details of prepayments and deferred income. . . 106 5.4 Equity. . . . . . . . . . . . . . . . . . . . . . . . . . . . . . . . . . . . . . . 106 5.5 Provisions. . . . . . . . . . . . . . . . . . . . . . . . . . . . . . . . . . . 107 5.6 Liabilities. . . . . . . . . . . . . . . . . . . . . . . . . . . . . . . . . . . . 108 6 • Notes on the income statement. . . . . . . . 108 6.1 Analysis of turnover. . . . . . . . . . . . . . . . . . . . . . . . . . 108 6.2 Details of other income and expenses . . . . . . . . . 108 6.3 Transfers of expenses. . . . . . . . . . . . . . . . . . . . . . . . 108 6.4 Financial income and expense . . . . . . . . . . . . . . . . 109 6.5 Exceptional gains and losses. . . . . . . . . . . . . . . . . . 109 6.6 Corporate income tax. . . . . . . . . . . . . . . . . . . . . . . . 109 7 • Other information. . . . . . . . . . . . . . . . . . . . . . . 110 7.1 Related party information. . . . . . . . . . . . . . . . . . . . . 110 7.2 Financial commitments. . . . . . . . . . . . . . . . . . . . . . . 110 7.3 Pension and long service award commitments. . 110 7.4 Leasing commitments. . . . . . . . . . . . . . . . . . . . . . . . 111 7.5 Contractual obligations. . . . . . . . . . . . . . . . . . . . . . . 111 7.6 Personal training account. . . . . . . . . . . . . . . . . . . . . 111 7.7 Number of employees. . . . . . . . . . . . . . . . . . . . . . . . 111 7.8 Remuneration of directors. . . . . . . . . . . . . . . . . . . . 111 7.9 Post-balance sheet events. . . . . . . . . . . . . . . . . . . . 112 7.10 Identity of the consolidating company . . . . . . . . 112 Information on subsidiaries and non-consolidated investments . . . . . . . . . . . . . 113 Statutory auditors’ report on the financial statements. . . . . . . . . . . . . . . . . . . . . 128
  • 96.
    96 4. Annual FinancialStatements 1 • BALANCE SHEET AT 31 dEcembER 2015 Gross Depreciation - Provision 31/12/15 31/12/14 (in euros) Uncalled subscribed capital INTANGIBLE ASSETS Preliminary expenses 35,273 35,273 - - Development costs - - - - Concessions, patents and related rights 68,018,583 47,238,723 20,779 859 17,832,120 Goodwill 24,871,229 17,015,018 7,856,211 7,856,211 Other intangible assets 13,308,518 - 13,308,518 17,422,127 Advances, down payments for intangible assets - - - - PROPERTY, PLANT AND EQUIPMENT Land 9,859,507 1,553,583 8,305,923 6,763,103 Buildings 31,116,990 7,835,872 23,281,118 11,745,637 Technical facilities, equipment, machinery 827,618 643,886 183,732 105,196 Other property, plant and equipment 13,813,407 9,737,874 4,075,533 3,057,075 PPE under construction 2,250,948 - 2,250,948 13,337,847 Advances and down payments - - - - NON-CURRENT FINANCIAL ASSETS Shareholdings under the equity method - - - - Other shareholdings 853,074,008 77,656,048 775,417,960 636,607,568 Receivables from shareholdings 305,427,035 16,572,150 288,854,885 217,874,792 Other long-term investments 188,361 7,622 180,738 180,738 Loans 695,548 - 695,548 727,277 Other non-current financial assets 1,779,617 - 1,779,617 3,290,444 TOTAL FIXED ASSETS (I) 1,325,266,641 178,296,051 1,146,970,590 936,800,135 INVENTORIES AND WORK IN PROGRESS Raw materials, supplies - - - - Production in progress (goods) - - - - Production in progress (services) - - - - Semi-finished and finished goods - - - - Goods - - - - Advances and down payments on orders 389,429 - 389,429 178,234 TRADE RECEIVABLES Trade receivables and related accounts 45,049,187 439,404 44,609,783 51,054,985 Other receivables 194,441,644 29,115,902 165,325,742 180,700,311 Subscribed called non paid-up capital - - - - MISCELLANEOUS Marketable securities held for trading 18,800,902 - 18,800,902 63,317,410 Cash 112,793,706 - 112,793,706 40,732,148 ACCRUALS Prepayments 1,339,394 - 1,339,394 1,014,794 TOTAL CURRENT ASSETS (II) 372,814,263 29,555,306 343,258,957 336,997,881 Unrealised losses on foreign exchange transactions (III) 3,763,079 - 3,763,079 2,400,374 TOTAL ASSETS (I to III) 1,701,843,984 207,851,357 1,493,992,627 1,276,198,390 Financial statements at 31 December 2015 A
  • 97.
    97 4. Annual FinancialStatements 31/12/2015 31/12/2014 (in euros) LIABILITIES EQUITY Share capital or individual capital 46,851,276 46,851,276 Additional paid-in capital - - Revaluation reserves(1) 1,845,363 1,845,363 Legal Reserve 4,685,128 4,685,128 Statutory or contractual reserves - - Regulated reserves - - Other reserves 94,002,297 87,982,086 Retained earnings brought forward - - Net profit/(loss) for the year 37,599,518 25,151,149 Investment grants 502,000 502,000 Regulated provisions 1,420,265 1,406,150 TOTAL EQUITY (I) 186,905,847 168,423,151 CONTINGENCY AND LOSS PROVISIONS Provisions for contingencies 4,571,006 3,406,066 Provisions for charges 4,382,727 4,640,296 TOTAL PROVISIONS (II) 8,953,733 8,046,362 DEBTS Bank borrowings(2) 144,853,373 141,738,544 Loans and other financial debts 466,661,434 116,916,997 Customer advances and down payments 39,067 39,067 Trade payables and related accounts 35,264,145 37,826,797 Tax and social security liabilities 63,070,620 48,721,468 Liabilities on assets and related accounts 5,052,095 7,188,556 Other liabilities 571,475,109 742,004,671 accruals Deferred income 845,214 1,707,341 TOTAL LIABILITIES AND ACCRUALS (III) 1,287,261,058 1,096,143,442 Unrealised gains on foreign exchange transactions (IV) 10,871,989 3,585,435 TOTAL LIABILITIES (I TO IV) 1,493,992,627 1,276,198,390 (1) Revaluation reserves incorporated in equity 1,845,363 1,845,363 (2) Including bank overdrafts bank balances credit 144,853,373 141,738,544 Amounts payable after one year 29,929,892 10,570,000 Amounts payable within one year 114,923,481 131,168,544
  • 98.
    98 4. Annual FinancialStatements 2 • INCOME STATEMENT AT 31 DeCEMBer 2015 (in euros) France Export 31/12/2015 31/12/2014 OPERATING INCOME Sales of goods - - - - Services produced 188,775,853 8,011,920 196,787,773 186,836,372 NET REVENUE 188,775,853 8,011,920 196,787,773 186,836,372 Production held as inventory - - Capitalised production 5,977,701 2,057,089 Operating grants 43,205 10,600 Reversal of depreciation, provision and expense transfers 5,885,584 4,915,127 Other income 9,457,457 11,453,079 TOTAL OPERATING revenue (I) 218,151,720 205,272,268 Purchases of goods 8 - Change in inventory purchases (goods) - - Purchases of raw materials and other supplies 267,995 - Change in inventory purchases (materials and other supplies) - - Other purchases and operating expenses 75,988,151 65,367,350 Taxes and similar payments 9,312,814 8,611,379 Wages and salaries 92,565,343 90,570,432 Social contributions 44,009,931 43,410,303 OPERATING ALLOWANCES On capital/fixed assets: ◗ depreciation expense 13,501,011 10,714,491 ◗ charges - - On current assets: charge to provisions - - For contingency and loss provisions: charge to provisions 1,500,291 4,234,359 Other charges 10,485,665 6,403,405 TOTAL OPERATING EXPENSES (II) 247,631,210 229,311,718 1. OPERATING PROFIT/ (LOSS) (I - II) (29,479,490) (24,039,450)
  • 99.
    99 4. Annual FinancialStatements (in euros) France Export 31/12/2015 31/12/2014 Joint ventures Attributed profit or transferred loss (III) 17,302,982 15,101,308 Loss borne or transferred profit (IV) 5,580,697 6,830,367 FINANCIAL INCOME Financial income from shareholdings 35,639,217 23,271,213 Income from non-current financial assets - Other interest and similar income 7,780,204 2,523,468 Reversal of provisions charged and expense transfers 40,483,343 41,768,296 Foreign exchange gains 22,542,432 48,517,369 Net gains on sales of marketable securities 21,151 79,321 TOTAL FINANCIAL INCOME (V) 106,466,348 116,159,666 FINANCIAL EXPENSES Financial charges to depreciation and provisions 22,852,543 36,976,223 Interest and similar expenses 8,753,887 9,364,077 Foreign exchange losses 34,001,732 52,638,381 Net expenses on sales of marketable securities - - TOTAL FINANCIAL EXPENSES (VI) 65,608,163 98,978,681 2. FINANCIAL INCOME / EXPENSE (V - VI) 40,858,185 17,180,984 3. RECURRING PROFIT BEFORE TAX (I - II + III - IV + V - VI) 23,100,980 1,412,476 EXCEPTIONAL GAINS Exceptional gains on operations - - Exceptional gains on equity transactions 13,053,730 15,775,457 Reversal of provisions charged and expense transfers 2,235,324 2,542,576 TOTAL EXCEPTIONAL GAINS (VII) 15,289,054 18,318,033 EXCEPTIONAL LOSSES Exceptional losses on operations 5,114,913 5,141,037 Exceptional losses on equity transactions 10,378,469 4,727,577 Exceptional charges to depreciation and provisions 685,323 555,765 TOTAL EXCEPTIONAL LOSSES (VIII) 16,178,705 10,424,379 4. EXCEPTIONAL INCOME/ (LOSS) (VII - VIII) (889,650) 7,893,654 Employee profit-sharing (IX) - - Corporate income tax (X) (15,388,189) (15,845,019) TOTAL INCOME (I + III + V + VII) 357,210,104 363,680,451 TOTAL CHARGES (II + IV + VI + VIII + IX + X) 319,610,586 338,529,302 5. NET PROFIT/ (LOSS) 37,599,518 25,151,149
  • 100.
    100 4. Annual FinancialStatements 1 • Significant events of the financial year Subscription to the capital increases of subsidiaries Pursuant to regulations on the trade’s practices relating to the financial capacity of public passenger transportation businesses, in 2015, Keolis S.A. subscribed to capital increases in its subsi- diaries for a total amount of €26,570,331.70. The main subscriptions are as follows: (in euros) Subsidiary name Capital increase Keolis Lille 18,000,003 Keolis Lyon 4,000,000 Keolis Brest 1,500,000 Keolis Centre 1,000,005 CICE The Crédit d’impôt pour la Compétitivité et l’Emploi (tax credit for competitiveness and employment), or CICE, whose objective is to improve firms’ competitiveness, was allotted to the reple- nishment of working capital (see note 6.6). “Better fortunes” obtained Following subsidies granted by Keolis S.A. in prior financial years containing return to better fortune clauses, an entitlement amounting to €2,648,524 was recognised under exceptional income / loss at 31/12/2015. (in euros) Subsidiary name Better fortunes obtained Keolis Touraine 700,000 Keolis PMR Rhône 468,880 CTM 425,000 Keolis Côte d'Azur 219,000 Keolis Sud Lorraine 194,276 Keolis en Cévennes 146,178 Transports Evrard 143,885 Keolis Pays Normands 122,788 Keolis Montluçon 88,000 Millau Cars 46,000 Keolis Pays Nancéien 37,279 Keolis Cherbourg 28,872 Keolis Saint-Malo 20,000 Keolis Obernai 8,366 TOTAL 2,648,524 2 • Accounting principles, rules and methods The financial statements are prepared in accordance with rules laid down by the general chart of accounts in accordance with regulation ANC N°2014-03 dated 5 June 2014 of the French Accounting Standards Authority (Autorité des Normes Comptables) and principles generally accepted in the profession. General conventions were applied in compliance with the pru- dence principle, in accordance with the basic assumptions of: ◗ continuity of operations; ◗ consistency of accounting methods from one year to another; ◗ independence of financial years. The basic method used to value the items in the accounts is the historical costs method. There were no exceptions from standards nor changes in method that affected the annual financial statements. The main accounting policies used are described below. Tangible and intangible assets are valued either at cost of acqui- sition of, when produced, at their production cost or revalued amount according to legal requirements. 2.1 Fixed assets Goodwill A technical loss on mergers is recognised further to a merger or a complete transfer of assets and liabilities, and corresponds to the negative difference between the net asset received and the net carrying amount of the absorbed company’s securities recorded on Keolis S.A.’s balance sheet under assets. When applicable, it is adjusted to take into account the tax benefit resulting from the allocation of unused losses transferred by the absorbed company. This negative goodwill is not amortised. At the year end, an impairment loss is recorded when the value in use, determined using a discounted cash flow valuation method, is less than the acquisition value of goodwill. The good- will is grouped with other assets to determine its utility value as part of impairment testing. Other intangible assets This item mainly concerns the cost of systems software acquired which is amortized over 5 years for IT projects and 3 years for desktop software. Intangible assets in progress correspond to expenditure in connection with the implementation of IT projects, and therefore include all expenses that can be directly attributed to projects and which are necessary in creating, producing and preparing the asset in order to be able to function with the use intended by management. Notes to Annual Financial Statements B
  • 101.
    101 4. Annual FinancialStatements 2.2 Tangible assets Tangible assets are valued at their acquisition cost (purchase price and incidental expenses) or their production cost. Methods and depreciation periods are: Duration Method Buildings 15 to 20 years Linear Equipment and tooling 5 to 10 years Linear Office equipment and furniture 5 to 10 years Linear Automotive equipment ◗ New Vehicles • Commercial vehicles (GVM under 3.5 t.) 5 years Linear • Coaches and buses 10 to 15 years Linear ◗ Used Vehicles 2 to 14 years Linear 2.3 Financial assets Equity and other investments Equity investments are recorded at acquisition cost. If the acqui- sition value is greater than the inventory or utility value, an impair- ment is recognised for the difference. For each of the holdings, the utility value is determined on the basis of a range of valuation methods (discounted cash flow, revalued net position). Other financial assets are stated at their acquisition cost. Where applicable, an impairment is recorded if their utility value falls below their acquisition cost. Receivables related to equity and current accounts Receivables related to equity and current accounts are recorded at nominal value. When equities are fully depreciated and the net assets of the subsidiary is negative, an impairment of all receivables related to equity and current accounts is recorded due to the risk of loss of these receivables following the transfer or cessation of the activities of the subsidiary. 2.4 Receivables and payables Receivables are recorded at their nominal value. Where applicable, a depreciation is recognised whenever there is a risk of non-recovery. Receivables and payables in foreign currencies are converted at the year-end exchange rate of the functional currency. Foreign exchange differences resulting from this adjustment with the transaction date exchange rate appear under “foreign exchange translation differences”. Unrealised foreign exchange losses are subject to a provision for liabilities, unrealised foreign exchange gains are not recorded in the income statement. 2.5 Marketable securities These are recorded at their acquisition cost. Where applicable, an impairment loss is recognised for each line of securities of a simi- larnature,inordertobringtheirvaluetotheiraverageclosingprice, or their probable trading value for unlisted securities. 2.6 Cash Cash balances in foreign currencies are converted at the closing exchange rate of the financial period. Foreign exchange diffe- rences resulting from this adjustment with the transaction date exchange rate appear under “foreign exchange translation dif- ferences”. 2.7 Provisions for contingencies and charges A provision for contingencies and charges is recorded when the company has a legal or implicit obligation to a third party arising from a past event, whose amount can be reliably estimated and where it is probable that its settlement will cause an uncompen- sated outflow of resources. 2.8 Employee benefits Employee benefits include payments due on retirement and long service awards. Evaluations of these obligations are carried out annually using the projected unit credit method. The main actuarial assumptions used for the assessment of employee benefits are as follows: ◗ Discount rate 1.49% ◗ Long-term expected inflation rate 1.75% ◗ Rate of salary increases 4.50% ◗ Mobility rate 6.40% ◗ Type of retirement At the initiative of the employee ◗ Mortality table INSEE TD/TV 2011 – 2013 These commitments appear under off-balance sheet commit- ments. 2.9 Profit from joint ventures The profit or loss from joint ventures in which Keolis S.A. holds an interest are recorded under “Attributed profit or transferred loss” and “Loss borne or transferred profit”. 2.10 Tax status The results of the Company are integrated within the framework of a tax group The Group’s tax parent company is the Company GROUPE KEOLIS S.A.S. Procedures provide that tax is calcu- lated as if the Company were taxed separately Any savings achieved by the parent company from the tax losses and long-term capital losses of the subsidiary are taken by the
  • 102.
    102 4. Annual FinancialStatements former in its income statement. However, these are reallocated to the subsidiary as and when it generates future profits. 2.11 Crédit d’Impôt pour la Compétitivité et l’Emploi (CICE) The CICE, which is a tax credit, is recognised as a deduction from corporate income tax. 3 • Use of assessments in the preparation of financial statements For the preparation of annual accounts, Keolis S.A. management may be required to make estimates and assumptions that affect the book value of assets and liabilities, revenues and expenses as well as information on assets and liabilities. Actual results could differ substantially from these estimates. The estimates and underlying assumptions are made from past experience and other factors considered reasonable in the cir- cumstances. They serve as the basis for the exercise of judg- ment required in determining the carrying amounts of assets and liabilities that cannot be obtained directly from other sources. Actual values may differ from these estimates. The estimates and underlying assumptions are reviewed on an ongoing basis. In particular, disputes and litigation in progress or with employees, have been subject to review by the manage- ment with their advisers or lawyers in order to reflect the risk on the valuation of assets or liabilities. The impact of changes in accounting estimates is recorded during the period of change if it affects only that period or during the period of change and future periods if they are also affected by the change. 4 • Financial instruments Keolis S.A. uses derivative financial instruments to manage its exposuretofinancialrisksresultingfromitsoperation,financialand investing activities: ◗ interest rate risk; ◗ foreign exchange risk; ◗ commodities risk. At the year end, unrealized gains are not recognised. Unrealised lossesarebookedexceptwhentheyrelatetoinstrumentsqualified as hedges entered into in one of the following two cases: ◗ to hedge underlying items in the balance sheet which have not been revalued; ◗ to hedge future cash flows expected in a future year, under the principleofmatchingtheaccountingimpactinthesamefinancial year. The gains and losses realised are reported in the same income statement as the income and expenses on the hedged item. Interestrate,foreignexchangeandcommoditiesderivativefinancial instruments are traded with first-class bank counterparties in accordancewiththeGroup’scounterpartyriskmanagementpolicy. Consequently,thecounterpartyriskcanberegardedasnegligible. Interest rate risk relating to the variable rate portion of its financial debt On 30th September 2010, Keolis S.A. contracted a syndicated bullet loan arranged by Crédit Agricole CIB (“Private placement with Caisses Régionales de Crédit Agricole” or CRPP) for a value of €100 million. This loan was fully hedged by derivative financial instruments. The CRPP was repaid in full when it matured on 30 September 2015 and all the CRPP hedging instruments were unwound. In 2015, two credit facilities were set up by Keolis S.A.: ◗ A loan of €15 million taken out at Société Générale, set up and drawn on 15 October 2015, repayable in instalments over 8 years, to finance rolling stock. This loan is fully hedged by a derivative financial instrument; ◗ A loan of €5 million taken out at the Banque Publique d’Investis- sement (BPI), set up in December 2014 and drawn in February 2015. This credit facility was amended on 7 December 2015 to increase its amount to €7 million repayable over 3 years.
  • 103.
    103 4. Annual FinancialStatements The distribution of debt between fixed and variable rates, exclu- ding and including the derivatives portfolio is respectively: (€ million) Split excluding derivatives (€M) 31/12/2015 31/12/2014 Variable rates 22 100 Fixed rates - - (€ million) Split including derivatives (€M) 31/12/2015 31/12/2014 Variable rates 7 - Fixed rates 15 100 For hedging purposes, the €7 million credit line obtained from the BPI was incorporated into the calculation of total debt contracted by GROUPE KEOLIS S.A.S. Currency risk The Group has put in place intra-group loans denominated in foreign currency and recognised in current accounts. In order to cover the resulting foreign exchange risk, the Group uses deri- vative financial instruments which allow it to fix the exchange rates of these intra-group loans. The derivative financial instruments used by Keolis S.A. are stan- dard, liquid and market-available: ◗ forward and futures sales and purchases; ◗ foreign exchange swaps. Loans and borrowings are revalued on the closing date to the closing price. The revaluation differences, positive or negative, are recorded as financial income. Symmetrically, the variation in value of these derivative financial instruments subscribed to cover these intra-group loans is also recorded in financial income. Inter-company loan hedges that were still open at 31 December 2015 are as follows: Hedging instruments Nominal Maturity Forward sell AUD / EUR swaps AUD 5.7 M 2016 Forward sell CAD / EUR swaps CAD 32.0 M 2016 Forward sell DKK / EUR swaps DKK 334.6 M 2016 Forward sell GBP / EUR swaps GBP 15.0 M 2016 Forward sell USD / EUR swaps USD 80.3 M 2016 Commodity price risks Within the scope of its activities, the Group is exposed to a risk in the fluctuation of the price of certain commodities, in particu- lar diesel. The diesel cost price fluctuation risk is generally hedged using price indexation included in the contracts signed by Keolis S.A. and its subsidiaries with their clients. For its diesel purchases, the Group nonetheless bears the price risk until it is passed on to its customers. This time lag, when it exists, usually lasts only a few months, and up to a maximum of twenty-four months. A hedging policy has been set up to cover this partial exposure. Management’s objective for commodity risk management is to defend the prices indexed under the contracts. Keolis S.A. covers this commodities risk using standard, liquid and market-available derivative financial instruments, namely: ◗ swaps; ◗ cap calls; ◗ cap puts to unwind an existing cap or to realise a cap spread; ◗ floor puts if tied with cap calls to create symmetrical or asym- metrical collars; ◗ floor calls, in particular to buy back floors that constitute asym- metrical collars.
  • 104.
    104 4. Annual FinancialStatements Hedges of diesel taken by Keolis S.A. as at 31st December 2015 are as follows: Type of hedging instrument Volume in tonnes yet to mature Maturing in 2016 Maturing in 2017 Swaps 32,632 28,932 3,700 Collars (symmetrical parts) Cap purchase and floor sale 11,500 9,900 1,600 Collars (asymmetrical parts) Floor sales 1,950 1,950 - TOTAL 46,082 40,782 5,300 5 • Notes on the balance sheet 5.1 Fixed assets Gross values * dont 2 478 K€ d’écart de conversion des créances rattachées à des titres de participation ** dont 6 208 K€ de cessions de titres liées aux transmissions universelles de patrimoine (in € thousand) Gross value at start of year Increase Decrease Transfers between items Gross value at end of year Intangible assets Concessions, patents, licences 56,104 5,985 (10,249) 16,214 68,054 Goodwill 24,871 - - - 24,871 Other intangible assets 17,422 12,100 - (16,214) 13,309 Tangible assets Land and development 8,317 1,543 - - 9,860 Buildings - on own land 14,330 1,722 - 11,209 27,262 - on other land 1,807 - (1,163) 1,163 1,808 - general facilities 2,047 - - - 2,047 Plant, equipment, tooling 717 111 - - 828 Office and computer equipment and furniture 11,261 2,799 (147) - 13,813 Assets under construction 13,339 1,284 - (12,372) 2,251 Financial assets Holdings 974,772 186,988 (3,258) - 1,158,501 Other fixed investments 188 - - - 188 Loans and other financial assets 4,060 334 (1,919) - 2,475 GRAND TOTAL 1,129,135 212,720 (16,736) - 1,325,267
  • 105.
    105 4. Annual FinancialStatements Depreciation and amortisation (€ thousand) Depreciation at start of year Increase Decrease Depreciation at year end Intangible assets Intangible assets 38,281 10,415 (1,414) 47,283 Tangible assets Land and development 1,500 - - 1,500 Buildings - on own land 3,503 1,257 - 4,760 - on other land 933 101 - 1,034 - general facilities 2,004 38 - 2,042 Plant, equipment and tooling 618 26 - 644 Other tangible assets 8,097 1,664 (23) 9,738 TOTAL 54,936 13,502 (1,437) 67,001 Intangible assets Intangible assets principally include goodwill for €24,871 thou- sand (net value of €7,865 thousand) consisting of technical deficits relating to equities of Keolis Sud Allier for €17,006 thou- sand and companies of the group Ernest Planche for €7,807 thousand. Assets under construction Intangible assets in progress focus primarily on the design, deve- lopment and deployment of new operations, pre-payroll and maintenance software solutions. Implementation is carried out by internal and external teams. Tangible assets under construction are mainly related to real estate. Transport equipment Investments in road passenger transport equipment are made by the Group’s subsidiaries or funding bodies. Investments The major increases in the year arising from purchases, creation of companies, exchanges and capital increases are: ◗ Keolis Australia: €22,616 thousand, ◗ Keolis America: €21,058 thousand, ◗ Syntus: €20,702 thousand, ◗ Keolis Lille: €18,000 thousand, ◗ Motion Lines: €7,225 thousand, ◗ Voyages Fouache: €4,288 thousand, ◗ Keolis Lyon: €4,000 thousand. The major decreases in the year come from sales and liquida- tions. They are as follows: ◗ Transétude: €393 thousand, ◗ Keolis Concarneau: €137 thousand, ◗ Passerelle CDG: €13 thousand. Receivables related to investments The major increases in the year are: ◗ Keolis Bus Danmark: €21,662 thousand, ◗ Keolis UK: €15,006 thousand, ◗ Keolis Lille: €10,700 thousand, ◗ Keolis Bordeaux Métropole: €10,392 thousand, ◗ Courriers d’Ile de France: €5,303 thousand. The main decreases in the year: ◗ EFFIA Saint Etienne: €586 thousand, ◗ Syntus: €10,702 thousand.
  • 106.
    106 4. Annual FinancialStatements 5.4 Equity 5.3 Details of prepayments and deferred income Details of prepaid expenditure at 31 December 2015 (in € thousand) Diesel swaps 15 Rent and charges 1,130 IT licences 73 Abu Dhabi balance 122 TOTAL 1,340 Details of deferred income at 31 December 2015 (in € thousand) Diesel swaps 845 TOTAL 845 (1) Other receivables: these include in particular €121,230 thousand of current accounts and €17,322 thousand of share of profits from joint ventures. 5.2 Receivables Details of accrued income at 31 December 2015 (in € thousand) Accrued interest on advances and current accounts 3,352 Customer invoices outstanding 23,770 Supplier credit notes outstanding 4 Tax and social security receivables 184 TOTAL 27,310 (in € thousand) Gross amount Due in less than one year Due in more than one year Fixed assets Receivables related to investments 305,427 2,953 302,474 Loans 696 - 696 Other financial assets 1,780 - 1,780 Current assets Prepayments and deposits made 389 389 - Trade receivables and related accounts 45,049 45,049 - Other receivables (1) 194,442 194,442 - Deferred charges 1,339 1,339 - TOTAL 549,122 244,173 304,950 (in € thousand) Amount at 31/12/2014 Distributions 2015 Profit 31/12/2015 Other movements Amount at 31/12/2015 Capital 46,851 - - - 46,851 Revaluation difference 1,845 - - - 1,845 Legal reserve 4,685 - - - 4,685 Other reserves 87,982 6,020 - - 94,002 Profit for the year 25,151 (25,151) 37,600 - 37,600 Regulated provisions 1,406 - - 14 1,420 Investment grants 502 - - - 502 TOTAL 168,423 (19,131) 37,600 14 186,906
  • 107.
    107 4. Annual FinancialStatements The General Meeting of 11 May 2015 allocated the profit of the 2014 financial year, amounting to €25,151,148.94, as follows: (in € thousand) Profit for the year 25,151 DISTRIBUTABLE PROFIT 25,151 TOTAL 25,151 Dividends paid 19,131 Other reserves 6,020 Share capital At 31 December 2015, capital is fixed at the sum of 46,851,276 euros divided into 3,904,273 shares of nominal value of €12. Regulated provisions Regulated provisions include in particular €1,023 thousand for depreciation, including €14 thousand charged in the year. (in € thousand) At start of year Increase Decrease At year end Regulated provisions 1,406 18 (4) 1,420 Provisions for contingencies and losses Provisions for disputes 1,006 148 (346) 808 Provisions for exchange losses 2,400 3,763 (2,400) 3,763 Provisions for charges 4,089 1,555 (2,235) 3,409 Provisions for long service awards 552 469 (47) 974 Asset depreciation Goodwill 17,006 - - 17,006 Land 54 - - 54 Depreciation of investments 99,027 6,370 (27,741) 77,656 Depreciation of other financial assets 21,313 - (4,733) 16,580 Depreciation of client accounts 439 - - 439 Other depreciation(1) 26,077 13,097 (10,058) 29,116 TOTAL 173,369 25,420 (47,564) 151,225 5.5. Provisions Reversals of provisions used amount to €2,468 thousand, inclu- ding €819 thousand related to provisions for disputes. Depreciation of investments The major increases in the year are: (€ thousand) ◗ Keolis Nord Allier 2,526 ◗ Keolis Centre 1,000 ◗ SCAC 949 ◗ Aerolis 777 ◗ Keolis Sud Allier 750 The major decreases in the year are: (€ thousand) ◗ Keolis America 5,344 ◗ STA 4,868 ◗ Keolis Brest 3,818 ◗ Keolis Roissy Airport 2,519 ◗ Caron Voyages 1,715 (1) composed primarily of write-downs of Group current accounts.
  • 108.
    108 4. Annual FinancialStatements 5.6 Liabilities (in € thousand) Gross amount Up to 1 year Between 1 and 5 years More than 5 years Bank borrowings(1) 144,853 114,923 29,930 - Loans and other financial debts 466,661 1,042 465,619 - Trade payables and related accounts 35,264 35,264 - - Tax and social security debts 63,071 63,071 - - Debts on assets and related accounts 5,052 5,052 - - Other liabilities(2) 571,514 571,514 - - TOTAL 1,286,416 791,153 495,263 - (1) Includes €113,522 thousand of creditor bank balances and €1,402 thousand of loan repayments and accrued interest. (2) Other liabilities: include short-term current account deposits and cash pooling from subsidiaries of €562,073 thousand and deferred income of €845 thousand. Details of accrued liabilities at 31/12/2015 (in € thousand) Accrued interest on advances and current accounts 1,042 Supplier invoices not received 30,652 Tax and social security liabilities 32,701 Accrued cash interest 1,402 Discounts and rebates 1,177 TOTAL 66,974 Details of borrowing Borrowings can be broken down as follows: (in € thousand) Other bond issues and borrowing Loans from credit institutions 29,930 Creditor bank balances 113,522 Accrued interest from borrowings 1,402 TOTAL 144,853 Loans and other financial debts Current account advances to subsidiaries 466,376 Guarantee deposits received on rented property 283 Other financial liabilities 3 TOTAL 466,661 6 • Notes on the income statement 6.1 Analysis of turnover The Company generates the vast majority of its revenue in France. Revenue generated abroad amounts to 8,011,919.95 euros. 6.2 Details of other income and expenses (in € thousand) Other operating income Gains on diesel hedging 3,405 Supplier discounts 6,054 Other (2) TOTAL 9,457 Other operating expenses Losses on diesel hedging 8,576 Royalties 1,857 Other 57 TOTAL 10,486 6.3 Transfers of expenses (in € thousand) Staff related expenditure 240 Government vocational training agency refunds 119 Insurance 1,059 Construction work 3 TOTAL 1,421
  • 109.
    109 4. Annual FinancialStatements 6.4 Financial income and expense 6.5 Exceptional gains and losses 6.6 Corporate income tax The corporate income tax for the year consists of: (in € thousand) Income Expense Balance Income from investments 24,275 - 24,275 Depreciation and provisions, net of reversals 40,483 (22,853) 17,631 Interest on current accounts 11,365 (3,963) 7,402 Interest on loans - (2,614) (2,614) Foreign exchange gains / losses 22,542 (34,002) (11,459) Losses/receivables related to investments - - - Income from sale of marketable securities 21 - 21 Technical gains/losses on mergers - (25) (25) Other financial income and expense 7,780 (2,152) 5,628 TOTAL 106,466 (65,608) 40,858 (in € thousand) Gains Losses Balance Staff related expenditure - (5,085) (5,085) Income / (loss) from intangible asset disposals 8,787 (8,686) 100 Income / (loss) from tangible asset disposals 1,162 (1,285) (123) Income / (loss) from financial asset disposals 370 (407) (37) Tax penalties - (30) (30) Other exceptional income (inc. better fortunes on 2011 subsidies(1) ) 2,735 - 2,735 Depreciation and provisions, net of reversals 2,235 (685) 1,550 Other exceptional items - - - TOTAL 15,289 (16,179) (890) (in € thousand) Profit before tax Tax due Net profit Current 23,101 852 22,249 Exceptional (890) (306) (584) CICE - (15,879) 15,879 Other tax credits - (55) 55 Total 22,211 (15,388) 37,600 (1) See details of return to better fortunes, note 1.
  • 110.
    110 4. Annual FinancialStatements Increase and reduction in future tax liabilities The deferred tax bases are as follows: 7 • Other information 7.1 Related party information No disclosures are made with regard to transactions between related parties, insofar as these transactions are completed at normal market conditions. (€ thousand) At 31/12/2015 ASSETS Investments 853,074 Receivables related to investments 305,427 Trade receivables and related accounts 39,034 Other operating receivables 191,576 LIABILITIES Loans and other financial debts 466,376 Trade payables and related accounts 10,238 Debts on fixed assets 225,604 Other operating liabilities 576,881 FINANCIAL INCOME Income from investments 24,275 Guarantees and others 7,780 Interest on current accounts 11,386 FINANCIAL EXPENSES Interest on current accounts 3,963 7.2. Financial commitments Other financial commitments On 30th September 2010, Keolis S.A. contracted a syndicated bullet loan arranged by Crédit Agricole CIB (“Private placement with Caisses Régionales de Crédit Agricole” or CRPP) for a value of €100 million. This loan was fully hedged by derivative financial instruments. The CRPP was repaid in full when it matured on 30 September 2015 and all the CRPP hedging instruments were unwound. In 2015, two credit facilities were set up by Keolis S.A.: ◗ A loan of €15 million taken out at Société Générale, set up and drawn on 15 October 2015, repayable in instalments over 8 years, to finance rolling stock. This loan is fully hedged by a derivative financial instrument; ◗ A loan of €5 million taken out at the Banque Publique d’Investis- sement (BPI), set up in December 2014 and drawn in February 2015. This credit facility was amended on 7 December 2015 to increase its amount to €7 million repayable over 3 years. At 31 December 2015, the portfolio of guarantees and securities given by Keolis S.A. breaks down as follows. Bank guarantees (guarantees and endorsements): €356.5 million Parent company guarantee: €793.7 million 7.3 Pension and long service award commitments Retirement payments The amount of pension liabilities at 31 December 2015 stood at €23,195 thousand. This sum is not provided for in the annual financial statements and appears under financial commitments. (€ thousand) Deferred tax base at 1 January 2015 Increase Decrease Deferred tax base at 31 December 2015 Provisions and deferred charges Provisions for foreign exchange losses 2,400 3,763 (2,400) 3,763 Other provisions 686 - - 686 Other temporary differences Contribution Sociale de Solidarité 912 617 (913) 616 Translation difference - liability 3,585 10,872 (3,585) 10,872 Translation difference - asset (1,015) 2,400 (3,763) (2,378) Income subject to deferred taxation 1,690 - (845) 845 Other 54 - (3) 51 Total 8,312 17,652 (11,509) 14,455
  • 111.
    111 4. Annual FinancialStatements ASSETS UNDER LEASE Depreciation charges (€ thousand) Initial cost In year Accumulated Net value Land 278 - - 278 Buildings 1,517 - 1,517 - Transport equipment 912 38 815 97 TOTAL 2,707 38 2,332 375 LEASING COMMITMENTS Rentals paid Rentals yet to be paid (in € thousand) In year Accumulated Up to 1 year Between 1 year and 5 years + 5 years Total to be paid Residual purchasing price Land, buildings 1,239 - - - - - Transport equipment 2,574 - - - - - TOTAl 3,813 - - - - - Commitments at 31 December 2015 are as follows: 7.5 Contractual obligations The operating leases taken out mainly by Keolis S.A. subsidiaries on vehicles (coaches and buses) are signed with financial insti- tutions for periods not exceeding eight years; the residual value is equal to the projected market value at the end of the rental period. Rentals excluding VAT still outstanding at 31 December 2015 amounted to €254,588 thousand, split up as follows: ◗ less than one year: €65,610 thousand, ◗ from 1 to 5 years : €159,467 thousand, ◗ more than 5 years : €29,511 thousand. Keolis provides an undertaking to continue the rental in terms of the payment of the rental amounts that remain due under the contract if the subsidiary defaults. In return, the financing body undertakes to keep the related vehicles available to the Group. 7.6 Personal Training Account The compte personnel de formation (CPF) replaced the droit individuel de formation (DIF) on 1 January 2015, taking over the training entitlements accrued at 31 December 2014. It is funded by the single contribution to the state-approved collecting bodies which have replaced the companies as responsible for its mana- gement. 7.7 Number of employees The average annual headcount can be broken down as follows: 31/12/2015 31/12/2014 Executives 1,203 1,153 Supervisors and technicians 175 171 Employees 30 39 TOTAL 1,408 1,363 7.8 Remuneration of directors No directors’ fees are allotted to members of the Group’s mana- gement or executive committees. Remuneration of members of management bodies No remuneration was paid to members of the Group’s manage- ment bodies during 2015. Long service awards The amount provisioned in the annual financial statements at 31 December 2015 related to long service awards stands at €974 thousand. 7.4 Leasing commitments The booking as capital assets and depreciation of goods financed by leasing would have resulted in the following values at 31 December 2015:
  • 112.
    112 4. Annual FinancialStatements 7.9 Post-balance sheet events Access to GROUPE KEOLIS S.A.S.’ syndicated loan On 20 February 2016, Keolis S.A. became an additional bor- rower on the €900 million syndicated loan contracted by GROUPE KEOLIS S.A.S. on 12 July 2013. This modification enables Keolis S.A. to reinforce its liquidity and its borrowing capacity though direct access to an external source of finance whilst benefitting from the guarantee of GROUPE KEOLIS S.A.S. relating to the possible use of this line of credit. The main characteristics of this syndicated loan, following amendments made on 11 June 2015 are: ◗ a maximum amount of €900 million, ◗ a maturity on 11 June 2020, ◗ a provision under which Keolis may extend the maturity by an additional year, in 2016 and 2017, subject to the approval of the entire financing syndicate. Maturity could thereby be extended until 11 June 2022. At 31 December 2015 the undrawn amount on this syndicated loan stood at €300 million. Keolis S.A. capital increase On 3 March 2016, Keolis S.A. launched a capital increase amounting to €300 million. Fully subscribed to by its shareholder GROUPE KEOLIS S.A.S., this operation aims to reinforce Keolis S.A.’s capital base in order to support the future development of its public transport activities in France and worldwide. This operation, conducted in the form of a set-off of claims between GROUPE KEOLIS S.A.S. and Keolis S.A., reduced Keolis S.A.’s net debt by €300 million. As a consequence of this capital increase, equity attributable to the Group would amount to €486.9 million instead of €186.9 million. Keolis acquires Transports Daniel Meyer in Ile-de-France In January 2016, the Keolis Group announced the acquisition of a leading bus and coach service operator in Ile-de-France, Transports Daniel Meyer. With this strategic external growth transaction, Keolis reinforces its foothold in Ile-de-France and consolidates its position for future projects relating to Grand Paris Express. Keolis Ile-de-France, which generated 400 million euros of turnover in 2014, operates a fleet of 1,900 vehicles across 25 depots. Established in all of the departments compri- sing the Paris region, its 19 subsidiaries employ 4,000 people and carry 70 million passengers each year. The group Transports Daniel Meyer has 440 employees and a fleet of 260 vehicles. It generated a turnover of 40.4 million euros in 2014. Its main line of business is in the operation of approximately 50 timetabled bus lines, supplemented by school buses and school outings and charter activity. 7.10 Identity of the consolidating company The Company belongs to a Group whose consolidating com- pany is GROUPE KEOLIS S.A.S., incorporated and domiciled in France, under SIRET number 49432127600037, headquar- tered at 20/22 Rue Le Peletier, 75009 Paris. The consolidated accounts of GROUPE KEOLIS S.A.S. are established in accordance with articles L 233-16 to L 233-28 of the French Commercial Code.
  • 113.
    113 4. Annual FinancialStatements Informationonsubsidiariesandnon-consolidated investments(positionat31December2015) Detailed information on shareholdings whose carrying amounts exceed 1% of the capital of the Company required to publish its financial statements A - SUBSIDIARIES (AT LEAST 50% OF CAPITAL HELD BY THE COMPANY) (€ thousand) Equity at 31 December 2014 Percentage ofcapitalheldat 31December2015 Grossvalueof securitiesheldat 31December2015 Netcarryingvalue ofsecuritiesheldat 31December2015 Loansandadvances grantedbytheCompany andnotrefunded increditat 31December2015 Amountofdepositsand guararanteessupplied bytheCompanyat 31December2015 Revenueexcl.VATfor financialyearended 31/12/2014 Netprofitorloss(-) forfinancialyearended 31/12/2014 Dividendscollected bytheCompanyduring the2015financialyear Share capital Other equity Companies or groups of companies 1) FRENCH SUBSIDIARIES Keolis Chalons en Champagne 148 483 99.24 861 861 -708 - 6,165 280 193 Chemin des Grèves - BP 68 - 51000 Chalons-en-Champagne Keolis Touriscar Ain 1,746 -1,779 100.00 1,715 - - - -6 - 20 rue de la Villette - 69328 Lyon Société d'Exploitation des Transports Urbains d'Oyonnax 44 18 100.00 44 44 -26 - - - - 7 Place Vaillant Couturier - 01100 Oyonnax Keolis Oyonnax 90 -3 99.98 90 90 93 - 1,993 -1 - Rue de la Tuilerie - 01100 Arbent Sté des Transports de l'Agglomération de Chauny 8 27 50.00 4 - - - -13 - 150 Avenue Jean Jaurès - 02300 Chauny Keolis Château-Thierry 25 21 100.00 25 25 155 - 2,017 10 15 5 rue Vallée - 02400 Château-Thierry Keolis Chauny-Tergnier 45 31 100.00 45 45 -286 - 1,296 25 18 150 avenue Jean Jaurès - 02300 Chauny Keolis Montluçon 197 115 100.00 197 197 -779 - 5,619 48 - Rue des Canaris - 03100 Montluçon Keolis Sud Allier 325 2,241 100.00 3,088 2,338 773 - 6,950 250 - 14 boulevard Alsace Lorraine - 03300 Cusset Keolis Vichy 300 611 100.00 660 660 -525 - 3,772 110 - Boulevard Alsace Lorraine - 03300 Cusset Cie Transports Méditerranéens 160 943 100.00 9,279 9,279 -2,361 - 8,990 295 - Allée des Cormorans - ZI la Frayère Mandelieu - 06150 Cannes la Bocca Société Automobile de Provence 220 232 99.79 1,982 1,982 1,375 - 2,842 112 - 840 Avenue Emile Hugues - 06140 Vence Keolis Garonne 38 971 100.00 1,608 1,608 -295 - 4,078 121 28 ZI de Bonzom - 09270 Mazères Société de gestion de l'Aéroport de Troyes en Champagne 10 -26 100.00 10 - 93 - - -3 - 20-22 rue Le Peletier - 75009 Paris
  • 114.
    114 4. Annual FinancialStatements (€ thousand) Equity at 31 December 2014 Percentage ofcapitalheldat 31December2015 Grossvalueof securitiesheldat 31December2015 Netcarryingvalue ofsecuritiesheldat 31December2015 Loansandadvances grantedbytheCompany andnotrefunded increditat 31December2015 Amountofdepositsand guararanteessupplied bytheCompanyat 31December2015 Revenueexcl.VATfor financialyearended 31/12/2014 Netprofitorloss(-) forfinancialyearended 31/12/2014 Dividendscollected bytheCompanyduring the2015financialyear Share capital Other equity Companies or groups of companies Keolis Aude 1,783 -913 100.00 2,857 2,857 -477 - 9,506 -23 - Pech Loubat - 11000 Narbonne Keolis Narbonne 504 -549 100.00 720 720 -1,041 - 8,647 -156 - Avenue de Pech Loubat - 11000 Narbonne Cedex Keolis Aveyron Millau Cars 126 156 100.00 624 624 -125 - 1,583 138 - ZA Saint Martin - 8 Impasse de l'Aigoutal - 12100 Creissels Keolis Cote d'Azur 290 360 100.00 289 289 -633 - 3,292 235 - 59. rue de la Buffa - 06000 Nice Keolis Baie des Anges 7,305 -6,827 100.00 10,790 10,790 -1,792 - 14,252 93 - 742 route de Grenoble - 06200 Nice Keolis Camargue 58 73 99.97 2,889 76 -66 - -26 55 - 20. rue de la Villette - 69328 Lyon Société Transports Robert 38 2,421 99.96 821 821 -2,169 - 7,855 552 - 31 avenue José Nobre - BP 57 - 13500 Martigues Société Autocars de Provence 46 1,005 99.97 840 840 72 - 8,324 299 182 289 rue des Roseaux - 13320 Bouc Bel Air Keolis Pays d'Aix 1,870 -1,614 100.00 2,510 2,510 3,948 - 36,082 -376 - Rue des roseaux - Quartier du verger - 13320 Bouc Bel Air SCAC SA 2,711 -2,913 100.00 4,308 0 1,058 - 6,119 -876 - 398 Avenue du Mistral - ZI ATHELIA - 13600 - La Ciotat Keolis Arles 135 -137 100.00 136 5 59 - - -1 - 20. rue de la Villette - 69328 Lyon Caennaise de Services 11 39 100.00 11 11 -124 - 1,073 16 10 40. rue de Bengales - 14000 Caen Keolis Calvados 1,100 3,067 100.00 1,152 1,152 -4,458 - 31,736 2,077 619 19. chemin de Courcelle - BP 127 - 14128 Mondeville Keolis Bus Verts 100.00 19 chemin de Courcelles - 14120 Mondeville Keolis Pays Normands 276 186 100.00 1,268 - -77 - 3,058 217 - ZI la Madeleine. rue de l'Ile du Marais Carentan - 50500 Carentan Keolis Caen 1,065 1,931 100.00 2,251 2,251 -9,189 - 53,474 528 532 15 rue de la Geôle - 14000 Caen Keolis Littoral 3,566 -3,460 100.00 4,258 4,258 -142 - 13,765 -669 - 2 avenue du Pont Neuf - 17300 Rochefort Keolis Saintes 140 48 100.00 139 139 -608 - 2,836 35 17 Rue des Perches - ZI Charriers - 17100 Saintes
  • 115.
    115 4. Annual FinancialStatements (€ thousand) Equity at 31 December 2014 Percentage ofcapitalheldat 31December2015 Grossvalueof securitiesheldat 31December2015 Netcarryingvalue ofsecuritiesheldat 31December2015 Loansandadvances grantedbytheCompany andnotrefunded increditat 31December2015 Amountofdepositsand guararanteessupplied bytheCompanyat 31December2015 Revenueexcl.VATfor financialyearended 31/12/2014 Netprofitorloss(-) forfinancialyearended 31/12/2014 Dividendscollected bytheCompanyduring the2015financialyear Share capital Other equity Companies or groups of companies Compagnie du Blanc Argent CBA 279 760 99.41 4,139 4,139 -1,398 - 5,961 397 295 Gare de Romorantin - 41200 Romorantin Keolis Centre 4,061 -3,730 100.00 5,163 - -244 - 6,545 -336 - 86 rue du village d'En Haut - 18230 Saint Doulchard Keolis Bourgogne 153 2,629 99.50 1,917 1,917 -4,446 - 13,107 973 434 17. rue du Bailly - ZI Dijon Saint Apollinaire - 21000 Dijon Keolis Beaune 100.00 60 60 17. rue du Bailly - ZI Dijon Saint Apollinaire - 21000 Dijon Keolis Dijon 1,206 528 100.00 1,414 1,414 -12,440 - 65,639 342 94 49. rue des ateliers - 21000 Dijon Monts Jura Autocars 2,329 -576 100.00 10,196 10,196 462 - 23,726 -396 - 4. rue Berthelot - 25000 Besançon Keolis Pays Montbéliard 546 233 100.00 542 542 -5,736 - 18,331 168 68 CD 126 La Chamotte - 25420 Voujeaucourt Keolis Besançon 91 9 99.96 89 89 -95 - - - - 46 rue de Trey - BP 1123 - 25002 Besançon Keolis Urbest 640 652 100.00 801 801 -859 - 1,421 140 440 4 rue Berthelot - 25000 Besançon Keolis Drôme Ardèche 573 1,668 100.00 3,507 3,507 -2,478 - 13,277 535 164 26. rue Laurent de Lavoisier - 26800 Portes-lès-Valence Keolis Montélimar 47 81 100.00 47 47 -642 - 3,010 35 - 8 avenue de la Feuillade - ZA du Meyrol - 26200 Montélimar Keolis Eure 467 2,620 100.00 1,555 1,555 -910 - 10,631 1,179 350 2 rue Lakanal - ZI n° 2 - 27031 Evreux Keolis Eure et Loir 538 1,797 100.00 2,363 2,363 -1,209 - 8,319 682 296 Les Fenots - 28100 Dreux Keolis Drouais 82 62 100.00 82 82 -671 - 3,179 20 - Les Fenots - 28100 Dreux Keolis Quimper 259 124 100.00 257 257 -2,353 - 11,975 68 - 1 Rond Point de Quistinidal - 29000 Quimper Keolis Brest 3,826 -4,073 100.00 5,318 5,318 -900 - 37,974 -1,745 - 7 rue Ferdinand de Lesseps - 29806 Brest Keolis Morlaix 59 65 100.00 57 57 -516 - 2,454 31 22 ZI de Kérivin - 29600 St Martin des Champs
  • 116.
    116 4. Annual FinancialStatements (€ thousand) Equity at 31 December 2014 Percentage ofcapitalheldat 31December2015 Grossvalueof securitiesheldat 31December2015 Netcarryingvalue ofsecuritiesheldat 31December2015 Loansandadvances grantedbytheCompany andnotrefunded increditat 31December2015 Amountofdepositsand guararanteessupplied bytheCompanyat 31December2015 Revenueexcl.VATfor financialyearended 31/12/2014 Netprofitorloss(-) forfinancialyearended 31/12/2014 Dividendscollected bytheCompanyduring the2015financialyear Share capital Other equity Companies or groups of companies Keolis Maritime Brest 8 -668 100.00 8 - 540 - 7,674 -248 - 1 rue Eperon - Port de Commerce - BP 80713 - 29200 Brest Keolis en Cévennes 97 233 99.19 95 95 -1,457 - 6,738 34 - 389 chemin du Viguet - 30100 Alès Keolis Alès 100.00 100 1,119 389 chemin du Viguet - 30100 Alès Sté des Transports en Commun Nimois 750 460 100.00 1,090 1,090 -10,749 - 48,913 244 141 388 rue Robert Bompard - 30000 Nîmes Keolis Auch 78 47 100.00 81 - 386 - 1,545 10 - 7 Place de la Libération - 32000 Auch Les Cars de Bordeaux 264 641 49.97 379 379 952 - 5,663 231 94 8. rue d'Artagnan - 33000 Bordeaux Keolis Gironde 684 8,312 90.65 6,658 6,658 -6,799 - 17,545 1,042 713 ZA les Artigons Issac - 33160 Saint Médard en Jalles Autobus d'Arcachon 217 2,352 100.00 2,931 2,931 -1,910 - 3,084 60 431 1431 bd de l'Industrie - 33260 La Teste de Buch Keolis Bordeaux Métropole 5,000 -3 100.00 5,000 5,000 -37,195 - -3 - 12 boulevard Antoine Gautier - 33000 Bordeaux Keolis Bordeaux 18,058 -11,229 100.00 18,058 10,106 -6,348 - 201,131 3,149 - 12 Boulevard Antoine Gautier - 33000 Bordeaux Keolis Bassin d'Arcachon 100.00 200 -200 1431 boulevard de l'industrie - 33260 La Teste Buch Les Courriers du Midi 2,039 1,083 100.00 5,117 5,116 -2,428 - 18,250 474 - 9. rue de l'Abrivado - BP 85121 - 34073 Montpellier Cedex 3 Keolis Languedoc 90 984 99.98 899 899 -1,246 - 6,268 393 234 927. avenue Joliot Curie - 30000 Nîmes Cars du Bassin de Thau 278 392 100.00 278 278 -301 - 4,212 315 185 21 av de la Méditerranée - Lieudit Etang d'Ingril - 34110 Frontignan-La Peyrade Keolis Emeraude 1,562 -703 100.00 1,878 1,878 -564 - 8,590 -201 - Rue des Rougeries ZI Sud - 35400 Saint Malo Keolis Armor 1,472 5,405 77.71 10,877 10,877 -2,686 - 36,143 986 - 26. rue du Bignon - CS 27403 - 35135 Chantepie
  • 117.
    117 4. Annual FinancialStatements (€ thousand) Equity at 31 December 2014 Percentage ofcapitalheldat 31December2015 Grossvalueof securitiesheldat 31December2015 Netcarryingvalue ofsecuritiesheldat 31December2015 Loansandadvances grantedbytheCompany andnotrefunded increditat 31December2015 Amountofdepositsand guararanteessupplied bytheCompanyat 31December2015 Revenueexcl.VATfor financialyearended 31/12/2014 Netprofitorloss(-) forfinancialyearended 31/12/2014 Dividendscollected bytheCompanyduring the2015financialyear Share capital Other equity Companies or groups of companies Société Rennaise de Transports Services Handistar 43 54 100.00 44 44 -1,049 - 3,323 28 14 26 rue Bignon - 35135 Chantepie Keolis Saint Malo 461 222 100.00 461 461 -1,343 - 8,609 12 - rue des Rougeries BP 70548 - 35405 Saint Malo Cedex Keolis Rennes 2,458 -1,174 100.00 3,096 3,096 -20,034 - 109,145 -1,024 - Rue Jean Marie Huchet - CS94001 - 35040 Rennes Keolis Châteauroux 170 54 100.00 169 169 -317 - 4,421 26 - 6 allée de la Garenne - ZI - 36000 Châteauroux Keolis Touraine 6,087 -3,243 100.00 7,472 7,472 -1,331 - 15,033 19 - Impasse de Florence - 37700 St Pierre des Corps KeolisTours 1,910 -15 100.00 1,906 1,906 -10,248 - 57,559 151 - Avenue de Florence - 37700 Saint Pierre des Corps Train Bleu SARL 274 -25 99.97 594 510 12 - 1,518 -12 - 3 impasse Claude Charon - 38160 St Marcellin Voyages Monnet 537 -1,134 100.00 2,505 - 937 - 844 -847 - Route de Grenoble - 38590 St Etienne de St Geoirs Keolis Porte d'Isère 100.00 300 300 Avenue du Lemand - 38090 Villefontaine Sté d'exploitat de l'aéroport Dole Jura 50 56 51.00 26 - 700 - 2,379 -28 - 33 place de la Comédie - 39000 Lons Le Saunier Keolis Gascogne 135 655 52.89 594 594 625 - 7,398 210 19 215 Route de Benquet - ZA de la Téoulière - 40280 Saint Pierre du Mont Keolis Blois 308 -87 100.00 427 427 369 - 10,010 -126 - 9 rue Alexandre Vezin - 41000 Blois Les Cars Roannais 156 1,977 100.00 374 374 -2,026 - 3,609 521 293 ZI les Guérins - 42120 Le Coteau Cars Planche 94 920 100.00 874 874 52 - 3,906 94 82 10 boulevard Duguet - 42600 Savigneux Keolis Atlantique 2,076 4,713 100.00 9,926 9,926 -1,974 - 36,749 2,543 778 3 rue de la Garde - ZI Bois Briand - 44300 Nantes Transports de la Brière 92 926 59.80 1,221 - -189 - 3,317 -199 - 7 rue Pierre Vergniaud - Penhoet - 44600 Saint-Nazaire
  • 118.
    118 4. Annual FinancialStatements (€ thousand) Equity at 31 December 2014 Percentage ofcapitalheldat 31December2015 Grossvalueof securitiesheldat 31December2015 Netcarryingvalue ofsecuritiesheldat 31December2015 Loansandadvances grantedbytheCompany andnotrefunded increditat 31December2015 Amountofdepositsand guararanteessupplied bytheCompanyat 31December2015 Revenueexcl.VATfor financialyearended 31/12/2014 Netprofitorloss(-) forfinancialyearended 31/12/2014 Dividendscollected bytheCompanyduring the2015financialyear Share capital Other equity Companies or groups of companies Keolis Voyages 8 92 100.00 7 7 -75 - 4,116 7 - 3 rue de la Garde-Zone de Bois Briand - 44300 Nantes Keolis Montargis 163 56 100.00 163 163 -630 - 3,948 34 20 16 rue de la Baraudière - 45700 Villemandeur Keolis Orléans Val de Loire 802 707 100.00 802 802 913 - 67,241 400 80 64 rue Pierre Louget- 45800 Saint Jean de Braye Keolis Cahors - - - 5 1 - 127 boulevard Léon Gambetta - 46000 Cahors Keolis Agen 224 34 100.00 224 224 -1,145 - 7,158 26 - Rue Georges Clemenceau - 47240 Bon Encontre Keolis Marmande 110 -54 100.00 135 135 -173 - 2,184 -45 - Impasse Doumayne - ZA de Girauflat - 47200 Marmande Keolis Val de Maine 35 2 100.00 35 35 -113 - 1,137 5 - Rue du Bois Rinier - ZI Saint Barthélémy - 49124 Saint Barthélémy d'Anjou Société de Gestion de l'Aéroport d'Angers Marcé 8 -281 100.00 8 - 1,003 - 1,732 -174 - Aéroport d'Angers-Marcé - 49140 Marcé Keolis Angers 922 550 100.00 921 921 -10,432 - 56,883 314 116 Rue du Bois Rinier - 49124 Saint Barthélémy d'Anjou Keolis Manche 497 528 100.00 3,102 3,102 -903 - 6,010 143 93 La Fosse Yvon - 50440 Beaumont Hague Keolis Cherbourg 299 14 100.00 382 382 -1,166 - 8,904 58 - 491 rue de la Chasse aux Loups - 50110 Tourlaville Keolis Chaumont 149 36 100.00 149 149 -589 - 3,123 34 - Rue du Vieux Moulin - 52000 Chaumont Keolis Laval 369 29 100.00 368 368 -2,545 - 13,264 38 - Centre JM Moron - rue Henri Batard - BP 0909 - 53009 Laval Cedex Keolis Sud Lorraine 2,575 -844 100.00 2,576 2,576 -718 - 25,622 - - 1 rue de la Sablière - 54136 Bouxières Aux Dames Keolis Bassin de Pompey 95 44 100.00 95 95 -515 - 1,540 44 29 3 rue de la Sablière - 54136 Bouxières Aux Dames
  • 119.
    119 4. Annual FinancialStatements (€ thousand) Equity at 31 December 2014 Percentage ofcapitalheldat 31December2015 Grossvalueof securitiesheldat 31December2015 Netcarryingvalue ofsecuritiesheldat 31December2015 Loansandadvances grantedbytheCompany andnotrefunded increditat 31December2015 Amountofdepositsand guararanteessupplied bytheCompanyat 31December2015 Revenueexcl.VATfor financialyearended 31/12/2014 Netprofitorloss(-) forfinancialyearended 31/12/2014 Dividendscollected bytheCompanyduring the2015financialyear Share capital Other equity Companies or groups of companies Keolis Lorient 489 92 100.00 563 563 -5,682 - 29,724 26 - Boulevard Yves Demaine - 56323 Lorient Cedex Keolis Maritime Lorient 10 644 99.00 10 10 -760 - 2,284 168 158 1 rue Yves Montand - 56260 Larmor-Plage Keolis 3 Frontières 1,976 3,365 100.00 5,869 5,869 -3,824 - 35,154 2,122 986 5 rue de l'Abbé Grégoire - 57050 Metz Keolis Nevers 324 6 100.00 324 324 -1,456 - 6,768 6 - 120 route de Marzy - 58000 Nevers Trans Val-de-Lys 1,101 3,205 100.00 2,027 2,027 -6,182 - 23,135 1,019 1,057 ZA de la nouvelle énergie - Rue de l'énergie prolongée - 59560 Comines Keolis Val Hainaut 165 2,107 96.32 3,222 3,222 -2,845 - 7,053 793 366 36 rue Ernest Macarez - 59300 Valenciennes Keolis Lille 23,544 -30,379 100.00 42,041 42,041 44,849 - 308,330 -12,905 - Château Rouge - 276 avenue de la Marne - 59700 Marcq en Baroeuil Transports Evrard 1,320 -1 100.00 8,450 - 2,812 - 9,098 - - 304 avenue du Tremblay - ZI de Vaux - 60100 Creil Keolis Oise 183 6,715 100.00 4,027 4,027 4,683 - 22,075 343 - 21 avenue Felix Louat - 60300 Senlis Keolis Alençon 38 969 100.00 38 38 -181 - 2,565 -8 - 20 rue Ampère - 61000 Alençon Keolis Arras 581 -80 100.00 669 669 - 10,675 52 - Rue Mongolfier ZI Est - 62000 Arras Keolis Artois Gohelle 908 885 99.99 677 677 - 55,662 499 363 59 avenue Van Pelt - 62300 Lens Caron Voyages 1,410 -1,259 100.00 2,365 2,365 660 - 5,062 -434 - Resurgat 1 - 64 Boulevard industriel - 62230 Outreau Voyages Dourlens 331 -326 100.00 841 841 -765 - 2,732 -176 - ZAL n°3 - rue de Belle Vue - 62700 Bruay La Buissiere Voyages Fouache 100.00 4,288 - -610 - - - 1321 route Nationale - 62117 Brebières Keolis Boulogne sur Mer 359 218 100.00 559 559 -638 - - 33 - 46/48 Rue des Canonniers - 59000 Lille Westeel Voyages 3,325 -116 100.00 5,520 5,520 -1,795 - 20,115 706 - 2. rue F. Jiolat - 62430 Sallaumines
  • 120.
    120 4. Annual FinancialStatements (€ thousand) Equity at 31 December 2014 Percentage ofcapitalheldat 31December2015 Grossvalueof securitiesheldat 31December2015 Netcarryingvalue ofsecuritiesheldat 31December2015 Loansandadvances grantedbytheCompany andnotrefunded increditat 31December2015 Amountofdepositsand guararanteessupplied bytheCompanyat 31December2015 Revenueexcl.VATfor financialyearended 31/12/2014 Netprofitorloss(-) forfinancialyearended 31/12/2014 Dividendscollected bytheCompanyduring the2015financialyear Share capital Other equity Companies or groups of companies Fouache Evasion 100.00 53 -33 1321 route Nationale - 62117 Brebières Loisirs et Voyages 914 1,969 100.00 4,254 4,254 -2,004 - 11,688 605 352 ZI de l'Industrie - 63600 Ambert KEOLIS NORD ALLIER 1,943 -1,751 94.41 2,526 - 1,084 5,211 -516 - 140 route de Lyon - 03400 Yzeure TPR SARL 341 -9 100.00 2,250 2,250 296 - 3,589 -106 - Chemin de la Saligue - 64140 Lons Keolis Pyrénées 1,367 711 95.16 2,626 2,626 -143 - 10,524 393 234 Quartier Lasbats - Route de Pau - 65420 Ibos Keolis Grand Tarbes 179 16 100.00 747 747 -916 - 4,694 24 - Centre Kennedy - Rue Jean Loup Chrétien - 65000 Tarbes Les Courriers Catalans 2,160 -1,530 100.00 3,401 618 -446 - - -31 - 7 rue Jean Perrin - 66000 Perpignan Transports GEP Vidal 1,073 -628 100.00 2,087 2,087 373 - 4,008 -27 - 7 rue Jean Perrin - 66000 Perpignan Compagnie des Transports de Perpignan 78 78 -84 - 20-22 rue Le Peletier - 75009 Paris Holding Striebig 335 - 100.00 11,159 11,159 1 - - - 198 avenue de Strasbourg - 67170 Brumath Keolis Obernai 31 21 100.00 31 31 - - 655 7 12 7 rue de la Gare - 67210 Obernai Cedex Autocars Striebig 100.00 900 900 1,193 198 avenue de Strasbourg - 67170 Brumath Autocars Eschenlauer - - 79.30 735 735 131 - - - Route de Dresenheim - 67620 Soufflenheim Autocars Planche 5,000 12,781 100.00 6,567 6,567 -11,901 - 33,623 2,311 1,500 69 rue du Champ du Garet - 69400 Arnas Keolis PMR Rhône 1,639 -644 100.00 1,639 735 -1,107 - 3,600 72 - ZI La Bandonnière - 4 rue Maurice Audibert - 69800 Saint-Priest Interhône Alpes 40 2,014 100.00 38 38 -1,982 - 699 -39 - 69 rue du Champ du Garet - BP 80157 - Arnas - 69655 Villefranche sur Saône Keolis Lyon 45,946 -44,070 100.00 49,998 49,998 -53,694 - 371,095 -5,598 - 19 boulevard Vivier Merle - 69212 Lyon Cedex 03
  • 121.
    121 4. Annual FinancialStatements (€ thousand) Equity at 31 December 2014 Percentage ofcapitalheldat 31December2015 Grossvalueof securitiesheldat 31December2015 Netcarryingvalue ofsecuritiesheldat 31December2015 Loansandadvances grantedbytheCompany andnotrefunded increditat 31December2015 Amountofdepositsand guararanteessupplied bytheCompanyat 31December2015 Revenueexcl.VATfor financialyearended 31/12/2014 Netprofitorloss(-) forfinancialyearended 31/12/2014 Dividendscollected bytheCompanyduring the2015financialyear Share capital Other equity Companies or groups of companies Keolis Val de Saône 953 271 99.27 1,006 1,006 -1,318 - 10,829 74 - 30 rue de Guerlande - Zone Verte - 71880 Chatenay le Royal Keolis Aix Les Bains 540 -310 100.00 540 - -313 - 4,499 36 - 1700 boulevard Lepic - 73100 Aix Les Bains Société pour la Mobilité à Paris 162 905 100.00 162 162 1,065 - 13,765 127 - 58 averue des Terroirs de France - 75012 Paris Institut Keolis 37 1,679 100.00 37 37 -2,100 - - 1,672 1,672 20-22 rue Le Peletier - 75009 Paris Keolis Seine Maritime 185 4,166 100.00 5,631 5,631 -4,773 - 16,259 717 295 55/57 le Nid de Verdier - 76400 Fécamp Keolis Rouen Vallée de Seine 63 406 100.00 63 63 -894 - 4,161 153 125 3 Bis rue Nicephore Niepce - Zone Industrielle - 76300 Sotteville les Rouen Les Courriers de l'Ile-de-France 344 24,112 99.99 560 560 20,382 - 105,362 4,359 2,233 34 rue de Guivry - 77980 Le Mesnil-Amelot Val Trans Services Roissy 37 2,207 100.00 660 660 -2,302 - 5,084 872 420 Rue des Acacias - 77990 Le Mesnil Amelot Airelle 6,108 -11,178 100.00 6,104 - 4,346 - 6 -79 - 1 à 9 avenue Francois Mitterand - Immeuble Le Jade - 93200 Saint Denis Transroissy SNC 2,519 -3,190 100.00 3,419 3,419 -13 - 11,177 -948 - Rue de Paris Lieu-dit La Maladrerie - 77990 Mesnil Amelot Aerosat 50 2,220 85.00 43 43 -478 - 13,503 1,217 880 Rue des Acacias - 77990 Le Mesnil Amelot Keolis Mobilité Roissy 104 -192 100.00 324 324 -3,026 - 8,484 -147 - 34 rue de Guivry - 77990 Le Mesnil Amelot Keolis Roissy Services Aeroportuaires 100.00 180 180 - - Rue de Paris - Lieu-dit La Maladrerie - 77990 Le Mesnil Amelot Cie des Transports Collectifs de l'Ouest Parisien 40 1,437 50.00 20 20 -300 - 8,280 171 85 18 rue de la Senette - 78755 Carrières sous Poissy SVTU SA 680 8,591 99.90 2,960 2,960 -1,285 - 29,277 1,311 440 12 avenue du Général de Gaulle - Les Manèges - 78000 Versailles Keolis Yvelines 358 -102 99.68 959 959 2,758 - 4,467 33 - 12 avenue du Général de Gaulle - Les Manèges - 78000 Versailles
  • 122.
    122 4. Annual FinancialStatements (€ thousand) Equity at 31 December 2014 Percentage ofcapitalheldat 31December2015 Grossvalueof securitiesheldat 31December2015 Netcarryingvalue ofsecuritiesheldat 31December2015 Loansandadvances grantedbytheCompany andnotrefunded increditat 31December2015 Amountofdepositsand guararanteessupplied bytheCompanyat 31December2015 Revenueexcl.VATfor financialyearended 31/12/2014 Netprofitorloss(-) forfinancialyearended 31/12/2014 Dividendscollected bytheCompanyduring the2015financialyear Share capital Other equity Companies or groups of companies Keolis Somme 219 96 99.99 219 219 -354 - 1,855 - 15 ZI du Frier - 80290 Poix de Picardie Société d'Exploitation de l'Aéroport Albert Picardie 50 -118 50.96 26 - 191 - 404 -145 - Rue Henri Potez - 80300 Meaulte Keolis Abbeville 162 107 99.02 186 186 33 - 2,414 33 49 Place de la Gare - 80100 Abbeville Cariane Littoral 2,762 -2,345 100.00 2,824 2,824 -457 - 5,086 -125 - Place de la Gare - 59820 Gravelines Société Départementale des Transports du Var 1,344 2,419 95.08 5,303 5,303 170 - 17,104 55 - 175 Chemin du Palyvestre - 83400 Hyères  Keolis Châtellerault 113 55 100.00 111 111 -751 - 3,687 39 28 6 rue Le Prince Ringuet - 86100 Châtellerault Keolis Epinal 141 506 100.00 141 141 396 - 4,918 235 296 ZAC de la Magdeleine - 88000 Epinal Autocars Garrel et Navarre 47 6,394 100.00 5,783 5,783 -4,310 - 11,491 844 848 19 rue Charles Mory - 91210 Draveil Société d'Exploitation Transport de Voyageurs Evry-Ris 50 51 100.00 1,982 - -114 - 229 128 - 172 Avenue François Mitterrand - 91200 Athis Mons Athis Cars SA 230 5,882 100.00 5,594 5,594 3,580 - 31,669 1,220 438 172 avenue François Mitterrand - 91200 Athis Mons STA SARL 3,004 -2,148 100.00 5,705 5,705 3,443 - 9,529 -656 - 110 route Nationale 191 - La belle Etoile - 91540 Mennecy Intrabus EURL 282 1,350 100.00 759 759 -710 - 12,078 414 211 1 à 3 avenue François. Mitterand - 93200 Saint Denis Société Exp. Francilienne Inter Modalité (STEFIM) 40 -490 100.00 40 - 1,873 - 723 -497 - 1 à 3 avenue Francois Mitterand - Immeuble Le Jade - 93200 Saint Denis Autocars Delion 482 572 100.00 2,557 2,557 158 - 7,281 270 190 12 rue Jean Perrin - 92000 Nanterre Keolis Mobilité Hauts de Seine 10 -1,388 100.00 10 - 1,387 - 15 -79 - 1-3 av Francois Mitterrand - Batiment le Jade - 93200 La Plaine St Denis S.F.D 40 527 100.00 1,184 566 -562 - - -1 - 20-22 rue Le Peletier - 75009 Paris Keolis Travel Services 397 -482 100.00 517 - 465 - 1,686 -253 - 12 rue Jean Perrin - 92000 Nanterre
  • 123.
    123 4. Annual FinancialStatements (€ thousand) Equity at 31 December 2014 Percentage ofcapitalheldat 31December2015 Grossvalueof securitiesheldat 31December2015 Netcarryingvalue ofsecuritiesheldat 31December2015 Loansandadvances grantedbytheCompany andnotrefunded increditat 31December2015 Amountofdepositsand guararanteessupplied bytheCompanyat 31December2015 Revenueexcl.VATfor financialyearended 31/12/2014 Netprofitorloss(-) forfinancialyearended 31/12/2014 Dividendscollected bytheCompanyduring the2015financialyear Share capital Other equity Companies or groups of companies Voyages Autocars Services 2,064 -1,413 100.00 4,020 4,020 6,859 - 8,595 308 - 52 rue Jean Lemoine - 93230 Romainville Pacific Cars 1,300 -2,895 100.00 4,581 - 2,086 - 98 -133 - 20 rue du Bailly - 93210 La Plaine Saint-Denis Prioris 38 3 100.00 38 38 -37 - - -34 - 1 à 3 avenue François Mitterand - 93200 La Plaine Saint Denis Société des Transports et de Serv. Aéroportuaires 150 26 100.00 98 98 -174 - - -14 - 1 à 3 avenue Francois Mitterand - Bâtiment Le Jade - 93200 Saint Denis Transports Services Aérolignes 8 - 100.00 8 8 -27 - 16 -1 - 34 rue de Guivry - 77990 Le Mesnil Amelot Keolis Val d'Oise 128 1,668 99.99 130 130 3,261 - 5,596 269 85 1 chemin Pavé - 95340 Bernes sur Oise Aérobag 8 -2,813 100.00 8 - 2,763 - 5,301 -221 - Rue de Paris - lieu-dit La Maladrerie - 77990 Le Mesnil Amelot Aerolis 259 879 50.10 777 - 4,981 - 27,732 360 - Lieu-dit La Maladrerie - Rue de Paris 77990 Le Mesnil Amelot Keolis Conseil Projets 8 236 100.00 8 8 1,039 - 2,975 235 235 20 rue de la Villette - Immeuble le Bonnel - 69003 Lyon Motion Lines 10 8 100.00 7,235 7,235 -32 - - - - 20 rue Hector Malot - 75012 Paris SCI St Nicolas 196 196 - 55/57 le Nid de Verdier - 76400 Fécamp SCI Héron Verdier 228 228 - 55/57 Le Nid de Verdier - 76400 Fécamp REV (Réseau en Vosges) 10 7 70.00 7 7 -180 - 2,481 3 - 3 place Gambetta - 88300 Neufchâteau Keolis Amiens 654 390 100.00 654 654 -8,206 - 32,145 217 65 45 rue Dejean - 80000 Amiens Les Transports Dunois 629 -461 100.00 651 165 -160 154 -7 - Route de la souterraine - 23800 Dun le Palestel STA Creilloise 250 218 83.97 210 210 -977 7,214 108 - ZI du Marais sec - rue du pont de la brèche sud - 60780 Villers Saint-Paul
  • 124.
    124 4. Annual FinancialStatements (€ thousand) Equity at 31 December 2014 Percentage ofcapitalheldat 31December2015 Grossvalueof securitiesheldat 31December2015 Netcarryingvalue ofsecuritiesheldat 31December2015 Loansandadvances grantedbytheCompany andnotrefunded increditat 31December2015 Amountofdepositsand guararanteessupplied bytheCompanyat 31December2015 Revenueexcl.VATfor financialyearended 31/12/2014 Netprofitorloss(-) forfinancialyearended 31/12/2014 Dividendscollected bytheCompanyduring the2015financialyear Share capital Other equity Companies or groups of companies Voyages Chargélègue 1,291 -1,731 100.00 1,772 - 191 297 1 - 20 rue Grand rue Vasles - 79340 Menigoute TRANSKEO 51.00 51 51 - - - 266 avenue du Président Wilson - Immeuble Le Stadium - 93200 Saint Denis KLP02 100.00 10 - 20 rue Le Peletier - 75009 Paris KLP03 100.00 10 - 20 rue Le Peletier - 75009 Paris
  • 125.
    125 4. Annual FinancialStatements (€ thousand) Equity at 31 December 2014 Percentage ofcapitalheldat 31December2015 Grossvalueof securitiesheldat 31December2015 Netcarryingvalue ofsecuritiesheldat 31December2015 Loansandadvances grantedbytheCompany andnotrefunded increditat 31December2015 Amountofdepositsand guararanteessupplied bytheCompanyat 31December2015 Revenueexcl.VATfor financialyearended 31/12/2014 Netprofitorloss(-) forfinancialyearended 31/12/2014 Dividendscollected bytheCompanyduring the2015financialyear Share capital Other equity Companies or groups of companies 2) FOREIGN SUBSIDIARIES Keolis Nordic * 100 -86,032 100.00 8,355 8,355 15,790 - -15,886 - c/o Advokatfirman Vinge KB - Box 1703 - 111 87 Stockholm - Sweda SEK SEK SEK SEK Keolis Espagne 4,508 -527 100.00 20,445 3,997 -3,925 - 130 - Via Augusta, 291 - 08017 Barcelona - Spain Keolis Canada Inc * 29,569 -23,274 100.00 20,892 20,892 21,207 81,834 -9,703 - 1 place Ville Marie - H3B 4M7 Montréal - Canada CAD CAD CAD CAD Keolis UK * 2,000 1,899 100.00 3,059 3,059 20,437 - 2,789 - Evergreen Buiding North - 160 Euston Road - NW1 2DX London - United Kiingdom GBP GBP GBP GBP Keolis Bus Danmark * 24,857 110,326 75.00 11,275 11,275 44,835 600,951 -13,932 - 2/4, Thorvald Borgs Gade - 2300 Copenhagen - Danmark DKK DKK DKK DKK KeolisDeutschalndGmbhCo.KG 51 -13,571 100.00 736 - -39,900 126,664 -2,647 - Rheinstrasse 4E - 55116 Mainz - Germany Keolis Deutschland Verwaltungsgesellschaft GmbH 26 -15 100.00 26 14 - - - KG Postfach-103255 - 40023 Düsseldorf - Germany Keolis Vlaanderen 7,348 8,905 100.00 22,708 22,708 - 2,732 - Oosterring 17 - 3600 Genk - Belgium Keolis America * 46,565 -17,796 100.00 56,181 56,181 74,129 - -6,902 - c/o National Corporate Research, 615 South Dupont Highway USD USD USD USD Dover, Kent County 19901 Delaware - USA Keolis Australie * - 16,841 100.00 22,616 22,616 3,826 - -831 - 140 William Street - VIC 3000 Melbourne - Australia AUD AUD AUD Keolis Tramway d'Alger * 100.00 198 - 2 impasse Bossuet - Alger - Algeria DZD DZD Eurobus Holding SA 25,000 36,461 100.00 131,453 131,453 - 156 - 62 av. de Navagne - 4600 Visé - Belgium Keolis Hyderabad Mass Rapid Transit System Private Limited * 3,500 121,641 100.00 50 50 327,905 83,040 1,439 Cyber Tower - Q3 L4 - 500081 Hyderabad - India INR INR INR INR Kilux 13 20 100.00 20 20 468 9 - Weiswampach - Grand Duché - Luxembourg Striebig Deutschland GmbH 100.00 1,000 1,000 - - - Lundelbrunnstrasse 6 - 76887 Bad Bergzabern - Germany KIBEL 37,671 30,433 100.00 81,708 81,708 -155,559 - 1,302 - 62 av. de Navagne - 4600 Visé - Belgium
  • 126.
    126 4. Annual FinancialStatements B - NON CONSOLIDATED INVESTMENTS (BETWEEN 10% AND 50% HELD BY COMPANY) (€ thousand) Equity at 31 December 2014 Percentage ofcapitalheldat 31December2015 Grossvalueof securitiesheldat 31December2015 Netcarryingvalue ofsecuritiesheldat 31December2015 Loansandadvances grantedbytheCompany andnotrefunded increditat 31December2015 Amountofdepositsand guararanteessupplied bytheCompanyat 31December2015 Revenueexcl.VATfor financialyearended 31/12/2014 Netprofitorloss(-) forfinancialyearended 31/12/2014 Dividendscollected bytheCompanyduring the2015financialyear Share capital Other equity Companies or groups of companies 1) French subsidiaries T.I.C.E 182 1,153 19.00 35 35 - - - 352 rue des Champs Elysées - 91026 Evry Scodec Voyages SCOP 338 617 35.00 111 111 92 - - - La Tuilerie du Vignault - 79140 Cerisay Canal TP 763 2,340 34.02 1,687 1,687 3,717 9,431 903 99 20 bd Poniatowski - 75012 Paris Trans Pistes 80 50 40.00 32 - 932 -108 - 37-39 rue d'Athènes - 13127 Vitrolles Transports de l'Agglomération de Metz Metropole 2,000 -90 25.00 500 500 43,649 -19 - 10 rue des intendants Joseph et Ernest Joba - 57000 Metz Société Transports Voyageurs Devillairs 359 2,516 40.36 310 310 6,083 13,878 28 - 12 avenue du Général De Gaulle - 78000 Versailles Keolis Pays des Volcans 904 153 45.97 416 416 287 5,546 216 - 14, avenue de la Gare - 63260 Aigueperse ONE PARK 35 20.25 1,750 1,750 Essec - Avenue Bernard Hirsch BP 50105 - 95021 Cergy Pontoise Cedex Les Cars de Bordeaux 264 734 49.97 379 379 - - 5,390 223 94 8, rue d’Artagnan - 33000 Bordeaux (€ thousand) Equity at 31 December 2014 Percentage ofcapitalheldat 31December2015 Grossvalueof securitiesheldat 31December2015 Netcarryingvalue ofsecuritiesheldat 31December2015 Loansandadvances grantedbytheCompany andnotrefunded increditat 31December2015 Amountofdepositsand guararanteessupplied bytheCompanyat 31December2015 Revenueexcl.VATfor financialyearended 31/12/2014 Netprofitorloss(-) forfinancialyearended 31/12/2014 Dividendscollected bytheCompanyduring the2015financialyear Share capital Other equity Companies or groups of companies SYNTUS 272 -7,843 100.00 22,248 22,248 - 122,633 -7,858 - 5 Visbystraat - 7418 BE Deventer - Netherlands - Keolis Nederland 18 -1,667 100.00 68 68 -7,290 - -1,362 - 5 Visbystraat - 7418 BE Deventer - Netherlands RDK 50.00 - - 54 quai de la Rapée - 75012 Paris
  • 127.
    127 4. Annual FinancialStatements (€ thousand) Equity at 31 December 2014 Percentage ofcapitalheldat 31December2015 Grossvalueof securitiesheldat 31December2015 Netcarryingvalue ofsecuritiesheldat 31December2015 Loansandadvances grantedbytheCompany andnotrefunded increditat 31December2015 Amountofdepositsand guararanteessupplied bytheCompanyat 31December2015 Revenueexcl.VATfor financialyearended 31/12/2014 Netprofitorloss(-) forfinancialyearended 31/12/2014 Dividendscollected bytheCompanyduring the2015financialyear Share capital Other equity Companies or groups of companies 2) Foreign subsidiaries Prometro 500 466 20.00 100 100 579 46,812 -127 - Rua de Campo Alegre 17, 2 - 4150-177 Porto - Portugal Goldlinq Holdings Pty Ltd 4,287 4,287 Level 2, 7 Bay Street -Southport QLD 4215 - Australia Wuhan Tianhe Airport Transport Center Operation and Management Co., Ltd 47 HuangXiaoHe Road- District of Jiang An- Wuhan - China 1,739 CNY - 100.00 85 85 - - - Shanghai KEOLIS Public Transport Operation Management Co. 5F Building N°1- 909 Guilin Road - 201 103 Shanghai - China 1,503 CNY -438 CNY 100.00 724 724 - -438 - STAR Abidjan plateau - Avenue Nogue Immeuble Brodway - 011450 Abidjan - Ivory Coast 25.00 1 1 * Subsidiaries presented in local currency for Equity, Revenue and Net profit.
  • 128.
    128 4. Annual FinancialStatements To the Shareholders, In compliance with the assignment entrusted to us by your Annual General Meeting, we hereby report to you, for the year ended December 31, 2015, on:   ◗ the audit of the accompanying financial statements of Keolis; ◗ the justification of our assessments; ◗ the specific verifications and information required by law. These financial statements have been approved by the Board of Directors. Our role is to express an opinion on these financial statements based on our audit. I. Opinion on the financial statements We conducted our audit in accordance with professional standards applicable in France; those standards require that we plan and perform the audit to obtain reasonable assurance about whether the financial statements are free of material misstate- ment. An audit involves performing procedures, using sampling techniques or other methods of selection, to obtain audit evidence about the amounts and disclosures in the financial statements. An audit also includes evaluating the appropriate- ness of accounting policies used and the reasonableness of accounting estimates made, as well as the overall presentation of the financial statements. We believe that the audit evidence we have obtained is sufficient and appropriate to provide a basis for our audit opinion. In our opinion, the financial statements give a true and fair view of the assets and liabilities and of the financial position of the company at December 31, 2015 and of the results of its opera- tions for the year then ended in accordance with French accoun- ting principles. Neuilly-sur-Seine, March 7, 2016 The Statutory Auditors II - Justification of our assessments In accordance with the requirements of article L.823-9 of the French Commercial Code (Code de commerce) relating to the justification of our assessments, we inform you that the assessments made by us focused on the appropriateness of the accounting principles used and the reasonableness of the significant estimates made by the management relating particularly to the following matters : ◗ measure the value in use of financial investments and the recoverable value of current accounts and receivables from investments (§2.3 of the notes); ◗ measure the recoverable amount of goodwill resulting from technical losses on mergers (§2.1 of the notes); ◗ risks related to current litigations (§2.7 of the notes). These assessments were made as part of our audit of the financial statements taken as a whole, and therefore contributed to the opinion we formed which is expressed in the first part of this report. III. Specific verifications and information We have also performed, in accordance with professional standards applicable in France, the specific verifications required by French law. We have no matters to report as to the fair presentation and the consistency with the financial statements of the information given in the management report of the Board of Directors and in the documents addressed to shareholders with respect to the financial position and the financial statements. According to the law, we have ensured that the information related with acquisitions of subsidiaries or increases in their share capital were communicated to you in the management report. Statutoryauditors’reportonthefinancialstatements (FortheyearendedDecember31,2015) PricewaterhouseCoopers Audit French original signed by Deloitte Associés French original signed by Bertrand BoisselierFrançoise Garnier-Bel This is a free translation into English of the statutory auditors’ report issued in French and is provided solely for the convenience of English speaking users. The statutory auditors’ report includes information specifically required by French law in such reports, whether modified or not. This information is presented below the opinion on the financial statements and includes explanatory paragraphs discussing the audi- tors’ assessments of certain significant accounting and auditing matters. These assessments were considered for the purpose of issuing an audit opinion on the financial statements taken as a whole and not to provide separate assurance on individual account captions or on information taken outside of the financial statements. This report also includes information relating to the specific verification of information given in the management report and in the docu- ment addressed to shareholders. This report should be read in conjunction with, and is construed in accordance with, French law and professional auditing standards appli- cable in France.
  • 129.