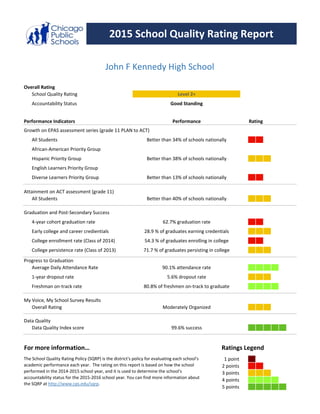
This document provides a school quality rating report for John F Kennedy High School. It gives the school an overall rating of 3 out of 5 points and performance rating of Level 2+. Several academic performance indicators are rated, such as a 4-year graduation rate of 2 points, early college and career credentials rate of 3 points, and college enrollment rate of 2 points. The report also provides additional data on student growth, dropout rates, attendance, and college persistence.
Partnering with Your Child for College ReadinessErica Wyatt
This is a Power Point presentation that I presented to parents, K-12 educators and administrators at the 2014 Wisconsin Education Association of Student Support Programs (WEASSP) Conference.
Pioneer High School - 2010 Jefferson Awards Students In Action PresentationJefferson Awards
Students In Action is a national youth volunteer leadership, recognition and reward program, designed to pass the tradition of service on to the next generation.
Co-developed by Jefferson Awards for Public Service and Deloitte, it is now in over 250 High Schools.
Each spring, Student Leaders from the participating schools compete in regional competitions. They are asked to report on the implementation of the program, and the impact they've had, both in their schools and within their communities.
AACU 2010: Connecting Assessment Data to Understand Underserved Student Learn...Sukhwant Jhaj
In this session, facilitators from Portland State University’s University Studies program will describe the
ways in which they are combining existing assessment methods to identify underserved students, explore
their learning experiences, and inform programs to support student success—all with few additional resources. Specifically, the facilitators will: (a) describe how results from student surveys, university data,
and student portfolio data were combined to create a rich source of information on student learning and the academic experience; (b) share a holistic model of the student experience developed using the
findings; and (c) discuss strategies for sharing the findings that have led to increased collaboration between the general education program and other areas of campus and that have helped inform wider
campus conversations about underserved student success. Participants will discuss the types of assessment data at their institutions that might be combined to create deeper understanding of the student learning experience. They will also consider ways in which assessment findings can be used as leverage to create conversations regarding underserved students and improve their success.
Rowanna L. Carpenter, Assessment Associate and Sukhwant Jhaj, Director, University Studies—both
of Portland State University
diskusi farmasi klinik praktik dengan judul Cronic Heart Failure atau CHF dengan komplikasi kerja profesi apoteker RSUD Dr, Moewardi, semoga bermanfaat
Please contact me if you necessity to this presentation in gilangrizki.alfarizi@gmail.com
http://www.newcrossroadsasia.com/docs/All%20That%20Matters%20March%20Low%20Rez.pdf
Politics in Business
the politics of myanmar’s social media revolution
Apps built for the last elections showcase
Myanmar’s burgeoning IT sector
1
Institutional Assessment Report
2012-13
The primary purpose for assessment is the assurance and improvement of student learning and
development; results are intended to inform decisions about course and program content, delivery,
and pedagogy. The Institutional Assessment Report summarizes annual assessment processes,
results and success indicators at the program, co-curricular, core and institutional levels.
I. Program assessment
A total of 117 degree and certificate programs and 13 co-curricular units assessed student learning
in 2012-13. Assessment reports reside in the Assessment Reporting Management System (ARMS).
Most programs measured multiple learning outcomes and used multiple measures. Direct measures
examine or observe student knowledge, skills, attitudes or behaviors. The most frequently used
direct measures in undergraduate programs are written assignments and locally developed exams,
tests or quizzes. Commonly used direct measures in graduate programs include oral presentations
or exhibition, research papers/projects, and locally-developed exams, tests or quizzes (Table 1).
Table 1: Percent of Academic Programs Reporting Direct Measures in ARMS
Undergraduate Graduate
N = 52 N = 65 (3 certificate)
Standardized instruments 29% 14%
Locally-developed
exam/test/quiz
40% 40%
Essay question on exam 29% 17%
Pre- and post-measures 10% 3%
Written assignment 42% 32%
Portfolio 4% 12%
In-class discussions 10% 11%
Oral presentation or
exhibition
23% 51%
Thesis / Dissertation 32%
Simulations 4% 2%
Formal evaluation of practical
skills
12% 22%
Research paper/project 25% 40%
Final Project 29% 14%
Other 17% 14%
2
Indirect measures evaluate perceived learning, and may be used to supplement direct measures.
Surveys are commonly used indirect measures; in graduate education, student self-assessments are
most frequently used (Table 2).
Table 2: Percent of Academic Programs Reporting Indirect Measures in ARMS
Undergraduate Graduate
Surveys 17% 11%
Interviews or focus groups 2% 2%
Data indicators (job
placement, admission to
graduate education)
4% 9%
Comparisons with peers 4% 3%
Student Self-Assessment 2% 15%
Other 4% 8%
Co-curricular programs, especially those in the Division of Student Affairs, are more likely to
assess student learning and development through self-report (surveys and student self-assessments)
than through direct measures (Tables 3 and 4).
Table 3: Percent of Co-curricular Units1 Reporting Direct Measures in ARMS
(N = 13)
Reflection 15%
Academic written assignment/Research
questions
23%
Exam 8%
Oral presentation 8%
Observations 23%
Supervisor ratings 15%
Performance reviews 8%
Other 31%
Table 4: Percent of Co-curricular Units1 Reporting Indirect Measures in ARMS
Surveys 69%
Student Self-Assessment 62%
Data Indicators 8%
Benchmarks/Compa ...
1. Overall Rating
School Quality Rating
Accountability Status
Performance Indicators
All Students 2
African-American Priority Group
Hispanic Priority Group 3
English Learners Priority Group
Diverse Learners Priority Group 2
All Students 3
4-year cohort graduation rate 2
Early college and career credientials 3
College enrollment rate (Class of 2014) 2
College persistence rate (Class of 2013) 3
Average Daily Attendance Rate 4
1-year dropout rate 3
Freshman on-track rate 4
Overall Rating 3
Data Quality Index score 5
For more information…
1 point
2 points
3 points
4 points
5 points
Data Quality
99.6% success
Ratings Legend
The School Quality Rating Policy (SQRP) is the district's policy for evaluating each school's
academic performance each year. The rating on this report is based on how the school
performed in the 2014-2015 school year, and it is used to determine the school's
accountability status for the 2015-2016 school year. You can find more information about
the SQRP at http://www.cps.edu/sqrp.
Progress to Graduation
5.6% dropout rate
80.8% of freshmen on-track to graduate
My Voice, My School Survey Results
90.1% attendance rate
Attainment on ACT assessment (grade 11)
Better than 40% of schools nationally
Moderately Organized
Graduation and Post-Secondary Success
71.7 % of graduates persisting in college
62.7% graduation rate
28.9 % of graduates earning credentials
54.3 % of graduates enrolling in college
Better than 34% of schools nationally
Better than 38% of schools nationally
Better than 13% of schools nationally
Growth on EPAS assessment series (grade 11 PLAN to ACT)
2015 School Quality Rating Report
John F Kennedy High School
Good Standing
Performance Rating
Level 2+