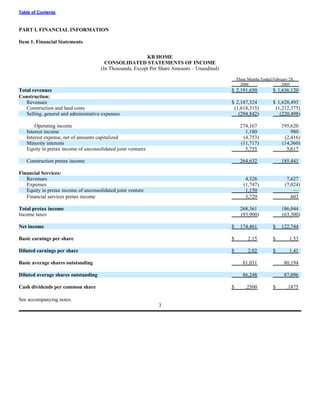
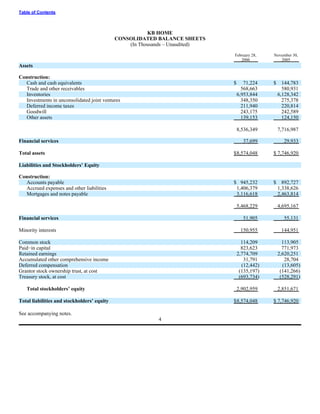
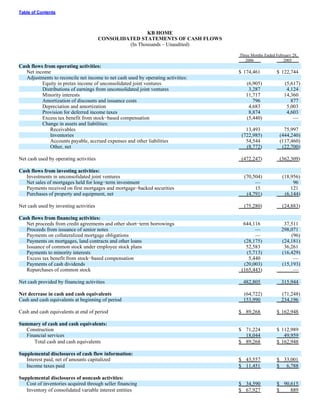
This document is a Form 10-Q quarterly report filed by KB Home with the SEC for the quarter ended February 28, 2006. The summary includes:
1) KB Home reported total revenues of $2.19 billion for the quarter, with construction revenues of $2.19 billion. Net income was $174.5 million or $2.15 per diluted share.
2) The construction segment reported operating income of $274.2 million. Financial services reported pretax income of $3.7 million.
3) The balance sheet shows KB Home had cash and cash equivalents of [AMOUNT] as of February 28, 2006, along with total assets of [AMOUNT].
This document is a Form 10-Q quarterly report filed by KB Home with the SEC on April 9, 2007 for the quarterly period ended February 28, 2007. The 10-Q provides financial statements and management's discussion and analysis of the company's financial condition and results of operations for the quarter. It includes an unaudited consolidated balance sheet, statements of income and cash flows, notes to the financial statements, and disclosures on legal proceedings, risks, controls and procedures, and other information required by the SEC.
This document is a Form 10-Q quarterly report filed with the SEC by KB Home. It provides financial statements and other information for the quarter ended May 31, 2005. The financial statements show total revenues of $3.77 billion for the six months ended May 31, 2005, with net income of $304.3 million. Construction operations generated pretax income of $460.1 million and mortgage banking operations generated pretax income of $978,000. The report also includes information on cash flows, segment reporting policies, and accounting policies for stock-based compensation.
This document is KB Home's Form 10-Q quarterly report filed with the SEC for the quarter ended February 28, 2005. It includes financial statements such as the income statement, balance sheet, and cash flow statement for the quarter. It also includes notes to the financial statements and sections on management's discussion of financial results, market risk exposure, and controls and procedures. The 10-Q provides investors with ongoing information about the company's financial position and performance between annual report filings.
This document is KB Home's Form 10-Q quarterly report filed with the SEC for the quarterly period ended February 29, 2004. It includes financial statements, notes to the financial statements, and other financial information. Specifically, it provides KB Home's consolidated statements of income and cash flows for the periods ended February 29, 2004 and February 28, 2003, and consolidated balance sheet as of February 29, 2004 and November 30, 2003. It also includes a discussion and analysis of the company's financial condition and results of operations for the periods.
This document is a Form 10-Q quarterly report filed by KB Home with the Securities and Exchange Commission for the quarter ended February 28, 2003. The 10-Q includes financial statements such as income statements, balance sheets, and cash flow statements for the quarter, as well as notes to the financial statements. It provides information on KB Home's revenues, expenses, assets, liabilities, cash flows, earnings per share, and reporting segments for its homebuilding and mortgage banking businesses.
This document is the Form 10-Q quarterly report filed by KB Home with the Securities and Exchange Commission for the quarter ended May 31, 2003. The 10-Q provides KB Home's unaudited financial statements and disclosures including the consolidated statements of income, balance sheets, cash flows, and notes. It summarizes KB Home's revenues, construction and land costs, expenses, operating income, interest income/expense, taxes, and earnings per share for the interim period.
This document is a Form 10-Q quarterly report filed by KB Home with the SEC for the quarter ending May 31, 2004. The summary includes:
1) KB Home reported total revenues of $2.9 billion for the six months ended May 31, 2004, with construction pretax income of $258.7 million and mortgage banking pretax income of $4.5 million.
2) The balance sheet shows KB Home's assets including $65.6 million in cash, $429.2 million in receivables, and $3.55 billion in construction inventories as of May 31, 2004.
3) The document provides KB Home's financial statements and notes for the quarter,
This document is a Form 10-Q quarterly report filed by KB Home with the SEC on February 13, 2007. It provides restated financial statements for quarters ending August 31, 2005 and August 31, 2006, as well as fiscal years 2004 and 2005, due to an internal investigation that found the company had incorrectly measured stock option grant dates. This resulted in an understatement of stock-based compensation expenses totaling $36.3 million over seven years. The restated financials reflect increased expenses and related tax impacts, reducing net income over 1999-2005 by $41.1 million in total.
This document is a quarterly report filed by KB Home with the SEC for the quarter ending May 31, 2007. It includes financial statements and notes for the six months and three months ended May 31, 2007 and 2006. For the six months ended May 31, 2007, KB Home reported a net loss of $121.1 million compared to net income of $378.8 million in the same period of 2006. The loss was primarily due to operating losses in the construction segment, which reported an operating loss of $259.9 million for the six months ended May 31, 2007 compared to operating income of $538.7 million in the prior year period.
This document is a quarterly report (Form 10-Q) filed by KB Home with the SEC for the quarter ending May 31, 2006. It includes financial statements and disclosures for the construction and financial services segments. Some key details:
- Net income for the quarter was $206.6 million, up from $181.5 million in the prior year quarter.
- Revenues for the construction segment were $2.6 billion for the quarter.
- Cash used by operating activities was $684.5 million for the six months ended May 31, 2006.
- Total assets were $9.2 billion as of May 31, 2006, up from $7.7 billion as of November
This document is KB Home's Form 10-Q quarterly report filed with the SEC for the quarter ended August 31, 2004. It includes financial statements such as the consolidated statements of income and balance sheets, as well as notes to the financial statements and sections on legal proceedings, controls and procedures, and certifications. The financial statements show that for the quarter ended August 31, 2004, KB Home reported revenues of $1.75 billion, net income of $117.9 million, and basic earnings per share of $3.03.
This document is Tesoro Corporation's quarterly report filed with the SEC for the quarter ending March 31, 2005. It includes Tesoro's condensed consolidated financial statements and notes for the quarter. The report discusses Tesoro's revenues, costs and expenses, operating income, earnings before taxes, net earnings, assets and liabilities. It also provides segment information for Tesoro's refining and retail operations.
This document is Toll Brothers' quarterly report filed with the SEC for the period ending January 31, 2002. It includes condensed consolidated financial statements such as the balance sheet, income statement, and cash flow statement. Revenues increased from the prior year due to higher housing sales. Net income increased to $44.5 million from $39.9 million a year ago. Earnings per share increased to $1.27 from $1.10 in the prior year period. The company issued $150 million in senior subordinated notes in November 2001 to fund general corporate purposes including land acquisition.
This document is Toll Brothers' quarterly report filed with the SEC for the quarter ended April 30, 2002. It includes condensed consolidated financial statements such as the balance sheet, income statement, and cash flow statement. It also provides notes to the financial statements and discusses forward-looking statements and risk factors that may affect future results.
This document is Toll Brothers' Form 10-Q quarterly report filed with the SEC for the quarter ended April 30, 2001. It summarizes Toll Brothers' financial position, including revenues of $989.8 million, total assets of $2.3 billion, and total liabilities of $1.5 billion. It also reports net income of $85.7 million and earnings per share of $2.36 for the six months ended April 30, 2001. Toll Brothers' inventory increased to $2.1 billion as of April 30, 2001.
- Danaher Corporation filed a Form 10-Q for the quarter ending April 1, 2005.
- In the quarter, Danaher acquired Linx Printing Technologies PLC for $171 million in cash and four smaller companies and product lines for $43 million in cash.
- The acquisitions were made to complement existing business units and expand Danaher's presence in markets such as product identification, environmental products, and instrumentation.
- Danaher reported sales of $1.8 billion for the quarter and net earnings of $188.3 million.
This document is a Form 10-Q quarterly report filed by KB Home with the SEC on April 9, 2007 for the quarterly period ended February 28, 2007. The 10-Q provides financial statements and management's discussion and analysis of the company's financial condition and operating results. It includes an unaudited consolidated balance sheet, income statement, and cash flow statement. Notes to the financial statements provide additional details on earnings per share calculations, comprehensive income, and accounting policies. The report is divided into two parts, with Part I covering financial information and Part II other information such as legal proceedings, risks, and exhibits.
This document is KB Home's Form 10-Q quarterly report filed with the SEC for the quarterly period ended February 29, 2004. It includes financial statements such as the consolidated statements of income and balance sheets, as well as notes to the financial statements and information on reportable segments. The filing provides shareholders and the public with financial information on KB Home's construction and mortgage banking operations for the quarterly period.
This document is a Form 10-Q quarterly report filed by KB Home with the Securities and Exchange Commission. It summarizes KB Home's financial performance for the first quarter of fiscal year 2003, ending February 28, 2003. Key details include total revenues of $1.09 billion, net income of $52.8 million, basic earnings per share of $1.32, and cash dividends of $0.075 per share. The report includes financial statements and notes, as well as sections on management discussion/analysis, market risk, and controls/procedures.
This document is KB Home's quarterly report filed with the SEC for the period ending May 31, 2007. It includes the company's consolidated financial statements and notes. Some key details:
- For the six months ended May 31, 2007, KB Home reported a net loss of $121.1 million compared to net income of $378.8 million for the same period in 2006.
- Revenues from homebuilding operations decreased to $2.8 billion for the six months ended May 31, 2007 from $4.1 billion for the same period in 2006.
- The financial statements provide details on the company's results of operations, financial position, and cash flows for the interim period. Accompany
This document is the Form 10-Q quarterly report filed by KB Home with the Securities and Exchange Commission for the quarter ended May 31, 2003. It includes the consolidated financial statements, notes to the financial statements, and management's discussion and analysis of the company's financial condition and results of operations for the quarter. Key details include total revenues of $2.5 billion for the six months ended May 31, 2003, net income of $134 million, and basic earnings per share of $3.36.
This document is KB Home's Form 10-Q quarterly report filed with the SEC for the quarter ended February 28, 2005. It includes financial statements such as the income statement, balance sheet, and cash flow statement for the quarter. It also includes notes to the financial statements and sections on management's discussion of financial results, market risk exposure, and controls and procedures. The 10-Q provides investors with ongoing information about the company's financial position and performance between annual report filings.
This document is a quarterly report (Form 10-Q) filed by KB Home with the SEC for the quarter ending May 31, 2006. It includes financial statements, management discussion and analysis, exhibits, and certifications. Specifically, it provides:
1) Consolidated financial statements including income statements, balance sheets, and cash flow statements for the current quarter and year-to-date, as well as notes to the financial statements.
2) Management's discussion and analysis of the company's financial condition and results of operations for the current quarter.
3) Certifications by the CEO and CFO regarding the accuracy of financial reporting.
This document is a Form 10-Q quarterly report filed by KB Home with the SEC for the quarter ending May 31, 2004. The summary includes:
1) KB Home reported total revenues of $2.9 billion for the six months ended May 31, 2004, with construction pretax income of $258.7 million and mortgage banking pretax income of $4.5 million.
2) The balance sheet shows KB Home's assets including $65.6 million in cash, $429.2 million in receivables, and $3.55 billion in construction inventories as of May 31, 2004.
3) The document provides KB Home's financial statements and notes for the quarter,
This document is a Form 10-Q quarterly report filed by KB Home with the SEC on February 13, 2007. It provides restated financial statements for quarters ending August 31, 2005 and February 28, 2006 and fiscal years ending November 30, 2005 and 2004 due to an internal investigation that found the company had incorrectly measured stock option grant dates. The investigation found that from 1998-2005, stock option grant dates were backdated by management to select low stock price dates, resulting in $36.3 million of underreported stock-based compensation expenses over that period. The restated financials reflect increased expenses and related tax impacts totaling $41.1 million reduction to reported net income for 1999-2005.
This document is KB Home's Form 10-Q quarterly report filed with the SEC for the quarter ended August 31, 2004. It includes financial statements such as the consolidated statements of income and balance sheets, as well as notes to the financial statements and sections on legal proceedings, controls and procedures, and certifications. The financial statements show that for the quarter ended August 31, 2004, KB Home reported revenues of $1.75 billion, net income of $117.9 million, and basic earnings per share of $3.03.
This document is KB Home's Form 10-Q quarterly report filed with the SEC on October 10, 2008 providing financial results for the quarter ended August 31, 2008. It includes:
- Consolidated statements of operations, balance sheets, and cash flows for the periods ended August 31, 2008 and 2007.
- Notes to the financial statements describing accounting policies and financial details.
- Disclosures regarding legal proceedings, risks factors, and certifications by management regarding internal controls.
This document is KB Home's 10-Q quarterly report filed with the SEC on October 10, 2008 providing financial results for the quarter ended August 31, 2008. It includes:
- Consolidated statements of operations, balance sheets, and cash flows for the periods ended August 31, 2008 and 2007.
- Notes to the financial statements describing accounting policies, seasonal factors, and other financial details.
- Disclosures regarding legal proceedings, risks factors, and certifications by management regarding internal controls.
This document is KB Home's Form 10-Q quarterly report filed with the SEC on October 10, 2008 providing financial results for the quarter ended August 31, 2008. It includes:
- Consolidated statements of operations, balance sheets, and cash flows for the periods ended August 31, 2008 and 2007.
- Notes to the financial statements describing accounting policies and financial details.
- Disclosures regarding legal proceedings, risks factors, and certifications by management regarding internal controls.
This document provides an SEC quarterly report filed by Steiner Leisure Ltd for the period ending March 31, 2009. It includes Steiner Leisure's condensed consolidated balance sheet, statement of income, and statement of cash flows for the first quarter of 2009, as well as notes to the financial statements. The financial statements show that for the quarter, Steiner Leisure had total revenues of $117.1 million, net income of $7.9 million, and net cash provided by operating activities of $8.5 million.
The document is Eastman Kodak Company's Form 10-Q quarterly report filed with the SEC for the quarter ended March 31, 2006. It includes:
1) Kodak's consolidated financial statements for the quarter, showing a net loss of $298 million.
2) A discussion of Kodak's results of operations and financial condition for the quarter.
3) Certification of the report by Kodak's management.
This document is KB Home's quarterly report filed with the SEC for the quarter ending August 31, 2007. It includes financial statements and notes for the nine months and three months ended August 31, 2007 and 2006. It also includes Management's Discussion and Analysis of the company's financial condition and results of operations over this period. The company reported a net loss from continuing operations of $642 million for the nine months ended August 31, 2007 compared to net income of $473 million for the same period in 2006. For the three months ended August 31, 2007, the company's net loss was $479 million compared to net income of $129 million in the prior year period.
KB Home filed a Form 10-Q for the quarterly period ended February 29, 2008. The filing includes:
1) Financial statements showing a net loss of $268.2 million compared to net income of $27.5 million in the prior year period.
2) Management's discussion and analysis of the financial results and market conditions.
3) Certifications by the CEO and CFO regarding the accuracy of the financial reporting.
KB Home filed a Form 10-Q for the quarterly period ended February 29, 2008. The filing includes financial statements and notes, management's discussion and analysis of financial condition and results of operations, controls and procedures information, and legal proceedings disclosures. It reported a net loss of $268.2 million compared to net income of $27.5 million in the prior year period. Revenues declined due to lower housing deliveries and average selling prices. The company also recorded significant inventory and joint venture impairments.
KB Home filed a Form 10-Q for the quarterly period ended February 29, 2008. The filing includes the company's consolidated financial statements and management's discussion and analysis of financial condition and results of operations. KB Home reported a net loss of $268.2 million for the quarter compared to net income of $27.5 million in the prior year period. Revenues declined due to a decrease in home closings and average selling prices. The company also recorded significant inventory and joint venture impairments during the quarter.
WRA worked on energy, water, and public lands issues in 2003. In energy, they promoted renewable energy standards and efficiency measures. They also worked to reduce emissions from coal plants and prevent new coal plant construction. In water, they advocated for urban water conservation and efficiency and protected rivers and habitats. In lands, they focused on responsible oil and gas development, protecting roadless areas, managing motorized recreation, and grazing reform.
The annual report summarizes the organization's activities and accomplishments in 2006. Some key points:
- The organization celebrated a major victory that protected water rights and flows for Colorado's Gunnison River.
- The organization opened a new office in Nevada and added staff in multiple states to advance its mission of protecting land, air, and water resources in the Interior West.
- Notable programs and advocacy efforts achieved successes in renewable energy development, limiting new coal-fired power plants, protecting public lands from oil/gas development, and responsible management of motorized recreation on public lands.
Western Resource Advocates' (WRA) 2007 annual report summarizes the organization's work over the past year to protect land, air, water, and ecosystems in the Western United States. The report highlights WRA's efforts to promote clean energy alternatives to coal power, encourage responsible motorized recreation on public lands, influence oil and gas development policies, and implement water conservation strategies in urban areas. Through advocacy, litigation, and partnerships with other groups, WRA achieved victories such as blocking new coal plants, protecting roads and lands from off-road vehicle damage, passing legislation to safeguard wildlife from drilling impacts, and influencing several municipalities to adopt water conservation measures. The report outlines WRA's goals and strategies across its key program
C.H. Robinson achieved strong success in 2007 despite economic challenges. The company grew gross profits 14.9% to $1.2 billion through its diverse business lines and relationships with customers and carriers. Its non-asset based model allowed it to efficiently manage costs. The company continued investing in its business by expanding its office network and adding employees. C.H. Robinson is well positioned for future growth given ongoing trends driving demand for third party logistics.
This document is C.H. Robinson Worldwide's annual report (Form 10-K) filed with the SEC for the year ended December 31, 2007. It provides an overview of the company's business operations, including that it is a non-asset based third party logistics provider offering freight transportation and logistics services through a network of 218 offices worldwide. The report describes C.H. Robinson's main business lines of multimodal transportation services, fresh produce sourcing, and information services. It provides details on the types of transportation it arranges and its relationships with over 48,000 transportation providers.
This document is C.H. Robinson Worldwide's definitive proxy statement filed with the SEC on April 1, 2008 to provide shareholders information on matters to be voted on at the company's upcoming annual meeting on May 15, 2008. The proxy statement summarizes the purposes of the meeting as electing three directors, ratifying the selection of the independent auditors, and any other business properly brought before the meeting. It provides details on shareholder voting eligibility, the methods by which shareholders can vote including by mail, phone or internet, and the proposals to be voted on.
C.H. Robinson achieved strong success in 2007 despite challenging market conditions. The company grew gross profits 14.9% to $1.2 billion through its diverse mix of transportation services and customer relationships. Its non-asset based model and over 7,300 employees enabled it to efficiently manage over 6.5 million shipments. Looking ahead, C.H. Robinson is well positioned for continued growth given industry trends, its financial strength with no debt and $455 million in cash, and opportunities to expand internationally and through acquisitions.
There are three primary ways for individual investors to hold securities: direct registration system (DRS), physical paper certificates, and street-name registration through a brokerage account. Both DRS and street-name registration involve book-entry ownership with no physical certificate printed, while transactions are recorded electronically. Investors can choose to hold securities through different methods and change methods as desired, though brokers may charge fees. The DRS allows electronic transfer of book-entry shares between parties like brokers and issuers.
KBH was established as a public company in 1986 through an IPO of Kaufman and Broad Inc. (KBI). In 1989, the remaining portion of KBH was distributed to KBI shareholders, making KBH and KBI independent companies. KBI later merged with American International Group (AIG) in 1999. The document provides guidance on determining the tax basis for holdings in KBH and KBI/AIG following corporate restructurings and stock splits over the years. Questions regarding stock certificates or exchanges should be directed to AIG's transfer agent.
This document lists milestones from KB Home, a homebuilder, over the past 50+ years. Some key milestones include KB Home becoming the first national homebuilder on the New York Stock Exchange in 1969, building over 100,000 homes by 1977, establishing sustainability programs and receiving awards for energy efficient construction in the 2000s-2010s, and expanding nationwide through strategic acquisitions over the decades. The milestones show KB Home's growth from its founding to becoming one of the largest homebuilders in the United States.
This document is a Form 10-Q quarterly report filed by KB Home with the Securities and Exchange Commission for the quarter ended August 31, 2003. The 10-Q provides financial statements and disclosures including the consolidated statements of income, balance sheets, cash flows, and notes to the financial statements. Key details include revenues of $3.98 billion for the nine months, net income of $232 million, basic EPS of $5.87, and total assets of $4.12 billion as of August 31, 2003.
This document is a Form 10-Q quarterly report filed by KB Home with the Securities and Exchange Commission for the quarter ended August 31, 2003. The 10-Q provides financial statements and disclosures including the consolidated statements of income, balance sheets, cash flows, and notes to the financial statements. It discloses that for the quarter ended August 31, 2003, KB Home had total revenues of $1.44 billion, net income of $97.8 million, and basic earnings per share of $2.51.
This document is a Form 10-Q quarterly report filed by KB Home with the United States Securities and Exchange Commission. It provides financial statements and notes for the quarter ended August 31, 2005. Specifically, it includes the consolidated statements of income, balance sheets, and cash flows for this quarter compared to the same quarter in the prior year. It also lists two business segments - construction and mortgage banking - and provides financial details for each.
This document is a Form 10-Q quarterly report filed by KB Home with the SEC for the quarter ended August 31, 2005. The report includes consolidated financial statements for the nine months and three months ended August 31, 2005 and 2004, including statements of income, balance sheets, and cash flows. It also includes notes to the financial statements describing the company's reporting segments, stock-based compensation accounting policies, and subsequent events.
The Rise and Fall of Ponzi Schemes in America.pptxDiana Rose
Ponzi schemes, a notorious form of financial fraud, have plagued America’s investment landscape for decades. Named after Charles Ponzi, who orchestrated one of the most infamous schemes in the early 20th century, these fraudulent operations promise high returns with little or no risk, only to collapse and leave investors with significant losses. This article explores the nature of Ponzi schemes, notable cases in American history, their impact on victims, and measures to prevent falling prey to such scams.
Understanding Ponzi Schemes
A Ponzi scheme is an investment scam where returns are paid to earlier investors using the capital from newer investors, rather than from legitimate profit earned. The scheme relies on a constant influx of new investments to continue paying the promised returns. Eventually, when the flow of new money slows down or stops, the scheme collapses, leaving the majority of investors with substantial financial losses.
Historical Context: Charles Ponzi and His Legacy
Charles Ponzi is the namesake of this deceptive practice. In the 1920s, Ponzi promised investors in Boston a 50% return within 45 days or 100% return in 90 days through arbitrage of international reply coupons. Initially, he paid returns as promised, not from profits, but from the investments of new participants. When his scheme unraveled, it resulted in losses exceeding $20 million (equivalent to about $270 million today).
Notable American Ponzi Schemes
1. Bernie Madoff: Perhaps the most notorious Ponzi scheme in recent history, Bernie Madoff’s fraud involved $65 billion. Madoff, a well-respected figure in the financial industry, promised steady, high returns through a secretive investment strategy. His scheme lasted for decades before collapsing in 2008, devastating thousands of investors, including individuals, charities, and institutional clients.
2. Allen Stanford: Through his company, Stanford Financial Group, Allen Stanford orchestrated a $7 billion Ponzi scheme, luring investors with fraudulent certificates of deposit issued by his offshore bank. Stanford promised high returns and lavish lifestyle benefits to his investors, which ultimately led to a 110-year prison sentence for the financier in 2012.
3. Tom Petters: In a scheme that lasted more than a decade, Tom Petters ran a $3.65 billion Ponzi scheme, using his company, Petters Group Worldwide. He claimed to buy and sell consumer electronics, but in reality, he used new investments to pay off old debts and fund his extravagant lifestyle. Petters was convicted in 2009 and sentenced to 50 years in prison.
4. Eric Dalius and Saivian: Eric Dalius, a prominent figure behind Saivian, a cashback program promising high returns, is under scrutiny for allegedly orchestrating a Ponzi scheme. Saivian enticed investors with promises of up to 20% cash back on everyday purchases. However, investigations suggest that the returns were paid using new investments rather than legitimate profits. The collapse of Saivian l
TEST BANK Principles of cost accounting 17th edition edward j vanderbeck mari...Donc Test
TEST BANK Principles of cost accounting 17th edition edward j vanderbeck maria r mitchell.docx
13 Jun 24 ILC Retirement Income Summit - slides.pptxILC- UK
ILC's Retirement Income Summit was hosted by M&G and supported by Canada Life. The event brought together key policymakers, influencers and experts to help identify policy priorities for the next Government and ensure more of us have access to a decent income in retirement.
Contributors included:
Jo Blanden, Professor in Economics, University of Surrey
Clive Bolton, CEO, Life Insurance M&G Plc
Jim Boyd, CEO, Equity Release Council
Molly Broome, Economist, Resolution Foundation
Nida Broughton, Co-Director of Economic Policy, Behavioural Insights Team
Jonathan Cribb, Associate Director and Head of Retirement, Savings, and Ageing, Institute for Fiscal Studies
Joanna Elson CBE, Chief Executive Officer, Independent Age
Tom Evans, Managing Director of Retirement, Canada Life
Steve Groves, Chair, Key Retirement Group
Tish Hanifan, Founder and Joint Chair of the Society of Later life Advisers
Sue Lewis, ILC Trustee
Siobhan Lough, Senior Consultant, Hymans Robertson
Mick McAteer, Co-Director, The Financial Inclusion Centre
Stuart McDonald MBE, Head of Longevity and Democratic Insights, LCP
Anusha Mittal, Managing Director, Individual Life and Pensions, M&G Life
Shelley Morris, Senior Project Manager, Living Pension, Living Wage Foundation
Sarah O'Grady, Journalist
Will Sherlock, Head of External Relations, M&G Plc
Daniela Silcock, Head of Policy Research, Pensions Policy Institute
David Sinclair, Chief Executive, ILC
Jordi Skilbeck, Senior Policy Advisor, Pensions and Lifetime Savings Association
Rt Hon Sir Stephen Timms, former Chair, Work & Pensions Committee
Nigel Waterson, ILC Trustee
Jackie Wells, Strategy and Policy Consultant, ILC Strategic Advisory Board
Confirmation of Payee (CoP) is a vital security measure adopted by financial institutions and payment service providers. Its core purpose is to confirm that the recipient’s name matches the information provided by the sender during a banking transaction, ensuring that funds are transferred to the correct payment account.
Confirmation of Payee was built to tackle the increasing numbers of APP Fraud and in the landscape of UK banking, the spectre of APP fraud looms large. In 2022, over £1.2 billion was stolen by fraudsters through authorised and unauthorised fraud, equivalent to more than £2,300 every minute. This statistic emphasises the urgent need for robust security measures like CoP. While over £1.2 billion was stolen through fraud in 2022, there was an eight per cent reduction compared to 2021 which highlights the positive outcomes obtained from the implementation of Confirmation of Payee. The number of fraud cases across the UK also decreased by four per cent to nearly three million cases during the same period; latest statistics from UK Finance.
In essence, Confirmation of Payee plays a pivotal role in digital banking, guaranteeing the flawless execution of banking transactions. It stands as a guardian against fraud and misallocation, demonstrating the commitment of financial institutions to safeguard their clients’ assets. The next time you engage in a banking transaction, remember the invaluable role of CoP in ensuring the security of your financial interests.
For more details, you can visit https://technoxander.com.
[4:55 p.m.] Bryan Oates
OJPs are becoming a critical resource for policy-makers and researchers who study the labour market. LMIC continues to work with Vicinity Jobs’ data on OJPs, which can be explored in our Canadian Job Trends Dashboard. Valuable insights have been gained through our analysis of OJP data, including LMIC research lead
Suzanne Spiteri’s recent report on improving the quality and accessibility of job postings to reduce employment barriers for neurodivergent people.
Decoding job postings: Improving accessibility for neurodivergent job seekers
Improving the quality and accessibility of job postings is one way to reduce employment barriers for neurodivergent people.
Fabular Frames and the Four Ratio ProblemMajid Iqbal
Digital, interactive art showing the struggle of a society in providing for its present population while also saving planetary resources for future generations. Spread across several frames, the art is actually the rendering of real and speculative data. The stereographic projections change shape in response to prompts and provocations. Visitors interact with the model through speculative statements about how to increase savings across communities, regions, ecosystems and environments. Their fabulations combined with random noise, i.e. factors beyond control, have a dramatic effect on the societal transition. Things get better. Things get worse. The aim is to give visitors a new grasp and feel of the ongoing struggles in democracies around the world.
Stunning art in the small multiples format brings out the spatiotemporal nature of societal transitions, against backdrop issues such as energy, housing, waste, farmland and forest. In each frame we see hopeful and frightful interplays between spending and saving. Problems emerge when one of the two parts of the existential anaglyph rapidly shrinks like Arctic ice, as factors cross thresholds. Ecological wealth and intergenerational equity areFour at stake. Not enough spending could mean economic stress, social unrest and political conflict. Not enough saving and there will be climate breakdown and ‘bankruptcy’. So where does speculative design start and the gambling and betting end? Behind each fabular frame is a four ratio problem. Each ratio reflects the level of sacrifice and self-restraint a society is willing to accept, against promises of prosperity and freedom. Some values seem to stabilise a frame while others cause collapse. Get the ratios right and we can have it all. Get them wrong and things get more desperate.
University of North Carolina at Charlotte degree offer diploma Transcripttscdzuip
办理美国UNCC毕业证书制作北卡大学夏洛特分校假文凭定制Q微168899991做UNCC留信网教留服认证海牙认证改UNCC成绩单GPA做UNCC假学位证假文凭高仿毕业证GRE代考如何申请北卡罗莱纳大学夏洛特分校University of North Carolina at Charlotte degree offer diploma Transcript
OJP data from firms like Vicinity Jobs have emerged as a complement to traditional sources of labour demand data, such as the Job Vacancy and Wages Survey (JVWS). Ibrahim Abuallail, PhD Candidate, University of Ottawa, presented research relating to bias in OJPs and a proposed approach to effectively adjust OJP data to complement existing official data (such as from the JVWS) and improve the measurement of labour demand.
Monthly Market Risk Update: June 2024 [SlideShare]Commonwealth
Markets rallied in May, with all three major U.S. equity indices up for the month, said Sam Millette, director of fixed income, in his latest Market Risk Update.
For more market updates, subscribe to The Independent Market Observer at https://blog.commonwealth.com/independent-market-observer.
Every business, big or small, deals with outgoing payments. Whether it’s to suppliers for inventory, to employees for salaries, or to vendors for services rendered, keeping track of these expenses is crucial. This is where payment vouchers come in – the unsung heroes of the accounting world.
1. FORM 10−Q
KB HOME − KBH
Filed: April 07, 2006 (period: February 28, 2006)
Quarterly report which provides a continuing view of a company's financial position
2. Table of Contents
PART I
Item 2. Management s Discussion and Analysis of Financial Condition and Results of
Operations 19−28
PART I.
FINANCIAL INFORMATION
Item 1. Financial Statements
Item 2. Management s Discussion and Analysis of Financial Condition and Results of
Operations
Item 3. Quantitative and Qualitative Disclosures About Market Risk
Item 4. Controls and Procedures
PART II.
OTHER INFORMATION
Item 2. Unregistered Sales of Equity Securities and Use of Proceeds
Item 4. Submission of Matters to a Vote of Security Holders
Item 6. Exhibits
SIGNATURES
EX−31.1
EX−31.2
EX−32.1
EX−32.2
3. Table of Contents
UNITED STATES SECURITIES AND EXCHANGE COMMISSION
WASHINGTON, D.C. 20549
FORM 10−Q
þ QUARTERLY REPORT PURSUANT TO SECTION 13 OR 15(d) OF THE SECURITIES
EXCHANGE ACT OF 1934.
For the quarterly period ended February 28, 2006.
or
o TRANSITION REPORT PURSUANT TO SECTION 13 OR 15(d) OF THE SECURITIES
EXCHANGE ACT OF 1934.
For the transition period from [ ] to [ ].
Commission File No. 001−09195
KB HOME
(Exact name of registrant as specified in its charter)
Delaware 95−3666267
(State of incorporation) (IRS employer identification number)
10990 Wilshire Boulevard
Los Angeles, California 90024
(310) 231−4000
(Address and telephone number of principal executive offices)
Indicate by check mark whether the registrant (1) has filed all reports required to be filed by Section 13 or 15(d) of the Securities
Exchange Act of 1934 during the preceding 12 months (or for such shorter period that the registrant was required to file such reports),
and (2) has been subject to such filing requirements for the past 90 days.
þ o
Yes No
Indicate by check mark whether the registrant is a large accelerated filer, an accelerated filer, or a non−accelerated filer. See definition
of “an accelerated filer and large accelerated filer” in Rule 12b−2 of the Exchange Act. (Check one):
Large accelerated filer þ o Non−accelerated Filer o
Accelerated Filer
Indicate by check mark whether the registrant is a shell company (as defined in Rule 12b−2 of the Exchange Act).
o þ
Yes No
Indicate the number of shares outstanding of each of the issuer’s classes of common stock as of February 28, 2006.
Common stock, par value $1.00 per share, 93,050,229 shares outstanding, including 12,441,510 shares held by the Registrant’s
Grantor Stock Ownership Trust and excluding 21,159,192 shares held in treasury.
4. Table of Contents
KB HOME
FORM 10−Q
INDEX
Page
Number(s)
PART I. FINANCIAL INFORMATION
Item 1. Financial Statements
Consolidated Statements of Income — Three Months Ended February 28, 2006 and February 28, 2005 3
Consolidated Balance Sheets — February 28, 2006 and November 30, 2005 4
Consolidated Statements of Cash Flows — Three Months Ended February 28, 2006 and February 28, 2005 5
Notes to Consolidated Financial Statements 6−18
Item 2. Management’s Discussion and Analysis of Financial Condition and Results of Operations 19−28
Item 3. Quantitative and Qualitative Disclosures About Market Risk 29
Item 4. Controls and Procedures 29
PART II. OTHER INFORMATION
Item 2. Unregistered Sales of Equity Securities and Use of Proceeds 30
Item 4. Submission of Matters to a Vote of Security Holders 30−31
Item 6. Exhibits 31
SIGNATURES 32
INDEX OF EXHIBITS 33
Exhibit 31.1
Exhibit 31.2
Exhibit 32.1
Exhibit 32.2
2
5. Table of Contents
PART I. FINANCIAL INFORMATION
Item 1. Financial Statements
KB HOME
CONSOLIDATED STATEMENTS OF INCOME
(In Thousands, Except Per Share Amounts – Unaudited)
Three Months Ended February 28,
2006 2005
Total revenues $ 2,191,650 $ 1,636,120
Construction:
Revenues $ 2,187,324 $ 1,628,493
Construction and land costs (1,618,315) (1,212,375)
Selling, general and administrative expenses (294,842) (220,498)
Operating income 274,167 195,620
Interest income 1,180 980
Interest expense, net of amounts capitalized (4,753) (2,416)
Minority interests (11,717) (14,360)
Equity in pretax income of unconsolidated joint ventures 5,755 5,617
Construction pretax income 264,632 185,441
Financial Services:
Revenues 4,326 7,627
Expenses (1,747) (7,024)
Equity in pretax income of unconsolidated joint venture 1,150 —
Financial services pretax income 3,729 603
Total pretax income 268,361 186,044
Income taxes (93,900) (63,300)
Net income $ 174,461 $ 122,744
Basic earnings per share $ 2.15 $ 1.53
Diluted earnings per share $ 2.02 $ 1.41
Basic average shares outstanding 81,031 80,194
Diluted average shares outstanding 86,248 87,096
Cash dividends per common share $ .2500 $ .1875
See accompanying notes.
3
6. Table of Contents
KB HOME
CONSOLIDATED BALANCE SHEETS
(In Thousands – Unaudited)
February 28, November 30,
2006 2005
Assets
Construction:
Cash and cash equivalents $ 71,224 $ 144,783
Trade and other receivables 568,663 580,931
Inventories 6,953,844 6,128,342
Investments in unconsolidated joint ventures 348,350 275,378
Deferred income taxes 211,940 220,814
Goodwill 243,175 242,589
Other assets 139,153 124,150
8,536,349 7,716,987
Financial services 37,699 29,933
Total assets $8,574,048 $ 7,746,920
Liabilities and Stockholders’ Equity
Construction:
Accounts payable $ 945,232 $ 892,727
Accrued expenses and other liabilities 1,406,379 1,338,626
Mortgages and notes payable 3,116,618 2,463,814
5,468,229 4,695,167
Financial services 51,905 55,131
Minority interests 150,955 144,951
Common stock 114,209 113,905
Paid−in capital 823,623 771,973
Retained earnings 2,774,709 2,620,251
Accumulated other comprehensive income 31,791 28,704
Deferred compensation (12,442) (13,605)
Grantor stock ownership trust, at cost (135,197) (141,266)
Treasury stock, at cost (693,734) (528,291)
Total stockholders’ equity 2,902,959 2,851,671
Total liabilities and stockholders’ equity $8,574,048 $ 7,746,920
See accompanying notes.
4
7. Table of Contents
KB HOME
CONSOLIDATED STATEMENTS OF CASH FLOWS
(In Thousands – Unaudited)
Three Months Ended February 28,
2006 2005
Cash flows from operating activities:
Net income $ 174,461 $ 122,744
Adjustments to reconcile net income to net cash used by operating activities:
Equity in pretax income of unconsolidated joint ventures (6,905) (5,617)
Distributions of earnings from unconsolidated joint ventures 3,287 4,124
Minority interests 11,717 14,360
Amortization of discounts and issuance costs 796 877
Depreciation and amortization 4,683 5,003
Provision for deferred income taxes 8,874 4,603
Excess tax benefit from stock−based compensation (5,440) —
Change in assets and liabilities:
Receivables 13,493 75,997
Inventories (722,985) (444,240)
Accounts payable, accrued expenses and other liabilities 54,544 (117,460)
Other, net (8,772) (22,700)
Net cash used by operating activities (472,247) (362,309)
Cash flows from investing activities:
Investments in unconsolidated joint ventures (70,504) (18,956)
Net sales of mortgages held for long−term investment — 96
Payments received on first mortgages and mortgage−backed securities 15 121
Purchases of property and equipment, net (4,791) (6,144)
Net cash used by investing activities (75,280) (24,883)
Cash flows from financing activities:
Net proceeds from credit agreements and other short−term borrowings 644,116 37,511
Proceeds from issuance of senior notes — 298,071
Payments on collateralized mortgage obligations — (96)
Payments on mortgages, land contracts and other loans (28,175) (24,181)
Issuance of common stock under employee stock plans 52,583 36,261
Payments to minority interests (5,713) (16,429)
Excess tax benefit from stock−based compensation 5,440 —
Payments of cash dividends (20,003) (15,193)
Repurchases of common stock (165,443) —
Net cash provided by financing activities 482,805 315,944
Net decrease in cash and cash equivalents (64,722) (71,248)
Cash and cash equivalents at beginning of period 153,990 234,196
Cash and cash equivalents at end of period $ 89,268 $ 162,948
Summary of cash and cash equivalents:
Construction $ 71,224 $ 112,989
Financial services 18,044 49,959
Total cash and cash equivalents $ 89,268 $ 162,948
Supplemental disclosures of cash flow information:
Interest paid, net of amounts capitalized $ 43,557 $ 33,001
Income taxes paid $ 11,451 $ 6,788
Supplemental disclosures of noncash activities:
Cost of inventories acquired through seller financing $ 34,590 $ 90,615
Inventory of consolidated variable interest entities $ 67,927 $ 889
9. Table of Contents
KB HOME
NOTES TO CONSOLIDATED FINANCIAL STATEMENTS
(Unaudited)
1. Basis of Presentation and Significant Accounting Policies
The accompanying unaudited consolidated financial statements have been prepared in accordance with accounting principles
generally accepted in the United States for interim financial information and the rules and regulations of the Securities and
Exchange Commission. Accordingly, certain information and footnote disclosures normally included in the annual financial
statements prepared in accordance with generally accepted accounting principles have been condensed or omitted.
In the opinion of the Company, the accompanying unaudited consolidated financial statements contain all adjustments
(consisting only of normal recurring accruals) necessary to present fairly the Company’s financial position as of February 28,
2006, the results of its consolidated operations for the three months ended February 28, 2006 and 2005, and its consolidated cash
flows for the three months ended February 28, 2006 and 2005. The results of operations for the three months ended February 28,
2006 are not necessarily indicative of the results to be expected for the full year. The consolidated balance sheet at November 30,
2005 has been taken from the audited consolidated financial statements as of that date. These unaudited consolidated financial
statements should be read in conjunction with the consolidated financial statements for the year ended November 30, 2005,
which are contained in the Company’s 2005 Annual Report to Stockholders on Form 10−K.
Segment information
The Company has identified two reportable segments: construction and financial services. Information for the Company’s
reportable segments is presented in its consolidated statements of income, consolidated balance sheets and related notes to
consolidated financial statements included herein. The Company’s reporting segments follow the same accounting policies used
for the Company’s consolidated financial statements. Management evaluates a segment’s performance based upon a number of
factors including pretax results.
Stock Split
In April 2005, the Company’s board of directors declared a two−for−one split of the Company’s common stock in the form of a
100% stock dividend to stockholders of record at the close of business on April 18, 2005. The additional shares were distributed
on April 28, 2005. All share and per share amounts for the prior year have been retroactively adjusted to reflect the stock split.
Earnings per share
Basic earnings per share is calculated by dividing net income by the average number of common shares outstanding for the
period. Diluted earnings per share is calculated by dividing net income by the average number of common shares outstanding
including all dilutive potentially issuable shares under various stock option plans and stock purchase contracts.
The following table presents a reconciliation of average shares outstanding (in thousands):
Three Months Ended February 28,
2006 2005
Basic average shares outstanding 81,031 80,194
Net effect of stock options assumed to be exercised 5,217 6,902
Diluted average shares outstanding 86,248 87,096
6
10. Table of Contents
KB HOME
NOTES TO CONSOLIDATED FINANCIAL STATEMENTS
(Unaudited)
1. Basis of Presentation and Significant Accounting Policies (continued)
Comprehensive income
The following table presents the components of comprehensive income (in thousands):
Three Months Ended February 28,
2006 2005
Net income $ 174,461 $ 122,744
Foreign currency translation adjustment 3,087 853
Comprehensive income $ 177,548 $ 123,597
The accumulated balances of other comprehensive income in the balance sheets as of February 28, 2006 and November 30, 2005
are comprised solely of cumulative foreign currency translation adjustments of $31.8 million and $28.7 million, respectively.
Reclassifications
Certain amounts in the consolidated financial statements of prior periods have been reclassified to conform to the 2006
presentation.
2. Stock−Based Compensation
The Company has stock−based employee compensation plans. The Company’s 1999 Incentive Plan (the “1999 Plan”) currently
provides that stock options, associated limited appreciation rights, restricted shares of common stock, stock units, and other
securities may be awarded to eligible individuals (all employees other than executive officers). Stock option awards granted
under the 1999 Plan typically expire 10−15 years after the date of grant. The Company also has a Performance−Based Incentive
Plan for Senior Management, a 1998 Stock Incentive Plan and a 2001 Incentive Plan (the “2001 Plan”), each of which provides
for the same types of awards as may be made under the 1999 Plan, but allows such awards to be granted to executive officers and
contain provisions which are designed to enable the Company to maintain federal tax deductibility for its payment of annual
compensation in excess of $1.0 million to certain participating executive officers. The 1999 Plan and 2001 Plan are the
Company’s primary existing employee stock plans.
Prior to December 1, 2005, the Company accounted for its stock−based compensation plans under the recognition and
measurement provisions of Accounting Principles Board Opinion No. 25, “Accounting for Stock Issued to Employees” (“APB
Opinion No. 25”) and related interpretations, as permitted by Statement of Financial Accounting Standards No. 123,
“Accounting for Stock−Based Compensation” (“SFAS No. 123”). Accordingly, no stock−based compensation expense was
recognized in the consolidated income statement for the three−month period ended February 28, 2005, as all options granted
under the Company’s stock−based employee compensation plans had an exercise price equal to the market value of the
underlying common stock on the date of grant. Effective December 1, 2005, the Company adopted the fair value recognition
provisions of Statement of Financial Accounting Standards No. 123(R), “Share Based Payment” (“SFAS No. 123(R)”) using the
modified prospective transition method. Under that transition method, compensation cost recognized in the three months ended
February 28, 2006 includes: (a) compensation cost for all share−based payments granted prior to, but not yet vested as of
December 1, 2005, based on the grant date fair value estimated in accordance with the original provisions of SFAS No. 123, and
(b) compensation cost for all share−based payments granted subsequent to December 1, 2005, based on the grant date fair value
estimated in accordance with the provisions of SFAS No. 123(R). The fair value for each option was estimated on the date of
grant using the Black−Scholes option−pricing model with the following weighted average assumptions used for grants during the
quarter ended February 28, 2006: a risk free interest rate of 4.6%; an expected volatility factor for the market price of the
Company’s
7
11. Table of Contents
KB HOME
NOTES TO CONSOLIDATED FINANCIAL STATEMENTS
(Unaudited)
2. Stock−Based Compensation (continued)
common stock of 41.0%; a dividend yield of 1.5%; and an expected life of 5 years. The weighted average fair value of each
option granted during the quarter ended February 28, 2006 was $26.27. In accordance with the modified prospective transition
method, results for prior periods have not been restated.
As a result of adopting SFAS No. 123(R) on December 1, 2005, the Company’s pretax income and net income for the quarter
ended February 28, 2006 were $4.8 million and $3.1 million lower, respectively, than if it had continued to account for
stock−based compensation under APB Opinion No. 25. Basic and diluted earnings per share for the quarter ended February 28,
2006 would have been $2.19 and $2.05, respectively, if the Company had not adopted SFAS No. 123(R), compared to reported
basic and diluted earnings per share of $2.15 and $2.02, respectively.
Prior to the adoption of SFAS No. 123(R), the Company presented all tax benefits of deductions resulting from the exercise of
stock options as operating cash flows in the consolidated statements of cash flows. SFAS No. 123(R) requires the tax benefits
resulting from tax deductions in excess of the compensation cost recognized for those options (“excess tax benefits”) to be
classified and reported as both an operating cash outflow and a financing cash inflow upon adoption.
The following table illustrates the effect (in thousands, except per share amounts) on net income and basic and diluted earnings
per share if the fair value recognition provisions of SFAS No. 123(R) had been applied to all outstanding and unvested awards in
the quarter ended February 28, 2005. For purposes of this pro forma disclosure, the value of the options was estimated using the
Black−Scholes option−pricing model with the following weighted average assumptions used for grants during the quarter ended
February 28, 2005: a risk free interest rate of 4.0%; an expected volatility factor for the market price of the Company’s common
stock of 43.6%; a dividend yield of 1.2%; and an expected life of 6 years. The weighted average fair value of each option granted
during the quarter ended February 28, 2005 was $19.12.
Three Months Ended
February 28, 2005
Net income−as reported $ 122,744
Deduct stock−based compensation expense determined using the fair value method, net of related tax
effects (4,534)
Pro forma net income $ 118,210
Earnings per share:
Basic−as reported $ 1.53
Basic−pro forma 1.48
Diluted−as reported 1.41
Diluted−pro forma 1.39
8
12. Table of Contents
KB HOME
NOTES TO CONSOLIDATED FINANCIAL STATEMENTS
(Unaudited)
2. Stock−Based Compensation (continued)
The following table summarizes the stock options outstanding as of February 28, 2006 as well as activity during the three months
then ended:
Weighted
Average
Exercise
Options Price
Options outstanding at beginning of period 9,176,253 $ 28.16
Granted 12,500 70.73
Exercised (304,298) 25.09
Cancelled (21,959) 39.64
Options outstanding at end of period 8,862,496 $ 28.30
Options exercisable at end of period 6,375,882 $ 23.09
The weighted average remaining contractual life of options outstanding as of February 28, 2006 was 11.9 years. As of
February 28, 2006, there was $21.3 million of total unrecognized compensation cost related to unvested stock option awards.
3. Financial Services
Financial information related to the Company’s financial services segment is as follows (in thousands):
Three Months Ended February 28,
2006 2005
Revenues:
Interest income $ 55 $ 2,549
Title services 1,261 916
Insurance commissions 2,273 2,165
Escrow coordination fees 737 642
Mortgage and servicing rights income — 1,355
Total revenues 4,326 7,627
Expenses:
Interest (15) (1,683)
General and administrative (1,732) (5,341)
2,579 603
Equity in pretax income of unconsolidated joint venture 1,150 —
Pretax income $ 3,729 $ 603
9
13. Table of Contents
KB HOME
NOTES TO CONSOLIDATED FINANCIAL STATEMENTS
(Unaudited)
3. Financial Services (continued)
February 28, November 30,
2006 2005
Assets
Cash and cash equivalents $ 18,044 $ 9,207
First mortgages held under commitments of sale and other 2,099 3,338
Investment in unconsolidated joint venture 16,380 15,230
Other assets 1,176 2,158
Total assets $ 37,699 $ 29,933
Liabilities
Accounts payable and accrued expenses $ 51,317 $ 54,543
Collateralized mortgage obligations secured by mortgage−backed securities 588 588
Total liabilities $ 51,905 $ 55,131
4. Inventories
Inventories consist of the following (in thousands):
February 28, November 30,
2006 2005
Homes, lots and improvements in production $4,627,262 $ 4,215,488
Land under development 2,326,582 1,912,854
Total inventories $6,953,844 $ 6,128,342
The Company’s interest costs are as follows (in thousands):
Three Months Ended February 28,
2006 2005
Capitalized interest at beginning of period $ 228,163 $ 167,249
Interest incurred 51,566 41,196
Interest expensed (4,753) (2,416)
Interest amortized (23,413) (16,063)
Capitalized interest at end of period $ 251,563 $ 189,966
5. Consolidation of Variable Interest Entities
In December 2003, the Financial Accounting Standards Board (“FASB”) issued FASB Interpretation No. 46, “Consolidation of
Variable Interest Entities” (as amended, “FASB Interpretation No. 46(R)”) to clarify the application of Accounting Research
Bulletin No. 51, “Consolidated Financial Statements,” to certain entities (referred to as “variable interest entities” or “VIEs”) in
which equity investors do not have the characteristics of a controlling interest or do not have sufficient equity at risk for the
entity to finance its activities without additional subordinated financial support from other parties. Pursuant to FASB
Interpretation No. 46(R), an enterprise that absorbs a majority of a VIE’s expected losses, receives a majority of a VIE’s
expected residual returns, or both, is determined to be the primary beneficiary of the VIE and must consolidate the entity in its
financial statements.
10
14. Table of Contents
KB HOME
NOTES TO CONSOLIDATED FINANCIAL STATEMENTS
(Unaudited)
5. Consolidation of Variable Interest Entities (continued)
In the ordinary course of its business, the Company enters into land option contracts in order to procure land for the construction
of homes. Under such land option contracts, the Company will fund a specified option deposit or earnest money deposit in
consideration for the right to purchase land in the future, usually at a predetermined price. Under the requirements of FASB
Interpretation No. 46(R), certain of the Company’s land option contracts may create a variable interest for the Company, with the
land seller being identified as a VIE.
In compliance with FASB Interpretation No. 46(R), the Company analyzed its land option contracts and other contractual
arrangements and has consolidated the fair value of certain VIEs from which the Company is purchasing land under option
contracts. The consolidation of these VIEs, where the Company was determined to be the primary beneficiary, added
$301.5 million to inventory and other liabilities in the Company’s consolidated balance sheet at February 28, 2006. The
Company’s cash deposits related to these land option contracts totaled $40.4 million at February 28, 2006. Creditors, if any, of
these VIEs have no recourse against the Company. As of February 28, 2006, excluding consolidated VIEs, the Company had
cash deposits totaling $181.4 million which were associated with land option contracts having an aggregate purchase price of
$4.70 billion.
6. Goodwill
The changes in the carrying amount of goodwill for the three months ended February 28, 2006, are as follows (in thousands):
2006
Balance at beginning of period $242,589
Goodwill acquired —
Foreign currency translation 586
Balance at end of period $243,175
7. Commitments and Contingencies
The Company provides a limited warranty on all of its homes. The specific terms and conditions of warranties vary depending
upon the market in which the Company does business. For homes sold in the United States, the Company generally provides a
structural warranty of 10 years, a warranty on electrical, heating, cooling, plumbing and other building systems each varying
from two to five years based on geographic market and state law, and a warranty of one year for other components of the home
such as appliances. The Company estimates the costs that may be incurred under each limited warranty and records a liability in
the amount of such costs at the time the revenue associated with the sale of each home is recognized. Factors that affect the
Company’s warranty liability include the number of homes sold, historical and anticipated rates of warranty claims, and cost per
claim. The Company periodically assesses the adequacy of its recorded warranty liabilities and adjusts the amounts as necessary.
11
15. Table of Contents
KB HOME
NOTES TO CONSOLIDATED FINANCIAL STATEMENTS
(Unaudited)
7. Commitments and Contingencies (continued)
The changes in the Company’s warranty liability are as follows (in thousands):
Three Months Ended February 28,
2006 2005
Balance at beginning of period $ 131,875 $ 99,659
Warranties issued 17,171 14,630
Payments and adjustments (14,331) (10,851)
Balance at end of period $ 134,715 $ 103,438
In the normal course of its business, the Company issues certain representations, warranties and guarantees related to its home
sales, land sales and commercial construction that may be affected by FASB Interpretation No. 45, “Guarantor’s Accounting and
Disclosure Requirements for Guarantees, Including Indirect Guarantees of Indebtedness of Others.” Based on historical
evidence, the Company does not believe any of these representations, warranties or guarantees would result in a material effect
on its financial condition or results of operations.
The Company is often required to obtain bonds and letters of credit in support of its obligations to various municipalities and
other government agencies with respect to subdivision improvements, including roads, sewers and water, among other things. At
February 28, 2006, the Company had outstanding approximately $1.16 billion and $383.6 million of performance bonds and
letters of credit, respectively. In the event any such bonds or letters of credit are called, the Company would be obligated to
reimburse the issuer of the bond or letter of credit. However, the Company does not believe that any currently outstanding bonds
or letters of credit will be called.
Borrowings outstanding and letters of credit issued under the Company’s $1.50 billion unsecured revolving credit facility (the
“$1.5 Billion Credit Facility”) are guaranteed by certain of the Company’s domestic subsidiaries (the “Guarantor Subsidiaries”).
The Company conducts a portion of its land acquisition, development and other residential and commercial activities through
unconsolidated joint ventures. These unconsolidated joint ventures had total assets of $2.26 billion and outstanding secured
construction debt of approximately $1.34 billion at February 28, 2006. In certain instances, the Company provides varying levels
of guarantees on the debt of unconsolidated joint ventures. When the Company or its subsidiaries provide a guarantee, the
unconsolidated joint venture generally receives more favorable terms from lenders than would otherwise be available to it. At
February 28, 2006, the Company had payment guarantees related to the third−party debt of three of its unconsolidated joint
ventures. One of the unconsolidated joint ventures had third−party debt of $431.5 million at February 28, 2006, of which each of
the joint venture partners guaranteed its pro rata share. The Company’s share of the payment guarantee, which is triggered only
in the event of bankruptcy of the joint venture, was 49% or $209.3 million. The remaining two unconsolidated joint ventures had
total third−party debt of $8.7 million at February 28, 2006, of which each of the joint venture partners guaranteed its pro rata
share. The Company’s share of this guarantee was 50% or $4.3 million. The Company had limited maintenance guarantees of
$374.9 million of unconsolidated entity debt at February 28, 2006. The limited maintenance guarantees only apply if the value of
the collateral (generally land and improvements) is less than a specific percentage of the loan balance. If the Company is
required to make a payment under a limited maintenance guarantee to bring the value of the collateral above the specified
percentage of the loan balance, the payment would constitute a capital contribution and/or loan to the affected unconsolidated
joint venture and increase the Company’s share of any funds such unconsolidated joint venture distributes.
In January 2003, the Company received a request for information from the U.S. Environmental Protection Agency (“EPA”)
pursuant to Section 308 of the Clean Water Act. Several other public homebuilders have received similar requests. The request
sought information about storm water discharge practices at certain of the
12
16. Table of Contents
KB HOME
NOTES TO CONSOLIDATED FINANCIAL STATEMENTS
(Unaudited)
7. Commitments and Contingencies (continued)
Company’s construction sites, and the Company provided information pursuant to the request. In May 2004, on behalf of the
EPA, the U.S. Department of Justice (“DOJ”) tentatively asserted that certain regulatory requirements applicable to storm water
discharges were violated at certain of the Company’s construction sites, and civil penalties and injunctive relief might be
warranted. The DOJ has also proposed certain steps it would expect the Company to take in the future relating to compliance
with the EPA’s requirements applicable to storm water discharges. The Company has defenses to the claims that have been
asserted and is exploring methods of resolving the matter. The Company believes that the costs associated with the claims are not
likely to be material to its consolidated financial position or results of operations.
8. Stockholders Equity
On December 8, 2005, the Company’s board of directors increased the annual cash dividend on the Company’s common stock to
$1.00 per share from $.75 per share. The first quarterly dividend at the increased rate of $.25 per share was paid on February 23,
2006 to stockholders of record on February 9, 2006.
The Company’s board of directors also authorized a new share repurchase program on December 8, 2005 under which the
Company may repurchase up to 10 million shares of its common stock. Acquisitions under the share repurchase program may be
made in open market or private transactions and will be made strategically from time to time at management’s discretion based
on its assessment of market conditions and buying opportunities. During the quarter ended February 28, 2006, the Company
repurchased two million shares of its common stock under the new share repurchase program at an aggregate price of
$154.4 million. In addition to the first quarter 2006 share repurchases, which consisted of open market transactions, the
Company retired $11.0 million of common stock to satisfy withholding taxes of employees on vested restricted stock.
9. Recent Accounting Pronouncements
In December 2004, the FASB issued Staff Position 109−1 (“FSP 109−1”), “Application of FASB Statement No. 109, Accounting
for Income Taxes, to the Tax Deduction on Qualified Production Activities Provided by the American Jobs Creation Act of
2004.” The American Jobs Creation Act provides a 3% deduction on “qualified domestic production activities income” and is
effective for the Company’s fiscal year ending November 30, 2006, subject to certain limitations. This deduction provides a tax
savings against income attributable to domestic production activities, including the construction of real property. When fully
phased−in, the deduction will be 9% of “qualified domestic production activities income,” subject to certain limitations. Based
on the guidance provided by FSP 109−1, this deduction was accounted for as a special deduction under Statement of Financial
Accounting Standards No. 109, “Accounting for Income Taxes” and reduced income tax expense. An estimate of the tax benefit
of .9% is currently reflected in the Company’s effective tax rate for the quarter ended February 28, 2006. However, the Company
continues to assess the potential impact of this new deduction for the year ending November 30, 2006.
In May 2005, the FASB issued Statement of Financial Accounting Standards No. 154, “Accounting Changes and Error
Corrections,” (“SFAS No. 154”) which replaces Accounting Principles Board Opinion No. 20, “Accounting Changes” and
Statement of Financial Accounting Standards No. 3, “Reporting Accounting Changes in Interim Financial Statements,” and
changes the requirements for the accounting for and reporting of a change in accounting principle. SFAS No. 154 requires
retrospective application to prior periods’ financial statements of changes in accounting principle, unless it is impracticable to
determine either the period−specific effects or the cumulative effect of the change. SFAS No. 154 is effective for accounting
changes and corrections of errors made in fiscal years beginning after December 15, 2005. The adoption of SFAS No. 154 is not
expected to have a material impact on the Company’s consolidated financial position or results of operations.
13
17. Table of Contents
KB HOME
NOTES TO CONSOLIDATED FINANCIAL STATEMENTS
(Unaudited)
9. Recent Accounting Pronouncements (continued)
In June 2005, the Emerging Issues Task Force (“EITF”) released Issue No. 04−5 “Determining Whether a General Partner, or the
General Partners as a Group, Controls a Limited Partnership or Similar Entity When the Limited Partners Have Certain Rights”
(“EITF 04−5”). EITF 04−5 provides guidance in determining whether a general partner controls a limited partnership and
therefore should consolidate the limited partnership. EITF 04−5 states that the general partner in a limited partnership is
presumed to control that limited partnership and that the presumption may be overcome if the limited partners have either (1) the
substantive ability to dissolve or liquidate the limited partnership or otherwise remove the general partner without cause, or (2)
substantive participating rights. The effective date for applying the guidance in EITF 04−5 was (1) June 29, 2005 for all new
limited partnerships and existing limited partnerships for which the partnership agreement was modified after that date, and
(2) no later than the beginning of the first reporting period in fiscal years beginning after December 15, 2005 for all other limited
partnerships. Implementation of EITF 04−5 is not expected to have a material impact on the Company’s consolidated financial
position or results of operations.
10. Supplemental Guarantor Information
The Company’s obligation to pay principal, premium, if any, and interest under certain debt instruments are guaranteed on a joint
and several basis by the Guarantor Subsidiaries. The guarantees are full and unconditional and the Guarantor Subsidiaries are
100% owned by KB Home. The Company has determined that separate, full financial statements of the Guarantor Subsidiaries
would not be material to investors and, accordingly, supplemental financial information for the Guarantor Subsidiaries is
presented.
14
18. Table of Contents
KB HOME
NOTES TO CONSOLIDATED FINANCIAL STATEMENTS
(Unaudited)
10. Supplemental Guarantor Information (continued)
Condensed Consolidating Income Statements
Three Months Ended February 28, 2006 (in thousands)
KB Home Guarantor Non−Guarantor Consolidating
Corporate Subsidiaries Subsidiaries Adjustments Total
Revenues $ — $ 1,485,182 $ 706,468 $ — $ 2,191,650
Construction:
Revenues $ — $ 1,485,182 $ 702,142 $ — $ 2,187,324
Construction and land costs — (1,078,990) (539,325) — (1,618,315)
Selling, general and
administrative expenses (39,261) (142,300) (113,281) — (294,842)
Operating income (loss) (39,261) 263,892 49,536 — 274,167
Interest expense, net of amounts
capitalized 53,111 (39,421) (18,443) — (4,753)
Minority interests (7,818) (16) (3,883) — (11,717)
Other 24 2,597 4,314 — 6,935
Construction pretax income 6,056 227,052 31,524 — 264,632
Financial services pretax income — — 3,729 — 3,729
Total pretax income 6,056 227,052 35,253 — 268,361
Income taxes (2,100) (79,500) (12,300) — (93,900)
Equity in earnings of subsidiaries 170,505 — — (170,505) —
Net income $174,461 $ 147,552 $ 22,953 $ (170,505) $ 174,461
Three Months Ended February 28, 2005 (in thousands)
KB Home Guarantor Non−Guarantor Consolidating
Corporate Subsidiaries Subsidiaries Adjustments Total
Revenues $ — $1,034,289 $ 601,831 $ — $ 1,636,120
Construction:
Revenues $ — $1,034,289 $ 594,204 $ — $ 1,628,493
Construction and land costs — (743,402) (468,973) — (1,212,375)
Selling, general and
administrative expenses (28,010) (103,953) (88,535) — (220,498)
Operating income (loss) (28,010) 186,934 36,696 — 195,620
Interest expense, net of amounts
capitalized 43,395 (29,151) (16,660) — (2,416)
Minority interests (4,549) (6,169) (3,642) — (14,360)
Other expense 117 3,801 2,679 — 6,597
Construction pretax income 10,953 155,415 19,073 — 185,441
Financial services pretax income — — 603 — 603
Total pretax income 10,953 155,415 19,676 — 186,044
Income taxes (3,700) (52,800) (6,800) — (63,300)
Equity in earnings of subsidiaries 115,491 — — (115,491) —
Net income $122,744 $ 102,615 $ 12,876 $ (115,491) $ 122,744
15
19. Table of Contents
KB HOME
NOTES TO CONSOLIDATED FINANCIAL STATEMENTS
(Unaudited)
10. Supplemental Guarantor Information (continued)
Condensed Consolidating Balance Sheets
February 28, 2006 (in thousands)
KB Home Guarantor Non−Guarantor Consolidating
Corporate Subsidiaries Subsidiaries Adjustments Total
Assets
Construction:
Cash and cash equivalents $ 30,468 $ (12,234) $ 52,990 $ — $ 71,224
Trade and other receivables 4,799 153,921 409,943 — 568,663
Inventories — 5,062,801 1,891,043 — 6,953,844
Other assets 439,458 209,198 293,962 — 942,618
474,725 5,413,686 2,647,938 — 8,536,349
Financial services — — 37,699 — 37,699
Investment in subsidiaries 510,970 — — (510,970) —
Total assets $ 985,695 $5,413,686 $ 2,685,637 $ (510,970) $8,574,048
Liabilities and Stockholders’ Equity
Construction:
Accounts payable, accrued
expenses and other liabilities $ 179,510 $1,328,992 $ 843,109 $ — $2,351,611
Mortgages and notes payable 2,822,043 42,376 252,199 — 3,116,618
3,001,553 1,371,368 1,095,308 — 5,468,229
Financial services — — 51,905 — 51,905
Minority interests 127,510 440 23,005 — 150,955
Intercompany (5,046,327) 3,813,803 1,232,524 — —
Stockholders’ equity 2,902,959 228,075 282,895 (510,970) 2,902,959
Total liabilities and stockholders’
equity $ 985,695 $5,413,686 $ 2,685,637 $ (510,970) $8,574,048
November 30, 2005 (in thousands)
KB Home Guarantor Non−Guarantor Consolidating
Corporate Subsidiaries Subsidiaries Adjustments Total
Assets
Construction:
Cash and cash equivalents $ 52,851 $ 1,288 $ 90,644 $ — $ 144,783
Trade and other receivables 6,770 182,689 391,472 — 580,931
Inventories — 4,604,709 1,523,633 — 6,128,342
Other assets 425,820 220,287 216,824 — 862,931
485,441 5,008,973 2,222,573 — 7,716,987
Financial services — — 29,933 — 29,933
Investment in subsidiaries 245,827 — — (245,827) —
Total assets $ 731,268 $5,008,973 $ 2,252,506 $ (245,827) $7,746,920
Liabilities and Stockholders’ Equity
Construction:
Accounts payable, accrued
expenses and other liabilities $ 203,015 $1,208,277 $ 820,061 $ — $2,231,353
Mortgages and notes payable 2,175,535 36,400 251,879 — 2,463,814
2,378,550 1,244,677 1,071,940 — 4,695,167
Financial services — — 55,131 — 55,131
Minority interests 119,693 424 24,834 — 144,951
21. Table of Contents
KB HOME
NOTES TO CONSOLIDATED FINANCIAL STATEMENTS
(Unaudited)
10. Supplemental Guarantor Information (continued)
Condensed Consolidating Statements of Cash Flows
Three Months Ended February 28, 2006 (in thousands)
KB Home Guarantor Non−Guarantor Consolidating
Corporate Subsidiaries Subsidiaries Adjustments Total
Cash flows from operating activities:
Net income $ 174,461 $ 147,552 $ 22,953 $ (170,505) $ 174,461
Adjustments to reconcile net
income to net cash provided
(used) by operating activities (20,115) (293,060) (333,533) — (646,708)
Net cash provided (used) by operating
activities 154,346 (145,508) (310,580) (170,505) (472,247)
Cash flows from investing activities:
Investments in unconsolidated
joint ventures (4,985) (43,378) (22,141) — (70,504)
Other, net (1,737) (1,496) (1,543) — (4,776)
Net cash used by investing activities (6,722) (44,874) (23,684) — (75,280)
Cash flows from financing activities:
Net proceeds from (payments on)
credit agreements and other
short−term borrowings 646,200 — (2,084) — 644,116
Repurchases of common stock (165,443) — — — (165,443)
Other, net 16,916 (8,696) (4,088) — 4,132
Intercompany (667,680) 185,556 311,619 170,505 —
Net cash provided (used) by financing
activities (170,007) 176,860 305,447 170,505 482,805
Net decrease in cash and cash
equivalents (22,383) (13,522) (28,817) — (64,722)
Cash and cash equivalents at
beginning of period 52,851 1,288 99,851 — 153,990
Cash and cash equivalents at end of
period $ 30,468 $ (12,234) $ 71,034 $ — $ 89,268
Three Months Ended February 28, 2005 (in thousands)
KB Home Guarantor Non−Guarantor Consolidating
Corporate Subsidiaries Subsidiaries Adjustments Total
Cash flows from operating activities:
Net income $ 122,744 $ 102,615 $ 12,876 $ (115,491) $ 122,744
Adjustments to reconcile net
income to net cash provided
(used) by operating activities 90,663 (406,376) (169,340) — (485,053)
Net cash provided (used) by operating
activities 213,407 (303,761) (156,464) (115,491) (362,309)
Cash flows from investing activities:
Investments in unconsolidated
joint ventures (5,557) (12,637) (722) — (18,916)
Other, net 574 (4,428) (2,113) — (5,967)
22. Net cash used by investing activities (4,983) (17,065) (2,835) — (24,883)
Cash flows from financing activities
Net proceeds from (payments on)
credit agreements and other
short−term borrowings 44,900 — (7,389) — 37,511
Proceeds from issuance of notes 298,071 — — — 298,071
Other, net 30,453 (30,905) (19,186) — (19,638)
Intercompany (648,650) 366,441 166,718 115,491 —
Net cash provided (used) by financing
activities (275,226) 335,536 140,143 115,491 315,944
Net increase (decrease) in cash and
cash equivalents (66,802) 14,710 (19,156) — (71,248)
Cash and cash equivalents at
beginning of period 94,644 (15,102) 154,654 — 234,196
Cash and cash equivalents at end of
period $ 27,842 $ (392) $ 135,498 $ — $ 162,948
17
23. Table of Contents
KB HOME
NOTES TO CONSOLIDATED FINANCIAL STATEMENTS
(Unaudited)
11. Subsequent Event
On April 3, 2006, pursuant to its universal shelf registration statement filed with the Securities and Exchange Commission on
November 12, 2004 (the “2004 Shelf Registration”), the Company issued $300.0 million of 7 1/4% Senior Notes (the $300
Million Senior Notes”) at 99.486% of the principal amount of the notes. The notes, which are due June 15, 2018 with interest
payable semi−annually, represent senior unsecured obligations and rank equally in right of payment with all of the Company’s
existing and future senior unsecured indebtedness and are guaranteed by the Guarantor Subsidiaries. The $300 Million Senior
Notes may be redeemed, in whole at any time or from time to time in part at a price equal to the greater of (1) 100% of their
principal amount and (2) the sum of the present values of the remaining scheduled payments of principal and interest on the notes
to be redeemed discounted at a defined rate, plus in each case, accrued and unpaid interest to the applicable redemption date. The
Company used all of the proceeds from the $300 Million Senior Notes to repay borrowings under its $1.5 Billion Credit Facility.
18
24. Table of Contents
Item 2. Management’s Discussion and Analysis of Financial Condition and Results of Operations
Results of Operations
OVERVIEW
Revenues are generated from our (i) construction operations in the United States and France and (ii) our domestic financial services
operations. The following table presents a summary of our results by financial reporting segment for the three months ended
February 28, 2006 and 2005 (in thousands, except per share amounts):
Three Months Ended February 28,
2006 2005
Revenues:
Construction $ 2,187,324 $ 1,628,493
Financial services 4,326 7,627
Total $ 2,191,650 $ 1,636,120
Pretax income:
Construction $ 264,632 $ 185,441
Financial services 3,729 603
Total pretax income 268,361 186,044
Income taxes (93,900) (63,300)
Net income $ 174,461 $ 122,744
Diluted earnings per share $ 2.02 $ 1.41
Our total revenues of $2.19 billion for the three months ended February 28, 2006 rose 34%, from $1.64 billion for the three months
ended February 28, 2005. The $555.5 million increase in total revenues was due to growth in housing revenues resulting from higher
unit deliveries and a higher average selling price. We delivered 7,905 homes in the first quarter of 2006, up 15% from the 6,847
homes delivered in the year−earlier quarter. The overall average selling price of our homes rose 17% to $276,200 in the first quarter of
2006 from $236,300 in the corresponding period of 2005. We use the terms “home” and “unit” to refer to a single−family residence,
whether it is a detached or attached single−family home, town home or condominium.
Financial services revenues totaled $4.3 million in the first quarter of 2006 compared to $7.6 million in the first quarter of 2005. The
decrease in financial services revenues reflects the sale of the mortgage banking operations of our wholly owned financial services
subsidiary, KB Home Mortgage Company (“KBHMC”), in the fourth quarter of 2005.
Net income for the first three months of 2006 increased 42%, to $174.5 million from $122.7 million in the corresponding period of
2005 driven by revenue growth and an improved operating income margin in our construction operations. Our diluted earnings per
share for the quarter ended February 28, 2006 rose 43% to $2.02 from $1.41 for the year−earlier quarter.
The dollar value of our backlog increased 25%, to approximately $7.24 billion, on 26,536 units at February 28, 2006, up from
approximately $5.80 billion on 23,334 units at February 28, 2005. Backlog value increased in each of our geographic regions on a
year−over−year basis.
We repurchased two million shares of our common stock during the first quarter of 2006 at an aggregate price of $154.4 million. As of
February 28, 2006, we had authorization to repurchase an additional eight million shares under our current board−approved
repurchase program.
19
25. Table of Contents
CONSTRUCTION
The following table presents a summary of selected financial and operational data for our construction segment (dollars in thousands,
except average selling price):
Three Months Ended February 28,
2006 2005
Revenues:
Housing $ 2,183,144 $ 1,618,099
Commercial — 2,184
Land 4,180 8,210
Total 2,187,324 1,628,493
Costs and expenses:
Construction and land costs
Housing 1,615,061 1,206,200
Commercial — 1,832
Land 3,254 4,343
Subtotal 1,618,315 1,212,375
Selling, general and administrative expenses 294,842 220,498
Total 1,913,157 1,432,873
Operating income $ 274,167 $ 195,620
Unit deliveries 7,905 6,847
Average selling price $ 276,200 $ 236,300
Housing gross margin 26.0% 25.5%
Selling, general and administrative expenses as a percent of housing revenues 13.5% 13.6%
Operating income as a percent of construction revenues 12.7% 12.0%
The following table presents residential information in terms of unit deliveries to home buyers and net orders taken by geographical
region for the three−month periods ended February 28, 2006 and 2005, together with backlog data in terms of units and value by
geographical region as of February 28, 2006 and 2005.
Backlog − Value
Deliveries Net Orders Backlog − Units In Thousands
Region 2006 2005 2006 2005 2006 2005 2006 2005
West Coast 1,446 1,095 1,399 1,857 4,207 4,229 $ 2,059,191 $ 1,878,556
Southwest 1,552 1,572 1,492 2,140 5,368 5,120 1,690,266 1,200,915
Central 1,835 1,873 2,295 2,541 5,405 4,726 841,504 719,885
Southeast 1,610 1,314 1,854 1,841 5,857 4,807 1,455,301 997,926
France 1,462 993 1,679 1,522 5,699 4,452 1,196,790 1,006,152
Total 7,905 6,847 8,719 9,901 26,536 23,334 $ 7,243,052 $ 5,803,434
Unconsolidated joint
ventures 76 210 209 55 520 340 $ 119,600 $ 60,370
Construction Revenues
Construction revenues increased by $558.8 million, or 34%, to $2.19 billion in the first three months of 2006 from $1.63 billion in the
corresponding period of 2005 due to higher housing revenues. Our construction revenues are generated from operations in the United
States and France. Our U.S. operating divisions are
20
26. Table of Contents
grouped into four geographic regions: “West Coast” – California; “Southwest” – Arizona, Nevada and New Mexico; “Central” –
Colorado, Illinois, Indiana, Louisiana and Texas; and “Southeast” – Florida, Georgia, Maryland, North Carolina, South Carolina and
Virginia.
Housing Revenues
Housing revenues for the quarter ended February 28, 2006 reached $2.18 billion, increasing $565.0 million, or 35%, from
$1.62 billion in the year−earlier period. The increase was driven by 15% growth in unit deliveries to 7,905 and a 17% increase in our
average selling price to $276,200, up from 6,847 and $236,300, respectively, in the year−earlier period. Each of our geographic
regions generated year−over−year growth in housing revenues and, excluding France, in average selling price in the first quarter of
2006. The higher average selling prices in our domestic regions in 2006 resulted from a combination of factors: significantly higher
prices throughout the Southwest and Southeast regions, favorable demand and supply conditions in certain markets in the West Coast
and Central regions and increases in lot premiums and options sold through our KB Home Studios. Housing revenues from our U.S.
operations rose 35% to $1.88 billion on 6,443 unit deliveries in the first quarter of 2006 from $1.39 billion on 5,854 units in the first
quarter of 2005. Housing operations in France generated $307.1 million of housing revenues in the first three months of 2006, up 37%
from the year−earlier quarter.
• West Coast – In our West Coast region, housing revenues increased 43% to $703.4 million in the first three months of 2006 from
$491.9 million in the year−earlier period due to a 32% increase in unit deliveries to 1,446 from 1,095 in the year−earlier quarter and
an 8% increase in the average selling price to $486,500 from $449,200 in the year−earlier quarter.
• Southwest – Housing revenues from our Southwest region rose 36% to $499.0 million in the first quarter of 2006 from
$366.9 million in the first quarter of 2005 due to a 38% increase in the average selling price to $321,500 from $233,400 in the
year−earlier quarter. Unit deliveries were essentially flat year−over−year.
• Central – In our Central region, first quarter housing revenues increased 2% to $288.9 million in 2006 from $283.7 million in 2005
due to a 4% increase in the average selling price to $157,400 from $151,500 in the year−earlier quarter. Unit deliveries decreased
slightly to 1,835 units in the first quarter of 2006 from 1,873 units in the year−earlier period.
• Southeast – Housing revenues in our Southeast region rose 53% to $384.7 million in the first three months of 2006 from
$251.5 million in the corresponding period of 2005 due to a 23% increase in unit deliveries to 1,610 units and a 25% increase in the
average selling price to $239,000 from 1,314 units and $191,400, respectively.
• France – Revenues from French housing operations increased 37% to $307.1 million during the first three months of 2006 from
$224.1 million in the year−earlier period, as 47% growth in unit deliveries was partially offset by a 7% decrease in the average
selling price. Unit deliveries from our French operations increased to 1,462 in the first quarter of 2006 from 993 in the first quarter
of 2005, while the average selling price decreased to $210,000 from $225,700 during the same period, primarily due to a shift in
product mix and unfavorable foreign exchange rates.
Commercial Revenues
Our commercial business in France generated no revenues in the first quarter of 2006 compared to $2.2 million generated in the first
quarter of 2005. The decrease in commercial revenues in the first quarter of 2006 reflected diminished activity from our commercial
operations in France.
Land Revenues
Our revenues from land sales totaled $4.2 million in the first three months of 2006 and $8.2 million in the first three months of 2005.
Generally, land sale revenues fluctuate with our decisions to maintain or decrease our land ownership position in certain markets and
prevailing market conditions.
Operating income
Operating income increased $78.6 million, or 40%, to $274.2 million in the first three months of 2006 from $195.6 million in the first
three months of 2005 driven by higher housing revenues and an improved operating margin. As a percentage of construction revenues,
operating income rose .5 percentage points to 12.5% in the
21
27. Table of Contents
first quarter of 2006 from 12.0% in the first quarter of 2005 due to an increase in our housing gross margin. Gross profits rose
$152.9 million, or 37%, to $569.0 million in the first quarter of 2006 from $416.1 million in the year−earlier quarter. Gross profits as a
percentage of construction revenues increased mainly due to expansion in our housing gross margin, which increased .5 percentage
points to 26.0% in the first three months of 2006 from 25.5% for the same period of 2005, primarily due to a higher average selling
price. Commercial operations in France generated no profits during the three months ended February 28, 2006 compared with
$.4 million generated during the three months ended February 28, 2005. Company−wide land sales generated profits of $.9 million
and $3.9 million in the first quarter of 2006 and 2005, respectively.
Selling, general and administrative expenses increased to $294.8 million in the three months ended February 28, 2006 from
$220.5 million in the corresponding 2005 period. As a percentage of housing revenues, selling, general and administrative expenses
improved to 13.5% in the first quarter of 2006 from 13.6% in the year−earlier period.
Interest Income
Interest income totaled $1.2 million in the first quarter of 2006 and $1.0 million in the first quarter of 2005. Generally, increases and
decreases in interest income are attributable to changes in the interest−bearing average balances of short−term investments and
mortgages receivable as well as fluctuations in interest rates.
Interest Expense
Interest expense (net of amounts capitalized) totaled $4.8 million in the first quarter of 2006, up from $2.4 million for the same period
of 2005. Gross interest incurred during the three months ended February 28, 2006 increased $10.4 million from the amount incurred in
the corresponding period of 2005. The percentage of interest capitalized was 91% in the first quarter of 2006 and 94% in the first
quarter of 2005. The decrease in the percentage of interest capitalized in the first quarter of 2006 resulted from a lower proportion of
land under development compared to 2005.
Minority Interests
Minority interests totaled $11.7 million in the first quarter of 2006 and $14.4 million in the first quarter of 2005. Minority interests for
the three−month periods ended February 28, 2006 and 2005 were comprised of the minority ownership portion of income from
consolidated subsidiaries and joint ventures related to residential and commercial activities. The decrease in minority interests in the
first quarter of 2006 primarily related to decreased activity from a consolidated joint venture in California, partially offset by higher
earnings from our publicly−traded French subsidiary. We continue to maintain a controlling interest in our French subsidiary and
therefore, consolidate these operations in our financial statements. As of February 28, 2006 and 2005, we maintained a 49% equity
interest in our French subsidiary and 68% of the voting rights associated with its stock.
Equity in Pretax Income of Unconsolidated Joint Ventures
Equity in pretax income of unconsolidated joint ventures totaled $5.8 million in the first quarter of 2006 and $5.6 million in the first
quarter of 2005. Our unconsolidated joint ventures recorded combined revenues of $107.8 million in the first three months of 2006
compared to $59.0 million in the corresponding period of 2005. The unconsolidated joint venture revenues in the first three months of
2006 were generated from both residential and commercial activities, while in the first three months of 2005 all of the unconsolidated
joint venture revenues were generated from residential properties. Residential activities performed by our unconsolidated joint
ventures generally include buying, developing and selling land. In some cases, our residential unconsolidated joint ventures also
construct and deliver homes. Residential unit deliveries from unconsolidated joint ventures totaled 76 in the first quarter of 2006
versus 210 in the first quarter of 2005. Unconsolidated joint ventures generated combined pretax income of $13.5 million in the first
quarter of 2006 and $9.9 million in the corresponding period of 2005.
FINANCIAL SERVICES
Our financial services segment provides title, escrow coordination and insurance services to our domestic homebuyers and, indirectly
through Countrywide KB Home Loans, provides mortgage banking services. On September 1, 2005, we completed the sale of
substantially all the mortgage banking assets of KBHMC to Countrywide Financial Corporation (“Countrywide”) and in a separate
transaction established Countrywide KB Home Loans, a joint venture with Countrywide. Countrywide KB Home Loans began making
loans to our U.S. homebuyers on September 1, 2005 and essentially replaced the mortgage banking operations of KBHMC. KB
22
28. Table of Contents
Home and Countrywide each have a 50% ownership interest in the joint venture with Countrywide providing management oversight
of the joint venture’s operations. Countrywide KB Home Loans is accounted for as an unconsolidated joint venture in the financial
services reporting segment of our financial statements.
The following table presents a summary of selected financial and operational data for our financial services segment (dollars in
thousands):
Three Months Ended February 28,
2006 2005
Revenues $ 4,326 $ 7,627
Expenses (1,747) (7,024)
Equity in pretax income of unconsolidated joint venture 1,150 —
Pretax income $ 3,729 $ 603
Total originations*:
Loans 3,241
Principal $ 570,739
Retention rate 49%
Loans sold to third parties*:
Loans 2,591
Principal $ 403,596
* Information for 2006 is not presented since KBHMC did not directly originate loans subsequent to the sale of all its mortgage
banking assets on September 1, 2005.
Revenues
Revenues from financial services operations were generated from the following sources: interest income; title services; insurance
commissions; escrow coordination fees; and sales of mortgage loans and servicing rights. Financial services revenues for the three
months ended February 28, 2006 and 2005 included interest income of $.1 million and $2.5 million, respectively. Interest income
decreased in the first three months of 2006 due to the sale of KBHMC’s mortgage banking operations in the fourth quarter of 2005 as
interest income in the year−earlier period was earned primarily from first mortgages and mortgage−backed securities held for
long−term investment as collateral. Financial services revenues also included revenues from title services, insurance commissions and
escrow coordination fees aggregating to $4.3 million and $3.7 million in the first quarter of 2006 and 2005, respectively. The
increased revenues from these services in the first quarter of 2006 were due to the higher unit deliveries from our domestic
homebuilding operations in the period compared to the year−earlier period. First quarter 2005 financial services revenues also
included mortgage and servicing rights income of $1.4 million. Due to the sale of KBHMC’s mortgage banking operations in the
fourth quarter of 2005, no mortgage and servicing rights income was generated in the first quarter of 2006.
Expenses
Expenses of the financial services segment were comprised of interest expense and general and administrative expenses. Interest
expense decreased to a negligible amount for the quarter ended February 28, 2006 from $1.7 million for the quarter ended
February 28, 2005. General and administrative expenses totaled $1.7 million and $5.3 million in the first quarter of 2006 and 2005,
respectively. The decreases in interest expense and general and administrative expenses in 2006 versus 2005 were primarily due to the
sale of KBHMC’s mortgage banking operations in the fourth quarter of 2005.
Equity in Pretax Income of Unconsolidated Joint Venture
The $1.2 million reported as equity in pretax income of unconsolidated joint venture for the three months ended February 28, 2006
relates to our 50% interest in the Countrywide KB Home Loans joint venture. The joint venture commenced operations on
September 1, 2005.
23
29. Table of Contents
INCOME TAXES
Income tax expense totaled $93.9 million in the first quarter of 2006 and $63.3 million in the first quarter of 2005. These amounts
represented effective income tax rates of approximately 35% for the first quarter of 2006 and 34% for the same period in 2005. The
increase in our effective tax rate in the first quarter of 2006 was primarily due to higher pretax income, growth in markets with higher
state tax rates, and a decrease in available tax credits, partially offset by the tax benefits of the manufacturing deduction created by the
American Jobs Creation Act of 2004.
During 2006, 2005 and 2004, we made investments that resulted in benefits in the form of fuel tax credits. Under current tax law,
these credits are subject to a phase−out provision that gradually reduces the credits if the annual average price of domestic crude oil
increases to a stated phase−out range. The annual average price of domestic crude oil is determined by the Secretary of the Treasury in
April for the preceding year. There was no reduction in the tax credits in 2004 and, based on our projections, we do not anticipate a tax
credit phase−out for 2005 since the estimated reference price of domestic crude oil is not expected to exceed the beginning of the
estimated phase−out range. However, our 2006 effective income tax rate, currently expected to be approximately 35%, may increase
in the event oil prices remain at or above current levels and cause tax credits to be reduced.
Liquidity and Capital Resources
We assess our liquidity in terms of our ability to generate cash to fund our operating and investing activities. Historically, we have
funded our construction and financial services activities with internally generated cash flows and external sources of debt and equity
financing. We also borrow under our $1.5 Billion Credit Facility, and our French subsidiary borrows under various lines of credit.
Operating, investing and financing activities used net cash of $64.7 million and $71.2 million in the first quarter of 2006 and 2005,
respectively.
Operating Activities. Operating activities used net cash of $472.2 million and $362.3 million during the first three months of 2006 and
2005, respectively. The higher amount of cash used in the first quarter of 2006 reflected our increased investment in inventories to
support the expansion of our business. Our uses of operating cash in the first quarter of 2006 included net investments in inventories
of $723.0 million (excluding $34.6 million of inventories acquired through seller financing and $67.9 million of inventories of
consolidated VIEs), and other operating uses of $8.8 million. The uses of cash were partially offset by earnings of $174.5 million, an
increase in accounts payable, accrued expenses and other liabilities of $54.5 million, a decrease in receivables of $13.5 million and
various noncash items deducted from net income.
Our uses of operating cash in the first quarter of 2005 included net investments in inventories of $444.2 million (excluding
$90.6 million of inventories acquired through seller financing and $.9 million of inventory of consolidated VIEs), a decrease in
accounts payable, accrued expenses and other liabilities of $117.5 million, and other operating uses of $22.7 million. Partially
offsetting these uses were first quarter earnings of $122.7 million, a decrease in receivables of $76.0 million and various noncash
items deducted from net income.
Investing Activities. Investing activities used net cash of $75.3 million in the first three months of 2006 and $24.9 million in the
year−earlier period. In the first three months of 2006, $70.5 million was used for investments in unconsolidated joint ventures and
$4.8 million was used for net purchases of property and equipment. In the first three months of 2005, $19.0 million was used for
investments in unconsolidated joint ventures and $6.1 million was used for net purchases of property and equipment. Partially
offsetting these uses were $.2 million of proceeds from other investing activities.
Financing Activities. Financing activities provided net cash of $482.8 million in first three months of 2006 and $315.9 million in the
first three months of 2005. In the first quarter of 2006, sources of cash included $615.9 million in net proceeds from short−term
borrowings, $52.6 million from the issuance of common stock under employee stock plans and $5.4 million of excess tax benefit from
stock−based compensation. These sources were partly offset by $165.4 million used for repurchases of common stock, dividend
payments of $20.0 million and payments of $5.7 million to minority interests. On December 8, 2005, our board of directors increased
the annual cash dividend on our common stock to $1.00 per share from $.75 per share. The first quarterly dividend at the increased
rate of $.25 per quarter was paid on February 23, 2006 to stockholders of record on February 9, 2006.
24