The chemical stability of tailings from mineral processing is important subject for study within the research field regarding the possible impacts for the environment, especially groundwater pollution and acid mine drainage (AMD). Tailings generated from processing metal ores can be classified as fined-grained sediment-water slurry. The solids are composed of minerals such as silicates, oxides, hydroxides, carbonates, and sulphides. The mineralogical and geochemical studies of tailings from metals ores are key factors used in the investigation of the chemical reactions and chemical systems that results in AMD. The scope of the study is to investigate tailing dams as a potential source of Arsenic (As) in Dokyiwa tailing dam which is an abandoned together with Pompora tailing dam and one active tailing dam which is the Sansu tailing dam at obuasi municipality and its dissolution into adjoining environmental media. The scope of this work is confined to Dokyiwa tailing dam in Obuasi municipality.
VIP Model Call Girls Chakan ( Pune ) Call ON 8005736733 Starting From 5K to 2...
Kamockbaidoo project work
1. 1
CHAPTER ONE
INTRODUCTION
1.1 Introduction
The gold (Au) that is mined in Obuasi is associated with sulphide mineralization, particulary
arsenopyrite (FeAsS), pyrite (FeS2), galena (PbS), chalcopytirte (CuFeS2) and spharite (FeZn)s.
Aresnic is considered as a trace element, which is mobile in both the hydrosphere and the
atmosphere. It is neither a metal nor a non-metal but has been classified as a metalloid, which
source in surface water is most often the leaching of geological material inputs from geothermal
sources, mining waste and landfills. After the precious metals which are usually derived from the
sulphide ores are extracted, varying concentration of other undesirable inorganic parameters such
as arsenic, copper, lead, zinc, iron, sulphate, cynide, nitrate, calcium, and magnesium are usually
passed into tailings. The tailings together with the sulphide bearing mine waste rock are often
exposed to the weather, thereby resulting in mobilization of metals and other chemical
compounds related to ore processing into nearby water bodies. Elevated concentrations of these
elements in the water bodies pose serious health hazards to host communities. The rate of
contamination is likely to increase with increase in treatment of high tonnage material. Arsenic is
mobilized in the environment as a result of oxidation of arsenopyrite. The mining activities
generate a lot of chemical waste and have caused various degrees of environmental damage and
threat to plants, animals as well as human life. Mining can generate large concentration of highly
soluble inorganic matter, some of which are considered toxic. Arsenic has achieved great
notoriety due to its toxic properties of a number of its compounds. Fortunately, there are
differences in the toxicity of different compounds and the species that are most commonly found
in soils are not the most toxic. Arsenic compounds appear to have been used by humans for
several years.
1.2 Problem Statement
Mining operations generally produce many types of mine wastes, including mine tailings, waste
rock and slag. Mine tailings dam act as a main source of environmental contamination in various
mining community areas. Arsenic (As) and heavy metals may be released from the mine wastes
to the groundwater and surface water systems, as well as the geological environment due to their
2. 2
solubility and mobility. A large amount of mine wastes including mine tailings, slag, and waste
rocks are also produced by the mining activities. Various surveys have been carried out to
determine arsenic concentration in various parts of the world (Ahmed et al, 2005: Bortoleto and
Cadore, 2005). These surveys have served to quantify levels of arsenic in different environments
and have provided an understanding of the natural and anthropogenic sources of arsenic
concentration in drinking water and soils. Arsenic is widely distributed in nature and mainly
transported into the environment by water. The main sources of arsenic exposure for the general
population is ingestion of surface and ground water sources as well as soil materials with high
levels of arsenic, especially from mine waste.
Humans, animals and plants are exposed to inorganic or organic arsenic through environmental,
medicinal, and occupational sources (Yang et al, 2003). Mining activities cause arsenic to be
released in high concentration from oxidized sulphide minerals. This may result in high
concentration of arsenic in surface water, soils and vegetation.
In spite of the known environmental problems of goldmines in the world, there is enormous
pressure to mine Ghana’s mineral resources. Mining, in Ghana, normally results in land
degradation through loss of vegetation cover, soil erosion and arsenic contamination of both
water and soil from poor handling of ore processing tailings and dumped mine waste. Some
studies have investigated arsenic and its health effect in Ghana, however these investigation have
not estimated the size of the affected area and level of arsenic concentration and its spatial
distribution. High concentration of arsenic in the environment may endanger the health of plants,
animals and may also affect the suitability of food crops and portable water for human
consumption. Arsenic effect in humans has been reviewed by Duker et al (2005a). The organs
mostly affected by arsenic include kidney, skin, liver and the circulatory system.
During the year 2005, there were three recorded incident of tailings spillage, each of which
resulted in serious environmental problems in Obuasi;
1. In February 2005 two birds died from a pool of arsenic contaminated water in the area;
2. 4,000,000 cubic meters of arsenic contaminated water spilled into the Nyam river as well
as active farm lands and
3. 3
3. An overflow of tailings treatment retention sumps into a number of settlements, farm
lands and grass land (Anglogold Ashanti, 2005).
1.3 Objectives
The main objectives of the of the study area among other things include:
1. To determine the presence of arsenic within the vicinity of the tailings dam.
2. To evaluate the variability of arsenic as they move from their source.
3. To determine the extent of disposal of arsenic concentration as they move away from
their point source into surface water.
1.4 Justification
The project work is aimed at carrying out sampling and analysis for the concentration of arsenic,
which is a major product from arsenopyrite. Arsenopyrite is one of the main sulphide minerals
found in the ore deposits of the Obuasi mine. Information of the concentration, and extent of
dispersion can help in decision making as for surface water and groundwater is concern in the
study area.
1.5 Scope
The project is confined in old Dokyiwa where there is this abandoned Dokyiwa tailings dam
which is located very close to the Dokyiwum river. The project is based on the study of arsenic
concentration in surface-water in the vicinity of tailings dam at Dokyiwa, Obuasi mine. The
purpose of the project is to determine the variability interms of concentration of arsenic with
respect to distance from disposal (tailings dam). Dokyiwa is located in Adansi West in Obuasi
municipality, which is found within Lat 06012’8”and Long 01043’57”.
1.6 Organization of Report
The report of this project work is in the following order;
1. Introduction
2. Literature Review
3. The Study Area
4. 4
4. Data collection and Data of analysis
5. Results and Discussion
6. Conclusion and Recommendation
7. References
8. Appendix
5. 5
CHAPTER TWO
LITERATURE REVIEW
2.1 Sources of Arsenic
2.1.1Major Arsenic Minerals
Arsenic occurs as a major constituent in more than 200 minerals, including elemental arsenic,
arsenopyrite (FeAsS), realgar (AsS), pyrite (FeS2), galena (PbS), sphalerite (FeZn)s, orpiment
(As2S2) dissolving naturally over time as certain types of rocks and soil are weathered. A list of
some of the arsenic minerals is given in Table 2.1. Most are ore minerals or their alteration
products. The natural pool of arsenic in surface soils arises from the net of geological,
hydrological and soil-farming biogeochemical processes. The greatest concentrations of these
minerals occur in mineralized areas and are found in close association with the transition metals
as well as Cd, Pb, Ag, Au, Sb, P, W and Mo. Under typical soil-forming conditions, the nature of
soil arsenic is controlled by the lithology of the parent rock materials, volcanic activity,
weathering history, transport, biological activity and precipitation.
Table 2.1 Major sources of arsenic minerals in rocks
Minerals Composition Source
Native arsenic As Hydrothermal veins
Arsenolite (Cu,Fe)12As4S13 Hydrothermal veins
Cobaltite CoAsS Hot springs,Volcanic
sublimation product
Realgar AsS Vein deposits, Clay and
limestone
Energite Cu3AsS4 Hydrothermal veins
Niccolite NiAs Vein deposits and norites
Orpiment As2S3 Hydrothermal veins, hot
springs
Hoernesite Mg3(AsO4)2.8H20 Secondary mineral
Heamatolite (Mn,Mg)4Al(AsO4)(OH)8 Smelter wastes
6. 6
Where arsenopyrite is present in sulphide ores associated with sediment-hosted gold deposit
tends to be the earliest-formed mineral, derived from hydrothermal solutions and formed
temperatures typically of 1000C or more. This is followed by the formation of rarer native
arsenic a thereafter arsenian pyrite. Realgar and orpiment generally form later still. This
paragenetic sequence is often reflected by zonation within sulphide minerals, with arsenopyrite
cores zoning out to arsenian pyrite and realgar-orpiment rims. Oxide and sulphate are formed at
the latest stages of ore mineralization.
2.2 Occurrences of Arsenic
2.2.1 Earth Crust
Arsenic can be present in soil, air and water as a metalloid and as chemical compounds of
inorganic and organic forms. Arsenic ranks on the twentieth most abundant element in the
earth’s crust, fourteenth in the sea-water and the twelfth in the human body (Mandal,
2002).Arsenic occurs as a major constituent in rock minerals, including elemental arsenic,
arsenide sulphides, oxides, arsenates and arsenites approximately 60% being arsentes, 20%
sulphides and sulphosaltes and the remaining 20% being arsenides, arsenite, and elemental
arsenic. The most common of the arsenic mineral is arsenopyrite (FeAsS). Arsenic is found to be
associated with many types of minerasl deposite especially those of sulphide minerals. The
concentration of associated arsenic can range from a few parts per million (mg/kg) up to
percentage levels. A list of typical arsenic concentration in common rock-forming minerals is
shown in Table 2.2. There is a relatively little differences in the concentration of arsenic in
different rocks types unless the level have been raised by associated mineralization. Mean values
of the order of 3ppm appears to be those most commonly found for igneous and sedimentary
rocks, but finer grained argillaceous rocks and phosphorites average 10-15 ppm (Alloway, 1990).
Higher level of arsenic are often associated with the presence of sulphide minerals such as pyrite
(Griffs et al, 2002). Arsenic has often been used as a pathfinder or indicator element when
geochemical prospecting methods have been utilized to identify minerals deposits (Asiam,
1996).
7. 7
Table 2.2 Typical arsenic concentration in common rock-forming minerals
Sulphide Minerals Arsenic (As) Concentration Range (mg/Kg)
Pyrite 100-77,000
Pyrrhotite 5-100
Galena 5-10,000
Chalcopyrite 10-5000
Oxide Minerals
Haematite Up to 160
Fe Oxide (Undifferentiated) Up to 2000
Magnetite 2.7-41
Ilmenite ˂1
Silicate Minerals
Quartz 0.4-1.3
Feldspar ˂0.1-2.1
Biotite 1.4
Amphibole 1.1-2.3
Olivine 0.08-0.17
Pyroxene 0.05-0.8
8. 8
Carbonates Minerals
Calcite 1-8
Dolomite ˂3
Siderite ˂3
Sulphate Minerals
Gypsum/Anhydrite ˂1-6
Barite ˂1-12
Jarosite 34-1000
2.2.2 Occurrence in Soil Materials
Arsenic can enter terrestrial and aquatic environment through natural, geologic and
anthropogenic processes. The primary anthropogenic contribution of arsenic to soil are from the
combustion of solid waste, application of arsenical pesticides (herbicides, fungicides and
insecticides), land application of solid waste/sewage sludge river and irrigation waters, mining
and smelting of arsenic constraining areas such as mining and smelting of arsenic containing
ores, combustion of fossil fuel (especially coal), land filling of industrial wastes, the lease or
disposal of chemical waste agents. The average arsenic content in the earth’s crust was estimated
to be about 1.8ppm (Geenwood, 1984). A similar level of 1.5ppm was also suggested by Onish
(1969) for igneous rocks. Higher arsenic level was detected in sedimentary rocks and value as
high as 13ppm is common for clay rich rocks. Since arsenic accumulates due to weathering and
translocation in colloid fractions, its concentration is usually higher in soils than in parent rocks.
Arsenic concentration ranges from 1.7 – 400ppm in sedimentary formation, and from 1.3-
3.0ppm in the igneous formation. The US national academy of science, medical and biological
effects of environmental pollutants (2000) established the average of arsenic of the earth’s crust
as 2.5ppm. However, more recently, Nagy (2005) has proposed that the total arsenic in the
earth’s crust ranged from 45- 3275ppm. Concentration of arsenic in non-contaminated soils also
9. 9
ranged from 0.1- 40ppm Kabata-Pedias (1992) and Fitz (2002) suggested a new value of ˂
1.0ppm. This makes it clear therefore that the general values for uncontaminated soils are
significantly higher than for uncontaminated rocks. Arsenic is also commonly associated with
sulphides, eg in sulphidic ore deposites. The elevated arsenic level within the gangue minerals
associated with an economic ore minerals leads to the risk of wind dispersal and leaching of
arsenic from finely ground spoil tip and overflow of tailings dam materials. This may lead to
very high arsenic concentration close to old and active dumps, though levels drop off rapidly
with distance away from the dump site (Alloway, 1990). The rate of decline in arsenic
concentration is also influenced by the degree of stabilization of the damage materials affecting
the drainage pathways and also the influence of vegetation cover absorbing the arsenic
concentration. Arsenic compounds have been widely used as pesticides over hundreds of years,
but their uses are now declining. The phyto-toxic effect of arsenic compounds made them
attractively as herbicides and desiccant to allow cotton to be easily harvested after defoliation.
However, there has been concern about the build-up of arsenic residue in soil and stream
sediments which has occurred after the use of large quantities of inorganic arsenic compounds.
Worldwide usage of arsenic has been estimated to be 8000t As/yr as herbicides, 12000t As/yr as
cotton desiccant and 16000t As/yr in wood preservative. The rate of application of the pesticide
is generally in the range 2-4 kg As/ha but larger quantities of Dimythylarsenic acid (DMA) may
be used with application rates being up to three time greater. In addition small quantities of
organo arsenic compounds are used as animal feed additives at rate of 10-50 mg As/kg feed, to
promote growth in chickens, turkey and pigs.
2.3 Arsenic Level
2.3.1 River Water
The relative occurrence and abundance of naturally occurring arsenic in soils and rocks, has
contaminated many water bodies in some parts of the world. The average concentration of
arsenic in precipitated oceanic water is 0.01µg/l and 0.46µg/l from terrestrial air masses
(Frankenberger, 2002). Rain water infiltrates through the soil/rock or aquifer material and is
altered in composition as a product of chemical weathering, through all this chemical process it
becomes a great solvent which dissolves arsenic from soils and rock, which can reach toxic
10. 10
levels from groundwater to surface water. Surface water differs in composition from
groundwater due to less soil-water contact time, which results in diluted water with minor
attraction of rainwater chemistry. The contact time significantly dictates the chemical make-up
of water.
A range of 0.1 - 80µg/l of arsenic is generally found in fresh surface and ground water. The
higher arsenic concentration reported is 340mg/l in acid waters (PH= -1.0) draining sulphide
waste materials at iron mountain, California, USA (Nordstorm, 1991). Devastating organic
arsenic concentrations of several thousand µg/l are found in well water in India, Bangladesh and
China. Arsenic concentration in seawater is typically 1-3µg/l and is a subject to biological
uptake. Arsenic in drinking water poses a significant threat to human’s health around the world,
therefore the commission of the European community is aiming at standards in the range of 2-
20µg/l and the interim maximum permissible concentration for Canadian drinking water is
25µg/l (Smedley and Kinniburgh, 2002). Japan and Germany have reduced the guideline value
for recommended arsenic in drinking water to 10µg/l. Water a quality guideline in Australia
differ and depends on usage, for example the drinking water standard is 7µg/l which the
recommended water quality unit is 50µg/l of arsenic (ANZECC, 2000).
2.3.2 Groundwater
Background concentration of arsenic in groundwater are in most countries less than 10µg/l (e.g.
Edmunds et al, 1989 for the UK; Welch et al 2000 for the USA) and sometimes substantially
lower. However, values ranging from ˂0.5-5000 µg/l. This range occurs under natural
conditions. High concentrations of arsenic are found in groundwater in a variety of
environments. This includes both oxidizing (under conditions of high pH) and reducing aquifers
and in areas affected by geothermal, mining and industrial activity. Evaporative concentration
can also increase concentrations substantially. Most high-arsenic groundwater provinces are the
result of natural occurrences of arsenic.
2.3.3 Food
The total estimated daily dietry intake of arsenic may vary widely, mainly because of wide
variations in the consumption of fish and shellfish. Most data reported are for total arsenic intake
11. 11
and do not reflect the possible variation in intake of the more toxic inorganic arsenic species.
Limited data indicate that approximately 25% of the arsenic present in food is inorganic, but this
is highly dependent upon the type of food. Fish and meat are the main source dietary intake of
arsenic (Gartrell et al., 1986a); levels ranging from 0.4 – 118 mg/kg have been reported in
marine fish sold for human consumption, and concentration in meat and poultry can be as high as
0.443. The mean daily intake of arsenic in food for adults has been estimated to range from 16.7
– 129 µg (Hazell, 1985); the corresponding range for infants and children is 1.26 – 15.5 µg. In
preminary studies in North Americ, the estimated daily intake of arsenic from diet was 12 – 14
µg of inorganic arsenic.
2.3.3 Atmosphere
Low temperature volatilization and volcanic activity are the biggest natural processes to
introduce arsenic into the atmosphere. Anthropogenic activities resulting from mining operation
and fossil fuel combustion significantly contribute for arsenic levels in the atmosphere. Smith et
al (1998) reported a ratio of 70:30 between natural and anthropogenic sources of atmospheric
arsenic. Since arsenic is a natural component of Pb, Zn, Cu and Au ores, smelting and processing
of such ore releases As2O3 to the atmosphere. Arsenic concentration around 10-5-10-3 µg/l have
been noted in unpolluted areas, 0.003-0.18µg/m3 in urban areas and more than 1µg/m3 in
polluted industrial areas (WHO, 2001). Total arsenic annual deposition rates have been
calculated in the range ˂ 1-1000µg/m2. Much of the atmospheric arsenic is in particulate form
and is transported to the water bodies and surface soils by wet and dry deposition and may
therefore increase the aqueous concentration slightly. However, there is little evidence to suggest
that from coal burning has been invoked as a major cause of lung cancer in parts of China.
2.3.4 Mine Drainage
Under the extreme acid conditions of some acid mine drainage (AMD), which can have negative
pH values (Nordstrom et al, 2000), high concentration of wide range of solutes are found,
including iron and arsenic. The highest reported arsenic concentration of 850,000µg/l, is from an
acid seep in the Richmond mine at Iron Mountain, California (Nordstorm and Alpers, 1999). In a
compilation of some 180 samples of mine drainage from the USA, Plumlee et al. (1999) reported
concentrations ranging from detection limits (˂1µg/l or more) to 340,000µg/l, again the highest
12. 12
values being from Richmond mine. Gelova (1977) also reported an arsenic concentration of
400,000µg/l from the Ural Mountains. Dissolved arsenic in acid mine waters is rapidly removed
as the iron is oxidized and precipitated and the arsenic scavenged through adsorption.
2.4 Health Impacts of Arsenic
Historically, the mining and smelting of trace elements has created soil contamination problems
of great magnitude. Fine particles selectively eroded from the mining waste-rock, tailings and
slag have potential to contaminate nearby soils or may migrate as sediments in surface waters,
greatly enlarging the area affected by the original mining activities. Like many contaminants in
drinking water, arsenic is potentially hazardous at certain levels and concentrations that do not
impart a noticeable taste, odor, or appearance to the water. The toxicity of arsenic is well
documented (Tseng et al, 1968; Carlos, et al, 1997); after a few years of continued high level of
arsenic exposure, many skin ailments may appear. These include hypopigmentation (white
spots), hyper pigmentation (dark spots), which are collectively called melanosis by some
physicians and dyspigmentation by others. Other adverse health effects include hypertension,
cardiovascular diseases, cerebrovascular diseases, diabetes and reproductive defects, including
low birth weight, high occurrence of spontaneous abortions and stiilbirths, and congenital
malformations in the offspring, damage to the blood vessels, decrease in the production of blood
cells, and feelings of pins and needles in the hands and feet, liver and kidney damage. The
permissible limit for arsenic in drinking water by the WHO (2004) is 10µg/l, where any arsenic
concentration in drinking water above this value is considered unsafe to drink, but below it is
well considered safe to drink.
2.4.1The Scale of the Problem
Well-known cases of arsenic poisoning from natural arsenic in the drinking water have been
found in Taiwan, Chile, Argentina, Mexico, China, Ghana and more recently in West Bengal
(India) and Bangladesh. The scale of the problem in terms of population exposed to high arsenic
concentrations is greater in Bengal Basin with perhaps 40 million people drinking water
containing excessive arsenic. Many of the world problems occur in poor countries without the
necessary infrastructure to be able to respond rapidly.
2.4.2 The Nature and Causes of the Problem
13. 13
The range of arsenic concentrations found in natural waters is usually large, ranging from less
than 0.5µg/l to more than 5000µg/l that is a range of greater than ten thousand times. Typical
concentrations in freshwater are less than 10µg/l and often less than 1µg/l rarely, much higher
concentrations are found and this gives rise to arsenic problem areas. In such areas, the
percentage of affected wells (defined as those exceeding 50µg/l) may exceed 10% of wells and
even the worst cases, may exceed 90% of wells. These large-scale natural arsenic groundwater
problem areas are found all over the world but they tend to be confined to two types of
environment: firstly, inland or close basins in arid or semi-arid areas, and secondly, strongly
reducing aquifers often derived from alluvium. Arsenic contaminated groundwater is also found
in geothermal areas and, on a more localized scale, in areas of mining activity or where sulphide
oxidation has taken place. There likely to be other known problems in mining areas related to
acid mine drainage (AMD) and the generally metal-rich waters.
2.5 Mining and Metallurgic History of Arsenic Related Problems
2.5.1 Ghana
Gold has been mined the Obuasi area for over century. The gold was discovered and worked
mechanically from alluvium and friable quartz of reefs long before the arrival of the Europeans
in 1895 (Kumi, 1998). Early mining was from quartz vein outcrops on the surface, which were
later accesed by adits and shafts. The first shaft was sunk in 1905 (Ayensu, 1996). This method
of mining was changed to conventional cut-and-fill in stopes through sub-level caving in 1969
and then to full-scale mechanization in 1986. The transformation greatly increased the extraction
of ore tonnages. Waste generated during the process of minig development is used as stope back-
fiils, thus limiting fresh underground waste rock from being exposed entirely to the surface
conditions.
Open pit activities and major re-treatment of old tailings around the Pompora Treatment Plant
(PTP) area evolved massively in the 1980s (Anon, 1992). From 1947-1992, suiphide pre-
treatment was solely by pyro-metallurgy, which gradually came to a halt in 200. Pyro-
metallurgical pre-treatment method in the extraction of gold from sulphide is high diversified
and takes advantage of the relatively abundance of iron in the ore. Iron (II) compounds are
oxidized to iron (III), which is a potential impurity, and the application of lime (as neutriliser)
14. 14
enhances the process in a carbothermal reaction that proceeds at a relatively low temperature
(Rankins, 1987). Sulphur oxides to sulphur dioxide, and then hydrolyses in the presence of water
to soluble sulphates, while arsenic (III) oxidises to arsenic (V). The sulphate precipitates as
stable solids of iron (III) and arsenic (V) prior to disposal. Hydrometallurgical pre-treatment
involving the use of natural, bacteria to catalyse mineral oxidation was first introduced in 1992,
and gradually developed to full capacity in 2000. The principal mineral extraction method is by
the autoclave-carbon in leach (CIL) electro-wining process. An Oxide Treatment Plant (OTP)
was installed for the treatment of oxide ore, a Heap Leach Plant (HLP) treated low-grade
sulphide, while Tailings Treatment Plant (TTP) was installed for tailings reclamation.
Several workers have reported the effect of mining activity on the environment in Ghana. Today
Ghana produces one third of the world’s gold. The most important mining areas in Ghana is the
Ashanti Region. The gold in Ghana is associated with sulphides mineralization particulary
arsenopyrite. Arsenic mobilizes in the environment as a result of arsenopyrite oxidation induced
by mining activities (especially dispersal of tailings). Around the town of Obuasi, high arsenic
concentrations have been reported in rivers, schools compounds, farm lands and settlements
close to the mine sites. Groundwater in the gold belt of Ghana is thus vulnerable to potential
arsenic problem as a result of oxidation of sulphide minerals.
2.5.2 Arsenic Distribution around the World
Many other areas have increased concentration of arsenic in soils, sediments and waters as a
result of mining activity. Documented cases include the Lavrion region of Greece, associated
with lead and silver mining activity, the Zimapan Valley of Mexico, parts of south-west Engalnd,
South Africa, Zimbabwe and Bowen Island. Place such as Thailand probably has the worst
recorded case of arsenic poisoning related to mining activity, health problems were first
recognized in the country in 1987. Around 1000 people have been diagnosed with arsenic related
skin disorders, particularly in and close to Ron Phibum town. In the USA arsenic related
problems from mining activities has been identified in numerous areas of the country.
Groundwater from some areas has been reported to have very high arsenic concentration locally
(up to 48,000µg/l). Well documented cases of arsenic contamination include the Fairsbanks gold
mining district of Alaska.
15. 15
Arsenic is a significant contaminant of soil and groundwater in many regions of the world (Fig2.
1). Depending on the country, exposure to arsenic has come from natural sources, from industrial
sources or from food and beverages. High concentration of arsenic in drinking water (above
50µg/l) has been reported in several countries, including Argentina, Chile, Japan, Napal,
Mongolia, USA etc.
Figure 2.1: A map showing Arsenic Distribution around the world
2.6 Previous work
The previous good work that was done by P.Antwi Agyei (2007), J.N Hogarh (2009), G.Forli
(2009), Juliana Boateng (2013), they were able to make a lot of survey work and laboratory
analysis on trace elements contamination of soil around gold mine tailings dam at Obuasi,
Ghana. Trace elements analyzed by these researchers include As, Cu, Pb and Zn, where arsenic
16. 16
have the highest concentration in-terms of contamination as compared to the other trace
elements.
2.7 Present Work
This present study is also to investigate the issue of gold mine tailings dams as a potential source
of arsenic contamination and their dissolution into the adjoining environmental media, Obuasi
Municipality, Ghana, especially Dokyiwa, where available information was studied to ascertain
the problem of arsenic concentration from anthropogenic sources in streams. There are two
abandoned (Pompora and Dokyiwa) mine tailings dams in Obuasi gold mine, where more focus
was done on the selection of samples at the Dokyiwa tailings dam for laboratory analysis to
embark upon the previous work done by these researchers
2.8 Field Work.
Preliminary survey on the historical overflow of tailings into the communities fringing the mine
was conducted. Stream sediments were collected from the bank of the Dokyiwa stream and also
samples were collected at places with shallow depth to ascertain the level of arsenic
concentration.
17. 17
CHAPTER THREE
STUDY AREA
3.1 Location and Accessibility
Dokyiwa and its surrounding area is found within Adansi West which is bounded by latitude 060
12’ 8” and Longitude 010 43’ 57”. The study area primarily lies within the Adansi West District
which has Obuasi as its capital covering an area of 30.4km2. It also include limited area in the
adjoining Amansie east which has Bekwai as its capital, in which there is a good network of
interconnecting second and third class roads, exploration tracks and footpaths within the
concession. The area is easily accessible by the main Kumasi-obuasi-Dunkwa high way and
Yamronsa-Assin Fosu- Bekwai road which coverages with the Kumasi-Obuasi high way.
The Obuasi Municipality is one of the 21 district of the Ashanti Region located at the southern
part of part of Ashanti Region and is about 64km south of Kumasi the Regional capital and
300km North-west of Accra, the capital of Ghana. Obuasi Municipality is bounded on the south
by upper Denkyira District of the central region, East by Adansi South District, West by
Amansie Central District and North by Adansi North District (Obuasi Municipality, 2009).
Before Ashantis expansion and the introduction of surface mining activities, AGCs mining
activities were limited to Adansi West District. Obuasi is a household name in Ghana and is
synonymous with gold not only because of the long history of gold mining associated with the
township but also because of the quantity and quality of gold produced there.
18. 18
Figure 3.1: A map showing study area and some communities in Obausi
3.2 Climate and Vegetation
The climate is classified as semi-equatorial type with a double rainfall regime. The vegetation in
the area is mainly secondary forest, forbs regrowth, and swamp. There are two rainy season with
the major reaching its maximum in May and June and the minor October. The month of July,
August and early September are generally much drier than the remaining months. The annual
rainfall is about 1700mm with a temperature between 220C and 320C and relative humidity is 75-
80% in the wet season.
19. 19
The vegetation is a degraded one and with a semi-deciduous forest (Obuasi Municipality, 2009).
The natural vegetation of the area has been modified significantly by timber extraction, mining
and farming. As a result, the vegetation is not typical of moist semi-deciduous forest zone of
equatorial rain forest of West Africa. Primary forest is restricted to the most inaccessible areas.
Historically, trees like teak, mahogany, kapok and wawa have been selectively felled for use as
underground shoring timber and wood fuel. Major land use is farming (staple and cash crops),
although some firewood collection, logging and hunting are practice on the study area.
3.3 Relief and Drainage
Generally, the study area has an undulating terrain with prominent ridges more of hills rising
above 500 meters above sea level. The Municipality is drained by streams and rivers which
include Bonkroma, Ntensua, Dokyiwa, Kyekyan, Ntosua, Kwametawiah, Ntonkes. All this rivers
and streams are polluted by mining and other human activities (Obuasi Municipality 2006).
3.4 Regional Geology
The study area lies within the Ashanti Region which is made up of the Tarkwain and Birimian
(Metavolcanic and metasediments) sequence of Precambrian age, which are intruded granitoids.
The metvolcanic consist of metabasalt, metavolcanics which are intruded by belt-type granitoids
(Melcher et al, 1980, Mensah 2012). The Birimian can be broadly subdivided into metsediments
consisting of various basaltic and andesite lavas and pyroclastic. These subdivisions have been
deformed and regionally metamorphosed to lower green schist facies. The contrast between these
two units have been historically been focus on economic attention as this is the preferred position
for major shear zones and quartz veins that is found in most gold deposits in Ghana.
3.5 Local Geology
The geology of Obuasi mine has received considerable attention. The deposits are located in the
Birimian metavolcanics and metasedimentary rocks. Bedded and altered dark gray and black
phyllite and sericite schist dominate the metasediments with quartz, sericite and carbonates
making up the bulk of mineralogy of these metasediment. The metavolcanic represent
concordant flows within the metasedimentary pile (Hirdes and Leube, 1989) that are intruded by
contemporaneous and post-tectonic granitoids. The volcanic units are largely tholeitic in
20. 20
character that have been subjected to greenschist metamorphism. Meniralogically, they are
dominated by carbonate, chlorite, albite, serecite quartz and epidote. Structurally, mineralization
conforms to a general strike of NNE-SSW. Multiple deformational events have produced
pervasive shear zones, striking between NNE, and dipping at fairly high angles on either side of
the vertical plane. These multiple deformation regimes are believed to account for four distinct
mineralization and supergene-enriched oxides ores.
Figure 3.2: Regional geology of the area
3.6 Inhabitants and Occupation
The study area (Dokyiwa and its surrounding area) are found in Adansi East where the majority
of the population are Ashantis with some few other tribes. More than 85% of the people in the
study area are farmers, with few been government workers, thus people on salary.
3.7 Demographics and Economic Activity
21. 21
The population of Adansi West District is 220,000. About half of this number resides in Obuasi.
Obuasi and its environments can be described as an ethnocosmopolitan area with people from
diverse backgrounds and cultures (Population and Building Census, 2000). This is due to the fact
that mining operations in the area originally depend on migrant workers from various parts of
Ghana, especially the northern regions and neighboring countries, particularly Burkina Faso,
Mali, Togo and Niger. In the District, however the greater percentage of the population in the
informal sector is farmers, traders and artisans.
22. 22
CHAPTER FOUR
DATA COLLECTION AND METHOD OF ANALYSIS
4.1 Materials and Software
4.1.1 Sample Materials
1. Cutlass and a digging hoe
2. Polythene bags for stream sediment samples
3. Topographical map of the study area
4. G.P.S device
5. Arcgis 10.2
4.1.2 Laboratory equipment’s
1. Atomic absorption spectrometer (Spectra AA55B)
2. Test tube
3. Hot plate
4. Concentrated hydrochloric acid
5. Nitric acid
6. Distilled water
7. Electric weight
4.2 Research Method
In other to achieve the aim or objectives of the project, some methods where followed to ensure
the achievement of the project. This chapter put emphasis on the method used in carrying out the
study of the project area. It brings to light how samples information and data were collected and
how the study area was designed with associated equipment and tools used for the project work.
4.2.1 Desk Study
At this point, research and literature review were done to have a some knowledge of the geology
of the study area and also associated network of water bodies within the study area were known
23. 23
through geological books, internet sources, field equipment for field work were assembled to aid
in the collection of the samples at the vicinity of the study area.
The first week of the field work were used for field reconnaissance, which is part of the self-
location and orientation. This field reconnaissance helped in detailed planning, local studies and
provided more of the general geological picture and also associated water bodies in the study
area. Here observation and identification of places where the built dam was very close to the
river source was taken proper notice of. The second part of the field work, was done by
collection of samples which can be easily can be assesed were noted and places where samples
can not be assessed were also taken into consideration.
4.2.2 Site Selection
The area for the project was selected with careful observation made from the desk study. Places
where there would be potential source of information for the precision of the project were taking
into accounts.
4.2.3 Stream Sediments Sample Collection
A total of eleven sediment were taken from the Dokyiwa river, the collection of the samples
were designated as the upstream where four samples were taken at an interval of 100m, the
middle stream, in which three samples were taken with the respected sample interval and also the
downstream where four representative samples were also taken at the same interval to ascertain
the extent of contamination from anthropogenic (Dam spills) activity. At each demarcated
selected point 1kg stream sediment sample was collected at a depth of 20cm. The samples were
however not taken from locations that were difficult to access. Clean polythene bags were used
in storing stream sediment samples before it was transported to the laboratory. The samples bags
were carefully labeled with permanent markers to avoid mix-ups and the various GPS
coordinates were indicated on the sampling bags. During the sampling process, simultaneous
sites survey was carried out in-order to provide specific information relating to geology of the
sampling point. All sample preparation must be carried out neatly and systematically according
to well set procedures to avoid contamination of the samples. Sample preparation involves
various steps in the field and the laboratory. These includes drying crushing pulverizing splitting
homogenizing, composting etc
24. 24
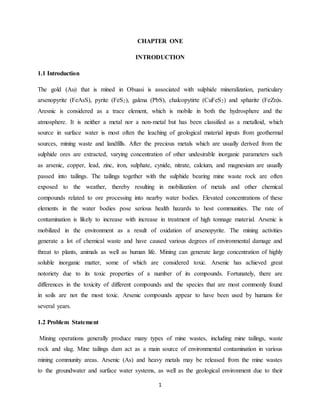
Figure 4.1: Sampling stream sediment along the Dokyiwa River
Cases of arsenic contamination in drinking water from streams, shallow wells and boreholes
have been found in Ghana with the highest levels occurring in the mining community of Obuasi
(Smedley et al 1996). The main source of arsenic in the area has been attributed to mining
activities, where streams and rivers found within the study area, which include Bonkroma,
Ntensua, Dokyiwa, Kyekyan, Ntosua, Kwametawiah, Ntonkese, Bentensua, Kobi. All this rivers
and streams are polluted by mining and other human activities (Obuasi Municipality 2006).
In the Obuasi mine waste dumps have high arsenic contents that contaminates the surrounding
streams percolating through the waste dumps especially when it rains. The south tailings dam
and the treatment retention sump of AngloGold Ashanti are situated close to a number of
communities. These communities, Nhyiaso, Apitiso, Apitikoko, Dokyiwa, and Twapease
constantly receive overflow of the tailings and the treatment retention sumps onto their
farmlands, houses, schools (AngloGold Ashanti,2005). From the study area there was an
evidence showing a change in the colour of chlorophyll plants, in which several plants have
25. 25
yellowish red leaves in colouration and reptiles such as lizards living the place as their habitat
have change in skin colour to reddish brown. (Fig 4.2 and Fig 4.3)
Figure 4.2: Lizards in the surrounding area with a change in skin colour.
Figure 4.3: Plants within the area with a change in chlorophyll.
27. 27
Figure 4.4: Map showing the concentration of Arsenic dispersion within the area.
4.2.4 Determination of Arsenic Level in the Laboratory
Eleven stream sediments were sampled in the whole study area in which the whole sample
yielded visible arsenic concentrate for chemical analysis. The analysis was performed in SGS
laboratory in Ghana. The chemical analysis involved the use of (spectra AA55B).
28. 28
Atomic absorption spectra AA55B involves heating the sample at a temperature of 1050c, latterly
crushed and kept in a brown paper bag with their indicated samples numbers respectively. A
sample of 0.5g was weighed into a test tube, adding 1ml of nitric acid (HNO3) and a
concentrated hydrochloric acid (Hcl) of 1ml was also added to the sample. The arsenic solution
is placed in a water bath digested at a temperature of 750c for an hour. After digestion, the
arsenic solution is cooled and topped up to 8ml mark of distilled water. The solution is later
aspirated to determine arsenic level using the atomic absorption spectrometer (spectra AA55B)
for analysis.
Figure 4.5: Detection of sample concentration and results by using spectra AA55B
The demonstrated data obtained from the laboratory analysis showed a significant variation of
arsenic concentration in the area, which ranges from 10.32µg/l to 274.2µg/l. The values recorded
in the area (Table 4.2) exceeded the WHO value for permissible limit to arsenic in drinking
water 10ppb (10µg/l).
29. 29
Table 4.2: Summary of Arsenic concentration from the sampling points within the study
area.
Sample ID Arsenic (ppm) Log of
Arsenic (As)
in (µg/l)
As in (µg/l) Arsenic (As)
higher than
WHO value
(10µg/l)
KB001/14 0.2742 2.44 274.2 >10µg/l
KB002/14 0.0632 1.80 63.2 >10µg/l
KB003/14 0.03 1.48 30 >10µg/l
KB004/14 0.02013 1.3 20.13 >10µg/l
KB005/14 0.0158 1.19 15.8 >10µg/l
KB006/14 0.01324 1.12 13.24 >10µg/l
KB007/14 0.01032 1.01 10.32 >10µg/l
KB008/14 0.10549 2.02 105.49 >10µg/l
KB009/14 0.035074 1.54 35.074 >10µg/l
KB010/14 0.027837 1.44 27.837 >10µg/l
KB011/14 0.01055 1.02 10.55 >10µg/l
To evaluate individual data sets, a representative log10 of the data sets was used to find standard
deviation and coefficient of variation which are shown in (Table 4.3).
Table 4.3: A summary table showing the log10 of the datasets used in finding standard
deviation and coefficient of variation.
Element
Arsenic (As)
Mean Log of Max
Value (µg/l)
Log of Min
Value (µg/l)
Standard
Deviation
Coefficient
of Variation
Upstream 1.755 2.44 1.30 0.499 28.43%
Mid-Stream 1.107 1.19 1.01 0.091 8.22%
Downstream 1.505 2.02 1.02 0.411 27.31%
30. 30
Table 4.4: Statistical Summary of the Overall Data
Mean Median Mean
Deviation
Variance Standard
Deviation
Skewness
1.49 1.44 1.9989 0.1999 0.44 0.34
To illustrate the normality of the parameters, a graph showing log of arsenic concentration in
ppm against distance which results is shown below in (Figure 4.6). A careful observation of the
summary results reveals that arsenic level increases from the upstream, later drops in the middle
stream and suddenly rises at the downstream.
2.44
1.8
1.48
1.3
1.19 1.12
1.01
2.02
1.54
1.44
1.02
100 200 300 400 500 600 700 800 900 1000 1100
Conc
plot of log of Arsenic (As) in ppm against distance
Arsenic(As)inppm
Distance (m)
Figure 4.6: A plot of log of Arsenic concentration against distance.
32. 32
CHAPTER FIVE
RESULTS AND DISCUSSION
5.1 Geochemical Analysis
The results demonstrated significant variation in the concentration of the determined arsenic in
the water sample. The concentration of arsenic in the study area ranges from 10.32µg/l to
274.2µg/l. The values of concentration recorded in the area (Appendix F) exceeded the WHO
value for permissible accepted arsenic value in drinking water. The results show that streams in
the study area are more polluted by the past and present mining activity of the area. The highest
value was recorded at the upstream which drops down at the middle stream where most of the
community takes their water source for drinking, cooking, and other domestic activity and later
rises at the downstream where for the past few years artisanal mining activity by the Chinese
people have seriously polluted the water, which is now unwholesome to drink. From the
calculation which was reviewed from the data set shows that, the standard deviation of the data
gives a precise precision, which means the standard deviation gave a value that was very close to
the mean, smaller standard deviation shows how the set of data are close to the mean, which
explains that there is an indication of consistency and stability of the data set which is shown in
(Appendix G). Larger standard deviation represents a wide variation of data sets away from the
mean, a large standard deviation implies that the random variable from the data set is rather
inconsistent and somewhat hard to predict. Therefore a small standard deviation value gives best
information for data interpretation. From the set of data it was reviewed that the distribution of
the data sets were right skewed by using the second person’s coefficient of skewness (Psk2) with
a value of 0.34 which is ˃ 0. By using the empirical rule 68% of the data set will fall within the
ranges of 1.043-1.937 of the arsenic concentration, 9 of the 11 sample data set fall within one
standard deviation of the mean, while a range of 0.596-2.384 of the arsenic concentration reveals
that 10 of the 11 sample in the data set fall within two standard deviation of the mean or
approximately 93% of the data set fall within the range. The corresponding log10 of
concentration of arsenic (ppm) at the upstream, middle stream, downstream is shown in the
33. 33
(Appendix G). The downstream of the Dokyiwa river extends to the Ntonsoa river,
Fenaso/Faaman, Kobi, Ntonkese, and other nearby communities.
5.2 Spatial Analysis
The inverse weight distance (IDW) map (Figure 4.7) indicates the spatial distribution of arsenic
concentration for the study area. High concentration of arsenic was located in the south west and
north east direction along the bank of the Dokyiwa river. Arsenic occurrence in Dokyiwa has not
been known except for the current reconnaissance work, by using the covariance to compare the
percentage of the concentration, the upstream showed 28.43%, the middle-stream displayed
8.22%, and the downstream showed 27.31%. It was observed in this study that promising arsenic
concentration has been found highly elevated at the upstream and somewhat restricted to the
middle-stream and abruptly rises at the downstream. The elevated arsenic level within the
gangue minerals associated with an economic ore minerals leads to the risk of wind dispersal and
leaching of arsenic from finely ground damage tip and overflow of tailings dam materials. This
may lead to very high arsenic concentration close to old and active dumps, though levels drop off
rapidly with distance away from the dump site (Alloway, 1990). The rate of decline in arsenic
concentration is also influenced by the degree of stabilization of the damage materials affecting
the drainage pathways.
34. 34
CHAPTER SIX
CONCLUSION AND RECOMMENDATION
6.1 Conclusion
The conclusions drawn from the study are presented in this section;
1. Results from the samples collected showed that the concentrations of Arsenic are in all
cases higher than the WHO recommended permissible limit.
2. Arsenic mobility is also show to high, detected far from the source area (tailings dam).
3. Concentration of Arsenic also appears to decrease as one move away from the source
area.
6.2 Recommendation
It is recommended that;
1. Due to the high impact of high concentration of Arsenic, people (farmers) along and in
the vicinity of the tailings dam areas and downstream must be educated on the health
hazards and avoid contacts with contaminated water and soil.
2. Some form of “flagging” to demarcate contaminated zones by way of notice boards (or
warning signs).
3. Measures must be taken by the mine to ensure further flow of Arsenic contamination into
the environment.
35. 35
REFRENCES
Ahmad, K., & Carboo, D. (2000). Speciation of As (III) and As (V) in some Ghanaian gold
tailings by a simple distillation method. Water, Air Soil Pollution, 122, 317-326.
Akabzaa, T.M., Banoeng-Yakubu, B. & Seyire, J.S. (2005). Heavy metal contamination in
some mining communities within Jimi river basin in Ashanti Region. Journal of the Ghana
Science Association.
Alvarez, R., Ordóñez, A. & Loredo, J. (2006). Geochemical assessment of an arsenic mine
adjacent to a water reservoir (León, Spain). Environmental Geology, 50, 873-884.
Amonoo-Neizer, E.H., Nyamah, D. & Bakiamoh, S.B. (1995). Mercury and arsenic pollution
in soil and biological samples around the mining town of Obuasi, Ghana. Water, Air Soil
Pollution, 91, 363-373.
Amonoo-Neizer, E.H., Nyamah, D., & Bakiamoh, S.B. (1996). Mercury and arsenic pollution
in soil and biological samples around the mining towns of Obuasi, Ghana. Water and Soil
Pollution.
AngloGold Ashanti. (2006). AngloGold Ashanti, Obuasi – Ghana, Country Report.
Ansong Asante, O., Agusa, T., Kubota, R., Subramania, A. Ansah, Environmental
assessment of gold beneficiation
Antwi-Agyei, P., Hogarh, J.N. & Foli, G. (2009). Trace elements contamination of soils
around gold mine tailings dams at Obuasi, Ghana. African Journal of Environmental Science
APHA, AWWA, & WEF. (2005). Standard methods for the examination of water and
wastewater. 2005
36. 36
Asiam, E.K. (1996). Environmental assessment of gold beneficiation: Arsenic audit and impact
on Obuasi environs. Ghana MiningJournal, 2 (1), 17 -20.
Asklund, R. & Eldvall, B. (2005). Contamination of water resources in Tarkwa mining area of
Ghana. Department of Engineering Geology, Lund University, Sweden.
Boadu, M., Osae, E.K., Gollow, A.A., Serfor-Armah, Y. & Nyarko, B.J.B. (2001).
Determination of arsenic in some water bodies, untreated ore and tailing samples at Konongo
in the Ashanti region of Ghana and its surrounding towns and villages by instrumental neutron
activation analysis. Journal of Radioanalytical and Nuclear Chemistry, 249 (3), 581 -585.
Boateng, E., Dowuona, G.N.N., Nude, P.M., Foli, G., Gyekye, P. & Jafaru, H.M., (2012).
Geochemical assessment of the impact of mine tailings reclamation on the quality of soils at
AngloGold concession, Obuasi, Ghana. Research Journal of Environmental and Earth
Sciences.
Carbo, D. & Sarfor-Armah, Y. (1997). Arsenic pollution in streams and sediments in
the Obuasi Area, Proc. Of UST -IDRC’97 National Symposium, Kumasi, Ghana. pp. 114.
Day, P.R. (1965). Particle fractionation and particle size analysis. In: methods of soil analysis,
No. 9 Part 2. Black, C.A., (Ed.), American Society of Agronomy, Madison, Wisconsin.
Foli, G. & Nude, P.M. (2012). Concentration levels of some inorganic contaminants in
streams and sediments in areas of pyrometallurgical and hydrometallurgical activities at the
Obuasi mine, Ghana. Environmental Earth Sciences, 65: 753-763, DOI: 10.1007/s12665-011-1
Golow, A.A., Schlueter, A., Amihere-Mensah, S., Granson, H.L.K. & Tetteh, M.S. (1996).
Distribution of arsenic and sulphate in the vicinity of Ashanti goldmine at Obuasi, Ghana.
37. 37
Bulletin of Environmental Contamination and Toxicology, 56: 703 -710.
Griffis, R.J., Barning, K., Agezo, F.L. & Akosah, F.K. (2002). Gold deposits of Ghana.
Minerals Commission of Ghana, Accra
38. 38
4.8 APPENDIX A (Water bodies contaminated by AGA mines)
List and state of water bodies in communities around Obuasi affected by AGA Obuasi mine.
No RIVER COMMUNITY
RIVER
RUNSTJROUGH
USAGE STATE PERCIEVED
CAUSE OF
POLLUTION
1 Supu Attakrom,
Fenaso, Dokyiwa
Domestic,
Spiritual
Polluted Mining
2 Nyam Kunka, Bogobiri,
Nhyiaeso
Spiritual,
Domestic
Polluted Mining
3 Asuako Suhyenso,
Nyamebekyere
Domestic Polluted Mining
4 Benom Nsuo Nyameso Domestic Polluted Mining
5 Pompo Diawuoso,
Yanfroasa,
Pomposo
Domestic Polluted Mining
6 Dokyiwa Dokyiwa,
Binsere, Ntonsua
Domestic Polluted
7 Agoo Krodua,
Akorampem
Spiritual,
Domestic
Polluted Mining
8 Batimbro Tweapease Domestic Polluted Mining
39. 39
APPENDIX B
Table 4.1: Sample Locations in Longitude and Latitude coordinate of the study area
Sample ID Longitude Latitude
KB001/14 060
12’
35.08”
010
42’
32.08”
KB002/14 060
12’
27.48” 010
42’
37.31”
KB003/14 060
12’
23.99” 010 42’ 89.51”
KB004/14 060
12’
20.17”
010
42’
42.29”
KB005/14 060
12’
15.79” 010
42’
44.00”
KB006/14 060
12’
08.95” 010
42’
44.47”
KB007/14 060
12’
30.57” 010
44’
05.40”
KB008/14 060
12’
41.75” 010
43’ 47.06”
KB009/14 060
12’
50.83” 010
43’ 30.54”
KB010/14 060
12’
53.50” 010
43’ 08.96”
KB011/14 060
12’
46.50” 010
42’ 46.19”
44. 44
APPENDIX F
The table below is the analyzed stream sediment for arsenic
Sample ID Arsenic (ppm) Log of Arsenic
(As) in (µg/l)
As in (µg/l) Arsenic (As)
higher than
WHO value
(10µg/l)
KB001/14 0.2742 2.44 274.2 >10µg/l
KB002/14 0.0632 1.80 63.2 >10µg/l
KB003/14 0.03 1.48 30 >10µg/l
KB004/14 0.02013 1.3 20.13 >10µg/l
KB005/14 0.0158 1.19 15.8 >10µg/l
KB006/14 0.01324 1.12 13.24 >10µg/l
KB007/14 0.01032 1.01 10.32 >10µg/l
KB008/14 0.10549 2.02 105.49 >10µg/l
KB009/14 0.035074 1.54 35.074 >10µg/l
KB010/14 0.027837 1.44 27.837 >10µg/l
KB011/14 0.01055 1.02 10.55 >10µg/l
45. 45
Appendix G ( A summary Table showing log10 of the data sets used in finding S.D and C.V)
Element
Arsenic (As)
Mean Log of Max
Value (µg/l)
Log of Min
Value (µg/l)
Standard
Deviation
Coefficient
of Variation
Upstream 1.755 2.44 1.30 0.499 28.43%
Mid-Stream 1.107 1.19 1.01 0.091 8.22%
Downstream 1.505 2.02 1.02 0.411 27.31%
46. 46
APPENDIX H ( Statistical Summary of the Overall Data)
Mean Median Mean
Deviation
Variance Standard
Deviation
Skewness
1.49 1.44 1.9989 0.1999 0.44 0.34