The Developer Swiss Knife: Troubleshooting
Tools for Java EE Applications
Assumptions
•This presentation aims experienced developers
with a little (but good) knowledge about how the
JVM works
•The presentation focus only on the tools, not on
the troubleshooting methods
•Some of the tools are only for Linux. Windows
users, get out! =P
•All tools presented in this presentation are Open
Source projects and some of them are
developed by JBoss
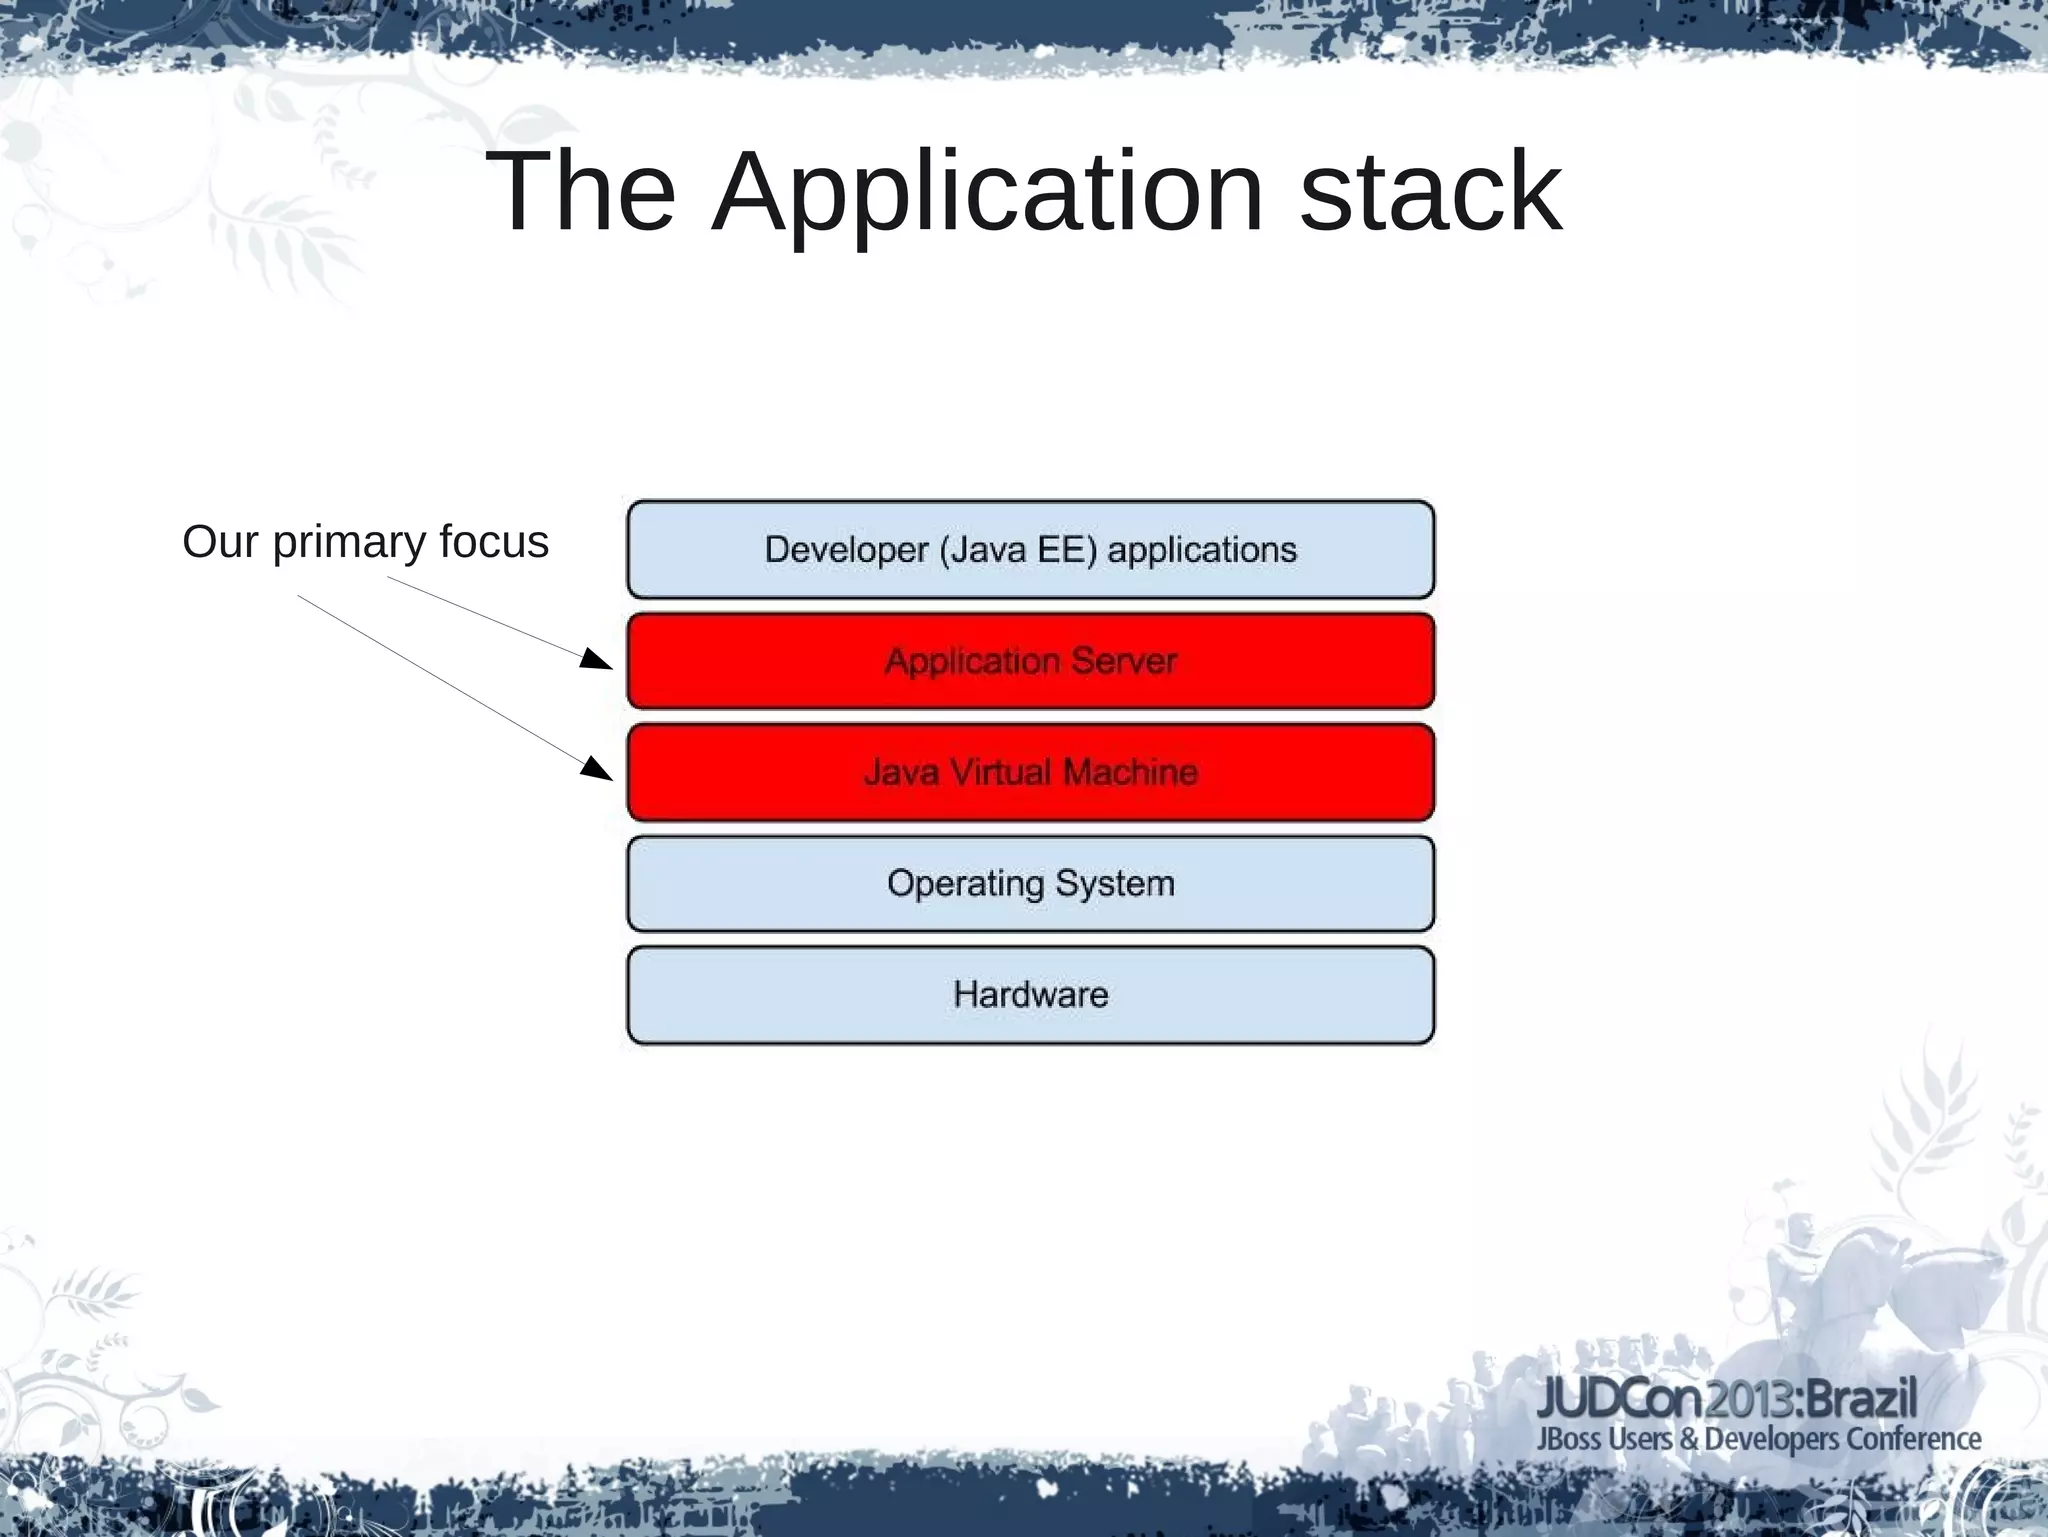
The Application stack
Our primary focus
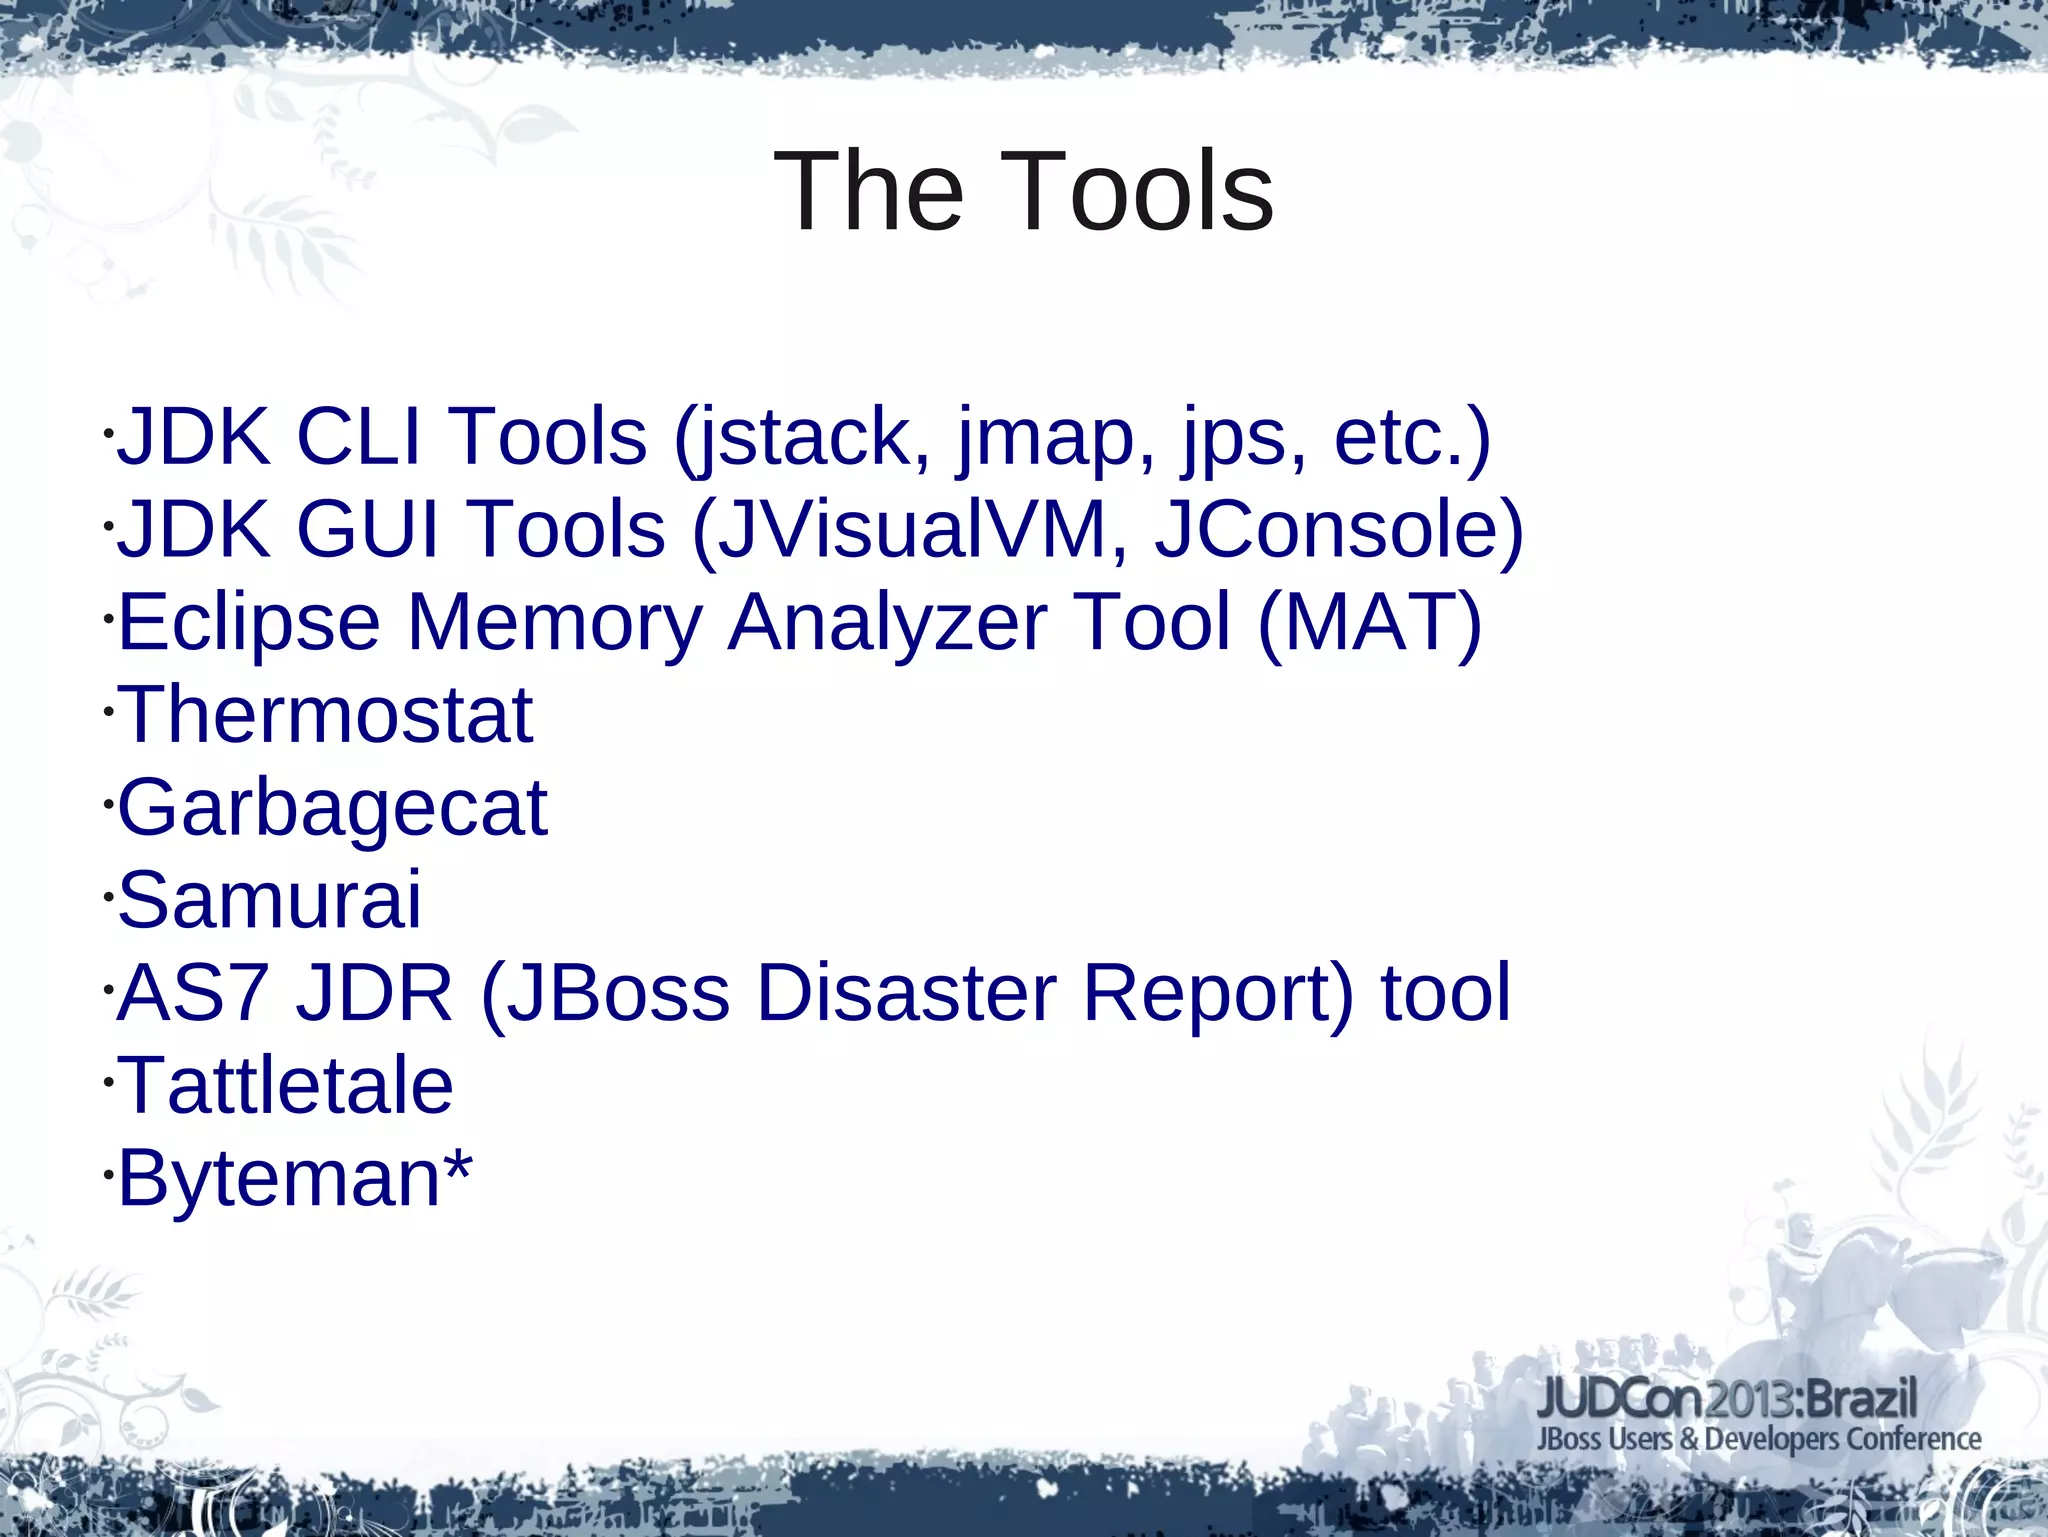
The Tools
•JDK CLI Tools (jstack, jmap, jps, etc.)
•JDK GUI Tools (JVisualVM, JConsole)
•Eclipse Memory Analyzer Tool (MAT)
•Thermostat
•Garbagecat
•Samurai
•AS7 JDR (JBoss Disaster Report) tool
•Tattletale
•Byteman*
JDK has its own troubleshooting tools
● jps
● jmap
● jinfo
● jhat
● jstack
Some of them are Graphical
● JConsole
● JVisualVM
What should I do when my application has a
memory problem?
Generating a Heap Dump
● -XX:-HeapDumpOnOutOfMemoryError
● jmap
● JVisualVM
Ok, I have a Heap Dump. Now can I analyze it?
Meet Eclipse MAT
What should I do if my application have a CPU
problem? e.g. High CPU consumption
Generating a Thread Dump
● jstack
● kill -3
● AS7 CLI command:
– /core-service=platform-
mbean/type=threading:dump-all-threads(locked-
monitors=true,locked-synchronizers=true)
Now with a Thread Dump, what should I do with
it?
Samurai – A Thread Dump viewer
High CPU consumption can be high GC activity
Enabling GC Logging
● Add to java command:
-XX:+PrintGC -Xloggc:gc.log -XX:+PrintGCDetails
-XX:+PrintGCTimeStamps
GC Log content
3.122: [GC 132096K->24592K(504320K), 0.0321910 secs]
4.558: [GC 156688K->26752K(504320K), 0.0340520 secs]
6.609: [GC 158848K->50117K(504320K), 0.0628430 secs]
7.077: [GC 80334K->54921K(504320K), 0.0416730 secs]
7.119: [Full GC 54921K->46716K(504320K), 0.2522170 secs]
8.510: [GC 178812K->60924K(504320K), 0.0190690 secs]
9.683: [GC 193020K->69447K(461696K), 0.0308020 secs]
Garbagecat
java -jar garbagecat-1.0.0.jar --help
usage: garbagecat [OPTION]... [FILE]
-h,--help help
-o,--options <arg> JVM options used during JVM run
-p,--preprocess preprocessing flag
-s,--startdatetime <arg> JVM start datetime (yyyy-MM-dd HH:mm:ss,SSS)
for converting GC logging timestamps to datetime
-t,--threshold <arg> threshold (0-100) for throughput bottleneck
reporting
Garbagecat report
========================================
Throughput less than 90% for PARALLEL_SCAVENGE
========================================
18020.492: [GC [PSYoungGen: 161888K->1376K(166016K)] 949359K->789159K(1214592K), 0.0294550 secs]
...
========================================
SUMMARY:
========================================
# GC Events: 46044
GC Event Types: PARALLEL_SCAVENGE, PARALLEL_SERIAL_OLD
Max Heap Space: 1566912K
Max Heap Occupancy: 1562164K
Max Perm Space: 77864K
Max Perm Occupancy: 46645K
Throughput: 99%
Max Pause: 4098 ms
Total Pause: 1703657 ms
First Timestamp: 4616 ms
Last Timestamp: 232465068 ms
========================================
0 UNIDENTIFIED LOG LINE(S):
Applications also might have classloading
problems
Tattletale
JBoss AS7 has JDR
Wait a minute! I tried to run jvisualvm in OpenJDK
and it says “command not found”
Thermostat – The next heat
Please Remember
● Don't develop applications without make use
of testing approaches (unit, integration,
functional, ...)
● Although all testing efforts, there is no 100%
bug free applications
● For all unpredictable and complex problems,
this presentation will help you troubleshoot, if
not all, most of the problem
The links
● http://icedtea.classpath.org/wiki/Thermostat
● http://eclipse.org/mat/
● http://yusuke.homeip.net/samurai/en/index.html
● https://code.google.com/a/eclipselabs.org/p/garbagecat/
● http://docs.oracle.com/javase/7/docs/index.html
● http://www.jboss.org/tattletale
● http://jboss.org/byteman
Twitter: @rimolive
http://aprendendo-cloud-computing.blogspot.com
Thank you!
What about Byteman?
Race Condition Tests with Byteman
Flávia Rainone
Don't miss it!

Jud con presentation_brazil

  • 2.
    The Developer SwissKnife: Troubleshooting Tools for Java EE Applications
  • 3.
    Assumptions •This presentation aimsexperienced developers with a little (but good) knowledge about how the JVM works •The presentation focus only on the tools, not on the troubleshooting methods •Some of the tools are only for Linux. Windows users, get out! =P •All tools presented in this presentation are Open Source projects and some of them are developed by JBoss
  • 4.
  • 5.
    The Tools •JDK CLITools (jstack, jmap, jps, etc.) •JDK GUI Tools (JVisualVM, JConsole) •Eclipse Memory Analyzer Tool (MAT) •Thermostat •Garbagecat •Samurai •AS7 JDR (JBoss Disaster Report) tool •Tattletale •Byteman*
  • 6.
    JDK has itsown troubleshooting tools ● jps ● jmap ● jinfo ● jhat ● jstack
  • 7.
    Some of themare Graphical ● JConsole ● JVisualVM
  • 8.
    What should Ido when my application has a memory problem?
  • 9.
    Generating a HeapDump ● -XX:-HeapDumpOnOutOfMemoryError ● jmap ● JVisualVM
  • 10.
    Ok, I havea Heap Dump. Now can I analyze it?
  • 11.
  • 12.
    What should Ido if my application have a CPU problem? e.g. High CPU consumption
  • 13.
    Generating a ThreadDump ● jstack ● kill -3 ● AS7 CLI command: – /core-service=platform- mbean/type=threading:dump-all-threads(locked- monitors=true,locked-synchronizers=true)
  • 14.
    Now with aThread Dump, what should I do with it?
  • 15.
    Samurai – AThread Dump viewer
  • 16.
    High CPU consumptioncan be high GC activity
  • 17.
    Enabling GC Logging ●Add to java command: -XX:+PrintGC -Xloggc:gc.log -XX:+PrintGCDetails -XX:+PrintGCTimeStamps
  • 18.
    GC Log content 3.122:[GC 132096K->24592K(504320K), 0.0321910 secs] 4.558: [GC 156688K->26752K(504320K), 0.0340520 secs] 6.609: [GC 158848K->50117K(504320K), 0.0628430 secs] 7.077: [GC 80334K->54921K(504320K), 0.0416730 secs] 7.119: [Full GC 54921K->46716K(504320K), 0.2522170 secs] 8.510: [GC 178812K->60924K(504320K), 0.0190690 secs] 9.683: [GC 193020K->69447K(461696K), 0.0308020 secs]
  • 19.
    Garbagecat java -jar garbagecat-1.0.0.jar--help usage: garbagecat [OPTION]... [FILE] -h,--help help -o,--options <arg> JVM options used during JVM run -p,--preprocess preprocessing flag -s,--startdatetime <arg> JVM start datetime (yyyy-MM-dd HH:mm:ss,SSS) for converting GC logging timestamps to datetime -t,--threshold <arg> threshold (0-100) for throughput bottleneck reporting
  • 20.
    Garbagecat report ======================================== Throughput lessthan 90% for PARALLEL_SCAVENGE ======================================== 18020.492: [GC [PSYoungGen: 161888K->1376K(166016K)] 949359K->789159K(1214592K), 0.0294550 secs] ... ======================================== SUMMARY: ======================================== # GC Events: 46044 GC Event Types: PARALLEL_SCAVENGE, PARALLEL_SERIAL_OLD Max Heap Space: 1566912K Max Heap Occupancy: 1562164K Max Perm Space: 77864K Max Perm Occupancy: 46645K Throughput: 99% Max Pause: 4098 ms Total Pause: 1703657 ms First Timestamp: 4616 ms Last Timestamp: 232465068 ms ======================================== 0 UNIDENTIFIED LOG LINE(S):
  • 21.
    Applications also mighthave classloading problems
  • 22.
  • 23.
  • 24.
    Wait a minute!I tried to run jvisualvm in OpenJDK and it says “command not found”
  • 25.
  • 26.
    Please Remember ● Don'tdevelop applications without make use of testing approaches (unit, integration, functional, ...) ● Although all testing efforts, there is no 100% bug free applications ● For all unpredictable and complex problems, this presentation will help you troubleshoot, if not all, most of the problem
  • 27.
    The links ● http://icedtea.classpath.org/wiki/Thermostat ●http://eclipse.org/mat/ ● http://yusuke.homeip.net/samurai/en/index.html ● https://code.google.com/a/eclipselabs.org/p/garbagecat/ ● http://docs.oracle.com/javase/7/docs/index.html ● http://www.jboss.org/tattletale ● http://jboss.org/byteman Twitter: @rimolive http://aprendendo-cloud-computing.blogspot.com
  • 28.
  • 29.
  • 30.
    Race Condition Testswith Byteman Flávia Rainone Don't miss it!