Download as PDF, PPTX

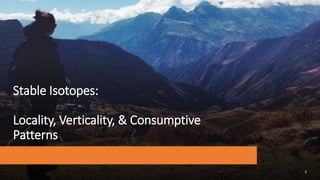
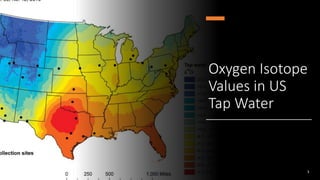
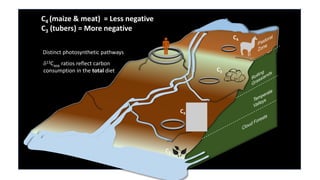
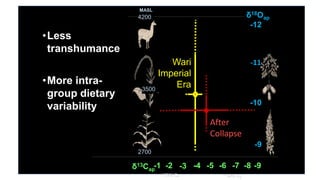
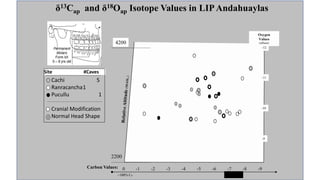
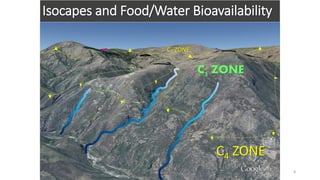
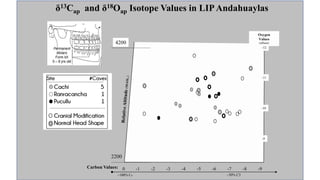
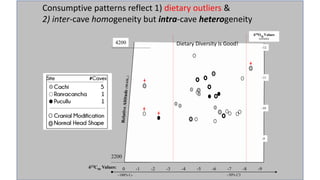

This document summarizes research using stable isotope analysis of human remains from the Andes mountains. It finds that oxygen isotope values reflect the elevation and climate of where individuals lived, with higher, drier areas having more negative values. Carbon isotope values distinguish between C3 plants like tubers and C4 plants like maize and meat, with more negative values indicating more C3 consumption. Results show high consumption of C4 foods at higher elevations and more mixed C3 and C4 diets at lower elevations. Patterns within and between cave sites also reveal some dietary outliers but overall homogeneity between caves and heterogeneity within caves.


