The document explains how to determine the phase difference between two graphs at a given point. It defines phase as where a wave is in its cycle and phase difference as the difference in phases of two waves at a point. It then shows that at the given point, the green graph has a phase of 3π/2 and the purple graph has a phase of 2π, so the phase difference, found by taking the difference between the phases, is π/2.
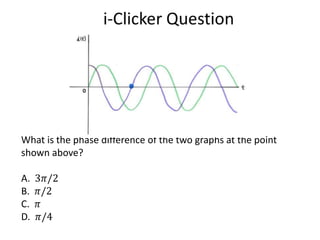
1. What is the phase difference of the two graphs at the point
shown above?
A. 3𝜋/2
B. 𝜋/2
C. 𝜋
D. 𝜋/4
2. Correct Answer: B
In order to answer this question, one must
understand the definition of the terms “phase” and
“phase difference” . “Phase” refers to where in the
cycle of a wave we are looking at, hence the “phase”
of that wave. The phase difference is the difference
in phase of two (or more) graphs at a given point.
Let’s take a look at the example above.
3. The green graph represents a normal sine graph. The purple
graph is a shifted sine graph. Start by labelling points on each
graph as shown below for one period.
4. At the blue point, we can see that the green graph is at phase 3𝜋/2
while the purple graph is at phase 2𝜋. Now, we take the difference
between these two phases to determine the phase difference of the
two graphs. We get
Phase difference = 2𝜋 - 3𝜋/2 = 𝜋/2
This phase difference applies to any given point on the two graphs!