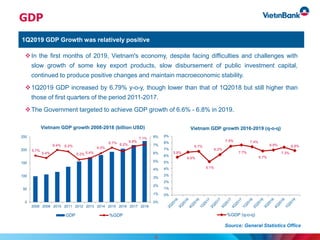
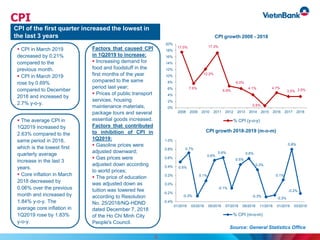
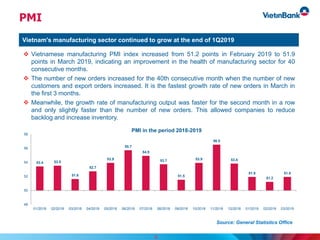
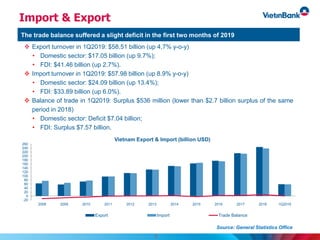
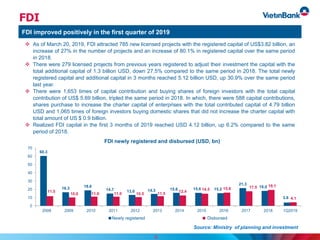
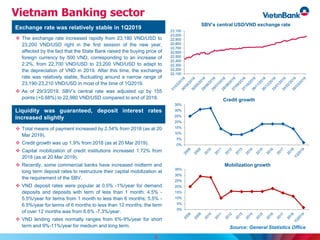
The document provides an overview of Vietnam's macroeconomic conditions and banking sector in the first quarter of 2019. Key points include GDP growth of 6.79% year-over-year in 1Q2019, CPI increasing at its lowest rate in three years at 2.63%, and PMI indicating continued growth of Vietnam's manufacturing sector. Exports increased 4.7% while imports rose 8.9%, resulting in a small trade surplus. FDI inflows also improved positively. The banking sector saw stable exchange rates and adequate liquidity, with deposit interest rates rising slightly. The presentation then provides details on VietinBank, including its leadership, strong capital position, extensive network, and investment highlights.
VietinBank IR Presentation_Reviewed 1H2019ngothithungan1
The document is a presentation for 1H2019 that provides an overview of Vietnam's macroeconomic environment and banking sector, as well as general information about VietinBank. Some key points include:
- GDP and CPI growth were lower in 2Q2019 compared to the same period last year, but PMI and import/export turnover reached their highest levels for the first half of the year.
- The banking sector saw stable exchange rates, guaranteed liquidity, and credit growth of over 7%.
- VietinBank is one of Vietnam's leading banks, with a strong governance structure and network of domestic and international branches. The presentation highlights its solid performance and investment potential.
The document is a presentation for 1H2019 covering macroeconomic trends in Vietnam and an overview of VietinBank. It discusses GDP growth, inflation, manufacturing activity, trade levels, FDI and the banking sector environment. For VietinBank specifically, it provides details on its history, governance structure, organizational structure and highlights its large capital base, extensive branch network, strong brand and client base, and shareholder structure which includes the State Bank of Vietnam.
This document provides an overview and highlights of VietinBank for 2018. Key points include:
- Vietnam's GDP growth reached 7.08% in 2018, the highest since 2008, while inflation was 3.54%, below the target. FDI disbursement improved to $19.1 billion.
- VietinBank is Vietnam's largest bank by total assets and equity. It has a network of 155 branches and 958 transaction offices nationally plus international expansion.
- Investment highlights of VietinBank include its strong shareholders including the State Bank of Vietnam, solid infrastructure and human resources, leading market shares, and large scale in terms of assets and equity.
The document is a presentation by VietinBank providing an overview of the macroeconomic environment in Vietnam in Quarter 1 of 2018 as well as highlights of VietinBank's performance and strategy. Some key points:
- Vietnam's GDP growth was 7.38% in Q1 2018, the highest in 10 years, driven by exports and manufacturing. Inflation remained low at around 0.5% quarter-on-quarter.
- VietinBank maintained its leading position in the banking sector with over 12% market share in loans and 11% in deposits. Its total assets exceeded $45 billion.
- Notable highlights for VietinBank included strong financial results in Q1 2018, an experienced management team, and
The document is a presentation for 1H2018 that provides an overview of Vietnam's macroeconomic environment and banking sector, as well as general information about VietinBank. It discusses GDP growth reaching its highest level since 2011 at 7.08% in 1H2018. Inflation increased slightly to 3.29% while the PMI continued rising. Imports and exports saw trade deficits return in May and June after prior surpluses, and FDI tended to decrease in 1H2018. VietinBank is Vietnam's largest bank by total assets and equity, with a nationwide network and strong shareholders including the State Bank of Vietnam. The presentation highlights VietinBank's market leadership, solid performance in 1H2018, and effective human
This document is an IR presentation for 3Q2018 that provides an overview of Vietnam's macroeconomic environment and banking sector, as well as information about VietinBank. The presentation discusses Vietnam achieving its highest GDP growth since 2011 in 3Q2018 at 6.88% YoY. Inflation was up 3.57% YoY for 3Q2018 while the PMI fell for the third straight month to 51.5, indicating slowing manufacturing growth. Exports were up 15.4% for the first 9 months of 2018 while imports rose 11.8%, resulting in a trade surplus. FDI registrations decreased 3% YoY in 3Q2018 but disbursements rose 6%. The USD/VND exchange
The document discusses Mongolia's economic reforms and positive outlook. It notes that despite falling foreign direct investment, Mongolia has maintained macroeconomic stability with low inflation, a reduced current account deficit, and a trade surplus. The economy is moving towards a "new equilibrium" with balanced external payments. Several major investment projects and agreements with countries like Japan, India, and China will support growth going forward as Mongolia shifts from consumption to savings-based growth and prudent fiscal reforms.
This document summarizes the IMF's 2015 Article IV consultation with China. It includes the IMF staff report on China's economic developments and policies, as well as statements by IMF executive directors. The staff report finds that China is transitioning to slower but more sustainable growth, and has made progress on external rebalancing through a smaller current account surplus and renminbi appreciation. However, vulnerabilities remain from high debt and real estate investment. The executive directors agree more work is needed to reduce vulnerabilities while avoiding too sharp an economic slowdown, through continued reforms and calibrated macroeconomic policies.
The document summarizes recent economic trends in Mongolia. It notes that GDP growth slowed to 7.8% in 2014 from higher growth in previous years, due to a drop in foreign direct investment and monetary tightening in response to inflationary pressures. Inflation remained high at around 12.8% for the year while the current account deficit persisted. Fiscal deficits also remained elevated. Growth is forecast to further slow to 3.0% in 2015 and then recover slightly to 5.0% in 2016, while inflation moderates, as monetary and fiscal policy are tightened to address economic imbalances.
Georgia's economy faced negative shocks in 2008 from the Russia-Georgia war and the global economic crisis, hurting foreign investment. From 2008-2011, Georgia received $4.5 billion in international aid. Despite challenges, certain sectors saw significant growth, such as financial intermediation and electricity. However, GDP growth was driven more by consumption than investment and exports. The trade deficit widened as imports grew faster than exports in the first quarter of 2011. Foreign direct investment also increased compared to 2009-2010, focusing on industries like mining and manufacturing.
According to our opinion 2018 is going to be a crucial pivot year that will define Greek economic standards for the years to come.
In some respects 2018 can be characterized as a “low risk” year with no new fiscal measures to be enacted and very low debt redemptions which minimizes the refinancing risk of the Greek Sovereign.
At the same time though 2018 is also a “decisions time” as a number of very significant issues - that up to now have been postponed - have to be decided. The agenda includes the debt sustainability / restructuring issue, the conclusion of 4th review, the precautionary line / cash buffer decision as well as the post-program monitoring process.
Nordic interconnectedness and indebted households a risk to financial stabilitySuomen Pankki
The presentation by Marja Nykänen, a member of the Board of the Bank of Finland, on the press conference of the Bank of Finland Bulletin publication, May 10, 2017
Indonesia strategy 2018 - many risks,few rewardsBambang Muliyadi
The report provides an analysis and outlook for Indonesian equities in 2018, setting a target of 6,500 for the JCI index, representing 8% upside. Key points:
- EPS growth is forecast at 13.5% for 2018, allowing for a target P/E multiple that represents a moderate de-rating from current levels.
- Valuations are elevated against historical standards, limiting upside potential absent an improvement in fundamentals. Stock picking will be important to outperform given risks.
- The terms of trade outlook is flat, limiting real GDP growth potential to around 5%, while policy rate hikes could pose a risk to valuations dependent on low sovereign yields.
- Consumption
Eurojatalous 3/2017: Juha Kilponen, Outlook for the Finnish economy 2017-2019...Suomen Pankki
The document provides an economic outlook for Finland from 2017 to 2019 from the Bank of Finland. It finds that:
1) Finland's economy is expected to strengthen over this period as global economic growth improves export demand and domestic demand grows.
2) GDP growth is projected to be 1.6% in 2017, 1.5% in 2018, and 1.3% in 2019, finally surpassing pre-crisis levels.
3) Exports are forecasted to join private consumption in supporting stronger growth over this period, growing 3.9% in 2017 after several years of weak growth.
The document provides an economic outlook and summary of key markets for May 2014. It discusses expectations for the upcoming general election in India and implications for various asset classes. The equity outlook remains positive on expectations that a reform-oriented government will accelerate the economy and revive the growth and earnings cycle. The document recommends overweight positions in healthcare, IT/ITES, banking, energy, and neutral stances on power utilities and automobiles.
This document summarizes Mongolia's recent macroeconomic conditions and banking sector trends. It notes that Mongolia's GDP growth has slowed in recent years due to weak commodity prices and currency depreciation. The banking sector has seen rapid growth in loans and deposits but this growth has now stopped. Non-performing loans have risen due to the economic downturn and now stand at 7% of total loans. Several initiatives have recently been implemented to strengthen Mongolia's financial sector regulations and governance.
The new government needs to
- The global investment climate became moderately positive in February, with the outlook on India improving considerably due to deteriorating fundamentals in other emerging markets.
restart the programme in a big way
- Quarterly company results surprised positively against the deteriorating macro scenario. It remains to be seen if this marks a turnaround or short-term improvements.
to meet its fiscal deficit targets and
- Going into March, equities may rally on expectations of a pro-reform government after elections. However, the market will be highly sensitive to the
1) The document provides an annual assessment of the stability of the Finnish financial system and risks to financial stability. It discusses concerns about weak global economic growth, uncertainties in financial markets, and ongoing financial regulatory reforms in Europe.
2) The Finnish financial sector is not currently facing cyclical threats, but vulnerabilities like rising indebtedness need monitoring. The banking sector remains sound, though profitability is declining due to low interest rates.
3) While macroprudential indicators do not currently signal risks, household debt is growing and structural vulnerabilities like a concentrated banking sector exist, requiring authorities to remain vigilant and prepared to respond if risks increase.
China aims to transition to a more sustainable growth model focused on domestic consumption and services. Strong investment and exports previously drove rapid GDP growth but this model is no longer viable due to overcapacity and weak global demand. Recent reforms accelerated under new leadership in 2013 aim to open markets, increase private sector involvement and liberalize financial markets. Growth is expected to slow gradually as reforms are implemented but will remain above 7% in 2014-2015 due to government stimulus measures. Lower growth, rising debt, pollution and corruption present medium-term challenges alongside risks from a potential slowdown in the property sector.
The document provides an analysis of the state of the Bangladesh economy in Fiscal Year 2015. Some key points:
- Economic growth fell short of ambitious targets in FY13 and FY14. Private investment remained sluggish.
- In FY15, GDP growth is projected to be 6.5%, below the target of 8%. Revenue collection and private investment face challenges.
- Inflation stabilized at a lower level but food inflation remains high. The balance of payments showed some pressure.
- Private investment in major sectors like manufacturing and services has not picked up as expected in the post-election year. Import of machinery increased but the sustainability of this trend is uncertain.
GDP growth in India picked up to 7.9% in Q1 2016 driven by private and public consumption, while exports contracted and investment growth deteriorated. Overall growth for FY2015/2016 was 7.6%. Private consumption will remain strong but sluggish investment growth and reluctance of banks to provide new credit are causes for concern. Euler Hermes expects GDP growth to stabilize at 7.6% in FY2016/2017.
Macroeconomics Performance of Bangladesh since IndependenceIsrat Jahan
1) The document is a term paper analyzing the macroeconomic performance of Bangladesh since independence. It examines key indicators such as GDP growth, sectoral contributions, consumption, investment, savings, inflation trends, and conclusions.
2) The paper finds that while Bangladesh has made progress, growth could have been higher if the labor force was utilized more efficiently. GDP growth has averaged around 6-7% annually with steady reductions in poverty.
3) Inflation has generally been high and food-driven. The paper recommends increasing direct taxation through identifying new taxpayers and maintaining money supply growth consistent with commodity growth to control inflation.
The overall economic condition of bangladeshTanvir777
This document provides an overview of the economic condition of Bangladesh in fiscal year 2011-12. It discusses macroeconomic indicators such as GDP growth, inflation, trade balance, budget deficit, and public debt. Key points include:
- GDP growth target is 7% for FY 2011-12, with projections of 6.82% growth under a business as usual scenario.
- Inflation target is 7.5% while the rate in November 2011 was 10.51%.
- The budget deficit is projected to be 402.66 billion taka, with domestic and foreign borrowing estimated at 272.08 billion and 130.58 billion respectively.
- Foreign exchange reserves declined to USD 9285.20 million in November
This document from the Russian Ministry of Finance presents data and analysis on the Russian economy and fiscal policy. It shows that Russia has a relatively low public debt as a percentage of GDP compared to other countries. The fiscal rule introduced in 2013 has helped maintain a budget surplus even with lower oil prices. GDP growth is expected to pick up in the next 18 months as investment projects progress and domestic demand strengthens. Federal and regional budgets for the first 10 months of 2014 saw increased revenues and a higher surplus compared to the same period in 2013.
Assignment on Current Economic ConditionsAnurag Verma
This document is an assignment submitted by students for their MBA program. It contains summaries of key economic concepts related to growth and inflation in India. The assignment discusses issues like stagflation, nominal vs real GDP, the Index of Industrial Production (IIP), and how inflation is measured using the Consumer Price Index (CPI) and Wholesale Price Index (WPI). The students analyze factors influencing India's current economic environment of high inflation and low growth.
The document is an IR presentation for 2Q2019 that provides an overview of Vietnam's macroeconomic environment and banking sector, as well as general information about VietinBank. It discusses GDP growth, CPI, PMI, import/export levels, FDI trends, and exchange rates. It notes GDP growth was lower in 2Q2019 than the previous year but higher than 2011-2017. Inflation increased but was controlled. The manufacturing PMI index reached its highest level for 1H2019 in June. Total import-export turnover reached a record high. FDI continued to prosper in 1H2019. The exchange rate rose in May and decreased in June. The banking sector saw guaranteed liquidity and stable interest rates.
The document is an IR presentation that provides an overview of Vietnam's macroeconomics, banking sector, and highlights of VietinBank. It discusses Vietnam achieving its highest GDP growth in 9 years and inflation being controlled at a low level. Export and import turnover reached record surpluses while FDI continued to prosper. The banking sector saw guaranteed liquidity and slightly higher deposit rates. The presentation then provides details on VietinBank, including its strong governance structure and organizational setup, as well as investment highlights such as its large charter capital, network, brand, and shareholder base.
- The Vietnamese economy performed strongly in the first half of 2016 despite missing the GDP growth target, with consumption, investment, and trade numbers all being high.
- Inflation is expected to return to moderate levels in 2016, pushing the VN-Index stock market higher but potentially beyond fair valuation.
- While the GDP target will be difficult to reach, domestic demand and FDI inflows are forecasted to remain robust, supporting overall economic growth.
Colliers Vietnam Q1 2014 Investment Report: Read and follow the top economic indicators for Vietnam, M&A activity, and major developments in finance, banking, and legal. Published Monthly with contribution from LNT & Partners Law Firm.
Read and follow the top economic indicators for Vietnam, M&A activity, and major developments in finance, banking, and legal. Published Monthly with contribution from LNT & Partners Law Firm.
This document provides an economic overview and investment highlights for Vietnam in Q4 2015. Key points include:
- Vietnam's GDP grew at 6.68% in 2015, driven by growth in industry and construction. Inflation was 0.63% and is forecast to be around 4% in 2016.
- Retail sales increased 9.5% year-over-year in 2015, led by goods sales. Foreign direct investment flows into Vietnam remained strong.
- The State Bank of Vietnam lowered dollar deposit interest rates and may adjust the currency exchange rate due to trade deficits and pressure from China. Overall credit growth was 17.02% in 2015.
VietinBank's business results continued to grow positively in 9M2021. Some key highlights include:
- Total assets grew 7.9% year-to-date, while credit exposure and customer deposits increased 6.3% and 8.3% respectively.
- Profit before tax was up 34.2% year-over-year to VND 13,911 billion in 9M2021.
- Non-performing loans remained under control at 1.67% as of the end of 3Q2021, and the debt coverage ratio improved to 118.6%.
- Capital structure shifted positively with increased deposits from retail and SME customers, helping to optimize funding costs.
VietinBank provided an investors update covering 3Q2020 and 9M2020 performance. Key highlights included:
- Vietnam's economy is forecast to grow 2-3% in 2020 despite challenges from COVID-19. Credit growth was improving in September.
- VietinBank has a strong brand, extensive domestic and international network, and support from major shareholders State Bank of Vietnam and MUFG.
- In 3Q2020 and 9M2020, VietinBank saw growth in key metrics like deposits, loans, and digital adoption despite economic headwinds.
CTG - Cap nhat KQKD Quy I.2022_final -ENG_V1.pptxngothithungan1
1) Major scale indicators of VietinBank in 1Q2022 grew positively both year-to-date and year-over-year, with total assets increasing 8.6% YTD.
2) Credit continued its growth trend, increasing 8.8% YTD, while non-performing loans were well contained at 1.25%.
3) Total operating income in 3M2022 reached 14.1 trillion VND, an 8.9% increase year-over-year, with strong growth in net income from FX trading activities.
1) Major scale indicators of VietinBank in 1Q2022 grew positively both year-to-date and year-over-year, with total assets increasing 8.6% YTD.
2) Credit continued its growth trend, increasing 8.8% YTD, while non-performing loans were well controlled at 1.25%.
3) Total operating income in 3M2022 reached 14.1 trillion VND, an 8.9% increase year-over-year, with strong growth in net income from FX trading activities.
CTG_Investor Business Update 2Q2021 and 6M2021ngothithungan1
VietinBank's business results in 2Q2021 & 6M2021 continued to grow steadily with business efficiency increasing more than scale. Total assets grew 9.8% year-to-date to VND 1,473 trillion. Total income increased 19.7% to VND 27,006 billion for the first half of 2021. Profitability improved with ROA reaching 1.6% and ROE reaching 19.7%. Credit exposure grew 10.5% year-to-date to VND 1,084 trillion while maintaining asset quality with the NPL ratio at 1.34%.
Macroeconomic forecast and monetary policy updateRuslan Sivoplyas
The document provides a macroeconomic forecast and update on monetary policy for Ukraine. It summarizes key indicators for 2018-2021, including real GDP growth of 2.5% in 2019 slowing from 3.3% in 2018 before picking up in future years. Inflation is forecast to remain around the 5% target. Fiscal policy will continue to be restrained with the budget deficit around 1.5% of GDP. The current account deficit is projected to remain in the 3-4% range despite counterbalancing domestic and external factors. Monetary policy has been tight but began easing in 2019 to ensure hitting inflation targets while monetary conditions ease over the forecast horizon.
AFC Vietnam Fund Presentation 2015.04.09Thomas Hugger
- The document provides an overview of the AFC Vietnam Fund, including its objectives, opportunities in Vietnam, fund performance and contact information.
- Vietnam's economy is growing over 6% annually and offers compelling valuations compared to regional peers. The country benefits from competitive labor costs, increasing education levels, and strong foreign direct investment and remittances.
- The AFC Vietnam Fund aims to capture growth in Vietnam, especially small-medium companies. Since inception in December 2013, it has achieved a return of over 37%.
AFC Vietnam Fund Presentation 10.7.2018Thomas Hugger
The document provides information on the AFC Vietnam Fund, a fund focused on capturing growth in Vietnam. It summarizes that Vietnam's economy is growing at over 6% annually and attracting strong foreign investment. The fund aims to achieve capital appreciation over the next 3-5 years by investing in undervalued small and medium companies across various sectors in Vietnam through a bottom-up stock selection process. Since inception in 2013, the fund has achieved a return of 80.04% and its net asset value as of June 2018 was $1,800.40.
CTG - Cap nhat KQKD Quy IV.2022_Final_EN.pptxngothithungan1
The document summarizes VietinBank's business performance and results for 2022. Major highlights include:
- Total assets reached 1,809 trillion VND, an 18.1% increase year-to-date. Loans to customers grew 12.7% to 1,275 trillion VND.
- Pre-tax profit was 21.1 trillion VND, a 20% increase year-over-year, driven by 15% growth in net interest income.
- Customer deposits increased 7.5% to 1,249 trillion VND, with retail and SME deposits growing as a proportion of the total.
- Non-performing loans provisioning increased 31.5% to 24.2 trillion
INFOGRAPHIC: Consumer Finance in Vietnam - First-Half 2020 ReviewFiinGroup JSC
For the first time in a decade, Vietnam consumer finance market experienced a single-digit growth rate (9.2% YoY in the first half of 2020), following aggressive credit growth over the past few year. This is attributed to the dual challenge posed by COVID-19 pandemic and tightening regulations on cash loans disbursement prescribed at Circular 18/2019. However, despite the modest growth rate, Vietnam consumer finance maintained a contribution of over 20% of the country loan book.
Following the Government’s implementation of effective COVID-19 containment measures, in the first half of 2020, Vietnam economy witnessed GDP growth falling to 1.81%, the lowest first-half growth for the last 10 years. The pandemic has disrupted global trade and supply chains leading to deterioration in corporate earnings and individual income, which eventually weakens credit demand and asset quality of the banking sector in Vietnam.
Access to our FULL REPORT: http://fiinresearch.vn/Reports/2125D-vietnam-banking-report-2020-.html
In this Banking Report 2020, we provide in-depth analysis of the impact of COVID-19 on every aspect of the banking sector and individual banks, including credit growth, asset quality, earning quality, liquidity, profitability, and operation efficiency. Development trends and regulations in response to the pandemic are also covered.
AFC Vietnam Fund: presentation 07.08.2020Thomas Hugger
- The document provides an executive summary, investment strategy, and performance summary for the AFC Vietnam Fund, an open-end fund that invests in undervalued listed Vietnamese equities.
- The fund sees opportunities for capital appreciation over the next 3-5 years based on Vietnam's strong GDP growth, increasing foreign investment, and attractive stock valuations compared to regional markets.
- The investment strategy focuses on fundamental bottom-up stock selection across various sectors, with risk controls like diversification and position limits. The fund held over 60 stocks as of July 2020 and has outperformed the VN Index since inception.
The document is an IR presentation that provides an overview of Vietnam's macroeconomics and banking industry environment (Section 1), general information about VietinBank including its mission, vision, awards, and organizational structure (Section 2), highlights of VietinBank as an investment including its innovation, network, shareholders, technology, and customer base (Section 3), and VietinBank's financial performance in 2019 (Section 4). Key points include stable macroeconomic growth in Vietnam, improved profitability and asset quality in the banking sector, VietinBank's extensive domestic and international network, support from major shareholders MUFG and SBV, advanced technology platform, and stable funding and credit growth with improved profitability for VietinBank in 2019.
The document is an IR presentation that provides an overview of Vietnam's macroeconomic environment and banking industry in the first section. It then discusses VietinBank specifically, including its mission/vision, organizational structure, investment highlights, and 2019 performance. Key points covered include stable macroeconomic growth in Vietnam, improvements in the banking industry's profitability and asset quality, VietinBank's extensive network and support from major shareholders, and its stable funding growth and improved profitability in 2019.
CTG-Cap nhat ket qua KD Quy 4.2023_final_EN.pptxngothithungan1
VietinBank achieved strong financial results in FY2023, with total assets growing 12.4% and loans to customers up 15.6%. Net profit before risk provisions increased 11.8% while provision expenses grew 5.6%, resulting in an 18.8% rise in pre-tax profit. Customer deposits expanded 12.9% amid impressive CASA growth. Credit quality improved with the NPL ratio down to 1.13% and the NPL coverage ratio at 167.2%. The bank will focus on priority sectors and retail/SME lending in FY2024 while maintaining risk discipline.
CTG-Cap nhat ket qua KD quy 2.2023_EN_Final.pptxngothithungan1
Business performance in 1H2023 achieved positive results. Total assets grew 2.9% to VND 1,860 trillion driven by a 6.6% increase in loans to customers. Net profit before risk provisions was VND 25.7 trillion, up 17.4% YoY. Customer deposits increased 4.9% with a shift toward retail. Loan growth focused on retail and FDI segments. Non-interest income rose 28.8% and net interest income excluding guarantee fees grew 14.4%. NPL ratio was managed at 1.27% and debt coverage ratio was 168.9%.
CTG-Cap nhat ket qua KD quy 1.2023_final_EN_31.05.2023.pptxngothithungan1
- Loan balances grew 4.6% year-to-date in 1Q2023, driven by large corporate and FDI customers. Retail loans slightly decreased.
- Total assets increased 0.9% year-to-date. Net interest income grew 24.8% and net fee income grew 52% year-over-year, contributing to a 21% rise in total operating income.
- Non-performing loans rose to 1.28% of total loans and credit risk provisions increased 51.9% year-over-year to prepare for potential future risks. Profit before tax was up 2.7% year-over-year.
CTG-Cap nhat ket qua KD quy 1.2023_final_EN_Final.pptxngothithungan1
The document provides details on VietinBank's business performance in 1Q2023. Key highlights include:
- Total assets reached 1,824 trillion VND, up 0.9% YTD, with loans to customers up 4.6% YTD.
- Total income was 17 trillion VND, up 21% YoY, driven by increases in net interest income and net fee income.
- Customer deposits increased 1.9% YTD to 1,272 trillion VND, with retail deposits growing strongly.
- Loans to customers increased 4.6% YTD to 1,333 trillion VND, concentrated in large corporate and FDI sectors.
- Non-performing
CTG - Cap nhat KQKD Quy III.2022_final_EN.pptxngothithungan1
VietinBank's business performance in 3Q2022 and 9M2022 continued positive results with total assets reaching VND 1,751 trillion as of September 30th, 2022, up 14.3% year-to-date. Total pre-tax profit was VND 4.2 trillion in 3Q2022, increasing 35.8% year-over-year. Loan balances grew 10.1% year-to-date with a positive shift toward retail and SME segments. Non-performing loans remained under control at 1.42% while capital adequacy ratio was high at 222.4%. E-banking and digital transactions surged, demonstrating VietinBank's ongoing digital transformation efforts.
This document provides an overview of macroeconomic conditions and the banking industry in Vietnam, and details about VietinBank. The macroeconomic section notes GDP growth rates from 2015 to the first half of 2020, inflation rates, unemployment, export/import figures, FDI, and exchange rates. It also discusses credit growth and profitability in the banking industry. The document then profiles VietinBank, outlining its history, mission, organizational structure, investment highlights including a strong innovation focus, extensive network, credit ratings, technology platform, and human resources. Performance metrics and business orientation for 2020 are also reviewed.
Best practices for project execution and deliveryCLIVE MINCHIN
A select set of project management best practices to keep your project on-track, on-cost and aligned to scope. Many firms have don't have the necessary skills, diligence, methods and oversight of their projects; this leads to slippage, higher costs and longer timeframes. Often firms have a history of projects that simply failed to move the needle. These best practices will help your firm avoid these pitfalls but they require fortitude to apply.
The Steadfast and Reliable Bull: Taurus Zodiac Signmy Pandit
Explore the steadfast and reliable nature of the Taurus Zodiac Sign. Discover the personality traits, key dates, and horoscope insights that define the determined and practical Taurus, and learn how their grounded nature makes them the anchor of the zodiac.
❼❷⓿❺❻❷❽❷❼❽ Dpboss Matka Result Satta Matka Guessing Satta Fix jodi Kalyan Final ank Satta Matka Dpbos Final ank Satta Matta Matka 143 Kalyan Matka Guessing Final Matka Final ank Today Matka 420 Satta Batta Satta 143 Kalyan Chart Main Bazar Chart vip Matka Guessing Dpboss 143 Guessing Kalyan night
Taurus Zodiac Sign: Unveiling the Traits, Dates, and Horoscope Insights of th...my Pandit
Dive into the steadfast world of the Taurus Zodiac Sign. Discover the grounded, stable, and logical nature of Taurus individuals, and explore their key personality traits, important dates, and horoscope insights. Learn how the determination and patience of the Taurus sign make them the rock-steady achievers and anchors of the zodiac.
Navigating the world of forex trading can be challenging, especially for beginners. To help you make an informed decision, we have comprehensively compared the best forex brokers in India for 2024. This article, reviewed by Top Forex Brokers Review, will cover featured award winners, the best forex brokers, featured offers, the best copy trading platforms, the best forex brokers for beginners, the best MetaTrader brokers, and recently updated reviews. We will focus on FP Markets, Black Bull, EightCap, IC Markets, and Octa.
Storytelling is an incredibly valuable tool to share data and information. To get the most impact from stories there are a number of key ingredients. These are based on science and human nature. Using these elements in a story you can deliver information impactfully, ensure action and drive change.
How MJ Global Leads the Packaging Industry.pdfMJ Global
MJ Global's success in staying ahead of the curve in the packaging industry is a testament to its dedication to innovation, sustainability, and customer-centricity. By embracing technological advancements, leading in eco-friendly solutions, collaborating with industry leaders, and adapting to evolving consumer preferences, MJ Global continues to set new standards in the packaging sector.
𝐔𝐧𝐯𝐞𝐢𝐥 𝐭𝐡𝐞 𝐅𝐮𝐭𝐮𝐫𝐞 𝐨𝐟 𝐄𝐧𝐞𝐫𝐠𝐲 𝐄𝐟𝐟𝐢𝐜𝐢𝐞𝐧𝐜𝐲 𝐰𝐢𝐭𝐡 𝐍𝐄𝐖𝐍𝐓𝐈𝐃𝐄’𝐬 𝐋𝐚𝐭𝐞𝐬𝐭 𝐎𝐟𝐟𝐞𝐫𝐢𝐧𝐠𝐬
Explore the details in our newly released product manual, which showcases NEWNTIDE's advanced heat pump technologies. Delve into our energy-efficient and eco-friendly solutions tailored for diverse global markets.
Unveiling the Dynamic Personalities, Key Dates, and Horoscope Insights: Gemin...my Pandit
Explore the fascinating world of the Gemini Zodiac Sign. Discover the unique personality traits, key dates, and horoscope insights of Gemini individuals. Learn how their sociable, communicative nature and boundless curiosity make them the dynamic explorers of the zodiac. Dive into the duality of the Gemini sign and understand their intellectual and adventurous spirit.
Part 2 Deep Dive: Navigating the 2024 Slowdownjeffkluth1
Introduction
The global retail industry has weathered numerous storms, with the financial crisis of 2008 serving as a poignant reminder of the sector's resilience and adaptability. However, as we navigate the complex landscape of 2024, retailers face a unique set of challenges that demand innovative strategies and a fundamental shift in mindset. This white paper contrasts the impact of the 2008 recession on the retail sector with the current headwinds retailers are grappling with, while offering a comprehensive roadmap for success in this new paradigm.
Best Competitive Marble Pricing in Dubai - ☎ 9928909666Stone Art Hub
Stone Art Hub offers the best competitive Marble Pricing in Dubai, ensuring affordability without compromising quality. With a wide range of exquisite marble options to choose from, you can enhance your spaces with elegance and sophistication. For inquiries or orders, contact us at ☎ 9928909666. Experience luxury at unbeatable prices.
[To download this presentation, visit:
https://www.oeconsulting.com.sg/training-presentations]
This presentation is a curated compilation of PowerPoint diagrams and templates designed to illustrate 20 different digital transformation frameworks and models. These frameworks are based on recent industry trends and best practices, ensuring that the content remains relevant and up-to-date.
Key highlights include Microsoft's Digital Transformation Framework, which focuses on driving innovation and efficiency, and McKinsey's Ten Guiding Principles, which provide strategic insights for successful digital transformation. Additionally, Forrester's framework emphasizes enhancing customer experiences and modernizing IT infrastructure, while IDC's MaturityScape helps assess and develop organizational digital maturity. MIT's framework explores cutting-edge strategies for achieving digital success.
These materials are perfect for enhancing your business or classroom presentations, offering visual aids to supplement your insights. Please note that while comprehensive, these slides are intended as supplementary resources and may not be complete for standalone instructional purposes.
Frameworks/Models included:
Microsoft’s Digital Transformation Framework
McKinsey’s Ten Guiding Principles of Digital Transformation
Forrester’s Digital Transformation Framework
IDC’s Digital Transformation MaturityScape
MIT’s Digital Transformation Framework
Gartner’s Digital Transformation Framework
Accenture’s Digital Strategy & Enterprise Frameworks
Deloitte’s Digital Industrial Transformation Framework
Capgemini’s Digital Transformation Framework
PwC’s Digital Transformation Framework
Cisco’s Digital Transformation Framework
Cognizant’s Digital Transformation Framework
DXC Technology’s Digital Transformation Framework
The BCG Strategy Palette
McKinsey’s Digital Transformation Framework
Digital Transformation Compass
Four Levels of Digital Maturity
Design Thinking Framework
Business Model Canvas
Customer Journey Map
Starting a business is like embarking on an unpredictable adventure. It’s a journey filled with highs and lows, victories and defeats. But what if I told you that those setbacks and failures could be the very stepping stones that lead you to fortune? Let’s explore how resilience, adaptability, and strategic thinking can transform adversity into opportunity.
4. GDP
1Q2019 GDP Growth was relatively positive
In the first months of 2019, Vietnam's economy, despite facing difficulties and challenges with
slow growth of some key export products, slow disbursement of public investment capital,
continued to produce positive changes and maintain macroeconomic stability.
1Q2019 GDP increased by 6.79% y-o-y, though lower than that of 1Q2018 but still higher than
those of first quarters of the period 2011-2017.
The Government targeted to achieve GDP growth of 6.6% - 6.8% in 2019.
4
5.7%
5.4%
6.4% 6.2%
5.2% 5.4%
6.0%
6.7% 6.2%
6.8%
7.1%
0%
1%
2%
3%
4%
5%
6%
7%
8%
0
50
100
150
200
250
2008 2009 2010 2011 2012 2013 2014 2015 2016 2017 2018
Vietnam GDP growth 2008-2018 (billion USD)
GDP %GDP
5.8%
6.6%
6.7%
5.1%
6.2%
7.5%
7.7%
7.4%
6.7%
6.9%
7.3%
6.8%
0%
1%
2%
3%
4%
5%
6%
7%
8%
9%
Vietnam GDP growth 2016-2019 (q-o-q)
%GDP (q-o-q)
Source: General Statistics Office
5. CPI
CPI of the first quarter increased the lowest in
the last 3 years
CPI in March 2019
decreased by 0.21%
compared to the
previous month.
CPI in March 2019
rose by 0.69%
compared to December
2018 and increased by
2.7% y-o-y.
The average CPI in
1Q2019 increased by
2.63% compared to the
same period in 2018,
which is the lowest first
quarterly average
increase in the last 3
years.
Core inflation in March
2018 decreased by
0.06% over the previous
month and increased by
1.84% y-o-y. The
average core inflation in
1Q2019 rose by 1.83%
y-o-y.
Factors that caused CPI
in 1Q2019 to increase:
Increasing demand for
food and foodstuff in the
first months of the year
compared to the same
period last year;
Prices of public transport
services, housing
maintenance materials,
package tours and several
essential goods increased.
Factors that contributed
to inhibition of CPI in
1Q2019:
Gasoline prices were
adjusted downward;
Gas prices were
adjusted down according
to world prices;
The price of education
was adjusted down as
tuition was lowered fee
according to Resolution
No. 25/2018/NQ-HDND
dated December 7, 2018
of the Ho Chi Minh City
People's Council.
17.5%
7.6%
12.2%
17.3%
6.8%
6.0%
4.1%
0.6%
4.7%
3.5% 3.5%
0%
2%
4%
6%
8%
10%
12%
14%
16%
18%
20%
2008 2009 2010 2011 2012 2013 2014 2015 2016 2017 2018
CPI growth 2008 - 2018
% CPI (y-o-y)
0.5%
0.7%
-0.3%
0.1%
0.6%
0.6%
-0.1%
0.5%
0.6%
0.3%
-0.3%
-0.3%
0.1%
0.8%
-0.2%
-0.4%
-0.2%
0.0%
0.2%
0.4%
0.6%
0.8%
1.0%
01/2018 03/2018 05/2018 07/2018 09/2018 11/2018 01/2019 03/2019
CPI growth 2018-2019 (m-o-m)
% CPI (m-o-m)
5
Source: General Statistics Office
6. PMI
Vietnam's manufacturing sector continued to grow at the end of 1Q2019
Vietnamese manufacturing PMI index increased from 51.2 points in February 2019 to 51.9
points in March 2019, indicating an improvement in the health of manufacturing sector for 40
consecutive months.
The number of new orders increased for the 40th consecutive month when the number of new
customers and export orders increased. It is the fastest growth rate of new orders in March in
the first 3 months.
Meanwhile, the growth rate of manufacturing output was faster for the second month in a row
and only slightly faster than the number of new orders. This allowed companies to reduce
backlog and increase inventory.
6
53.4 53.5
51.6
52.7
53.9
55.7
54.9
53.7
51.5
53.9
56.5
53.8
51.9
51.2
51.9
48
50
52
54
56
58
01/2018 02/2018 03/2018 04/2018 05/2018 06/2018 07/2018 08/2018 09/2018 10/2018 11/2018 12/2018 01/2019 02/2019 03/2019
PMI in the period 2018-2019
Source: General Statistics Office
7. Import & Export
The trade balance suffered a slight deficit in the first two months of 2019
Export turnover in 1Q2019: $58.51 billion (up 4,7% y-o-y)
• Domestic sector: $17.05 billion (up 9.7%);
• FDI: $41.46 billion (up 2.7%).
Import turnover in 1Q2019: $57.98 billion (up 8.9% y-o-y)
• Domestic sector: $24.09 billion (up 13.4%);
• FDI: $33.89 billion (up 6.0%).
Balance of trade in 1Q2019: Surplus $536 million (lower than $2.7 billion surplus of the same
period in 2018)
• Domestic sector: Deficit $7.04 billion;
• FDI: Surplus $7.57 billion.
7
-20
0
20
40
60
80
100
120
140
160
180
200
220
240
260
2008 2009 2010 2011 2012 2013 2014 2015 2016 2017 2018 1Q2019
Vietnam Export & Import (billion USD)
Export Import Trade Balance
Source: General Statistics Office
8. FDI
FDI improved positively in the first quarter of 2019
As of March 20, 2019, FDI attracted 785 new licensed projects with the registered capital of US$3.82 billion, an
increase of 27% in the number of projects and an increase of 80.1% in registered capital over the same period
in 2018.
There were 279 licensed projects from previous years registered to adjust their investment the capital with the
total additional capital of 1.3 billion USD, down 27.5% compared to the same period in 2018. The total newly
registered capital and additional capital in 3 months reached 5.12 billion USD, up 30.9% over the same period
last year.
There were 1,653 times of capital contribution and buying shares of foreign investors with the total capital
contribution of US$ 5.69 billion, tripled the same period in 2018. In which, there were 588 capital contributions,
shares purchase to increase the charter capital of enterprises with the total contributed capital of 4.79 billion
USD and 1,065 times of foreign investors buying domestic shares that did not increase the charter capital with
total amount of US $ 0.9 billion.
Realized FDI capital in the first 3 months of 2019 reached USD 4.12 billion, up 6.2% compared to the same
period of 2018.
8
60.3
16.3 18.6
14.7 13.0 14.3 15.6 15.6 15.2
21.3
18.0
3.8
11.5
10.0 11.0 11.0 10.5 11.5
12.4
14.5 15.8 17.5 19.1
4.1
0
10
20
30
40
50
60
70
2008 2009 2010 2011 2012 2013 2014 2015 2016 2017 2018 1Q2019
FDI newly registered and disbursed (USD, bn)
Newly registered Disbursed
Source: Ministry of planning and investment
9. Vietnam Banking sector
Exchange rate was relatively stable in 1Q2019
Liquidity was guaranteed, deposit interest rates
increased slightly
22,100
22,200
22,300
22,400
22,500
22,600
22,700
22,800
22,900
23,000
23,100
SBV’s central USD/VND exchange rate
The exchange rate increased rapidly from 23,180 VND/USD to
23,200 VND/USD right in the first session of the new year,
affected by the fact that the State Bank raised the buying price of
foreign currency by 500 VND, corresponding to an increase of
2.2%, from 22,700 VND/USD to 23,200 VND/USD to adapt to
the depreciation of VND in 2019. After this time, the exchange
rate was relatively stable, fluctuating around a narrow range of
23,190-23,210 VND/USD in most of the time of 1Q2019.
As of 29/3/2019, SBV’s central rate was adjusted up by 155
points (+0.68%) to 22,980 VND/USD compared to end of 2018.
Total means of payment increased by 2.54% from 2018 (as at 20
Mar 2019).
Credit growth was up 1.9% from 2018 (as at 20 Mar 2019).
Capital mobilization of credit institutions increased 1.72% from
2018 (as at 20 Mar 2019).
Recently, some commercial banks have increased midterm and
long term deposit rates to restructure their capital mobilization at
the requirement of the SBV.
VND deposit rates were popular at 0.5% -1%/year for demand
deposits and deposits with term of less than 1 month; 4.5% -
5.5%/year for terms from 1 month to less than 6 months; 5.5% -
6.5%/year for terms of 6 months to less than 12 months; the term
of over 12 months was from 6.6% -7.3%/year.
VND lending rates normally ranges from 6%-9%/year for short
term and 9%-11%/year for medium and long term.
9
0%
5%
10%
15%
20%
25%
30%
35%
Credit growth
0%
5%
10%
15%
20%
25%
30%
35%
Mobilization growth
Source: General Statistics Office
10. VietinBank Overview
Solid Governance Structure
Strong Organizational Structure
2. General information
about VietinBank
10
11. 11
Officially
renamed to
Vietnam Joint
Stock
Commercial
Bank for
Industry and
Trade (or
VietinBank in
short).
2008
Established
upon
separation
from The
State Bank
of Vietnam
(SBV)
Went public
through IPO
and listed
on Ho Chi
Minh Stock
Exchange
(HOSE) one
year later.
IFC officially
became
foreign
strategic
shareholder
of VietinBank
with 10%
stake
ownership.
The Bank of
Tokyo Mitsubishi
UFJ (BTMU -
now known as
MUFG Bank)
officially became
the second
foreign strategic
shareholder of
VietinBank,
holding 19,73%
equity share of
VietinBank.
Successfully
implemented
Core
Banking
system.
Being
awarded
"The Best
Core
Banking
Project" by
The Asian
Banker.
VietinBank
celebrated 30
years of
establishment
and
development.
1988 2009 2011 2012 2017 2018
VietinBank Overview
Vietnam Joint Stock Commercial Bank for
Industry and Trade (VietinBank) is a leading
financial and banking institution in Vietnam,
providing modern financial and banking
products and services with full utilities and
meeting international standards.
12. Solid Governance Structure
Board of Directors
Board of Management
Internal Audit
1. HR, Remuneration and Salary
Committee
2. Risk Management Committee
3. Policy Committee
4. Assets and Liabilities
Management Committee
Corporate
Banking
Division
General Shareholders’ Meeting
12
1. Credit Board
2. Assets and Liabilities
Management Board
3. Risk Management Board
4. Capital Management Board
Supervisory Board
Board of Directors Office
Credit
Approval
Division
Risk
Management
Division
Retail
Banking
Division
Treasury &
Capital Markets
Division
Human
Resources
Division
Operation
Division
Financial
Division
Branches
Legal and
Compliance
Division
Information
Technology
Division
Marketing and
Communications
Division
Other
Departments
Subsidiaries
13. Strong Organizational Structure
Head Office
VietinBank
Laos Limited
Domestic & overseas
branch network
Representative
Offices
Non-profit Making
Units
Subsidiaries and
Affiliated Companies
Transaction Offices
Indovina
Joint Venture
Bank
Non Financial Subsidiaries
Financial Subsidiaries and
Affiliated Companies
VietinBank
Securities
JSC
VietinBank
Fund
Management
Company Ltd
VietinBank
Leasing
Company Ltd.
VietinBank
Global Money
Transfer
Company Ltd
VietinBank
Insurance
Company Ltd.
VietinBank Gold
and Jewelry
Trading
Company Ltd.
VietinBank Debt
and Asset
Management
Company Ltd.
13
14. Chartered Capital, Total Equity and Total Asset
Network
Brand name & Client base
Strong Shareholder Structure
Corporate governance and HR
3. Investment Highlights
14
15. Investment Highlights
Strong
potential
1
2
3
45
6
7
Strong shareholder structure
(SBV 64.46%; MUFG 19.73%, IFC 8.03%)
Focus resources to effectively
implement the restructuring
plan associated with bad debt
handling
High quality human
resources
Solid infrastructure
with modern
technology system
Outstanding scale in terms of
Total Assets, Total Equity &
Charter Capital
World-wide and nation-wide
network
Strong brand name with
diversified client base
15
17. Network Overview
Head Office
in Ha Noi
02 Representative
Offices
155 Branches,
958 Transaction
Offices
01 Joint-Venture
Companies
07 Subsidiaries
09 Non-business
Units
Central
29 Branches
South
53 Branches
North
Head Office
73 Branches
Nationwide network:
• 01 Head Office in Hanoi
• 02 Representative offices in Da Nang and Ho
Chi Minh City
• 155 Local branches, 958 transaction offices in
all cities and provinces
• 09 Non-business units
• 07 Subsidiaries (insurance, securities, financial
leasing, fund management, assets
management, gold and jewelry, global money
transfer)
• 01 Joint-venture companies (Indovina Bank)
• Nearly 2,000 ATMs
Foreign expansion:
• 01 Branch in Frankfurt, Germany
• 01 Branch in Berlin, Germany
• 01 Subsidiary in Laos (VietinBank Laos Ltd)
• 01 Representative office in Myanmar
VietinBank has established a large
correspondent banking network with more than
1,000 banks in 90 countries and territories all
over the world.
17
18. Great and solid customer base
VietinBank has fostered strong banking relationships with well-established corporates in
Vietnam as well as SMEs, FDI & retail clients.
18
19. Strong Shareholder Structure
Shareholder
Vietnamese
Government
MUFG
IFC
Support
Government owns 64.46% of VietinBank’s
Charter Capital. Government ownership
ratio will not fall below 51% at any time.
The majority of Board of Director’s
members are appointed by the Government
and the State Bank of Vietnam.
Cooperation Agreement with IFC in 2011
covers:
Risk management
Banking services for SMEs
Energy Efficiency Project
Information technology
Technical Assistance & Business
Collaboration Agreement with MUFG
covers:
Risk management & Basel II
Implementation
Information technology
Investment banking
Retail and SMEs banking
Cash collection and settlement service
Major Shareholders’ stakes Major shareholders’ supports
64.46%
19.73%
8.03%
7.78%
State Bank of Vietnam
MUFG
IFC
Others
19
20. Management Team
20
BOARD OF DIRECTORS
Mr. Le Duc Tho
Chairman of the
BoD
Mr. Tran
Minh Binh
Board Member
Mr. Tran Van Tan
Board Member
Ms. Tran
Thu Huyen
Board Member
Mr. Nguyen The
Huan
Board Member
Ms. Pham Thi
Thanh Hoai
Board Member
Mr. Hiroshi
Yamaguchi
Board Member
Mr. Hideaki
Takase
Board Member
BOARD OF MANAGEMENT
Mr. Tran
Minh Binh
General Director
Ms. Nguyen
Hong Van
Deputy General
Director
Ms. Le Nhu Hoa
Deputy General
Director
Mr. Nguyen
Hoang Dung
Deputy General
Director
Mr. Nguyen
Duc Thanh
Deputy General
Director
Mr. Tran Cong
Quynh Lan
Deputy General
Director
Mr. Nguyen
Dinh Vinh
Deputy General
Director
Mr. Hiroshi
Yamaguchi
Deputy General
Director
Mr. Nguyen
Hai Hung
Chief Accountant
BOARD OF SUPERVISOR
Ms. Le Anh Ha
Chief Supervisor
Ms. Nguyen Thi
Anh Thu
Member
Mr. Nguyen
Manh Toan
Member
22. Corporate Vision & Strategic Objectives
Sustainable growth of scale1
New shift in income structure2
Develop transaction banking operations3
Improve financial capacity4
Enhance full-time labor productivity and cost-effective management5
Vision
A leading bank in Vietnam, being on the same level playing ground with regional
banks, modern, multi-functional and in accordance with international standards.
Strategic Objectives for period 2018 - 2020
Motto
Large-scale commercial bank with the best operating efficiency of the
Vietnamese banking system.
22
23. 2019’s business targets
Effectively implement the
action plan in restructuring
plan associated with
handling bad debts in the
period 2016 - 2020
according to the proposed
roadmap
Strongly improve the quality
of services, develop a
variety of modern services
and products, shift income
structure towards
increasing non-interest
income
Improve financial capacity,
increase equity
Strengthening the
organizational model,
improving the quality of
human resources
Strictly control operating
costs and CIR rate,
aiming to improve labor
productivity, workforce
planning
Promote technology
application in all aspects
of operation
Strongly improve efficiency,
maintain reasonable growth
rates associated with good
management of quality
growth. Improve NIM ratio,
good management of
capital costs and operating
costs.
Promoting bad debt
recovery, risk-handled
debts, debts sold to VAMC,
improving asset quality
23
Enhance the role of risk
management, ensure
compliance, safety,
business development
associated with
strengthening risk
management
24. Stable funding with high proportion from
market 1
Reasonable credit growth, controlled NPL
ratio
Safe & diversified securities portfolio
Financial results
Performance results vs. other listed banks
5. Performance
24
25. Stable funding
Mobilized fund structure
Deposits of customers & credit
institutions (USD, bil)
Inner ring: As at 31 Dec 2018: USD 48.06 bil
Outer ring: As at 31 Mar 2019: USD 46.85 bil
6%
10%
75%
1%
4% 4%
5%
9%
77%
1%
4%
4%
Borrowing from Gov and SBV
Deposits & borrowings from other banks
Customer deposits
Sponsor capital, Entrusted Investment
Value paper issued
Other mobilized funds
17
20 23
30
34
36 363.8
4.9
4.5
3.8
5.1
4.9 4.2
0
5
10
15
20
25
30
35
40
45
2013 2014 2015 2016 2017 2018 1Q2019
Deposits & borrowings from other banks
Customer deposits
25
26. Customer Deposit
Customer Deposit Breakdown by
Type of business (31/12/2018)
Customer Deposit Breakdown by Tenor
(31/03/2019)
24.48%
6.97%
10.31%
52.69%
5.55%
SOEs (24.48%)
FDI (6.97%)
Other business entities (10.31%)
Individuals (52.69%)
Others (5.55%)
14.58%
84.69%
0.35% 0.38%
Demand deposits (14.58%)
Term deposits (84.69%)
Deposits for specific purpose (0.35%)
Margin deposit (0.38%)
26
27. Effective and safe credit growth
Total Loans and Advances to Customer (USD, bil)
Loan Breakdown by Type of business
(31/12/2018)
Loans to Total assets ratio (LAR)
Loan Breakdown by Tenor
(31/03/2019)
18
21
25
30
35
38 37
0
5
10
15
20
25
30
35
40
2013 2014 2015 2016 2017 2018 1Q2019
65.28%
66.53%
69.03%
69.78%
72.20%
74.28%
75.13%
2013 2014 2015 2016 2017 2018 1Q2019
55.87%
7.81%
36.32%
Short term (55.87%)
Medium term (7.81%)
Long term (36.32%)
13.16%
5.56%
52.33%
28.51%
0.44%
SOEs (13.16%)
FDI (5.56%)
Other business entities
(52.33%)
Individuals (28.51%)
Others (0.62%)
27
28. Credit quality control
1.00%
1.12%
0.92%
1.02%
1.14%
1.58%
1.85%
0.0%
0.2%
0.4%
0.6%
0.8%
1.0%
1.2%
1.4%
1.6%
1.8%
2.0%
2013 2014 2015 2016 2017 2018 1Q2019
Non-Performing Loan Ratio (NPL)
Group
1Q2019 2018 2017 2016 2015
Value
(USD, Mil)
%
Value
(USD, Mil)
%
Value
(USD, Mil)
%
Value
(USD, Mil)
%
Value
(USD, mil) %
Group 1
Current
36,826 97.56 37,066 97.81 34,695 98.41 29,319 98.03 24,208 98.48
Group 2
Special mention
222 0.59 228 0.61 162 0.46 251 0.91 147 0.60
NPLs 699 1.85 600 1.58 402 1.14 304 1.06 226 0.92
Total 37,894 100 37,894 100 35,259 100 29,874 100 24,581 100
28
29. Asset Quality Management
• VietinBank has an appropriate credit system that allows to monitor
loan limits and credit risk appetite.
• This credit system with decentralized authority and clear reporting
channels is widely communicated.
Proper Credit System
• Loans and advances are relatively well allocated according to
business entities and industry sectors, ensuring a high degree of
portfolio diversification, minimizing concentration risk.
• The credit policy has put in place strict exposure credit limits.
Well-Defined Sectoral, Single
Party and Group Exposure
Credit Limits
• Comprehensive and detailed asset classification, current provisioning
requirements and policies are in consistent with regulatory norms and
guidelines.
• The above mentioned asset classification have resulted in positive
developments in measures against non-performing loans.
Comprehensive Asset
Classification and
Provisioning Requirements
• Strong credit risk management system is in place to improve the
asset management quality in the current growing economic
environment.
Strong Credit Risk
Management System
30. Safe & diversified securities portfolio
Components of Investment PortfolioInvestment Portfolio (USD, Bil)
7.5
8.3
8.9
10.7
10.9
10.6
9.5
27.8%
26.8%
28.5%
25.0%
22.4%
20.8%
19.1%
0
2
4
6
8
10
12
0%
5%
10%
15%
20%
25%
30%
2013 2014 2015 2016 2017 2018 1Q2019
Total investment Investment to total asset ratio
54%
44%
0.56%
0.06%
1.37%
51%47%
0.61%
0.08%
1.63%
Interbank Debt securities
Equity securities Other trading securities
Long-term investments
Inner ring: As at 31 Dec 2018
Outer ring: As at 31 Mar 2019
30
33. Awards and accolades
1. FIRST-CLASS LABOUR MEDAL (FOR THE SECOND TIME) AND GOVERNMENT
EMULATION FLAG
VietinBank was awarded First-class Labour Medal (for the second time) and Government Emulation
Flag on its 30th anniversary. This is the official recognition from the Government and the Party for
VietinBank’s great achievements, efforts and contributions during its 30 years of development.
2. TOP 400 MOST VALUABLE BANK BRANDS WORLDWIDE
Ranked 310 on Brand Finance’s list in 2018, VietinBank has been recognized amongst the Top 400
most valuable Bank Brands in the world, fortifying its position in the Top 500 for the 6th consecutive
year. The remarkable leap for 98 ranks in 2018 put VietinBank amongst the top 3 banks with the
most rapid improvement. Additionally, VietinBank’s brand value increased sharply by 51.3% to reach
USD 381 million, with Brand Power rated AA-.
3. TOP 2000 LARGEST ENTERPRISES WORLDWIDE
For the 7th consecutive year, VietinBank has been listed on Forbes Global 2000 (Top 2000 largest
enterprises worldwide) compiled by Forbes. Forbes also recognized VietinBank’s revenue of USD
3.4 billion and market value of USD 4.8 billion.
4. VIETNAM NATIONAL BRAND
VietinBank’s services were recognized as National Brand for the 5th consecutive year. This
prestigious award, initiated by the Prime Minister, was presented by National Trade Promotion
Agency - Ministry of Industry and Trade, National Brand Council and Secretariat of National Brand
Award.
5. VIETNAM’S STRONGEST TRADEMARK
This marked the 14th consecutive year VietinBank being awarded the prize of “Vietnam Strong
Trademark” as well as its leading position among the awarded enterprises.
33
34. Efficient subsidiaries
Subsidiaries
Charterd Capital as
at 31/03/2019
(USD, Mil)
Percentage of
contribution
(%)
Profit after tax as at
31/03/2019
(USD, Mil)
VietinBank Laos Limited 50 100% 0.90
VietinBank Leasing Company
Ltd
43.52 100% 1.03
VietinBank Fund Management
Company Ltd
41.34 100% 0.40
VietinBank Securities Joint
Stock Company
46.32 75.61% 2.14
VietinBank Insurance Joint
Stock Company
21.76 97.83% 1.02
VietinBank Gold and Jewelry
Trading Company Ltd
13.05 100% 0.13
VietinBank Debt Management
and Asset Exploitation
Company Ltd
5.22 100% (0.20)
Global Money Transfer
Company Ltd
2.18 100% 0.51
34
35. CTG Stock Performance 1Q2019
Indicators Value
Closing price of 1st
trading session of
1Q2019 (02nd Jan 2019)
19,000 VND/share
Closing price of last
trading session of
1Q2019 (29th Mar 2019)
22,450 VND/share
Price fluctuations in
1Q2019
17,900 - 23,400 VND/share
Volume 361,679,540 shares
Trading value 7,534 billion VND
Trading volume of
foreign investors
Net selling 16,735,180
shares
Foreign owned 29.96%
EPS 2,716 VND/share
P/E (29th Mar 2019) 8.27x
BVPS 18,834 VND/share
P/B (29th Mar 2019) 1.19x
60%
80%
100%
120%
140%
160%
180%
200%
02/01/2018 12/04/2018 21/07/2018 29/10/2018 06/02/2019
Growth of VN-Index
and Bank Stock in 1Q2019
CTG VCB BID MBB
STB ACB VNIndex
35
0
2,000
4,000
6,000
8,000
10,000
12,000
14,000
16,000
0
5
10
15
20
25
30
35
40
30/03/2018 28/06/2018 26/09/2018 25/12/2018 25/03/2019
(Thousandsdong)
CTG Stock Performance in 1Q2019
Volumn (thousands of share) Price
36. Historical Financials - Balance Sheet
36
Unit: USD Million 2015 2016 2017 2018 1Q2019 1Q2018
Cash, gold and gemstones 233 234 267 308 312 288
Balances with the State Bank of Vietnam (“SBV”) 543 609 926 1,016 1,396 631
Placements with and loans to other credit institutions 3,016 4,263 4,794 5,718 4,827 4,651
Trading securities 153 86 157 137 212 193
Derivative financial instruments and other financial assets 0 31 24 12 14 29
Loans to customers 24,581 29,874 35,259 37,894 37,493 36,796
Provision for credit losses of loans to customers (208) (311) (370) (570) (708) (447)
Investment securities 5,483 6,057 5,725 4,473 4,220 5,275
Long-term investments 178 145 139 145 155 143
Fixed assets 396 479 510 487 475 501
Other assets 1,234 1,340 1,401 1,395 1,508 1,548
Total assets 35,609 42,807 48,832 51,016 49,903 49,608
Borrowings from the Government and the SBV 604 217 678 2,743 2,526 1,250
Deposits and borrowings from other credit institutions 4,530 3,843 5,135 4,881 4,168 4,986
Deposits from customers 22,520 29,562 33,576 36,180 35,884 35,144
Derivative financial instruments and other financial liabilities 5 0 0 0 0 0
Financing funds, entrusted funds, and exposed funds 2,478 274 284 260 257 289
Valuable papers issued 953 1,076 1,003 2,025 2,011 1,002
Other liabilities 1,955 5,114 5,312 1,972 2,005 3,989
Total liabilities 33,046 40,086 45,989 48,060 46,852 46,661
Capital 2,111 2,085 2,061 2,034 2,020 2,058
In which: Chartered capital 1,701 1,680 1,660 1,631 1,620 1,658
Reserves 241 287 333 358 356 333
Foreign exchange differences 20 22 25 26 31 25
Undistributed profit 180 315 412 525 632 409
Total owners’ equity 2,563 2,722 2,843 2,955 3,052 2,840
Non-controlling Interests 11 12 13 13 13 13
Total liabilities and owners’ equity 35,609 42,807 48,832 51,016 49,903 49,608
Exchange rates 21,890 22,159 22,425 22,825 22,980 22,458
37. Historical Financials - Income Statement
37
Unit: USD Million 2015 2016 2017 2018 1Q2019 1Q2018
Interest and similar income 1,940 2,387 2,911 3,250 855 784
Interest and similar expenses (1,080) (1,380) (1,704) (2,263) (510) (468)
Net interest and similar income 861 1,007 1,207 987 346 326
Fees and commission income 121 150 192 261 74 56
Fees and commission expenses (54) (74) (109) (140) (32) (29)
Net gain/(loss) from fees and commission income 67 77 83 121 42 27
Net gain/(loss) from trading of foreign currencies 1 31 32 31 18 11
Net gain/(loss) from securities held for trading 6 8 14 12 6 11
Net gain from investment securities 2 2 (4) 10 (4) 4
Net gain/(loss) from other activities 101 59 89 82 7 16
Income from investments in other entities 2 7 33 16 4 4
Income from non-interest 178 183 247 273 73 72
Total income 1,039 1,190 1,455 1,259 419 399
Operating expenses (490) (580) (672) (625) (141) (156)
Net profit before provision for credit losses 549 610 783 634 278 243
Provision expense for credit losses (214) (228) (372) (340) (141) (106)
Profit before tax 336 382 411 295 137 137
Corporate income tax expense (74) (76) (78) (58) (27) (26)
Profit after tax 261 305 333 237 110 110
Non-controlling Interests (1) (1) (1) (0.1) (0) (1)
Owners’s net profit 260 304 331 237 110 110
Exchange rates 21,890 22,159 22,425 22,825 22,980 22,458
38. Investor Relations Website
http://investor.vietinbank.vn
For further information, please contact:
Secretariats to the Board of Directors and Investor Relations
Office of the Board of Directors
VietinBank
Address: 108 Tran Hung Dao street, Hanoi, Vietnam.
Email: investor@vietinbank.vn
Tel: 84-24-3 941 3622
38
39. Thank you!
Disclaimer:
This presentation is prepared by using financial reports and other reliable sources with the
aims to provide information only. Readers should use this presentation as a reference source.
The information might be updated from time to time and we have no responsibility to notify
about that change.