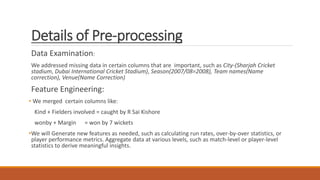
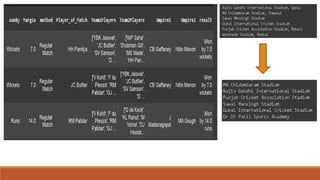
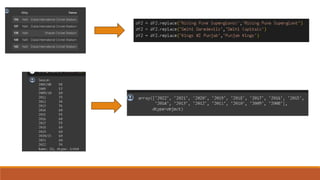
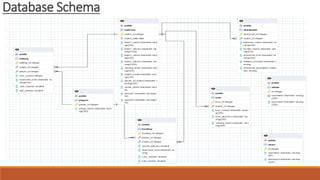
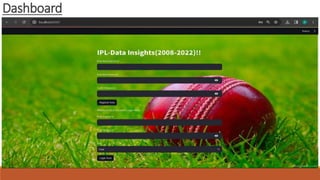
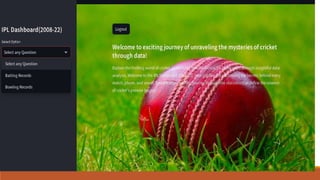
The document outlines a project presentation by a team analyzing IPL data, detailing pre-processing steps taken to address missing information, and feature engineering efforts to create meaningful insights. It specifies tools used for data management and visualization, including Google Colab, PostgreSQL, and libraries like Matplotlib and Seaborn. Individual contributions from team members are highlighted, indicating their specific roles in designing the dashboard, handling SQL queries, and processing the dataset.