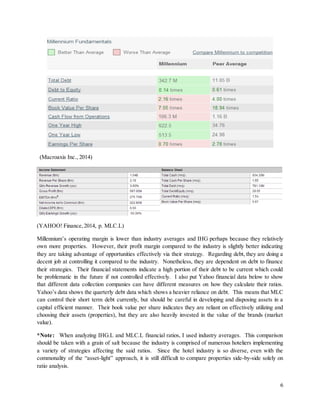
- The author analyzes two hotel companies, IHG.L and MLC.L, listed on the London Stock Exchange.
- IHG.L focuses on consistent growth through franchise partnerships while MLC.L owns more properties and relies on asset management.
- An analysis of financial ratios, share performance, implied returns using the dividend discount model, risk premiums, and betas shows IHG.L has lower risk but higher returns compared to MLC.L.

![9
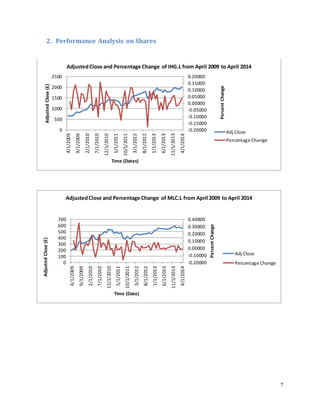
despite similar average percentage changes. Finally, both IHG.L and MLC.L have positive upward trends
regarding their price with IHG.L showing a greater slope in terms of price.
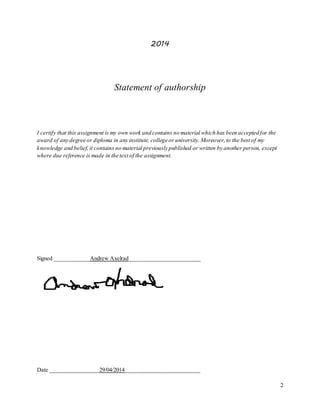
3. Implied Returns using Dividend Discount Model
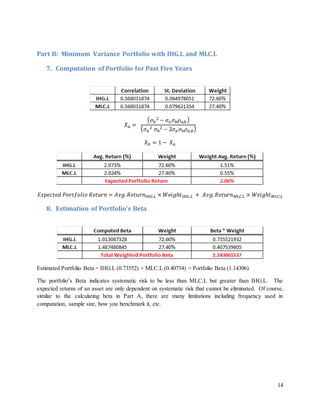
IHG.L
(YAHOO! Finance,2014, p. IHG.L)
Dividends were given out two times a year as indicated above and were summed up to total the dividends
given out in each respective year (data on right half of spreadsheet). For both the left and right side
dividends, the growth rate was calculated (i.e. £7.30 - £20.20) / £20.20)) and then averaged out for an
estimated arithmetic average percentage change. The average percentage change (12.09%) was used as
the growth rate for the following calculations. Note: the dividends given out in March 2014 were £28.10
and were not factored in to maintain consistency in the yearly dividend calculations on the right. If it were
to be factored in, it would drop the average yearly percentage change to 2.80% distorting the actual
expected future outcome.
The last closing price used was £1,999.00 on April 1st
2014 and the last full year dividend paid out was
£42.80 in August 2013. The steps for calculation are listed below:
P0 = £1,999.00, D1 = £42.80, g = 0.1209 (12.09%)
1. P0 =
[D0∗(1+g)]
(k−g)
2. P0 =
𝐷1
(k−g)
3. D1 = (P0) ∗ (k − g)
4. (k − g) = (
D1
𝑝0
)
5. k = (
𝐷1
𝑃0
) + g
6. So…. k = (£42.80 / £1,999.00) + 0.1209
7. Then…. k = 14.23%](https://image.slidesharecdn.com/2b4e070b-1044-4ea7-930a-c5f108e297eb-150211151501-conversion-gate02/85/Investments-Assignment-2-9-320.jpg)
![10
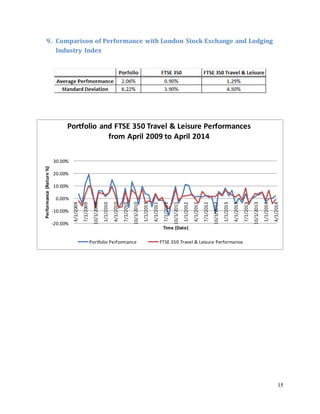
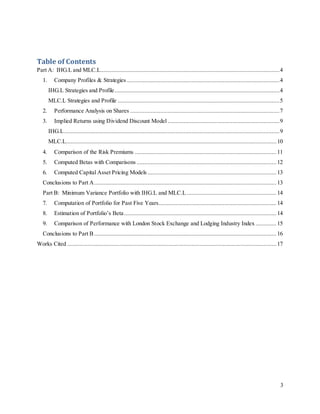
MLC.L
(YAHOO! Finance,2014, p. MLC.L)
The same growth estimation used for IHG.L was used for MLC.L to ensure consistency. For both the left
and right side dividends, the growth rate was calculated (i.e. £2.08 - £4.17) / £4.17)) and then averaged out
for an estimated arithmetic average percentage change. The average percentage change (23.43%) was
used as the growth rate for the following calculations. Note: the dividends given out in March 2014 were
£11.51 and were not factored in to maintain consistency in the yearly dividend calculations on the right. If
it were to be factored in, it would drop the average yearly percentage change to 15.68% distorting the
actual expected future outcome.
Last closing priced used was £554.50 on April 1st
2014 and the last full year dividend paid out was £13.59
in August 2013. The steps for calculation are listed below:
P0 = £554.50, D1 = £13.59, g = 0.2343 (23.43%)
1. P0 =
[D0∗(1+g)]
(k−g)
2. P0 =
𝐷1
(k−g)
3. D1 = (P0) ∗ (k − g)
4. (k − g) = (
D1
𝑝0
)
5. k = (
𝐷1
𝑃0
) + g
6. So…. k = (£13.59 / £554.50) + 0.2343
7. Then…. k = 25.88%](https://image.slidesharecdn.com/2b4e070b-1044-4ea7-930a-c5f108e297eb-150211151501-conversion-gate02/85/Investments-Assignment-2-10-320.jpg)
![12
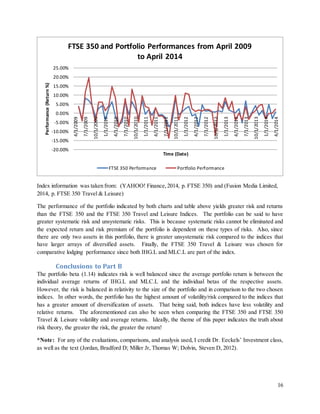
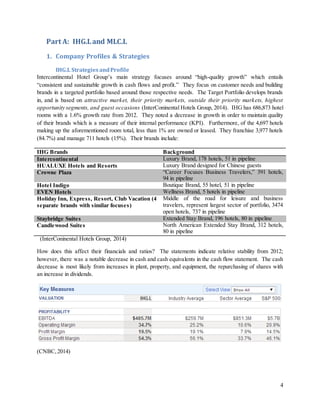
5. Computed Betas with Comparisons
The published betas above were taken from: (Thomson Reuters,2014, p. IHG.L) and (Thomson Reuters,
2014, p. MLC.L)
1. Returns calculated for both IHG.L and MLC.L utilized:
a. [
𝑁𝑒𝑤 𝐴𝑑𝑗𝑢𝑠𝑡𝑒𝑑 𝐶𝑙𝑜𝑠𝑒
𝑃𝑟𝑒𝑣𝑖𝑜𝑢𝑠 𝐴𝑑𝑗𝑢𝑠𝑡𝑒𝑑 𝐶𝑙𝑜𝑠𝑒
] − 1
2. The FTSE 350 Returns were calculated with the same formula in part 1.
3. Then calculated Beta by using function COVARIANCE.P and VAR.P (variance)
a. =COVARIANCE.P (all calculated returns for IHG.L in part 1, all calculated returns for
FTSE 350 calculated in part 2) / VAR.P (all calculated returns for FTSE 350 calculated in
part 2) = 1.013
b. =COVARIANCE.P (all calculated returns for MLC.L in part 1, all calculated returns for
FTSE 350 calculated in part 2) / VAR.P (all calculated returns for FTSE 350 calculated in
part 2) = 1.487
Explanations/Analysis:
The FTSE 350 Index was used for several reasons including: IHG.L and MLC.L are listed under the
London Stock Exchange who in turn own and operate the FTSE indexes. Also, the FTSE 350 was used
since the index value was the most comparable to the market capitalization of both companies. The beta
measures the systematic risk, or non-diversifiable risk on a single asset against the average of the market.
IHG.L has less systematic risk than MLC.L since IHG.L has a lower beta. Both IHG.L and MLC.L betas
are comparable because betas are an additive measuring how a specific stock behaves against a benchmark
(FTSE 350). In question 6 you will be able to see that the expected return is dependent on systematic risk
(beta). When comparing the beta to the published respective betas above, you will notice a slight numeric
difference. This difference is because different financial publishers calculate betas with different formulae
and factors. Also, since beta is reliant on historical data, different returns/estimates can be used in the
calculation affecting the preciseness of the calculation. However, as you can see above, the beta
differences in this case are so small.](https://image.slidesharecdn.com/2b4e070b-1044-4ea7-930a-c5f108e297eb-150211151501-conversion-gate02/85/Investments-Assignment-2-12-320.jpg)
![13
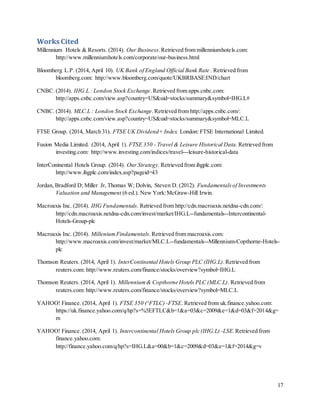
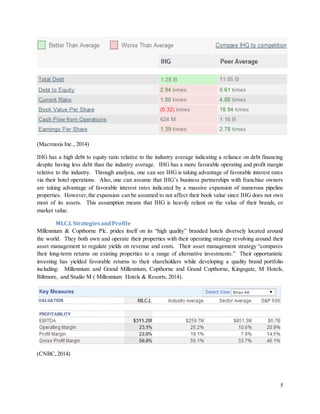
6. Computed Capital Asset Pricing Models
The capital asset pricing model uses the risk free rate,the market return, and the calculated betas. The risk
free rate is the same listed in question #4 taken from (Bloomberg L.P., 2014) (UK Bank of England
Official Rate). The market return (r (m)) was taken from a PDF report published by the FTSE (FTSE
Group, 2014) at 11.9%. Hence, the equation goes as follows:
1. 𝐸𝑥𝑝𝑒𝑐𝑡𝑒𝑑 𝑅𝑒𝑡𝑢𝑟𝑛 = 𝑟𝑖𝑠𝑘 𝑓𝑟𝑒𝑒 + 𝛽 × [ 𝑚𝑎𝑟𝑘𝑒𝑡 𝑟𝑖𝑠𝑘 − 𝑟𝑖𝑠𝑘 𝑓𝑟𝑒𝑒]
2. Or…. 𝑟 ( 𝑒) = 𝑟( 𝑓) + 𝛽 ( 𝑒) × [ 𝑟( 𝑚) − 𝑟(𝑓)]
CAPM and DDM both estimate returns of an individual stock or its value, but have different focuses.
DDM relies that the company has given dividends and on calculating the average growth from dividends
given in a period of time. DDM also assumed that a stock’s dividends grow at a constant rate! On the
other hand, CAPM emphasizes the use of benchmarking by using a stock’s beta comparing an individual
stock’s performance to that of the market. CAPM utilizes risks to estimate an expected return for all
stocks even if they do not give out dividends unlike DDM (requires dividends). Regarding the differences
in DDM and CAPM, for both IHG.L and MLC.L we can infer that the stocks are over-priced, because the
average actual returns are less than the expected returns calculated above.
Conclusions to Part A
MLC.L has both a greater standard deviation or volatility (0.07962) and beta or systematic risk (1.487)
than IHG.L who has both comparatively lower volatility (0.06497) and systematic risk (1.013)
respectively. However, that being said, IHG.L has a slightly higher average return (2.073%) and average
risk premium (2.069%) than MLC.L who has 2.023% and 2.019% respectively. When it comes to an
expected return, MLC.L is back on top in parallel to the greater risk with around 17.6% compared to
IHG.L who has an expected return of around 12%. Reasons for this are that the expected return accounts
for the systematic risk and the greater the risk, the greater the expected return. Finally, since the market
premiums are high due to an extremely small risk free rate, the expected returns are affected
systematically.](https://image.slidesharecdn.com/2b4e070b-1044-4ea7-930a-c5f108e297eb-150211151501-conversion-gate02/85/Investments-Assignment-2-13-320.jpg)