Download as PDF, PPTX
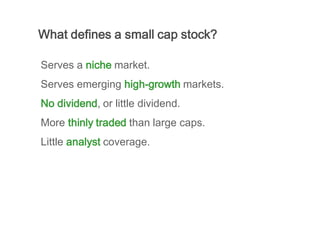
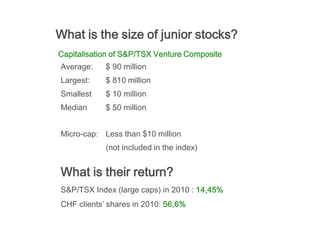
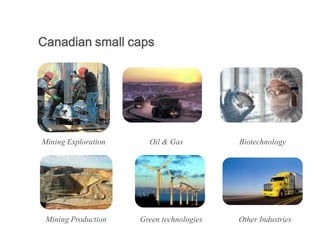


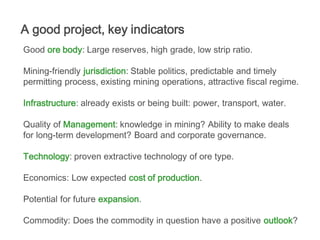

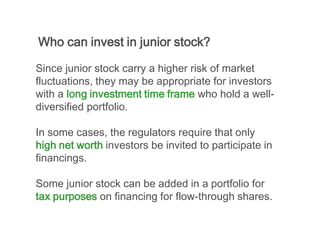
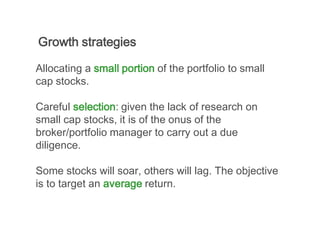
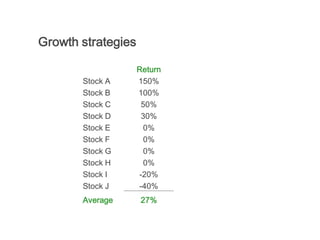


Small capitalization stocks, also known as small caps or junior stocks, typically have market capitalizations between $10 million to $500 million. They serve niche or emerging growth markets and have little to no dividend payouts. Returns have historically been superior to large caps due to market mispricing from low liquidity and analyst coverage. Junior mining stocks listed on the TSX Venture Exchange represent opportunities in mining exploration, production, and other industries like oil and gas or biotechnology. Key indicators of a successful junior mining project include large reserves, low costs, proven extractive technology, and quality management. Small caps can be included in a well-diversified growth portfolio for tax benefits and high potential returns, though they carry higher


