Download as PDF, PPTX

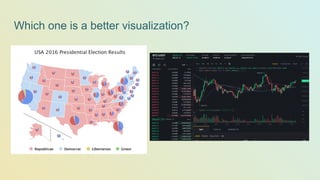
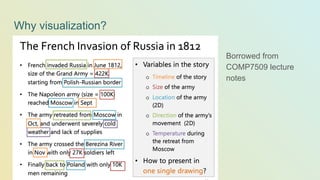
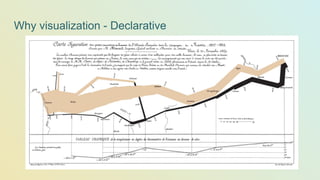
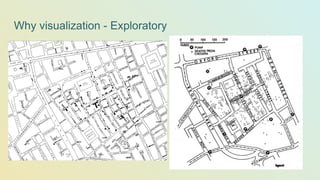


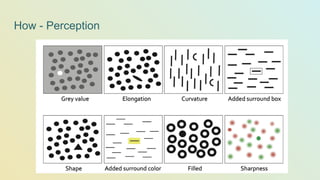
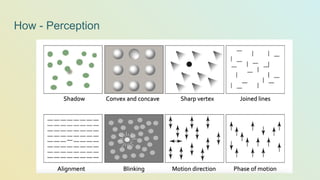
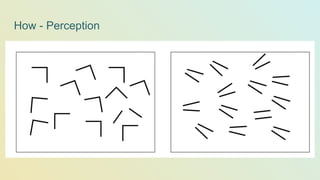
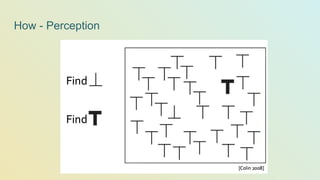
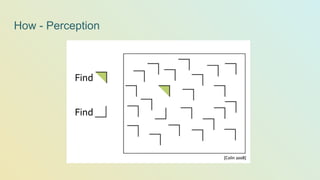

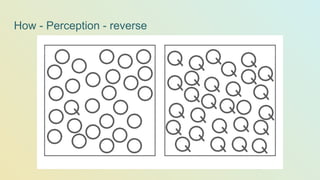
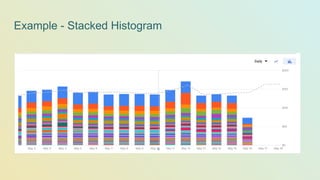
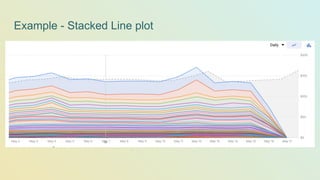
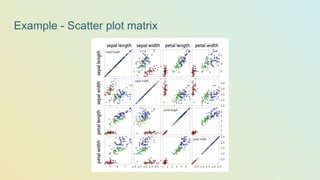
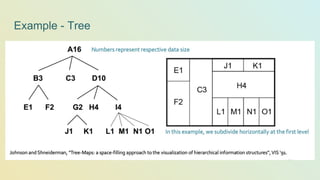
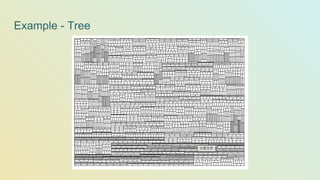
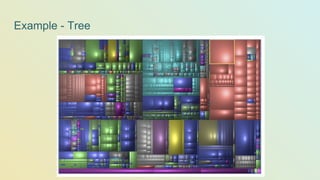
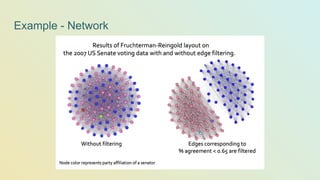

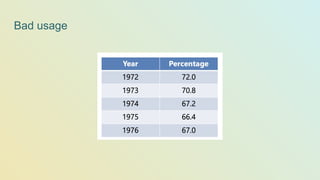


This document discusses data visualization techniques and best practices. It introduces data visualization and explores why visualization is useful both for declarative and exploratory purposes. It then examines principles of human perception and how to design effective visualizations according to color, size, position and other perceptual factors. Finally, it covers types of visualizations like histograms, scatter plots, trees and networks, as well as anti-patterns to avoid and ways to reduce distortion and provide proper context.