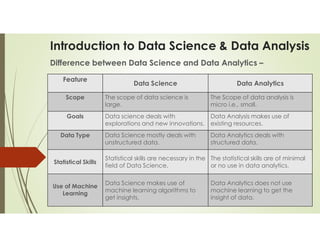
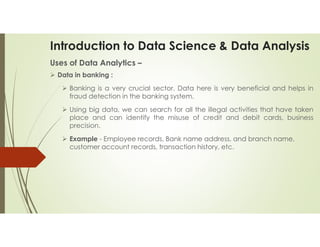
Introduction to Data
Science and Data Analysis
Mr. S.K.Patil
Introduction to Data Science & Data Analysis
Introduction –
 Data science is about extracting knowledge and insights from data.
 Data science is applied to extract information from both structured and
unstructured data.
 Data vs Information –
 Data is a collection of facts. It is raw and unorganized.
 Information puts the facts into context. It is organized.
 Data, on its own, is meaningless. When it’s analyzed and interpreted, it
becomes meaningful information.
 Example –
 Data - The price of a competitors’ product
 Information - Determining if a competitor is charging more or less for a similar
product
Introduction to Data Science & Data Analysis
Introduction –
 The different tools and techniques of data science are used to drive business
and process decisions.
 It can be seen as a data-driven decision-making approach.
 It is a multidisciplinary field that involves the ability to understand, process, and
visualize data.
 It apply statistics, modeling, mathematics, and technology to address and
solve analytically complex problems using data.
 Data science is all about using data in creative and effective ways to help
businesses in making data-driven business decisions.
Introduction to Data Science & Data Analysis
What is Data Science? –
 “Data Science is a data driven decision making approach with a purpose of
extracting insights and knowledge from structured and unstructured data. The
insights are helpful in applying algorithms and models to make decisions. The
models are used in predictive analytics to predict future outcomes”
 “Data science is a multidisciplinary field focused on finding actionable insights
from large sets of raw, structured, and unstructured data.”
 Data science has broader scope than analytics, business analytics, or business
intelligence.
 It brings together and combines several disciplines and areas to “understand
and analyze actual phenomena” from data.
 Data science employs techniques and methods from many other fields, such
as mathematics, statistics, computer science, and information science.
Introduction to Data Science & Data Analysis
What is Data Science? –
 Data science also uses data visualization techniques using specially designed
software Tableau and other big data software.
 Python are all used in different applications to analyze, extract information,
and draw conclusions from data.
 These tools, techniques, and programming languages provide a unifying
approach to explore, analyze, draw conclusions, and make decisions from
massive amounts of data companies collect.
Introduction to Data Science & Data Analysis
Data Science & Statistics –
 Data science does not equate to big data, in that the size of the data set is not
a criterion to distinguish data science and statistics.
 Data science is not defined by the computing skills of sorting big data sets, in
that these skills are already generally used for analyses across all disciplines.
Role of Statistics in Data Science –
 Data science professionals and data scientists should have a strong
background in statistics, mathematics, and computer applications.
 Good analytical and statistical skills are a prerequisite to successful application
and implementation of data science tools.
 Besides the simple statistical tools, data science also uses visualization,
statistical modeling including descriptive analytics, and predictive modeling for
predicting future business outcomes.
Introduction to Data Science & Data Analysis
Data Science & Statistics –
Role of Statistics in Data Science –
 A combination of mathematical methods along with computational algorithms
and statistical models is needed for generating successful data science
solutions.
 Here are some key statistical concepts that every data scientist should know -
 Descriptive statistics and data visualization
 Inferential statistics concepts and tools of inferential statistics
 Concepts of probability and probability distributions
 Concepts of sampling and sampling distribution/ over and under-sampling
 Bayesian statistics
 Dimensionality reduction
Introduction to Data Science & Data Analysis
Data Science : A Brief History –
 In November 1997, C.F. Jeff Wu gave the inaugural lecture titled “ Statistics =
Data Science?”.
 In this lecture, he characterized statistical work as a trilogy of data
collection, data modeling and analysis, and decision making.
 In his conclusion, he initiated the modern, non-computer science, usage of
the term “data science” and advocated that statistics be renamed data
science and statisticians be data scientists.
 In 2001, William S. Cleveland introduced data science as an independent
discipline, extending the field of statistics to incorporate “advances in
computing with data” in his article.
 In April 2002, the International Council for Science (ICSU): Committee on Data
for Science and technology (CoDATA) started the Data Science Journal, a
publication focused on issues such as the description of data systems, their
publication on the Internet, applications and legal issues.
Introduction to Data Science & Data Analysis
Data Science : A Brief History –
 In January 2003, Columbia University began publishing The Journal of Data
Science, which provided a platform for all data workers to present their views
and exchange ideas. the journal was largely devoted to the application of
statistical methods and quantitative research.
 In 2005, the National Science Board published “Long-lived Digital Data
Collections: Enabling research and Education in the 21st Century” defining
data scientists as “the information and computer scientists, database and
software and programmers, disciplinary experts, curators and expert
annotators, librarians, archivists, and others, who are crucial to the successful
management of a digital data collection” whose primary activity is to
“conduct creative inquiry and analysis.”
 Around 2007, Turing award winner Jim Gray envisioned “data-driven science”
as a “fourth paradigm” of science that uses the computational analysis of
large data as primary scientific method and “to have a world in which all of
the science literature is online, all of the science data is online, and they
interoperate with each other.”
Introduction to Data Science & Data Analysis
Data Science : A Brief History –
 In 2012, DJ Patil along with Jeff Hammerbacher asserts that a data scientist is
“a new breed” and “shortage of data scientists is becoming a serious
constraint in some sectors” but describes a much more business- oriented role.
 In 2014, the first international conference, IEEE International Conference on
Data Science and Advanced Analytics, was launched.
 In 2014, the American Statistical Association (ASA) section on Statistical
Learning and Data Mining renamed its journal to Statistical Analysis and Data
Mining: The ASA Data Science Journal.
 In 2015, the International Journal on Data Science and Analytics was launched
by Springer to publish original work on data science and big data analytics.
 In 2016, the ASA changed its section name to “Statistical Learning and Data
Science.”
Introduction to Data Science & Data Analysis
Data Science and Data Analytics –
 Data analytics focuses on processing and performing statistical analysis on
existing datasets.
 Analysts apply different tools and methods to capture, process, organize, and
perform data analysis to data in the databases of companies to uncover
actionable insights from data and find ways to present this data.
 The field of data and analytics is directed toward solving problems for
questions we don’t know the answers to.
 It’s based on producing results that can lead to immediate improvements.
 Data analytics also encompasses different branches of statistics and analysis,
which help combine diverse sources of data and locate connections while
simplifying the results.
Introduction to Data Science & Data Analysis
Difference between Data Science and Data Analytics –
Feature
Data Science Data Analytics
Scope The scope of data science is
large.
The Scope of data analysis is
micro i.e., small.
Goals Data science deals with
explorations and new innovations.
Data Analysis makes use of
existing resources.
Data Type Data Science mostly deals with
unstructured data.
Data Analytics deals with
structured data.
Statistical Skills
Statistical skills are necessary in the
field of Data Science.
The statistical skills are of minimal
or no use in data analytics.
Use of Machine
Learning
Data Science makes use of
machine learning algorithms to
get insights.
Data Analytics does not use
machine learning to get the
insight of data.
Introduction to Data Science & Data Analysis
Difference between Data Science and Data Analytics –
Feature Data Science Data Analytics
Other Skills
Data Science makes use of Data
mining activities for getting
meaningful insights.
Hadoop Based analysis is used for
getting conclusions from raw
data.
Programming
Skills
In-depth knowledge of
programming is required for data
science.
Basic Programming skills is
necessary for data analytics.
Coding
Language
Python is the most commonly used
language for data science along
with the use of other languages
such as C++, Java, Perl, etc.
The Knowledge of Python and R
Language is essential for Data
Analytics.
Introduction to Data Science & Data Analysis
Knowledge & Skills for Data Science Professionals –
 The key function of the data science professional or a data scientist is to
understand the data and identify the correct method or methods that will lead
to desired solution.
 These methods are drawn from different fields including data and big data
analysis (visualization techniques), statistics (statistical modeling) and
probability, computer science and information systems, programming skills,
and an understanding of databases including querying and database
management.
 Data science professionals should also have the knowledge of many of the
software packages that can be used to solve different types of problems.
 Some of the commonly used programs are statistical packages (R statistical
computing software), SAS, and other statistical packages, relational database
packages (SQL, MySQL, Oracle, etc.), machine learning libraries (recently,
many software to automate machine learning tasks are available from
software vendors).
Introduction to Data Science & Data Analysis
Knowledge & Skills for Data Science Professionals –
 The two known auto machine learning software are Azure by Microsoft and
SAS auto ML.
 Below figure provides a broader view and the key areas of data science.
Introduction to Data Science & Data Analysis
Knowledge & Skills for Data Science Professionals –
 Below figure outlines the body of knowledge a data science professional is
expected to have.
Introduction to Data Science & Data Analysis
Knowledge & Skills for Data Science Professionals –
 There are a number of off-the-shelf data science software and platform in use.
 The use of these software requires significant knowledge and expertise.
 Without proper knowledge and background the off-the-shelf software may not
be used relatively easily.
Introduction to Data Science & Data Analysis
Technologies used in Data Science –
 The following is a partial list of technologies used in solving data science
problems.
 The technologies are from different fields including statistics, data visualization,
programming, machine learning, and big data.
 Python –
 It is a programming language with simple syntax that is commonly used for
data science.
 There are a number of python libraries that are used in data science and
machine learning applications including NumPy, pandas, MatplotLib, Scikit
Learn, and others.
Introduction to Data Science & Data Analysis
Technologies used in Data Science –
 R Statistical Analysis –
 It is a programming language that was designed for statistics and data
mining applications.
 It is one of the popular application packages used by data scientists and
analysts.
 TensorFlow –
 It is a framework for creating machine learning models developed by Google
machine learning models and applications.
 PyTorch –
 It is a framework for machine learning developed by Facebook.
Introduction to Data Science & Data Analysis
Technologies used in Data Science –
 Jupyter Notebook –
 It is an interactive web interface for Python that allows faster
experimentation.
 It is used in machine learning applications of data science.
 Tableau –
 It makes a variety of software that is used for data visualization.
 It is a widely used software for big data applications and is used for
descriptive analytics and data visualization.
 Apache Hadoop –
 It is a software framework that is used to process data over large distributed
systems.
Introduction to Data Science & Data Analysis
Benefits and Uses of Data Science –
Benefits -
 Improved Decision Making –
 By using data to address problems and inform viewpoints, data scientists play a
critical role in allowing better decision-making.
 By using variety of methodologies, they analyze and process massive datasets
which offers data-driven insights that can enable companies and organizations to
make wise decisions.
 Increased Efficiency –
 Business operations can be made more efficient and costs can be cut with the use
of data science.
 Businesses can spot inefficiencies and potential improvement areas by analyzing
data. Afterwards, modifications that boost efficiency while cutting expenses can be
made using the knowledge.
Introduction to Data Science & Data Analysis
Benefits and Uses of Data Science –
Benefits -
 Enhanced Customer Experience –
 Discovering customer preferences and behavior can be accomplished through
data analysis.
 The customer experience can be improved by using this information to create
goods and services that are catered to the needs of the user.
 Predictive Analytics –
 Based on past data, data science can be used to forecast future results.
 Businesses can find trends and forecast future occurrences by using machine
learning algorithms to analyze massive datasets.
Introduction to Data Science & Data Analysis
Benefits and Uses of Data Science –
Benefits -
 Efficient Resource Allocation –
 Utilizing data on resource utilization, demand trends, and supply chain dynamics,
data science aids organizations in maximizing resource allocation.
 As a result, waste is reduced and operational efficiency is increased while resources
like inventory, people, and equipment are appropriately allocated.
 Continuous Improvement –
 Organizations with a culture of continual development benefit from data science.
 Organizations can assess performance, monitor advancement, and pinpoint areas
for development by analyzing data. This data-driven strategy encourages an
attitude of constant improvement and innovation.
Introduction to Data Science & Data Analysis
Benefits and Uses of Data Science –
Benefits -
 Innovation and New Opportunities –
 Data science may help companies innovate and spot new opportunities.
 Data science is becoming a driving force behind innovation, allowing companies
to find fresh perspectives and untapped potential. Additionally, data science can
find new business prospects by examining competition data, market dynamics, and
consumer behavior.
 Better Healthcare Outcomes -
 The healthcare sector could undergo a transformation because of data science.
 Data scientists can gain insights to increase diagnosis precision, optimize treatment
strategies, and improve patient care, eventually resulting in better healthcare
outcomes, by analyzing patient data, medical records, and clinical studies.
Introduction to Data Science & Data Analysis
Benefits and Uses of Data Science –
Uses -
 Data science is used almost everywhere in both commercial and non-
commercial environment.
 Commercial companies in almost every industry use data science to gain
insights into their customers, processes, staff, completion and products.
 Many companies use data science to offer customers a better user
experience, as well as to cross-sell, up-sell and personalize their offerings.
Example – Google AdSense, MaxPoint
 HR professionals use people analytics and text mining to screen candidates,
monitor the mood of employees and study informal networks among
coworkers.
 Financial institutions use data science to predict stock markets, determine the
risk of lending money and learn how to attract new clients for their services.
Introduction to Data Science & Data Analysis
Benefits and Uses of Data Science –
 Many governmental organizations use data science to discover valuable
information. Also they share their data with public so that we can use this data
to gain insights or build data-driven applications.
 Governmental organizations use data science to detect fraud and other
criminal activity or optimizing project funding.
 Nongovernmental organizations (NGO’s) use data science to raise money and
defend their causes.
 The World Wildlife Fund (WWF) use data science to increase the effectiveness
of their fundraising efforts.
 Universities use data science in their research but also to enhance the study
experience of their students.
Introduction to Data Science & Data Analysis
Overview of Data Analytics –
 What is Data Analytics? -
 Data Analytics is the process of collecting, organizing and studying data to
find useful information, understand what’s happening and make better
decisions.
 In simple words it helps people and businesses learn from data like what
worked in the past, what is happening now and what might happen in the
future.
 Importance and Usage of Data Analytics –
 Data analytics is used in many fields like banking, farming, shopping,
government and more. It helps in many ways:
 Helps in Decision Making: It gives clear facts and patterns from data
which help people make smarter choices.
Introduction to Data Science & Data Analysis
Overview of Data Analytics –
 Importance and Usage of Data Analytics –
 It helps in many ways:
 Helps in Problem Solving: It points out what's going wrong and why
making it easier to fix problems.
 Helps Identify Opportunities: It shows trends and new chances for
growth that might not be obvious.
 Improved Efficiency: It helps reduce waste, saves time and makes work
smoother by finding better ways to do things.
Introduction to Data Science & Data Analysis
Overview of Data Analytics –
 Process of Data Analytics –
 Data analysts, data scientists and data engineers together create data
pipelines which helps to set up the model and do further analysis.
 Data Analytics can be done in the following steps:
Introduction to Data Science & Data Analysis
Overview of Data Analytics –
 Process of Data Analytics –
 Data Collection:
 Data collection is the first step where raw information is gathered from
different places like websites, apps, surveys or machines.
 Sometimes data comes from many sources and needs to be joined
together. Other times only a small useful part of the data is selected.
 Data Cleaning:
 Once the data is collected it usually contains mistakes like wrong
entries, missing values or repeated rows.
 In this step the data is cleaned to fix those problems and remove
anything that isn’t needed.
 Clean data makes the results more accurate and trustworthy.
Introduction to Data Science & Data Analysis
Overview of Data Analytics –
 Process of Data Analytics –
 Data Analysis and Data Interpretation:
 After cleaning the data is studied using tools like Excel, Python, R or SQL.
 Analysts look for patterns, trends or useful information that can help
solve problems or answer questions.
 The goal here is to understand what the data is telling us.
 Data Visualization:
 Data visualization is the process of creating visual representation of
data using the plots, charts and graphs which helps to analyze the
patterns, trends and get the valuable insights of the data.
 By comparing the datasets and analyzing it data analysts find the
useful data from the raw data.
Introduction to Data Science & Data Analysis
Overview of Data Analytics –
 Types of Data Analytics –
 There are different types of data analysis in which raw data is converted
into valuable insights.
 Some of the types of data analysis are mentioned below:
 Descriptive Data Analytics (Identify Data)
 Diagnostic Data Analytics (Investigate Data)
 Predictive Data Analytics (Predict Future)
 Prescriptive Data Analytics (Perform Actions)
Introduction to Data Science & Data Analysis
Overview of Data Analytics –
 Types of Data Analytics –
 Descriptive Data Analytics:
 Descriptive data analytics helps to summarize & understand past data.
 It shows what has happened by using tables, charts and averages.
 Companies use it to compare results, find strengths and weaknesses
and spot any unusual patterns.
 Diagnostic Data Analytics:
 Diagnostic data analytics looks at why something happened in the
past.
 It uses tools like correlation, regression or comparison to find the cause
of a problem.
 This helps companies understand the reason behind a drop in sales or a
sudden change in performance.
Introduction to Data Science & Data Analysis
Overview of Data Analytics –
 Types of Data Analytics –
 Predictive Data Analytics:
 It is used to guess what might happen in the future.
 It looks at current and past data to find patterns and make forecasts.
 Businesses use it to predict things like customer behavior, future sales or
possible risks.
 Prescriptive Data Analytics:
 It helps to choose the best action or solution.
 It looks at different options and suggests what should be done next.
 Companies use it for things like loan approval, pricing decisions and
managing machines or schedules.
Introduction to Data Science & Data Analysis
Nature of Data –
 What is Data ? –
 The data is a collection of facts, information, and statistics and this can be
in various forms such as numbers, text, sound, images, or any other format.
 According to the Oxford "Data is distinct pieces of information, usually
formatted in a special way".
 Data can be measured, collected, reported, and analyzed, whereupon it
is often visualized using graphs, images, or other analysis tools.
 Raw data ("unprocessed data") may be a collection of numbers or
characters before it's been "cleaned" and corrected by researchers.
 It must be corrected so that we can remove outliers or data entry errors.
 Data processing commonly occurs in stages, & the "processed data" from
one stage could also be considered the "raw data" of subsequent stages.
Introduction to Data Science & Data Analysis
Nature of Data –
Facets of Data –
 In data science there are many different types of data and each of them
tends to require different tools and techniques.
 The main categories of data are –
 Structured
 Unstructured
 Natural Language
 Machine Generated
 Graph Based
 Audio, Video and Images
 Streaming
Introduction to Data Science & Data Analysis
Nature of Data –
Facets of Data –
 Structured Data –
 It depends on a data model and resides in a fixed field within a record.
 It’s often easy to store structured data in tables within databases or Excel
files.
 SQL (Structured Query Language) is the preferred way to manage and
query data that resides in database.
 Unstructured Data –
 It is a data that is not easy to fit into a data model because the content is
content-specific or varying.
 Example – Email
 The structure is not fix and data is not organized.
Introduction to Data Science & Data Analysis
Nature of Data –
Facets of Data –
 Structured Data vs Unstructured Data –
 Structured data is standardized, clearly defined, and searchable data,
while unstructured data is usually stored in its native format.
 Structured data is quantitative, while unstructured data is qualitative.
 Structured data is often stored in data warehouses, while unstructured data
is stored in data lakes
 Structured data is easy to search and analyze, while unstructured data
requires more work to process and understand.
 Structured data exists in predefined formats, while unstructured data is in a
variety of formats.
Introduction to Data Science & Data Analysis
Facets of Data –
 Structured Data vs Unstructured Data –
Structured Data Unstructured Data
Data that is organized and formatted in a specific
way, following a predefined model or schema.
Data that lacks a specific structure or format and
is typically unorganized or in raw form.
Well-organized with a defined format, such as
tables and columns.
Lacks a predefined format and is unorganized.
Highly accessible and can be easily retrieved
using structured query language (SQL) or other
database tools.
Less accessible and requires advanced
techniques for extraction and analysis.
Easily analyzed using traditional statistical
methods and data mining techniques.
Requires advanced techniques like natural
language processing (NLP) and machine learning
for analysis.
Limited scalability due to predefined schemas
and fixed data structures.
Highly scalable and can accommodate any type
of data without altering the existing structure.
Customer information, transaction records,
inventory lists, financial data.
Emails, social media posts, multimedia files, sensor
data.
Introduction to Data Science & Data Analysis
Nature of Data –
Facets of Data –
 Natural Language –
 It is a special type of unstructured data.
 It’s challenging to process because it requires knowledge of specific data
science techniques and linguistics.
 The natural language processing community had success in entity
recognition, topic recognition, summarization, text completion and
sentiment analysis but models trained in one domain don’t generalize well
to other domains.
 It’s ambiguous by nature. The meaning of same words can vary when
coming from someone upset or joyous.
 Example – Handwritten letter
Introduction to Data Science & Data Analysis
Nature of Data –
Facets of Data –
 Machine Generated Data –
 It is an information that is automatically created by a computer, process,
application or other machine without human intervention.
 Machine generated data is becoming a major data resource and will
continue to do so.
 The analysis of machine data relies on highly scalable tools, due to its high
volume and speed.
 Example – Web server logs, call detail records
Introduction to Data Science & Data Analysis
Nature of Data –
Facets of Data –
 Graph based or network Data –
 Graph based or network data is a data that focuses on the relationship or
adjacency of objects.
 The graph structures use nodes, edges and properties to represent and
store graphical data.
 Graph based data is a natural way to represent social networks and its
structure allows to calculate specific metrics such as the influence of a
person and the shortest path between two people.
 Example - Linkedin
Introduction to Data Science & Data Analysis
Nature of Data –
Facets of Data –
 Audio, Video and Image –
 These types of data are creating specific challenges to data scientist.
 Tasks that are trivial for humans turn out to be challenging for computers.
 Recently a company called DeepMind succeeded at creating algorithm
that is capable of learning how to play video games.
 This algorithm takes a video screen as input and learns to interpret
everything via a complex process of deep learning.
 The learning algorithm takes in data as its produced by the computer
game.
Introduction to Data Science & Data Analysis
Nature of Data –
Facets of Data –
 Streaming Data –
 Streaming data can take almost any of the previous forms, it has an extra
property.
 The data flows into the system when an event happens instead of being
loaded into a data store in a batch.
 Example – “What’s trending” on Twitter
Introduction to Data Science & Data Analysis
Nature of Data –
What is Information? –
 Information is data that has been processed, organized, or structured in a way
that makes it meaningful, valuable, and useful.
 It is data that has been given context, relevance, and purpose.
 It gives knowledge, understanding, and insights that can be used for decision-
making, problem-solving, communication, and various other purposes.
Why Data is Important? –
 Data helps in making better decisions.
 Data helps in solving problems by finding the reason for underperformance.
 Data helps one to evaluate performance.
 Data helps one improve processes.
 Data helps one understand consumers and the market.
Introduction to Data Science & Data Analysis
Nature of Data –
Types of Data –
 Generally, data can be classified into following types:
 Categorical Data: In categorical data, the data that have a defined
category, for example – Eye color, Gender, Marital Status
 Numerical Data: Numerical data can further be classified into two
categories:
 Discrete Data: Discrete data contains the data which have discrete
numerical values for example Number of Children, Defects per Hour,
etc.
 Continuous Data: Continuous data contains the data that have
continuous numerical values for example Weight, Voltage etc.
Introduction to Data Science & Data Analysis
Nature of Data –
Types of Data –
 Generally, data can be classified into following types:
 Nominal Scale: A nominal scale classifies data into several distinct
categories in which no ranking criteria are implied. For example Gender,
Marital Status.
 Ordinary Scale: An ordinal scale classifies data into distinct categories
during which ranking is implied. For example: Faculty rank (Professor,
Associate Professor, Assistant Professor), Students grade(O, A, B, C, D).
Introduction to Data Science & Data Analysis
Nature of Data –
 What is the Data Processing Cycle? -
 The data processing cycle refers to the iterative sequence of
transformations applied to raw data to generate meaningful insights.
 It can be viewed as a pipeline with distinct stages:
 Data Acquisition:
 This stage encompasses the methods used to collect raw data from
various sources.
 This could involve sensor readings, scraping web data, or gathering
information through surveys and application logs.
 Data Preparation:
 Raw data is inherently messy and requires cleaning and pre-
processing before analysis.
Introduction to Data Science & Data Analysis
Nature of Data –
 What is the Data Processing Cycle? -
 It can be viewed as a pipeline with distinct stages:
 Data Preparation:
 This stage involves tasks like identifying and handling missing values,
correcting inconsistencies, formatting data into a consistent
structure, and potentially removing outliers.
 Data Input:
 The pre-processed data is loaded into a system suitable for further
processing and analysis.
 This often involves converting the data into a machine-readable
format and storing it in a database or data warehouse.
Introduction to Data Science & Data Analysis
Nature of Data –
 What is the Data Processing Cycle? -
 It can be viewed as a pipeline with distinct stages:
 Data Processing:
 Here, data undergoes various manipulations and transformations to
extract valuable information.
 This may include aggregation, filtering, sorting, feature engineering
(creating new features from existing ones), and applying machine
learning algorithms to uncover patterns and relationships.
 Data Output:
 The transformed data is then analyzed using various techniques to
generate insights and knowledge.
 This could involve statistical analysis, visualization techniques, or
building predictive models.
Introduction to Data Science & Data Analysis
Nature of Data –
 What is the Data Processing Cycle? -
 It can be viewed as a pipeline with distinct stages:
 Data Storage:
 The processed data and the generated outputs are stored in a
secure and accessible format for future use, reference, or feeding
into further analysis cycles.
 The data processing cycle is iterative, meaning the output from one stage
can become the input for another.
 This allows for continuous refinement, deeper analysis, and the creation of
increasingly sophisticated insights from the raw data.
Introduction to Data Science & Data Analysis
Classification of Data –
 To make the analysis meaningful and easy, the raw data is converted or
classified into different categories based on their characteristics.
 The grouping of data into different categories or classes with similar or
homogeneous characteristics is known as the Classification of Data.
 Each division or class of the gathered data is known as a Class.
 The different basis of classification of statistical information are Geographical,
Chronological, Qualitative (Simple and Manifold) and Quantitative or
Numerical.
 For example, if an investigator wants to determine the poverty level of a state,
he/she can do so by gathering the information of people of that state, and
then classifying them on the basis of their income, education, etc.
Introduction to Data Science & Data Analysis
Classification of Data –
 Objectives of Classification of Data -
 Brief and Simple -
 Raw data gathered by the investigator cannot provide him/her with
meaningful and effective results.
 Therefore it is essential to convert the raw material into different
categories for which classification of data is used.
 The basic motive of the classification of data is to present the raw data
collected by the investigator or analyst into different categories in a
way that is brief and simple.
 Proper classification of data makes the data analysis more convenient.
Introduction to Data Science & Data Analysis
Classification of Data –
 Objectives of Classification of Data -
 Utility -
 For the purpose of investigation, an analyst collects information from
different sources and then classifies the data into different categories.
 Classification of data distinguishes the collected diverse set of data by
bringing out similar or homogeneous information together, thus
enhancing its utility.
 Distinctiveness –
 It is not easy to form results from raw data gathered in one place in a
heterogeneous manner.
 Therefore, it is essential to classify the given data into different
categories.
Introduction to Data Science & Data Analysis
Classification of Data –
 Objectives of Classification of Data -
 Distinctiveness –
 Classification of data aims at providing the analyst with obvious
differences in the given set of data more distinctly.
 Comparability –
 It is not possible to compare two sets of data in raw form.
 Classification of data helps an investigator in comparing the given two
sets of data and estimating results.
 For example, if we say the number of firms producing laptops in
different locations of Kerala and Punjab is 30 and 25, respectively. It is
easier to compare this information instead of raw data consisting of the
names of every industry in Kerala and Punjab producing different
goods.
Introduction to Data Science & Data Analysis
Classification of Data –
 Objectives of Classification of Data -
 Scientific Arrangement –
 Classification of the raw data according to their similar characteristics
helps in facilitating the proper arrangement of the collected data in a
scientific manner.
 The scientific arrangement of data increases the reliability of data.
 Attractive and Effective –
 Classification makes the collected raw data effective and attractive.
 A lot can be understood just by looking at the data if it is properly
presented and classified.
Introduction to Data Science & Data Analysis
Uses of Data Analytics –
 Data is of much importance nowadays. Data helps to understand the
performance by providing the clarity needed for better results.
 Data helps to improve processes which reduce wasted money and time and
also understand consumers well.
 Data in business:
 In Data Analytics there are many advantages of data, but without proper
data analytics tools and processes, we can't access these benefits.
 Raw data is also very important and we need data analytics to unlock the
potential of raw data and converted into useful information for the
business.
 Example - Record of the potential customer, records of customers like
name, address.
Introduction to Data Science & Data Analysis
Uses of Data Analytics –
 Data in healthcare :
 Data is extremely useful in the field of medical and healthcare.
 Most of the medical devices are big data-oriented.
 The data has gone to such an extent that in healthcare sector each record
or we can say data is very essential where doctors can check person
through the heart and temperature monitoring watch which is critical
information of any patients and kept to be as data fitted on patient's hand
and prescribe him with related medicines.
 Example - Patient records like name, address, contact no. etc., treatment
records, Records of Doctor's profile are the examples in healthcare.
Introduction to Data Science & Data Analysis
Uses of Data Analytics –
 Data in media and entertainment :
 The business model runs on collecting and creating the content, further
analyzing it, then marketing and distribution of the content.
 We can run through customer's data along with observable data and
gather information to create a customer's detailed profile.
 The benefits of big data in the media and entertainment industry include
forecasting what the target audience wants, planning, optimization,
expanding acquisition, and retention suggest content on-demand & new.
 Example - Records of the team, the time duration of media project,
location, etc.
Introduction to Data Science & Data Analysis
Uses of Data Analytics –
 Data in transportation :
 Data in transportation is very crucial.
 For proper communication and for proper synchronization of transport
medium we need data and to analyze the information we need data
analytics.
 Data potential is to analyze how many passengers traveled from any
source to destination and with the help of data analytics it can be
processed in real-time for the smooth functioning of transportation.
 Example - feedback of customer, transport time, source and destination
records, customer traveled history, etc.
Introduction to Data Science & Data Analysis
Uses of Data Analytics –
 Data in banking :
 Banking is a very crucial sector. Data here is very beneficial and helps in
fraud detection in the banking system.
 Using big data, we can search for all the illegal activities that have taken
place and can identify the misuse of credit and debit cards, business
precision.
 Example - Employee records, Bank name address, and branch name,
customer account records, transaction history, etc.
Introduction to Data Science & Data Analysis
Data Science Process –
 The typical data science process consists of six steps –
 Setting the research goal
 Retrieving data
 Data Preparation
 Data Exploration
 Data Modeling
 Presentation and automation
Introduction to Data Science & Data Analysis
Data Science Process –
 The first step of the process is setting a research goal. The main purpose here is
making sure all the stakeholders understand what, how and why of the project.
This will result in project charter.
 The second phase is data retrieval. We want to have data available for
analysis, so this step includes finding suitable data and getting access to the
data from the data owner. The result is data in its raw form, which probably
needs polishing and transformation before it becomes usable.
 Now we have the raw data, its time to prepare it. This includes transforming the
data from a raw form into data that’s directly usable in models. To achieve this,
detect and correct different kinds of errors in the data, combine data from
different sources, and transform it. After successful completion of this step, we
can progress to data visualization and modeling.
 The fourth step is data exploration. The goal is to gain deep understanding of
the data. Look for patterns, correlations, and deviations based on visual and
descriptive techniques. The insights from this phase enable us to start modeling.
Introduction to Data Science & Data Analysis
Data Science Process –
 The next step is model building or data modeling. In this, attempt to gain the
insights or make the predictions stated in project charter earlier. Often a
combination of simple models tends to outperform one complicated model.
 The last step is presenting results and automating the analysis, if needed. One
goal of project is to change a process and/or make better decisions. The
importance of this step is more apparent in projects on a strategic and tactical
level. Certain projects require to perform the business process over and over
again, so automating the project will save time.

Introduction to Data Science and Data Analysis

  • 1.
    Introduction to Data Scienceand Data Analysis Mr. S.K.Patil
  • 2.
    Introduction to DataScience & Data Analysis Introduction –  Data science is about extracting knowledge and insights from data.  Data science is applied to extract information from both structured and unstructured data.  Data vs Information –  Data is a collection of facts. It is raw and unorganized.  Information puts the facts into context. It is organized.  Data, on its own, is meaningless. When it’s analyzed and interpreted, it becomes meaningful information.  Example –  Data - The price of a competitors’ product  Information - Determining if a competitor is charging more or less for a similar product
  • 3.
    Introduction to DataScience & Data Analysis Introduction –  The different tools and techniques of data science are used to drive business and process decisions.  It can be seen as a data-driven decision-making approach.  It is a multidisciplinary field that involves the ability to understand, process, and visualize data.  It apply statistics, modeling, mathematics, and technology to address and solve analytically complex problems using data.  Data science is all about using data in creative and effective ways to help businesses in making data-driven business decisions.
  • 4.
    Introduction to DataScience & Data Analysis What is Data Science? –  “Data Science is a data driven decision making approach with a purpose of extracting insights and knowledge from structured and unstructured data. The insights are helpful in applying algorithms and models to make decisions. The models are used in predictive analytics to predict future outcomes”  “Data science is a multidisciplinary field focused on finding actionable insights from large sets of raw, structured, and unstructured data.”  Data science has broader scope than analytics, business analytics, or business intelligence.  It brings together and combines several disciplines and areas to “understand and analyze actual phenomena” from data.  Data science employs techniques and methods from many other fields, such as mathematics, statistics, computer science, and information science.
  • 5.
    Introduction to DataScience & Data Analysis What is Data Science? –  Data science also uses data visualization techniques using specially designed software Tableau and other big data software.  Python are all used in different applications to analyze, extract information, and draw conclusions from data.  These tools, techniques, and programming languages provide a unifying approach to explore, analyze, draw conclusions, and make decisions from massive amounts of data companies collect.
  • 6.
    Introduction to DataScience & Data Analysis Data Science & Statistics –  Data science does not equate to big data, in that the size of the data set is not a criterion to distinguish data science and statistics.  Data science is not defined by the computing skills of sorting big data sets, in that these skills are already generally used for analyses across all disciplines. Role of Statistics in Data Science –  Data science professionals and data scientists should have a strong background in statistics, mathematics, and computer applications.  Good analytical and statistical skills are a prerequisite to successful application and implementation of data science tools.  Besides the simple statistical tools, data science also uses visualization, statistical modeling including descriptive analytics, and predictive modeling for predicting future business outcomes.
  • 7.
    Introduction to DataScience & Data Analysis Data Science & Statistics – Role of Statistics in Data Science –  A combination of mathematical methods along with computational algorithms and statistical models is needed for generating successful data science solutions.  Here are some key statistical concepts that every data scientist should know -  Descriptive statistics and data visualization  Inferential statistics concepts and tools of inferential statistics  Concepts of probability and probability distributions  Concepts of sampling and sampling distribution/ over and under-sampling  Bayesian statistics  Dimensionality reduction
  • 8.
    Introduction to DataScience & Data Analysis Data Science : A Brief History –  In November 1997, C.F. Jeff Wu gave the inaugural lecture titled “ Statistics = Data Science?”.  In this lecture, he characterized statistical work as a trilogy of data collection, data modeling and analysis, and decision making.  In his conclusion, he initiated the modern, non-computer science, usage of the term “data science” and advocated that statistics be renamed data science and statisticians be data scientists.  In 2001, William S. Cleveland introduced data science as an independent discipline, extending the field of statistics to incorporate “advances in computing with data” in his article.  In April 2002, the International Council for Science (ICSU): Committee on Data for Science and technology (CoDATA) started the Data Science Journal, a publication focused on issues such as the description of data systems, their publication on the Internet, applications and legal issues.
  • 9.
    Introduction to DataScience & Data Analysis Data Science : A Brief History –  In January 2003, Columbia University began publishing The Journal of Data Science, which provided a platform for all data workers to present their views and exchange ideas. the journal was largely devoted to the application of statistical methods and quantitative research.  In 2005, the National Science Board published “Long-lived Digital Data Collections: Enabling research and Education in the 21st Century” defining data scientists as “the information and computer scientists, database and software and programmers, disciplinary experts, curators and expert annotators, librarians, archivists, and others, who are crucial to the successful management of a digital data collection” whose primary activity is to “conduct creative inquiry and analysis.”  Around 2007, Turing award winner Jim Gray envisioned “data-driven science” as a “fourth paradigm” of science that uses the computational analysis of large data as primary scientific method and “to have a world in which all of the science literature is online, all of the science data is online, and they interoperate with each other.”
  • 10.
    Introduction to DataScience & Data Analysis Data Science : A Brief History –  In 2012, DJ Patil along with Jeff Hammerbacher asserts that a data scientist is “a new breed” and “shortage of data scientists is becoming a serious constraint in some sectors” but describes a much more business- oriented role.  In 2014, the first international conference, IEEE International Conference on Data Science and Advanced Analytics, was launched.  In 2014, the American Statistical Association (ASA) section on Statistical Learning and Data Mining renamed its journal to Statistical Analysis and Data Mining: The ASA Data Science Journal.  In 2015, the International Journal on Data Science and Analytics was launched by Springer to publish original work on data science and big data analytics.  In 2016, the ASA changed its section name to “Statistical Learning and Data Science.”
  • 11.
    Introduction to DataScience & Data Analysis Data Science and Data Analytics –  Data analytics focuses on processing and performing statistical analysis on existing datasets.  Analysts apply different tools and methods to capture, process, organize, and perform data analysis to data in the databases of companies to uncover actionable insights from data and find ways to present this data.  The field of data and analytics is directed toward solving problems for questions we don’t know the answers to.  It’s based on producing results that can lead to immediate improvements.  Data analytics also encompasses different branches of statistics and analysis, which help combine diverse sources of data and locate connections while simplifying the results.
  • 12.
    Introduction to DataScience & Data Analysis Difference between Data Science and Data Analytics – Feature Data Science Data Analytics Scope The scope of data science is large. The Scope of data analysis is micro i.e., small. Goals Data science deals with explorations and new innovations. Data Analysis makes use of existing resources. Data Type Data Science mostly deals with unstructured data. Data Analytics deals with structured data. Statistical Skills Statistical skills are necessary in the field of Data Science. The statistical skills are of minimal or no use in data analytics. Use of Machine Learning Data Science makes use of machine learning algorithms to get insights. Data Analytics does not use machine learning to get the insight of data.
  • 13.
    Introduction to DataScience & Data Analysis Difference between Data Science and Data Analytics – Feature Data Science Data Analytics Other Skills Data Science makes use of Data mining activities for getting meaningful insights. Hadoop Based analysis is used for getting conclusions from raw data. Programming Skills In-depth knowledge of programming is required for data science. Basic Programming skills is necessary for data analytics. Coding Language Python is the most commonly used language for data science along with the use of other languages such as C++, Java, Perl, etc. The Knowledge of Python and R Language is essential for Data Analytics.
  • 14.
    Introduction to DataScience & Data Analysis Knowledge & Skills for Data Science Professionals –  The key function of the data science professional or a data scientist is to understand the data and identify the correct method or methods that will lead to desired solution.  These methods are drawn from different fields including data and big data analysis (visualization techniques), statistics (statistical modeling) and probability, computer science and information systems, programming skills, and an understanding of databases including querying and database management.  Data science professionals should also have the knowledge of many of the software packages that can be used to solve different types of problems.  Some of the commonly used programs are statistical packages (R statistical computing software), SAS, and other statistical packages, relational database packages (SQL, MySQL, Oracle, etc.), machine learning libraries (recently, many software to automate machine learning tasks are available from software vendors).
  • 15.
    Introduction to DataScience & Data Analysis Knowledge & Skills for Data Science Professionals –  The two known auto machine learning software are Azure by Microsoft and SAS auto ML.  Below figure provides a broader view and the key areas of data science.
  • 16.
    Introduction to DataScience & Data Analysis Knowledge & Skills for Data Science Professionals –  Below figure outlines the body of knowledge a data science professional is expected to have.
  • 17.
    Introduction to DataScience & Data Analysis Knowledge & Skills for Data Science Professionals –  There are a number of off-the-shelf data science software and platform in use.  The use of these software requires significant knowledge and expertise.  Without proper knowledge and background the off-the-shelf software may not be used relatively easily.
  • 18.
    Introduction to DataScience & Data Analysis Technologies used in Data Science –  The following is a partial list of technologies used in solving data science problems.  The technologies are from different fields including statistics, data visualization, programming, machine learning, and big data.  Python –  It is a programming language with simple syntax that is commonly used for data science.  There are a number of python libraries that are used in data science and machine learning applications including NumPy, pandas, MatplotLib, Scikit Learn, and others.
  • 19.
    Introduction to DataScience & Data Analysis Technologies used in Data Science –  R Statistical Analysis –  It is a programming language that was designed for statistics and data mining applications.  It is one of the popular application packages used by data scientists and analysts.  TensorFlow –  It is a framework for creating machine learning models developed by Google machine learning models and applications.  PyTorch –  It is a framework for machine learning developed by Facebook.
  • 20.
    Introduction to DataScience & Data Analysis Technologies used in Data Science –  Jupyter Notebook –  It is an interactive web interface for Python that allows faster experimentation.  It is used in machine learning applications of data science.  Tableau –  It makes a variety of software that is used for data visualization.  It is a widely used software for big data applications and is used for descriptive analytics and data visualization.  Apache Hadoop –  It is a software framework that is used to process data over large distributed systems.
  • 21.
    Introduction to DataScience & Data Analysis Benefits and Uses of Data Science – Benefits -  Improved Decision Making –  By using data to address problems and inform viewpoints, data scientists play a critical role in allowing better decision-making.  By using variety of methodologies, they analyze and process massive datasets which offers data-driven insights that can enable companies and organizations to make wise decisions.  Increased Efficiency –  Business operations can be made more efficient and costs can be cut with the use of data science.  Businesses can spot inefficiencies and potential improvement areas by analyzing data. Afterwards, modifications that boost efficiency while cutting expenses can be made using the knowledge.
  • 22.
    Introduction to DataScience & Data Analysis Benefits and Uses of Data Science – Benefits -  Enhanced Customer Experience –  Discovering customer preferences and behavior can be accomplished through data analysis.  The customer experience can be improved by using this information to create goods and services that are catered to the needs of the user.  Predictive Analytics –  Based on past data, data science can be used to forecast future results.  Businesses can find trends and forecast future occurrences by using machine learning algorithms to analyze massive datasets.
  • 23.
    Introduction to DataScience & Data Analysis Benefits and Uses of Data Science – Benefits -  Efficient Resource Allocation –  Utilizing data on resource utilization, demand trends, and supply chain dynamics, data science aids organizations in maximizing resource allocation.  As a result, waste is reduced and operational efficiency is increased while resources like inventory, people, and equipment are appropriately allocated.  Continuous Improvement –  Organizations with a culture of continual development benefit from data science.  Organizations can assess performance, monitor advancement, and pinpoint areas for development by analyzing data. This data-driven strategy encourages an attitude of constant improvement and innovation.
  • 24.
    Introduction to DataScience & Data Analysis Benefits and Uses of Data Science – Benefits -  Innovation and New Opportunities –  Data science may help companies innovate and spot new opportunities.  Data science is becoming a driving force behind innovation, allowing companies to find fresh perspectives and untapped potential. Additionally, data science can find new business prospects by examining competition data, market dynamics, and consumer behavior.  Better Healthcare Outcomes -  The healthcare sector could undergo a transformation because of data science.  Data scientists can gain insights to increase diagnosis precision, optimize treatment strategies, and improve patient care, eventually resulting in better healthcare outcomes, by analyzing patient data, medical records, and clinical studies.
  • 25.
    Introduction to DataScience & Data Analysis Benefits and Uses of Data Science – Uses -  Data science is used almost everywhere in both commercial and non- commercial environment.  Commercial companies in almost every industry use data science to gain insights into their customers, processes, staff, completion and products.  Many companies use data science to offer customers a better user experience, as well as to cross-sell, up-sell and personalize their offerings. Example – Google AdSense, MaxPoint  HR professionals use people analytics and text mining to screen candidates, monitor the mood of employees and study informal networks among coworkers.  Financial institutions use data science to predict stock markets, determine the risk of lending money and learn how to attract new clients for their services.
  • 26.
    Introduction to DataScience & Data Analysis Benefits and Uses of Data Science –  Many governmental organizations use data science to discover valuable information. Also they share their data with public so that we can use this data to gain insights or build data-driven applications.  Governmental organizations use data science to detect fraud and other criminal activity or optimizing project funding.  Nongovernmental organizations (NGO’s) use data science to raise money and defend their causes.  The World Wildlife Fund (WWF) use data science to increase the effectiveness of their fundraising efforts.  Universities use data science in their research but also to enhance the study experience of their students.
  • 27.
    Introduction to DataScience & Data Analysis Overview of Data Analytics –  What is Data Analytics? -  Data Analytics is the process of collecting, organizing and studying data to find useful information, understand what’s happening and make better decisions.  In simple words it helps people and businesses learn from data like what worked in the past, what is happening now and what might happen in the future.  Importance and Usage of Data Analytics –  Data analytics is used in many fields like banking, farming, shopping, government and more. It helps in many ways:  Helps in Decision Making: It gives clear facts and patterns from data which help people make smarter choices.
  • 28.
    Introduction to DataScience & Data Analysis Overview of Data Analytics –  Importance and Usage of Data Analytics –  It helps in many ways:  Helps in Problem Solving: It points out what's going wrong and why making it easier to fix problems.  Helps Identify Opportunities: It shows trends and new chances for growth that might not be obvious.  Improved Efficiency: It helps reduce waste, saves time and makes work smoother by finding better ways to do things.
  • 29.
    Introduction to DataScience & Data Analysis Overview of Data Analytics –  Process of Data Analytics –  Data analysts, data scientists and data engineers together create data pipelines which helps to set up the model and do further analysis.  Data Analytics can be done in the following steps:
  • 30.
    Introduction to DataScience & Data Analysis Overview of Data Analytics –  Process of Data Analytics –  Data Collection:  Data collection is the first step where raw information is gathered from different places like websites, apps, surveys or machines.  Sometimes data comes from many sources and needs to be joined together. Other times only a small useful part of the data is selected.  Data Cleaning:  Once the data is collected it usually contains mistakes like wrong entries, missing values or repeated rows.  In this step the data is cleaned to fix those problems and remove anything that isn’t needed.  Clean data makes the results more accurate and trustworthy.
  • 31.
    Introduction to DataScience & Data Analysis Overview of Data Analytics –  Process of Data Analytics –  Data Analysis and Data Interpretation:  After cleaning the data is studied using tools like Excel, Python, R or SQL.  Analysts look for patterns, trends or useful information that can help solve problems or answer questions.  The goal here is to understand what the data is telling us.  Data Visualization:  Data visualization is the process of creating visual representation of data using the plots, charts and graphs which helps to analyze the patterns, trends and get the valuable insights of the data.  By comparing the datasets and analyzing it data analysts find the useful data from the raw data.
  • 32.
    Introduction to DataScience & Data Analysis Overview of Data Analytics –  Types of Data Analytics –  There are different types of data analysis in which raw data is converted into valuable insights.  Some of the types of data analysis are mentioned below:  Descriptive Data Analytics (Identify Data)  Diagnostic Data Analytics (Investigate Data)  Predictive Data Analytics (Predict Future)  Prescriptive Data Analytics (Perform Actions)
  • 33.
    Introduction to DataScience & Data Analysis Overview of Data Analytics –  Types of Data Analytics –  Descriptive Data Analytics:  Descriptive data analytics helps to summarize & understand past data.  It shows what has happened by using tables, charts and averages.  Companies use it to compare results, find strengths and weaknesses and spot any unusual patterns.  Diagnostic Data Analytics:  Diagnostic data analytics looks at why something happened in the past.  It uses tools like correlation, regression or comparison to find the cause of a problem.  This helps companies understand the reason behind a drop in sales or a sudden change in performance.
  • 34.
    Introduction to DataScience & Data Analysis Overview of Data Analytics –  Types of Data Analytics –  Predictive Data Analytics:  It is used to guess what might happen in the future.  It looks at current and past data to find patterns and make forecasts.  Businesses use it to predict things like customer behavior, future sales or possible risks.  Prescriptive Data Analytics:  It helps to choose the best action or solution.  It looks at different options and suggests what should be done next.  Companies use it for things like loan approval, pricing decisions and managing machines or schedules.
  • 35.
    Introduction to DataScience & Data Analysis Nature of Data –  What is Data ? –  The data is a collection of facts, information, and statistics and this can be in various forms such as numbers, text, sound, images, or any other format.  According to the Oxford "Data is distinct pieces of information, usually formatted in a special way".  Data can be measured, collected, reported, and analyzed, whereupon it is often visualized using graphs, images, or other analysis tools.  Raw data ("unprocessed data") may be a collection of numbers or characters before it's been "cleaned" and corrected by researchers.  It must be corrected so that we can remove outliers or data entry errors.  Data processing commonly occurs in stages, & the "processed data" from one stage could also be considered the "raw data" of subsequent stages.
  • 36.
    Introduction to DataScience & Data Analysis Nature of Data – Facets of Data –  In data science there are many different types of data and each of them tends to require different tools and techniques.  The main categories of data are –  Structured  Unstructured  Natural Language  Machine Generated  Graph Based  Audio, Video and Images  Streaming
  • 37.
    Introduction to DataScience & Data Analysis Nature of Data – Facets of Data –  Structured Data –  It depends on a data model and resides in a fixed field within a record.  It’s often easy to store structured data in tables within databases or Excel files.  SQL (Structured Query Language) is the preferred way to manage and query data that resides in database.  Unstructured Data –  It is a data that is not easy to fit into a data model because the content is content-specific or varying.  Example – Email  The structure is not fix and data is not organized.
  • 38.
    Introduction to DataScience & Data Analysis Nature of Data – Facets of Data –  Structured Data vs Unstructured Data –  Structured data is standardized, clearly defined, and searchable data, while unstructured data is usually stored in its native format.  Structured data is quantitative, while unstructured data is qualitative.  Structured data is often stored in data warehouses, while unstructured data is stored in data lakes  Structured data is easy to search and analyze, while unstructured data requires more work to process and understand.  Structured data exists in predefined formats, while unstructured data is in a variety of formats.
  • 39.
    Introduction to DataScience & Data Analysis Facets of Data –  Structured Data vs Unstructured Data – Structured Data Unstructured Data Data that is organized and formatted in a specific way, following a predefined model or schema. Data that lacks a specific structure or format and is typically unorganized or in raw form. Well-organized with a defined format, such as tables and columns. Lacks a predefined format and is unorganized. Highly accessible and can be easily retrieved using structured query language (SQL) or other database tools. Less accessible and requires advanced techniques for extraction and analysis. Easily analyzed using traditional statistical methods and data mining techniques. Requires advanced techniques like natural language processing (NLP) and machine learning for analysis. Limited scalability due to predefined schemas and fixed data structures. Highly scalable and can accommodate any type of data without altering the existing structure. Customer information, transaction records, inventory lists, financial data. Emails, social media posts, multimedia files, sensor data.
  • 40.
    Introduction to DataScience & Data Analysis Nature of Data – Facets of Data –  Natural Language –  It is a special type of unstructured data.  It’s challenging to process because it requires knowledge of specific data science techniques and linguistics.  The natural language processing community had success in entity recognition, topic recognition, summarization, text completion and sentiment analysis but models trained in one domain don’t generalize well to other domains.  It’s ambiguous by nature. The meaning of same words can vary when coming from someone upset or joyous.  Example – Handwritten letter
  • 41.
    Introduction to DataScience & Data Analysis Nature of Data – Facets of Data –  Machine Generated Data –  It is an information that is automatically created by a computer, process, application or other machine without human intervention.  Machine generated data is becoming a major data resource and will continue to do so.  The analysis of machine data relies on highly scalable tools, due to its high volume and speed.  Example – Web server logs, call detail records
  • 42.
    Introduction to DataScience & Data Analysis Nature of Data – Facets of Data –  Graph based or network Data –  Graph based or network data is a data that focuses on the relationship or adjacency of objects.  The graph structures use nodes, edges and properties to represent and store graphical data.  Graph based data is a natural way to represent social networks and its structure allows to calculate specific metrics such as the influence of a person and the shortest path between two people.  Example - Linkedin
  • 43.
    Introduction to DataScience & Data Analysis Nature of Data – Facets of Data –  Audio, Video and Image –  These types of data are creating specific challenges to data scientist.  Tasks that are trivial for humans turn out to be challenging for computers.  Recently a company called DeepMind succeeded at creating algorithm that is capable of learning how to play video games.  This algorithm takes a video screen as input and learns to interpret everything via a complex process of deep learning.  The learning algorithm takes in data as its produced by the computer game.
  • 44.
    Introduction to DataScience & Data Analysis Nature of Data – Facets of Data –  Streaming Data –  Streaming data can take almost any of the previous forms, it has an extra property.  The data flows into the system when an event happens instead of being loaded into a data store in a batch.  Example – “What’s trending” on Twitter
  • 45.
    Introduction to DataScience & Data Analysis Nature of Data – What is Information? –  Information is data that has been processed, organized, or structured in a way that makes it meaningful, valuable, and useful.  It is data that has been given context, relevance, and purpose.  It gives knowledge, understanding, and insights that can be used for decision- making, problem-solving, communication, and various other purposes. Why Data is Important? –  Data helps in making better decisions.  Data helps in solving problems by finding the reason for underperformance.  Data helps one to evaluate performance.  Data helps one improve processes.  Data helps one understand consumers and the market.
  • 46.
    Introduction to DataScience & Data Analysis Nature of Data – Types of Data –  Generally, data can be classified into following types:  Categorical Data: In categorical data, the data that have a defined category, for example – Eye color, Gender, Marital Status  Numerical Data: Numerical data can further be classified into two categories:  Discrete Data: Discrete data contains the data which have discrete numerical values for example Number of Children, Defects per Hour, etc.  Continuous Data: Continuous data contains the data that have continuous numerical values for example Weight, Voltage etc.
  • 47.
    Introduction to DataScience & Data Analysis Nature of Data – Types of Data –  Generally, data can be classified into following types:  Nominal Scale: A nominal scale classifies data into several distinct categories in which no ranking criteria are implied. For example Gender, Marital Status.  Ordinary Scale: An ordinal scale classifies data into distinct categories during which ranking is implied. For example: Faculty rank (Professor, Associate Professor, Assistant Professor), Students grade(O, A, B, C, D).
  • 48.
    Introduction to DataScience & Data Analysis Nature of Data –  What is the Data Processing Cycle? -  The data processing cycle refers to the iterative sequence of transformations applied to raw data to generate meaningful insights.  It can be viewed as a pipeline with distinct stages:  Data Acquisition:  This stage encompasses the methods used to collect raw data from various sources.  This could involve sensor readings, scraping web data, or gathering information through surveys and application logs.  Data Preparation:  Raw data is inherently messy and requires cleaning and pre- processing before analysis.
  • 49.
    Introduction to DataScience & Data Analysis Nature of Data –  What is the Data Processing Cycle? -  It can be viewed as a pipeline with distinct stages:  Data Preparation:  This stage involves tasks like identifying and handling missing values, correcting inconsistencies, formatting data into a consistent structure, and potentially removing outliers.  Data Input:  The pre-processed data is loaded into a system suitable for further processing and analysis.  This often involves converting the data into a machine-readable format and storing it in a database or data warehouse.
  • 50.
    Introduction to DataScience & Data Analysis Nature of Data –  What is the Data Processing Cycle? -  It can be viewed as a pipeline with distinct stages:  Data Processing:  Here, data undergoes various manipulations and transformations to extract valuable information.  This may include aggregation, filtering, sorting, feature engineering (creating new features from existing ones), and applying machine learning algorithms to uncover patterns and relationships.  Data Output:  The transformed data is then analyzed using various techniques to generate insights and knowledge.  This could involve statistical analysis, visualization techniques, or building predictive models.
  • 51.
    Introduction to DataScience & Data Analysis Nature of Data –  What is the Data Processing Cycle? -  It can be viewed as a pipeline with distinct stages:  Data Storage:  The processed data and the generated outputs are stored in a secure and accessible format for future use, reference, or feeding into further analysis cycles.  The data processing cycle is iterative, meaning the output from one stage can become the input for another.  This allows for continuous refinement, deeper analysis, and the creation of increasingly sophisticated insights from the raw data.
  • 52.
    Introduction to DataScience & Data Analysis Classification of Data –  To make the analysis meaningful and easy, the raw data is converted or classified into different categories based on their characteristics.  The grouping of data into different categories or classes with similar or homogeneous characteristics is known as the Classification of Data.  Each division or class of the gathered data is known as a Class.  The different basis of classification of statistical information are Geographical, Chronological, Qualitative (Simple and Manifold) and Quantitative or Numerical.  For example, if an investigator wants to determine the poverty level of a state, he/she can do so by gathering the information of people of that state, and then classifying them on the basis of their income, education, etc.
  • 53.
    Introduction to DataScience & Data Analysis Classification of Data –  Objectives of Classification of Data -  Brief and Simple -  Raw data gathered by the investigator cannot provide him/her with meaningful and effective results.  Therefore it is essential to convert the raw material into different categories for which classification of data is used.  The basic motive of the classification of data is to present the raw data collected by the investigator or analyst into different categories in a way that is brief and simple.  Proper classification of data makes the data analysis more convenient.
  • 54.
    Introduction to DataScience & Data Analysis Classification of Data –  Objectives of Classification of Data -  Utility -  For the purpose of investigation, an analyst collects information from different sources and then classifies the data into different categories.  Classification of data distinguishes the collected diverse set of data by bringing out similar or homogeneous information together, thus enhancing its utility.  Distinctiveness –  It is not easy to form results from raw data gathered in one place in a heterogeneous manner.  Therefore, it is essential to classify the given data into different categories.
  • 55.
    Introduction to DataScience & Data Analysis Classification of Data –  Objectives of Classification of Data -  Distinctiveness –  Classification of data aims at providing the analyst with obvious differences in the given set of data more distinctly.  Comparability –  It is not possible to compare two sets of data in raw form.  Classification of data helps an investigator in comparing the given two sets of data and estimating results.  For example, if we say the number of firms producing laptops in different locations of Kerala and Punjab is 30 and 25, respectively. It is easier to compare this information instead of raw data consisting of the names of every industry in Kerala and Punjab producing different goods.
  • 56.
    Introduction to DataScience & Data Analysis Classification of Data –  Objectives of Classification of Data -  Scientific Arrangement –  Classification of the raw data according to their similar characteristics helps in facilitating the proper arrangement of the collected data in a scientific manner.  The scientific arrangement of data increases the reliability of data.  Attractive and Effective –  Classification makes the collected raw data effective and attractive.  A lot can be understood just by looking at the data if it is properly presented and classified.
  • 57.
    Introduction to DataScience & Data Analysis Uses of Data Analytics –  Data is of much importance nowadays. Data helps to understand the performance by providing the clarity needed for better results.  Data helps to improve processes which reduce wasted money and time and also understand consumers well.  Data in business:  In Data Analytics there are many advantages of data, but without proper data analytics tools and processes, we can't access these benefits.  Raw data is also very important and we need data analytics to unlock the potential of raw data and converted into useful information for the business.  Example - Record of the potential customer, records of customers like name, address.
  • 58.
    Introduction to DataScience & Data Analysis Uses of Data Analytics –  Data in healthcare :  Data is extremely useful in the field of medical and healthcare.  Most of the medical devices are big data-oriented.  The data has gone to such an extent that in healthcare sector each record or we can say data is very essential where doctors can check person through the heart and temperature monitoring watch which is critical information of any patients and kept to be as data fitted on patient's hand and prescribe him with related medicines.  Example - Patient records like name, address, contact no. etc., treatment records, Records of Doctor's profile are the examples in healthcare.
  • 59.
    Introduction to DataScience & Data Analysis Uses of Data Analytics –  Data in media and entertainment :  The business model runs on collecting and creating the content, further analyzing it, then marketing and distribution of the content.  We can run through customer's data along with observable data and gather information to create a customer's detailed profile.  The benefits of big data in the media and entertainment industry include forecasting what the target audience wants, planning, optimization, expanding acquisition, and retention suggest content on-demand & new.  Example - Records of the team, the time duration of media project, location, etc.
  • 60.
    Introduction to DataScience & Data Analysis Uses of Data Analytics –  Data in transportation :  Data in transportation is very crucial.  For proper communication and for proper synchronization of transport medium we need data and to analyze the information we need data analytics.  Data potential is to analyze how many passengers traveled from any source to destination and with the help of data analytics it can be processed in real-time for the smooth functioning of transportation.  Example - feedback of customer, transport time, source and destination records, customer traveled history, etc.
  • 61.
    Introduction to DataScience & Data Analysis Uses of Data Analytics –  Data in banking :  Banking is a very crucial sector. Data here is very beneficial and helps in fraud detection in the banking system.  Using big data, we can search for all the illegal activities that have taken place and can identify the misuse of credit and debit cards, business precision.  Example - Employee records, Bank name address, and branch name, customer account records, transaction history, etc.
  • 62.
    Introduction to DataScience & Data Analysis Data Science Process –  The typical data science process consists of six steps –  Setting the research goal  Retrieving data  Data Preparation  Data Exploration  Data Modeling  Presentation and automation
  • 63.
    Introduction to DataScience & Data Analysis Data Science Process –  The first step of the process is setting a research goal. The main purpose here is making sure all the stakeholders understand what, how and why of the project. This will result in project charter.  The second phase is data retrieval. We want to have data available for analysis, so this step includes finding suitable data and getting access to the data from the data owner. The result is data in its raw form, which probably needs polishing and transformation before it becomes usable.  Now we have the raw data, its time to prepare it. This includes transforming the data from a raw form into data that’s directly usable in models. To achieve this, detect and correct different kinds of errors in the data, combine data from different sources, and transform it. After successful completion of this step, we can progress to data visualization and modeling.  The fourth step is data exploration. The goal is to gain deep understanding of the data. Look for patterns, correlations, and deviations based on visual and descriptive techniques. The insights from this phase enable us to start modeling.
  • 64.
    Introduction to DataScience & Data Analysis Data Science Process –  The next step is model building or data modeling. In this, attempt to gain the insights or make the predictions stated in project charter earlier. Often a combination of simple models tends to outperform one complicated model.  The last step is presenting results and automating the analysis, if needed. One goal of project is to change a process and/or make better decisions. The importance of this step is more apparent in projects on a strategic and tactical level. Certain projects require to perform the business process over and over again, so automating the project will save time.