Downloaded 280 times

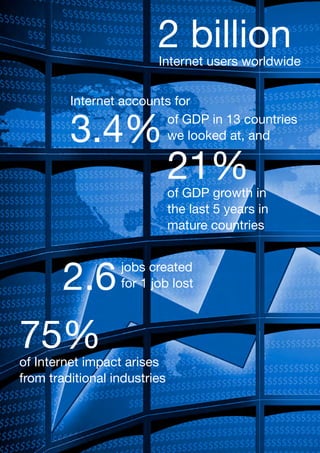


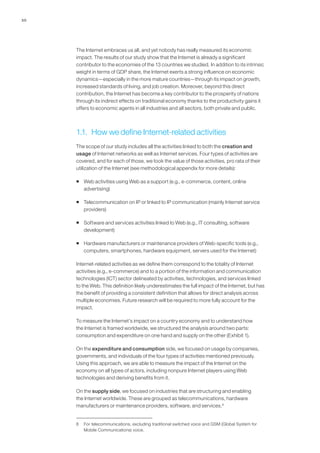
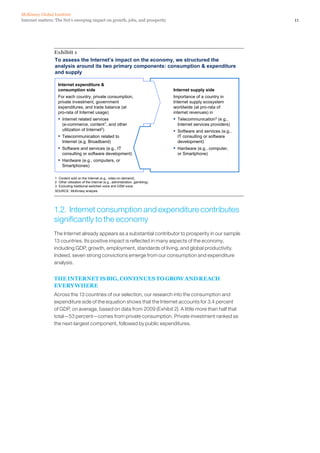
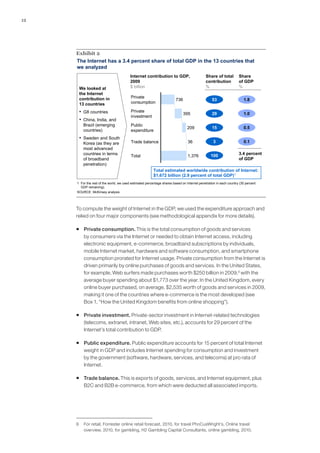
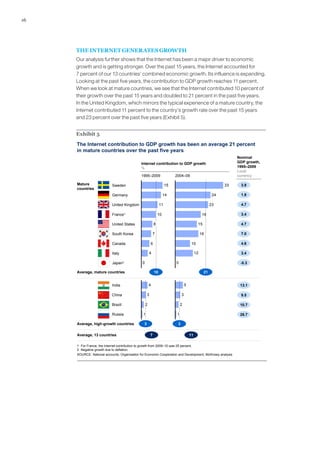

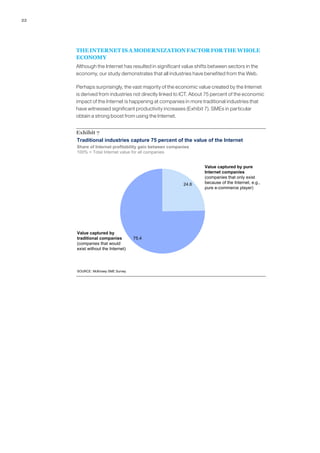

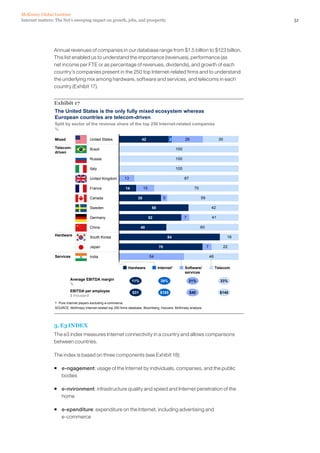


The Internet contributes significantly to economic growth and wealth creation. It accounts for 3.4% of GDP in 13 major countries studied, and was responsible for 21% of GDP growth in mature economies over the past 5 years. The Internet creates jobs, with 2.6 jobs created for every job lost. 75% of the Internet's economic impact comes from increased productivity in traditional industries. Public and private stakeholders should focus on expanding access, boosting supply ecosystem, skills development, and data policies to fully realize the Internet's potential.


![[McKinsey] Disruptive technologies: Advances that will transform life, busine...](https://cdn.slidesharecdn.com/ss_thumbnails/mgidisruptivetechnologiesfullreportmay2013-130523153109-phpapp02-thumbnail.jpg?width=640&height=640&fit=bounds)


